Article

Dynamic Monitoring of Steel Beam Stress Based on PMN-PT Sensor

1
No. Three Engineering Co., Ltd. of CCCC First Highway Engineering Co., Ltd., Beijing 101102, China
2
Chongqing Wanzhou Economic and Technological Development Zone Construction and Development Co., Ltd., Chongqing 404157, China
3
Department of Civil and Transportation Engineering, Hohai University, Nanjing 210098, China
4
School of Civil Engineering, Chongqing Jiaotong University, Chongqing 400074, China
*
Author to whom correspondence should be addressed.
Buildings 2024, 14(9), 2831; https://doi.org/10.3390/buildings14092831
Submission received: 19 July 2024 / Revised: 28 August 2024 / Accepted: 4 September 2024 / Published: 9 September 2024
(This article belongs to the Special Issue Engineering Mathematics in Structural Control and Monitoring)

Abstract

:
Steel beams are widely used load-bearing components in bridge construction. They are prone to internal stress concentration under low-frequency vibrations caused by natural disasters and adverse loads, leading to microcracks and fractures, thereby accelerating the instability of steel components. Therefore, dynamic stress monitoring of steel beams under low-frequency vibrations is crucial to ensure structural safety. This study proposed an external stress sensor based on PMN-PT material. The sensor has the advantages of high sensitivity, comprehensive frequency response, and fast response speed. To verify the accuracy and feasibility of the sensor in actual engineering, the LETRY universal testing machine and drop hammer impact system were used to carry out stress monitoring tests and finite element simulations on scaled I-shaped steel beams with PMN-PT sensors attached. The results show that: (1) The PMN-PT sensor has exceptionally high sensitivity, maintained at 1.716~1.726 V/MPa in the frequency range of 0~1000 Hz. The sensor performance is much higher than that of PVDF sensors with the same adhesive layer thickness. (2) Under low-frequency random vibration, the sensor’s time domain and frequency domain output voltages are always consistent with the waveform of the applied load, which can reflect the changes in the structural stress state in real time. (3) Under the impact of a drop hammer, the sensor signal response delay is only 0.001 s, and the sensitivity linear fitting degree is above 0.9. (4) The simulation and experimental results are highly consistent, confirming the superior performance of the PMN-PT sensor, which can be effectively used for stress monitoring of steel structures in low-frequency vibration environments.

1. Introduction

Steel structures, characterized by their lightweight, rapid assembly, and high reliability, play a significant role in modern bridge construction. However, under prolonged exposure to various low-frequency vibration loads in real-world engineering applications, the instability of these loads can lead to energy accumulation and complex stress distributions within the structure, ultimately causing damage [1,2]. Therefore, given the instability of the loads, there is an urgent need to conduct health monitoring of steel structures under different vibration environments [3,4,5].
At present, the most commonly employed techniques in the field of steel structure health monitoring (SHM) include acoustic emission technology [6], infrared imaging technology [7,8], resistance strain gauge [9], electromagnetic sensor [10], optical fiber sensor [11,12], and so on. Acoustic emission and infrared imaging technology are both traditional non-destructive testing technologies that are widely used in this field. Acoustic emission testing typically necessitates that inspectors possess a certain level of expertise and experience. The requisite equipment occupies a considerable space, the processing system is more complex, and the data processing and analysis are extremely time-consuming. It is not feasible to guarantee real-time performance under long-distance and long-term monitoring [13,14,15]. Infrared thermal imaging technology is a non-invasive technology that is convenient for comparative analysis of different positions of the structure. However, the cost of infrared technology equipment is typically high, and the measurement accuracy is not as precise as that of contact measurement [7,16].
Strain gauges, due to their low cost, high sensitivity, and ease of installation, are widely used for stress and strain monitoring in structures, effectively detecting and locating cracks and other damages [17,18,19]. However, resistance strain gauges, typically made from brittle materials, are susceptible to mechanical damage, and their resistance values can be influenced by external environmental factors such as temperature, leading to measurement interference [20].
Electromagnetic sensors are employed in structural deformation and vibration energy monitoring due to their high sensitivity, fast response, and high accuracy. Michaela [21] developed an embedded electromagnetic sensor for crack detection in reinforced concrete beams, demonstrating a linear relationship between crack width and electromagnetic response within a specific frequency range. However, this technology requires complex media for signal transmission and has a limited frequency response range. Fiber optic sensors, made from low-energy-loss, electromagnetic-interference-resistant, and high-temperature-resistant optical fibers, enable effective long-distance signal transmission, significantly increasing the distance between measurement points [22,23]. Many experts have researched fiber optic sensors; for example, António [24] embedded fiber optic sensors in concrete beams for three-point load tests, assessing their reliability and accuracy under real-world loading conditions. Oliver [25] used different fiber materials to detect elastic strain and crack formation in prestressed concrete beams, showing high applicability for early shear crack detection. However, fiber optic sensors face complex manufacturing processes and complicated signal processing, leading to higher operational costs.
Compared to other sensors, piezoelectric sensors combine sensing and actuation capabilities, offering high sensitivity, ease of use, low cost, rapid response, and real-time structural damage monitoring. They are widely employed in advanced sensing technology development, particularly in the health monitoring of actual engineering structures. Currently, the most commonly used piezoelectric materials include PZT piezoelectric ceramics and PVDF piezoelectric films. Wang [26] proposed a novel damage index based on PZT sensors, utilizing the measured values of electromagnetic admittance in I-beam structures to assess damage severity. This method enables qualitative analysis of damage across different frequency ranges in I-beams. Qiao et al. [27] employed PZT-based electromechanical methods to study the changes in coupled impedance between PZT and steel beams during crack initiation and propagation, facilitating the identification of crack damage severity in steel beams. Du [28] embedded piezoelectric ceramic smart aggregates into steel-tube columns filled with quartz sand to monitor internal stress during impact. Their findings indicated an excellent linear relationship between the voltage output of the piezoelectric ceramic smart aggregates and external forces, demonstrating high feasibility. While PZT sensors in these studies can partially achieve structural health monitoring, they suffer from low energy conversion efficiency, susceptibility to external environmental factors, and inconvenience in measuring curved components [29]. These limitations affect the accuracy and stability of the output signals. Miroslav Mrlík et al. [30] tested the vibration-sensing capabilities of PVDF films, finding that thinner films exhibit higher sensitivity. S Fotouhi et al. [31] utilized the flexibility of PVDF materials to affix PVDF sensors to low-carbon steel for cyclic tensile tests under varying load levels. The results showed a linear relationship between the sensor output signals and the applied loads, effectively enabling structural health monitoring for dynamic load conditions.
Currently, PMN-PT materials, characterized by high piezoelectric coefficients, large electromechanical coupling factors, high dielectric constants, and low losses, are widely used in various fields such as mechanics, aviation, medical motion sensing, and transducers due to their superior electromechanical coupling coefficients, lower dielectric losses, and faster response speeds [32,33]. Lv et al. [34] proposed a flexible piezoelectric inorganic film doped with PMN-PT, tested for energy harvesting capabilities, temperature resistance, and hydrophobicity, suitable for body motion monitoring and finger action recording as a tactile sensor. PMN-PT demonstrates over ten times the piezoelectric performance of conventional ceramics. However, its application in civil engineering needs to be more thoroughly researched. Consequently, further studies are essential to assess the feasibility of PMN-PT sensors in structural stress monitoring and evaluate their potential in this field.
In this study, an external sensor is designed using piezoelectric single crystal (PMN-PT) to monitor the stress state of steel beams under low-frequency load. The sensor has the characteristics of high sensitivity, comprehensive frequency response, fast response speed, and good electromechanical coupling performance [35]. Subsequently, the performance characterization of the sensor and the stress monitoring test under random vibration load and impact load were carried out on the scale-I-shaped steel beam bonded with the PMN-PT sensor. At the same time, combined with the COMSOL finite element simulation results, the feasibility and accuracy of the sensor for the health monitoring of steel members were compared and verified. The full text structure framework is shown in Figure 1.

2. Sensing Mechanism of Piezoelectric Materials

Based on the characteristics of piezoelectric sensors, combined with mechanical and electrical principles, this paper studies the identification and perception level of internal stress of I-steel beams under random vibration and impact load. According to the positive piezoelectric effect, the working mechanism of piezoelectric sensors for structural stress monitoring and identification can be described by the first kind of piezoelectric equation [36], in which the sensing element is polarized along the thickness direction (3 directions in Figure 2).
ε x = c 11 σ x + d 33 E z D z = d 33 σ x + μ 33 E z
In the formula, c 11 , d 33 , μ 33 represent the flexibility coefficient, piezoelectric constant and dielectric coefficient of the sensor, respectively. Dz is the electric displacement, Ez is the electric field strength, and σ x , ε x are the average axial stress and average axial strain of the piezoelectric sensor, respectively.
In the absence of an external electric field, the amount of charge generated by the piezoelectric sensor per unit area is given by the following equation:
D z = d 33 σ x = d 33 E p ε x
In the formula, Ep represents the elastic modulus of the piezoelectric sensor. The unit charge is integrated into the surface area Ae of the piezoelectric sensor, and the amount of charge generated on the surface of the piezoelectric sensor is:
Q z = A z D z d x d y = D z A e = d 33 E p ε x A e
The output voltage of the upper and lower plates of the piezoelectric sensor is as follows:
V o u t = Q z C p = d 33 E p ε x A e C p
In the formula, Cp represents the capacitance between the upper and lower plates of the piezoelectric sensor. According to the first kind of piezoelectric equation, the structural stress under different load modes can be calculated by utilizing the output voltage value of the sensor. This enables the stress monitoring inside the steel beam structure under different loads to be achieved.

3. Sensor Preparation and Performance Characterization

This study presents a new type of external piezoelectric sensor for surface stress monitoring of I-steel beam structures. The sensor is based on PMN-PT material and is capable of transforming mechanical energy into electric energy, responding to changes in the external environment in real-time, and reflecting the stress or strain state of the structure at the sensor position. This enables the evaluation of the health state of the actual engineering structure under external action. In order to ascertain the level of mechanical energy and electrical energy conversion exhibited by the PMN-PT sensor, this section has conducted characterization tests on the sensor’s related performance, including a sensitivity test and a frequency response range calibration test.

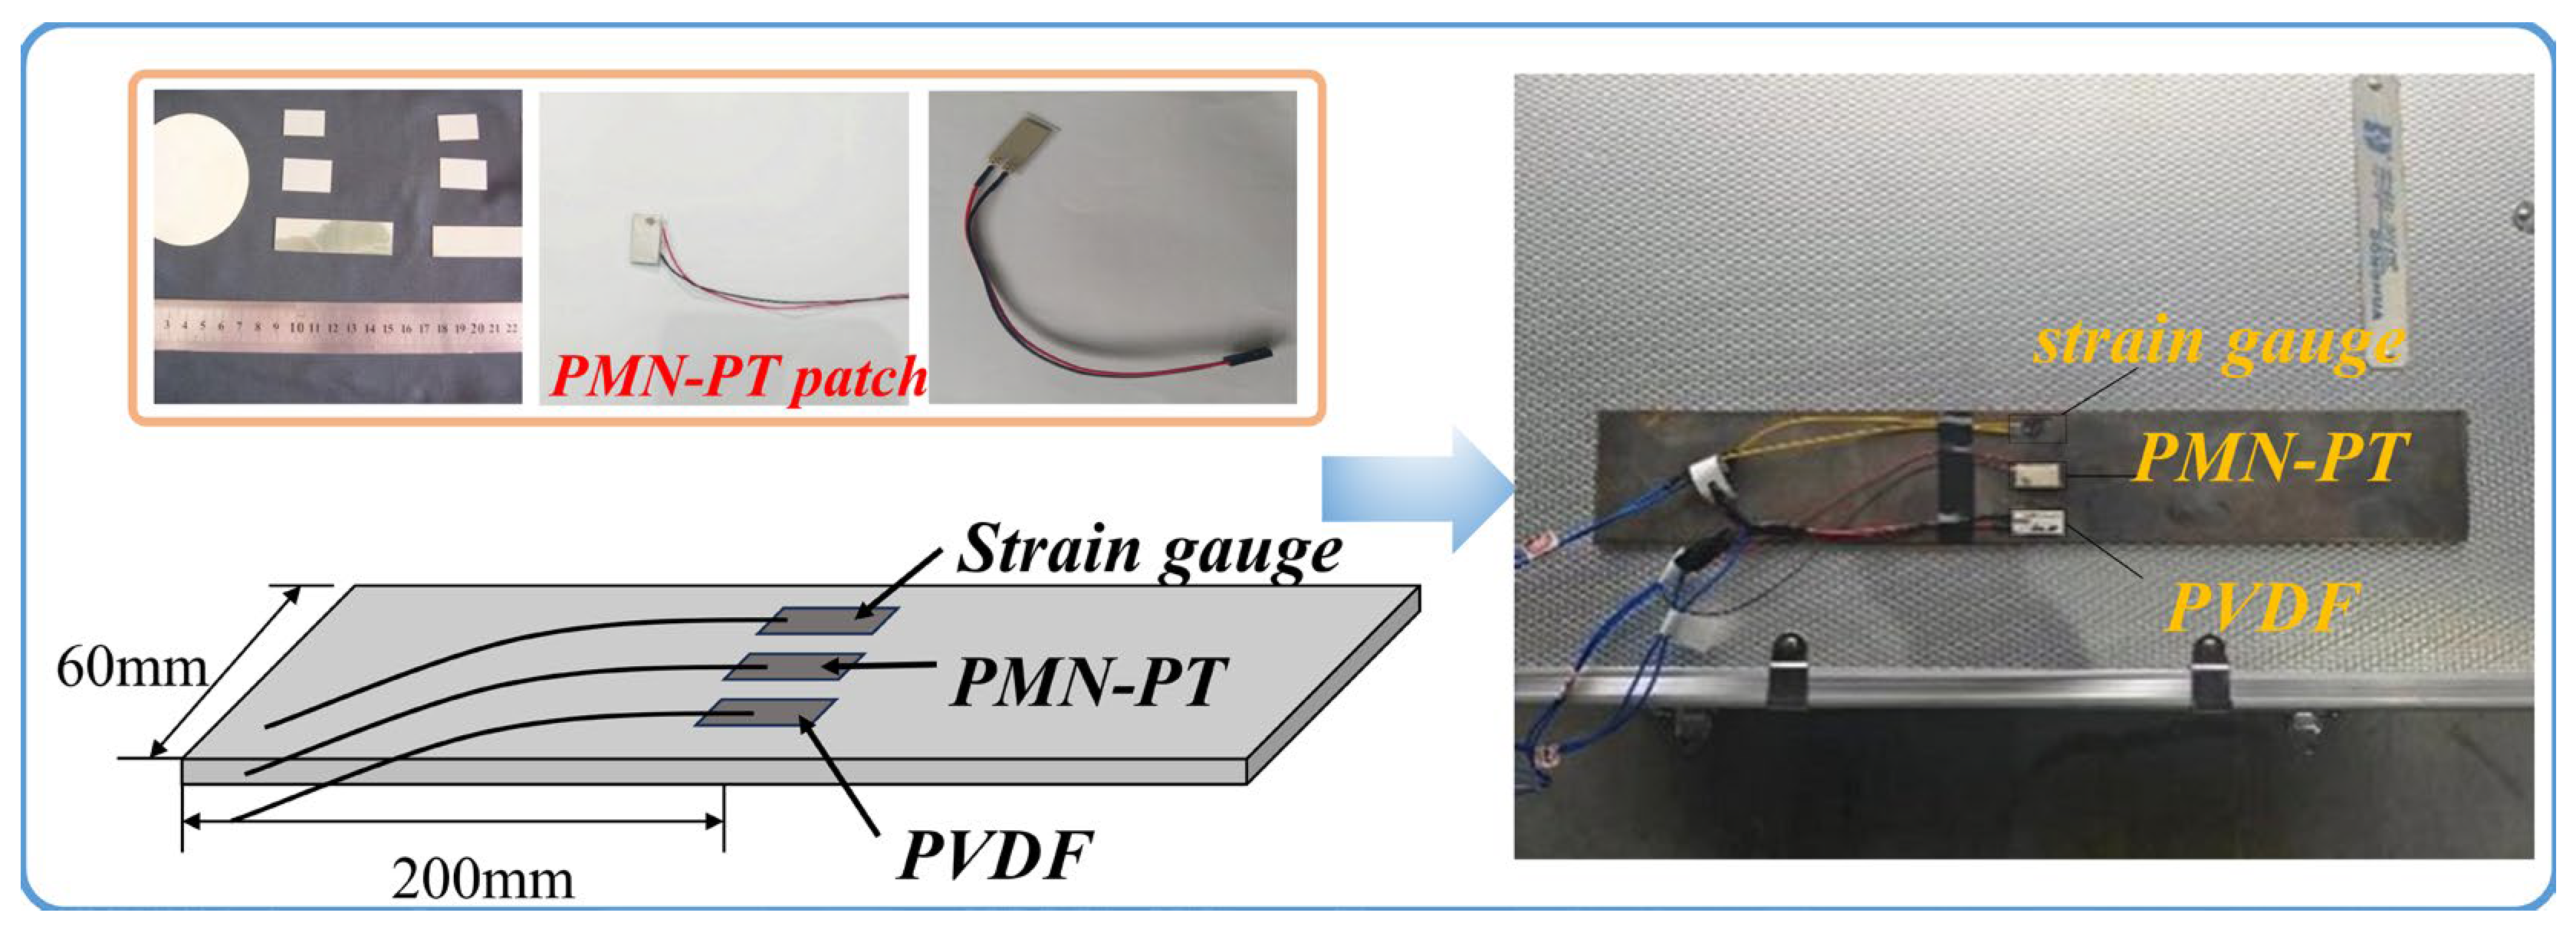
3.1. Characterization Test Component Preparation

The test component utilizes a fixed steel plate with dimensions of 400 mm × 60 mm × 3 mm at both ends. The piezoelectric-sensitive element of the PMN-PT sensor is the 001-cut lead magnesium niobate-lead titanate (PMN-PT) material developed by the research group. The specific size is 20 mm × 10 mm × 0.5 mm. The piezoelectric single crystal wafer is plated with silver and pasted with a wire. Following completion of the welding process, a regular epoxy resin protective layer is applied to the upper and lower electrode surfaces to prevent the wire from disconnecting in practical applications. The PMN-PT sensor is prepared by allowing it to stand for 24 h at room temperature. The resistance strain gauge, PMN-PT sensor, and PVDF sensor are affixed to the surface of the steel plate at equal distances, as illustrated in Figure 3. The HK-9209 charge amplifier and DH-5922D data acquisition instrument are connected to the wire of the sensor to collect the voltage signal during the test.

3.2. Sensitivity Test

The sensitivity of a piezoelectric sensor is defined as the ratio of the output voltage change value to the corresponding stress change value. This parameter is crucial for evaluating the performance of the sensor. Its mathematical expression is:
k = Δ V / Δ T
In the formula, k represents the sensitivity coefficient, while V, T represents voltage (v) and time (s), respectively.
In order to ascertain the sensitivity performance level of the sensor, a sensitivity calibration test was conducted. The MTS function generator was employed to apply a fixed frequency sine wave load. The MTS universal testing machine was equipped with a built-in force sensor. The sensitivity index of the sensor was determined by fitting the stress–strain data obtained from feedback with the output voltage of the PMN-PT sensor. The test-loading device is depicted in Figure 4.
A steel beam is preloaded with a duration of 2 s and an amplitude of 0.5 kN in order to eliminate the test error caused by the gap of the test piece. After the end, a sinusoidal load with an amplitude of 0.5 kN and a frequency of 2 Hz is applied. The duration is 8 s, and the data are collected by the DH-5922D data acquisition instrument. Figure 5 illustrates the sensor voltage time history curve. Due to the limitations of metal strain gauges in terms of dynamic monitoring, the output continuous electrical signals are relatively weak and lack effective reference.
In the pre-loading stage, the voltage signal of the PMN-PT sensor undergoes a sudden and abrupt change at the initial stage of loading. It rises rapidly from 0 V to 0.32 V in approximately 0.06 s, before decreasing rapidly to 0 V. This phenomenon is attributed to the charge leakage caused by the insufficient impedance of the measurement circuit. As a result, the sensor is unable to produce an effective signal response, which in turn leads to a reduction in performance in static loading [37]. In the formal loading stage, the voltage response curve of the PMN-PT piezoelectric sensor is a standard sine wave in the amplitude range of 0.011 V to 0.65 V, which is consistent with the periodic change of the structural stress curve and exhibits no phase difference. In comparison with the voltage response curves of the PVDF material, the voltage response curves of the two sensors exhibit a similar change trend. It is evident that the PMN-PT sensor exhibits a higher voltage output peak. This is attributed to the higher piezoelectric constant and superior response effect of the PMN-PT material. The piezoelectric sensor demonstrates enhanced accuracy and voltage output peak value during the dynamic loading process, enabling precise detection of stress changes within the structure and superior dynamic monitoring performance.
As illustrated in Figure 6, the structural stress of the piezoelectric sensor and the output voltage signal of the corresponding piezoelectric sensor are subjected to a linear fit. The outcomes demonstrate that during the dynamic loading process, the output voltage values of the two sensors exhibit a high degree of linear correlation with the structural stress values. Concurrently, when the thickness of the adhesive layer is 0.5 mm, the sensitivity of the PMN-PT piezoelectric sensor is 1.721 V/MPa, with an R2 of 0.975 following linear fitting. The sensitivity of the PMN-PT sensor is 0.084 V/MPa, with an R2 of 0.965. It is evident that the sensitivity of the PMN-PT sensor is considerably higher than that of the PVDF sensor. This indicates that the PMN-PT sensor exhibits a faster response speed and a more stable output signal under the same load environment. Furthermore, the piezoelectric response performance of the PMN-PT sensor is markedly superior to that of the PVDF sensor, rendering it a more suitable choice for structural dynamic monitoring.

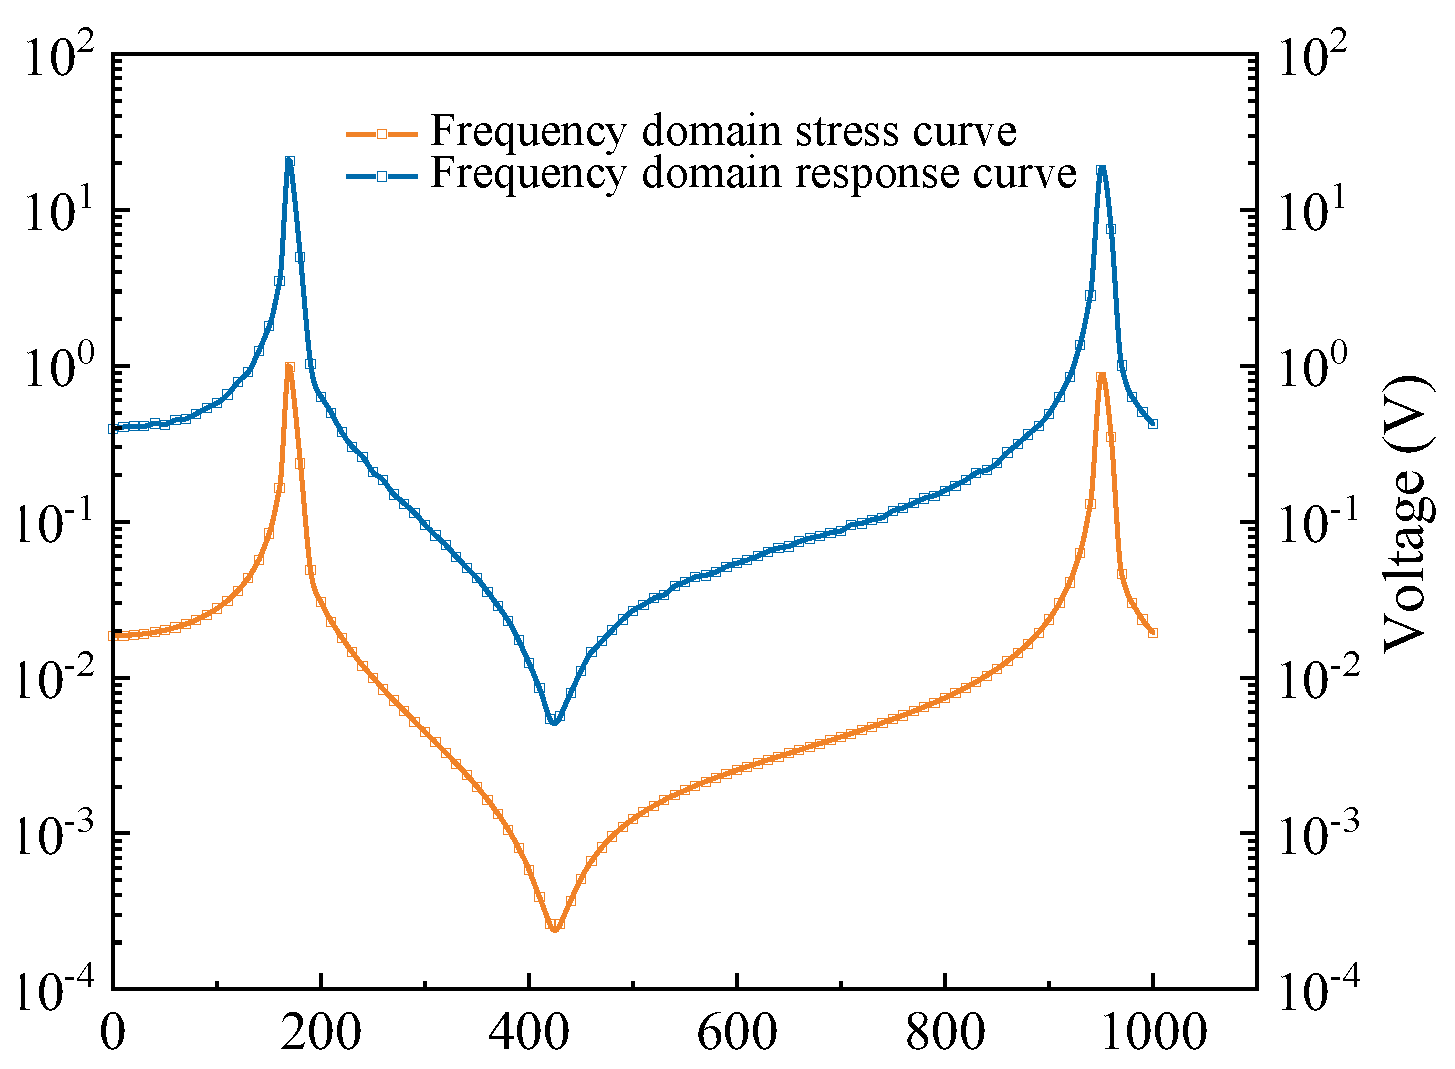
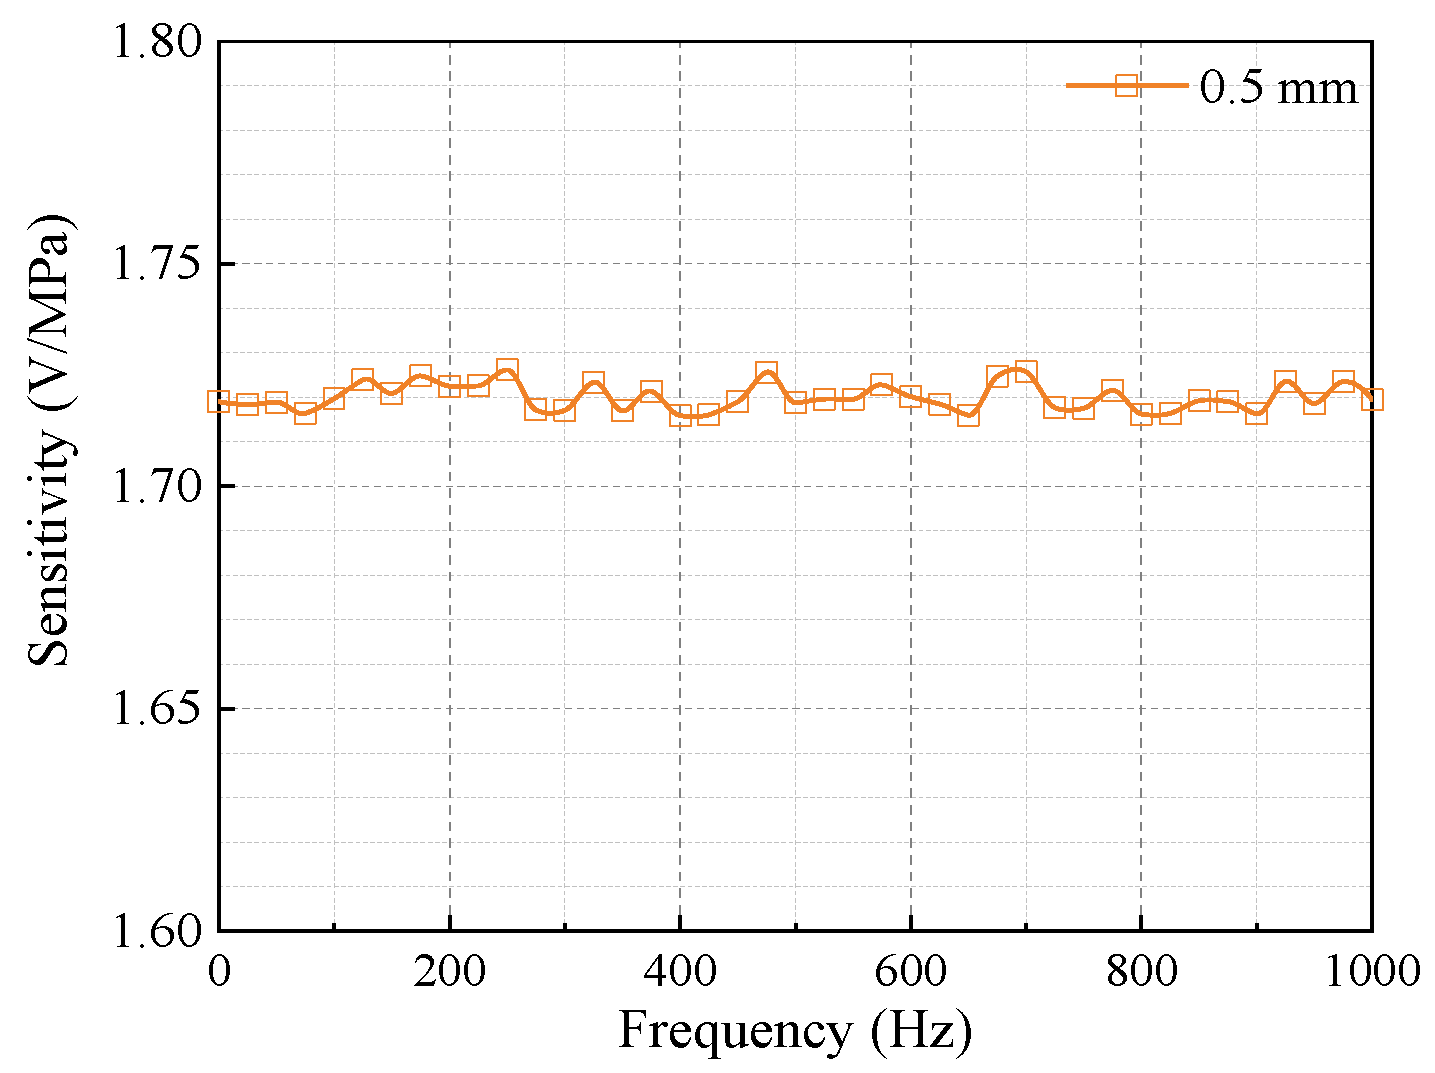
3.3. Frequency Response Range Calibration

The frequency response range of the sensor refers to the frequency range in which no phase difference is generated, and the sensitivity remains stable. The larger the frequency response range is, the wider the application environment of the sensor is, and the smaller the error is. In order to explore the stability of the PMN-PT sensor during use, a calibration test is performed for its frequency response range. In this experiment, a sweep frequency load with a frequency range of 0 Hz to 1000 Hz was applied to the mid-span position of the fixed steel plate at both ends of the PMN-PT sensor in order to simulate the low-frequency load environment of the actual project. The correlation curve and parameter changes were recorded, and the working range of the sensor was determined.
In this experiment, the steel beam member is preloaded with an amplitude of 0.3 kN and a duration of 2 s in order to eliminate the test error caused by the gap between the members. Once the beam has stabilized, a sinusoidal wave load with an amplitude of 0.5 kN is applied and the duration is 10 s. The frequency domain response curve of the voltage output signal is depicted in Figure 7. It is evident that the stress curve is in alignment with the frequency domain response curve throughout the test. In the low-frequency region, as the frequency increases from 0 Hz to 170 Hz, the sensor voltage output signal rises from 0.018 V to a maximum value of 0.981 V at 170 Hz, which is also the peak voltage of the piezoelectric sensor. As the frequency increases from 170 Hz to 340 Hz, the voltage exhibits a downward trend, reaching a minimum value of 2.61 × 10⁻⁴ V at approximately 340 Hz. In the frequency range of 340 Hz to 950 Hz, the voltage signal exhibits a second peak of 0.849 V, following a climb from 2.61 × 10⁻⁴ V. In the frequency range of 950 Hz to 1000 Hz, the voltage signal is continuously attenuated to 0.019 V, and the curve generally exhibits an up-down-up-down trend. In the process of sweeping frequency loading, the output signal value of the sensor exhibits a strong linear relationship with the stress value. This indicates that the sensor has good performance and is capable of generating accurate electrical signal responses in response to changes in stress, reflecting the internal stress state of the structure. Concomitantly, the fluctuation of the electrical signal response in the low-frequency region of the PMN-PT sensor is markedly greater than that in the high-frequency region. This indicates that the PMN-PT sensor is more susceptible to frequency change in the low-frequency region, which is consistent with the characteristics of the piezoelectric material suitable for high-frequency measurement.
In practical structural health monitoring applications, the performance level of the sensor is determined to a greater extent by the stability of its sensitivity. In order to explore the stability of the PMN-PT sensor in different vibration frequency environments, the structural stress and output voltage were fitted, and the sensitivity curves of the sensor at different frequencies under a 0.5 mm paste layer were obtained, as shown in Figure 8. In the low-frequency range, the sensitivity of the sensor remains relatively stable, with an average sensitivity value of 1.718 V/MPa. As the frequency increases, the sensitivity of the sensor fluctuates to a certain extent. However, the overall sensitivity remains within the range of 1.716 V/MPa to 1.726 V/MPa, demonstrating the alternating rise and fall characteristic. The maximum error observed in the sensitivity calibration test was 0.29%, indicating that the PMN-PT sensor exhibits a relatively stable sensitivity in the frequency range of 0 Hz to 1000 Hz in practical engineering applications. This sensor exhibits good working performance and can be employed for structural stress monitoring.

4. Stress Monitoring of Steel Beam under Low-Frequency Vibration Load

The steel beam structure frequently encounters low-frequency vibrations in the actual working environment, which are caused by seismic and wind loads. These vibrations have a significant impact on the stress changes in the steel beam structure. Due to the complexity of low-frequency vibrations, the internal stress exhibits high levels of randomness. Therefore, it is essential to feedback on the information through the sensor. In order to further investigate the response of the sensor to the stress of the steel beam under different vibrations, this section utilizes the most common random vibration and drop hammer impact load in the actual low-frequency environment and employs the PMN-PT external sensor to conduct a stress monitoring test on the I-steel beam.

4.1. Random Vibration Loading Test

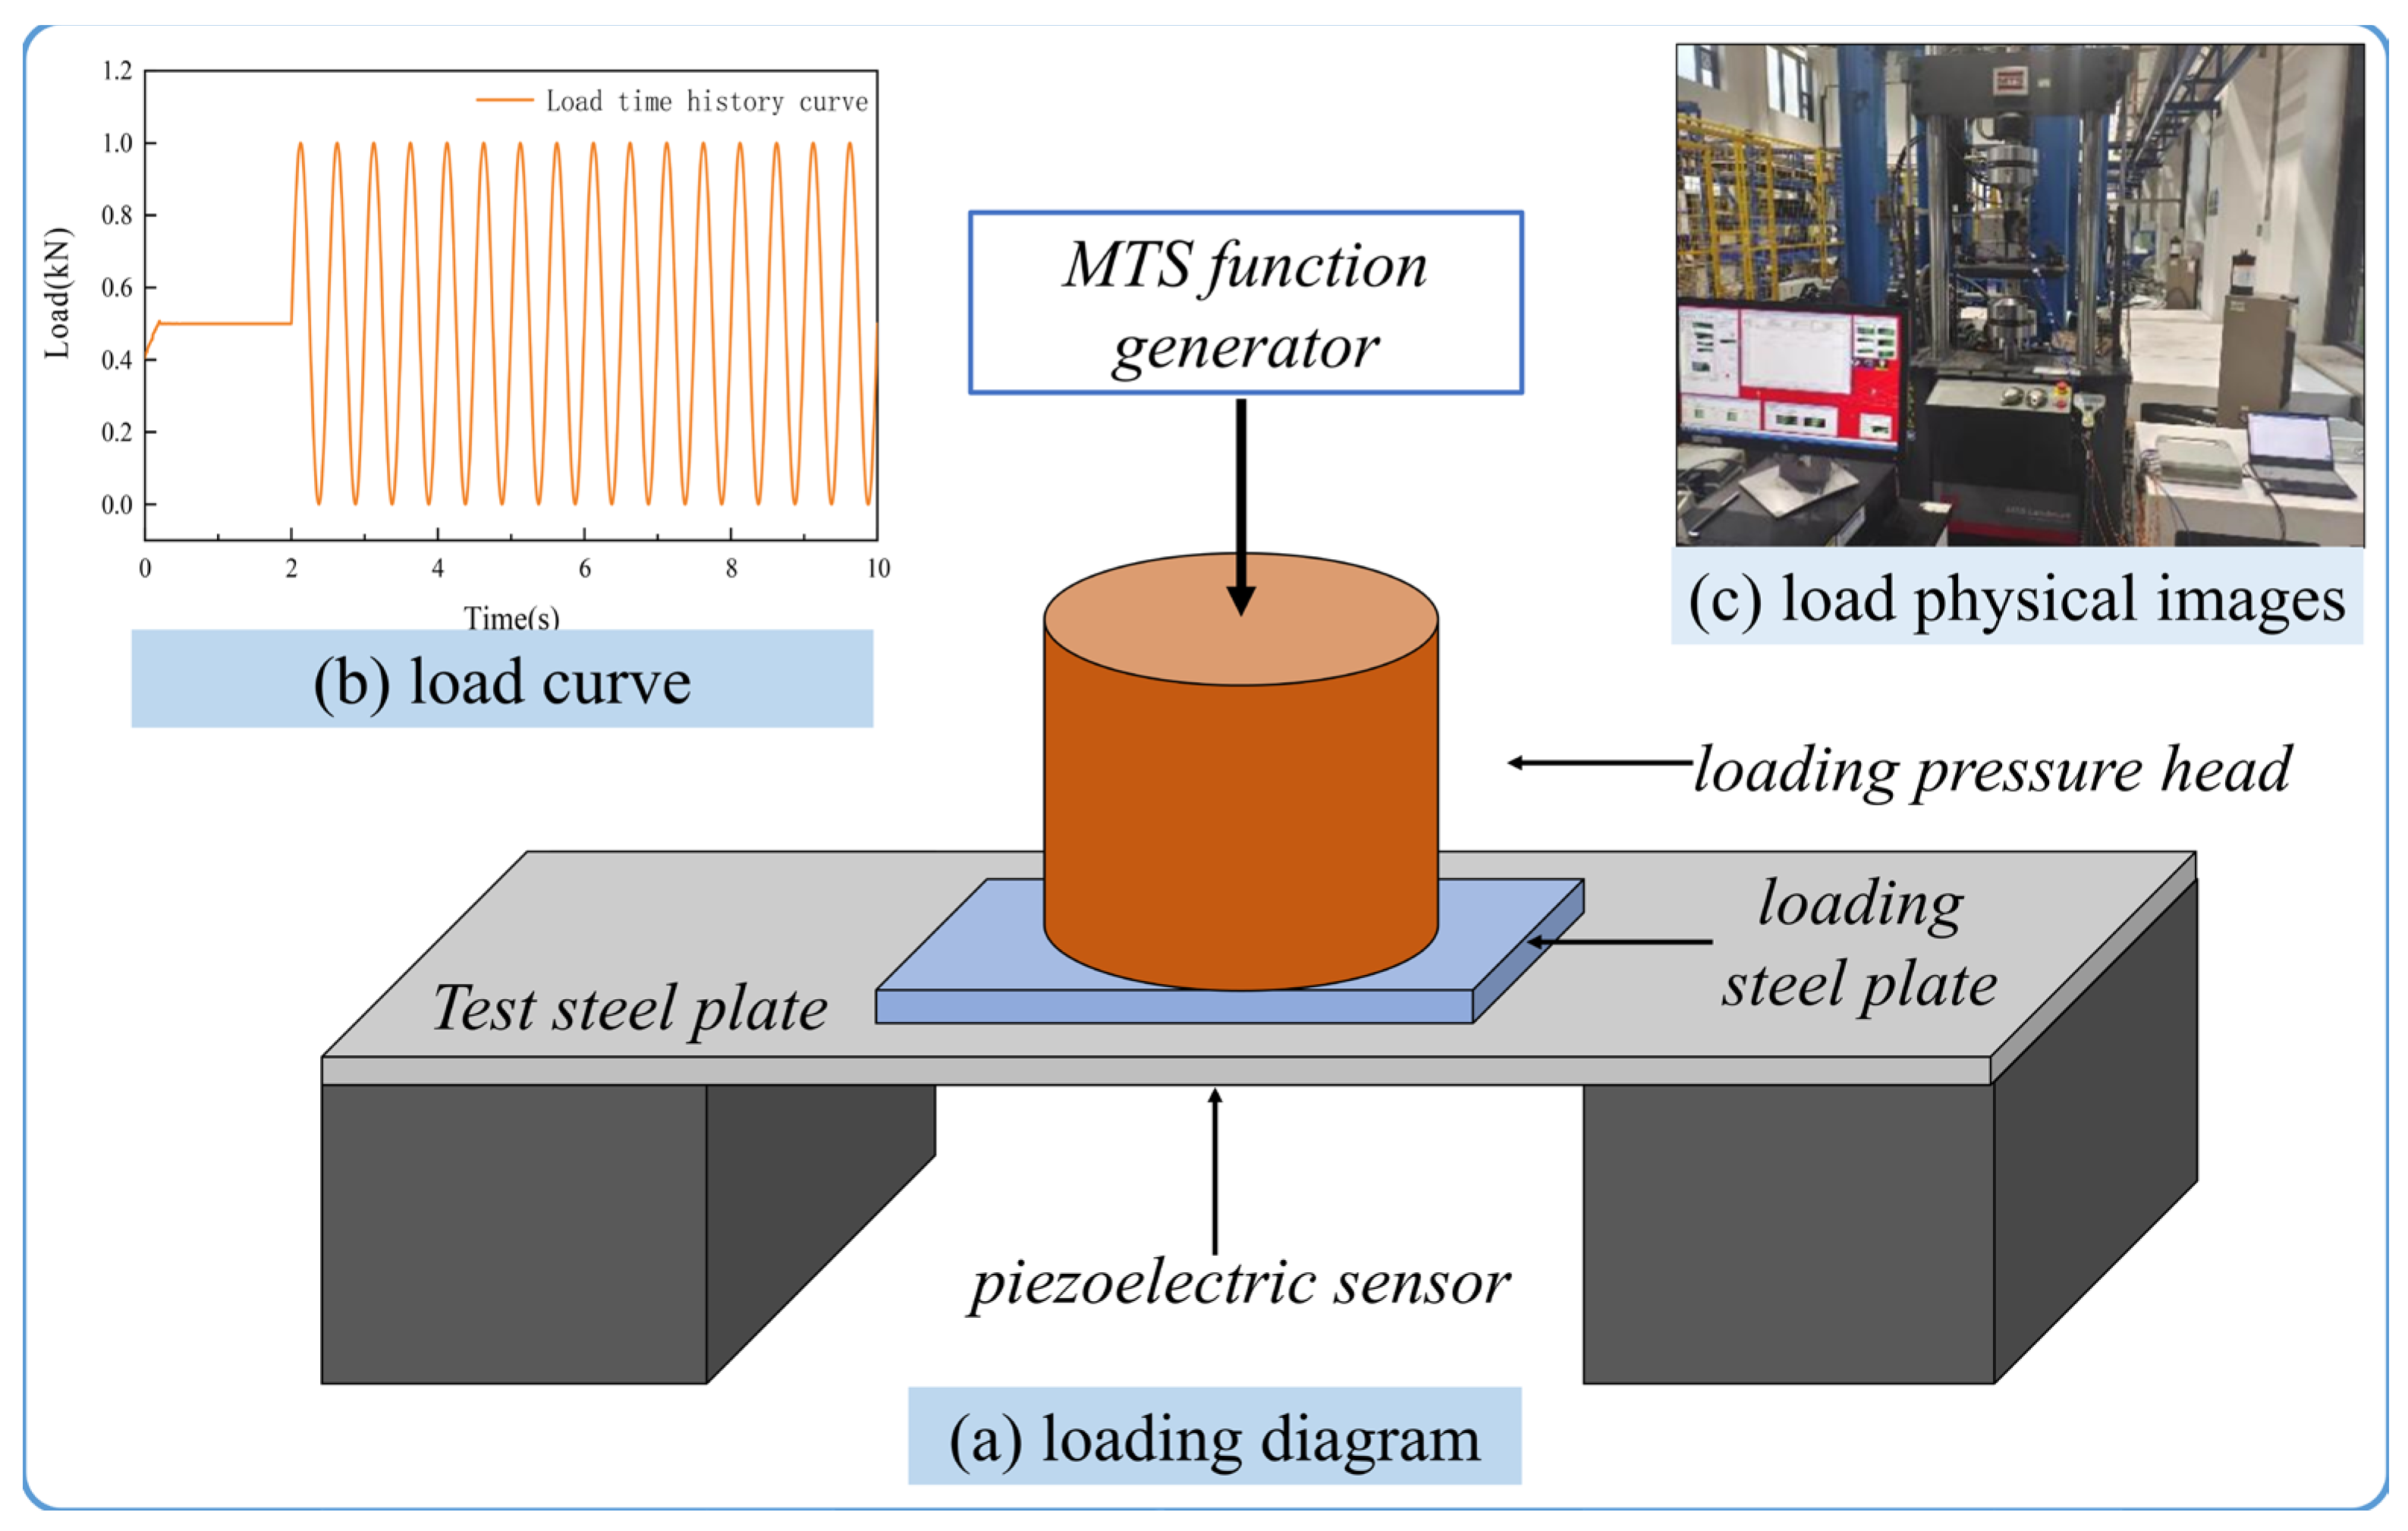
4.1.1. Specimen Design and Loading System

The stress of the steel beam structure in the actual use process will vary depending on the randomness of the load, with the potential for cracks or even damage to occur in severe cases. Since the instantaneous value within the time of random excitation cannot be predicted by a specific function, it is necessary to obtain the internal force value of the structure by monitoring the continuity of the structure. Therefore, it is of great importance to monitor the structural vibration response under random vibration.
The aim of this study is to investigate the reliability of a PMN-PT piezoelectric sensor in the presence of random vibration. To this end, a stress monitoring test was conducted on a steel beam structure subjected to random vibration. The test piece was a Q235 steel beam with Young’s modulus of 200 GPa. The overall length of the steel beam was 800 mm, with a flange width of 70 mm, and the thickness was 4 mm. The web thickness is 4 mm and the height is 92 mm. The PMN-PT piezoelectric sensor is affixed to the I-steel beam through the use of epoxy resin. The sensor dimensions are 20 mm × 10 mm × 0.5 mm. The dimensions of the steel beam and the placement of the sensor are illustrated in Figure 9. The MTS universal testing machine is employed to apply a random load to the I-beam, with the electrical signal being converted by the HK-9209 charge amplifier. The signal is collected and stored by the DH-5922 D high-performance dynamic signal test and analysis system. The random excitation function, as illustrated in Figure 10, is applied to the upper surface of the mid-span of the fixed I-steel beam structure at both ends. The action time is 0~20 s, and the frequency is in the range of 0.02 Hz~55 Hz, with the majority of occurrences concentrated in the range of 2 Hz~55 Hz.

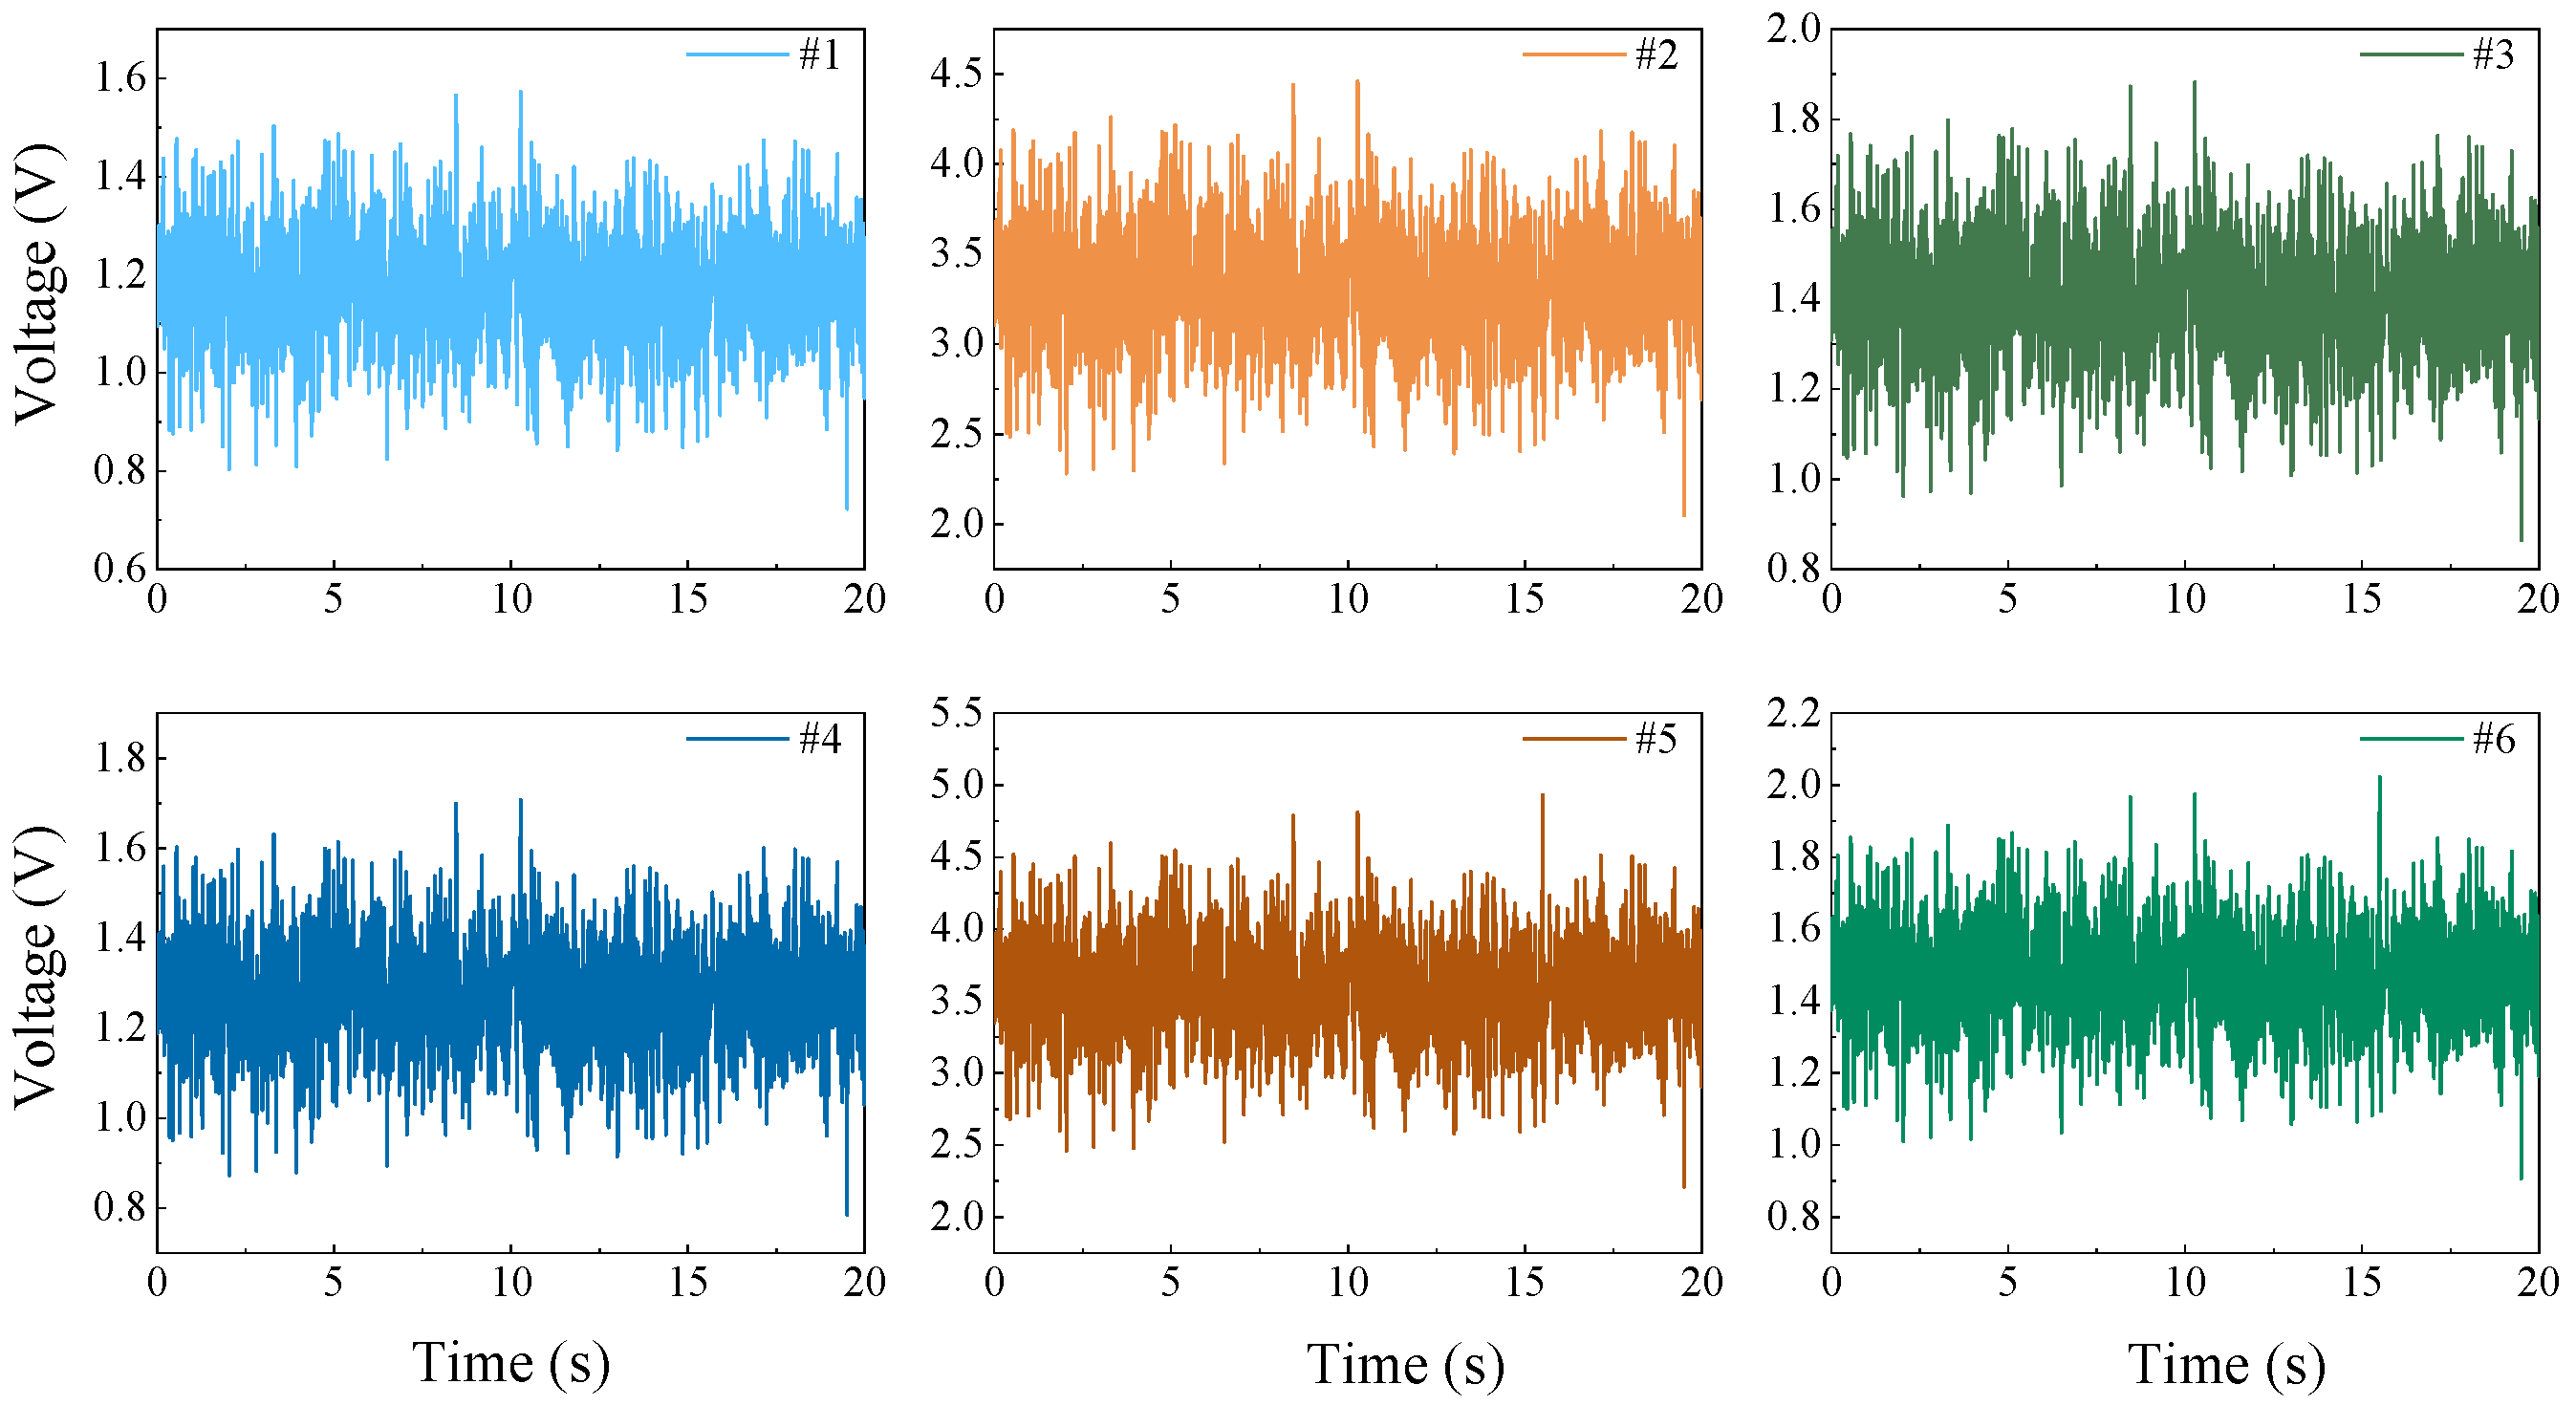
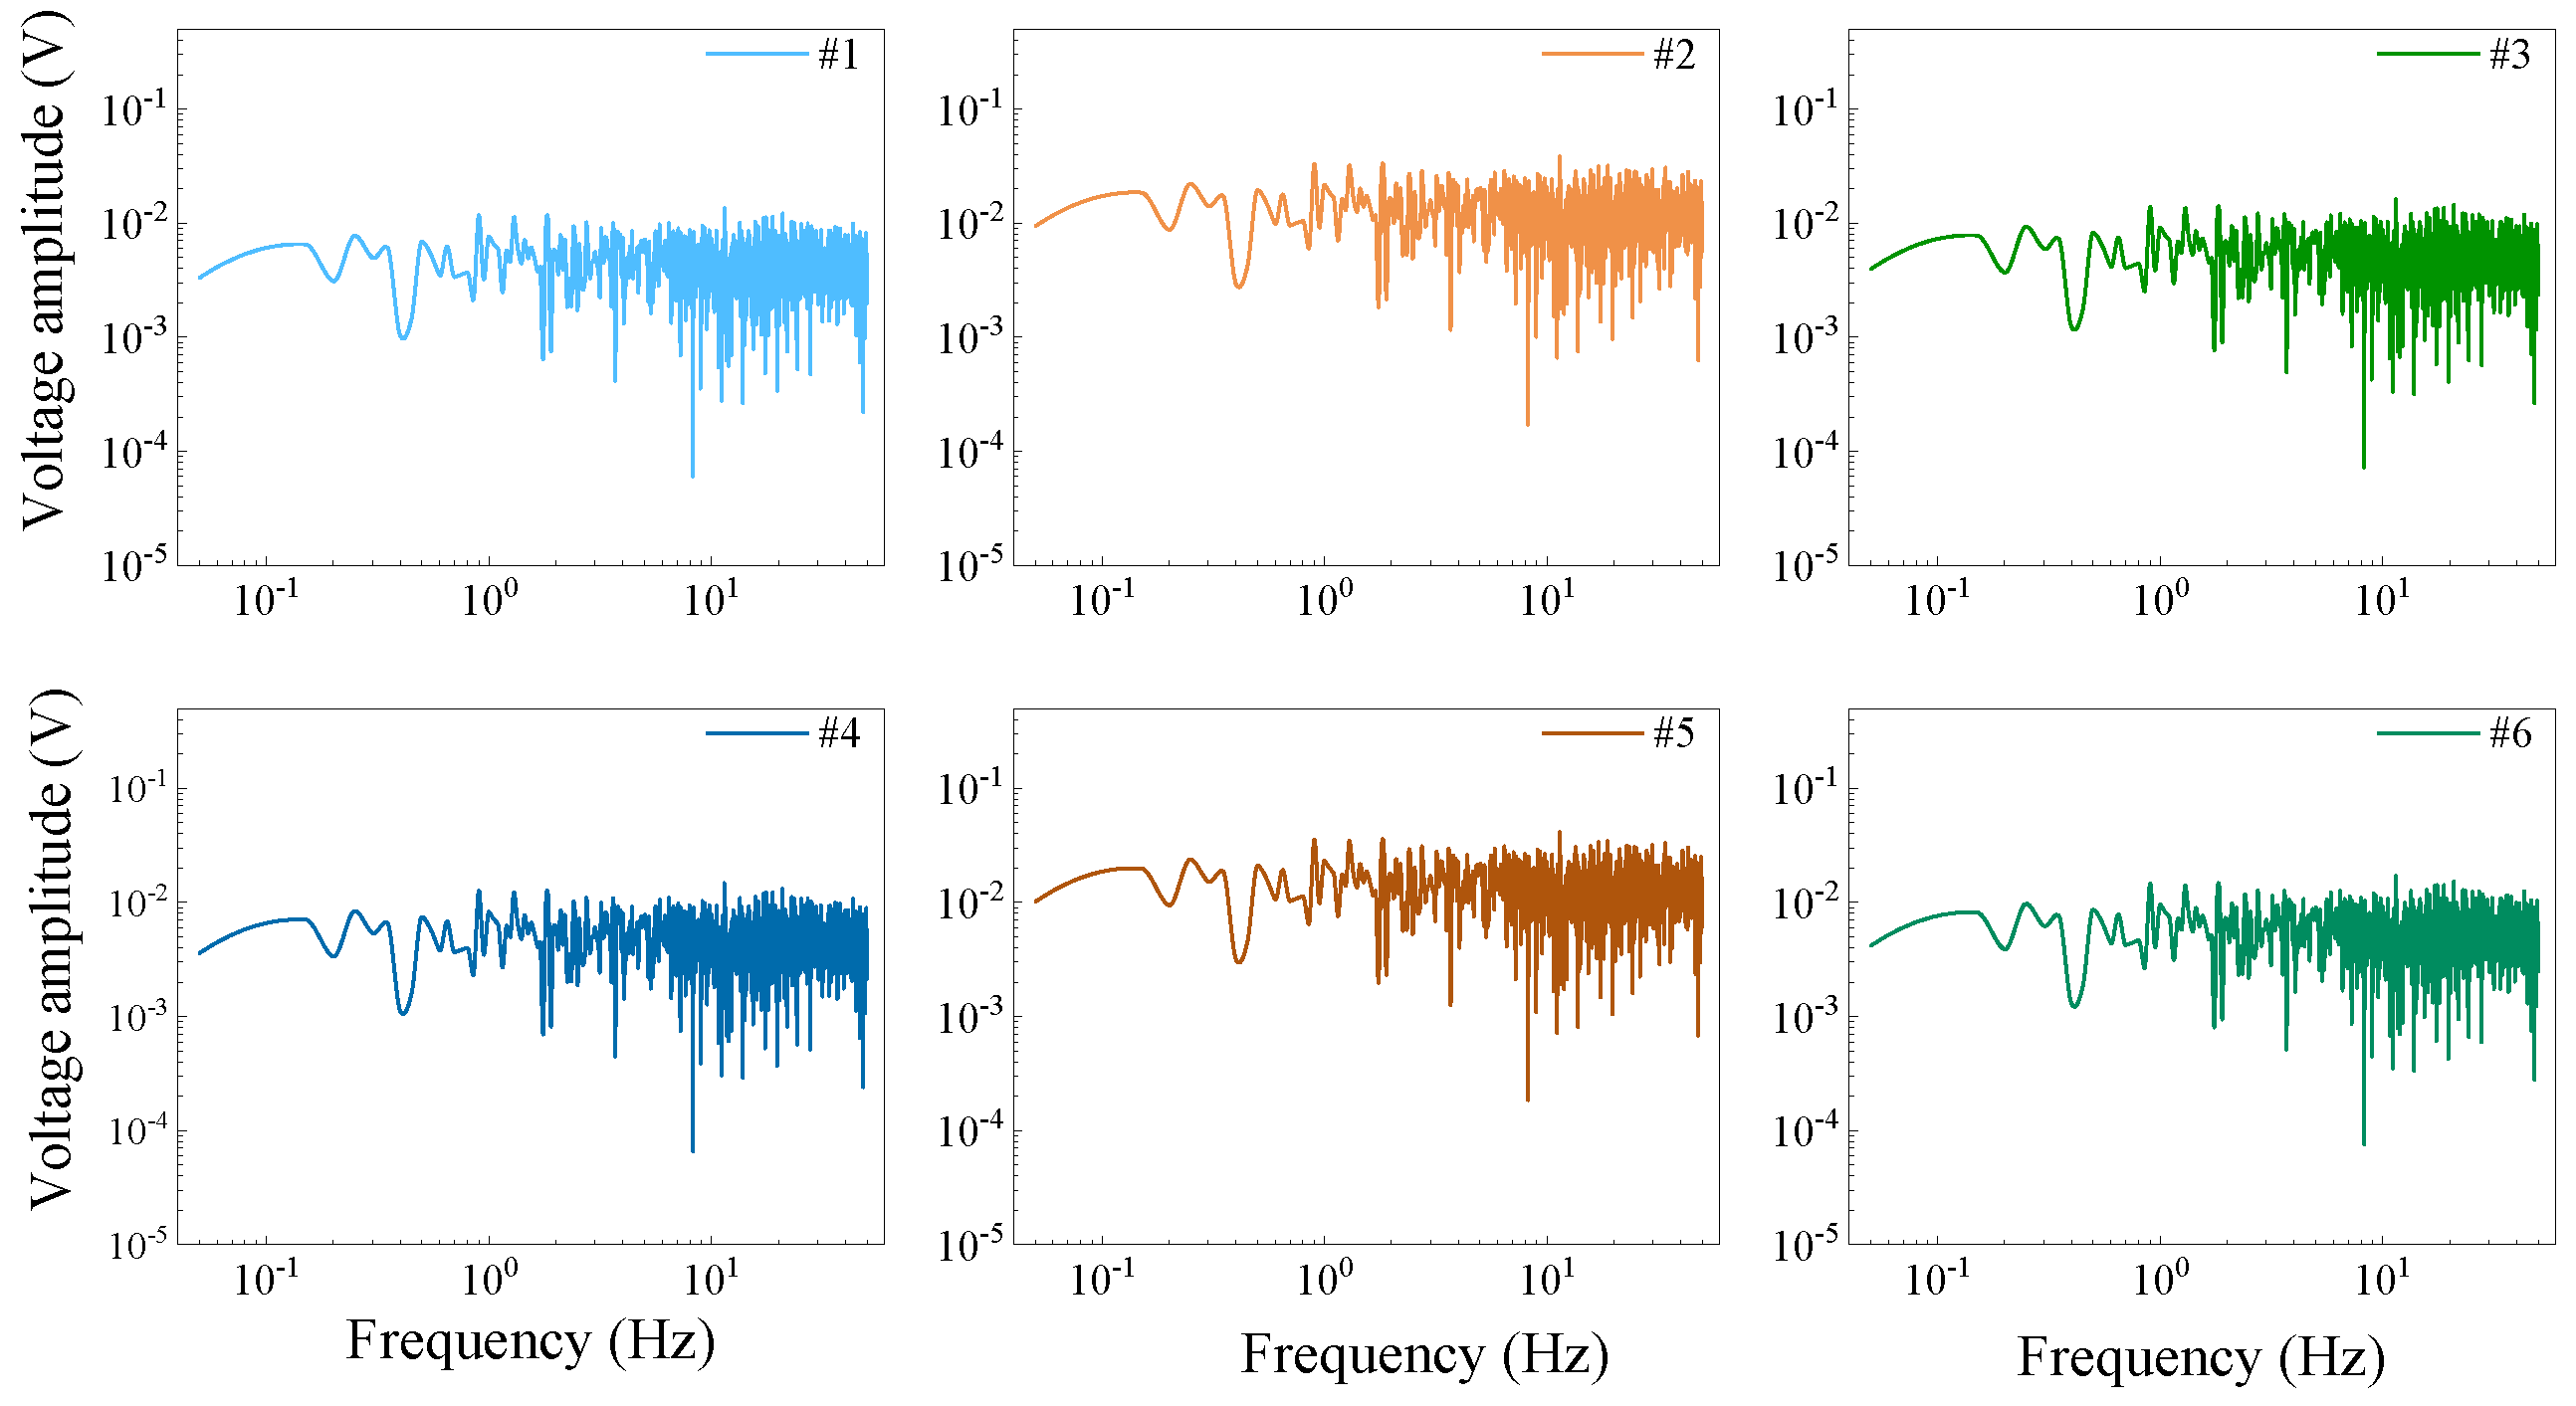
4.1.2. Sensor Voltage Analysis

The sensor voltage time domain curve can be obtained by collecting the output signal of the sensor. As illustrated in Figure 11, the voltage–time domain curve produces a waveform consistent with the load loading curve over time and exhibits a sudden change at the same time, with the peak value occurring at 10.27 s. Table 1 presents the peak voltage output of each sensor. The peak voltage output of sensors #2 and #5 is 4.46 V and 4.81 V, respectively, which is considerably higher than the peak voltage output of the other sensors. The reason for this is that sensors #2 and #5 are situated closer to the load application position, namely, the mid-span section of the beam. Consequently, the stress wave generated by vibration is less consumed at this position than at other locations. There is a slight difference in the output voltage of the sensor at the same position. The output voltage of sensors #2 and #5 differs by 0.26 V, that of sensors #1 and #4 by 0.1 V, and that of sensors #3 and #6 by only 0.07 V. This is due to the differing material composition of the lower flange of the I-steel beam, which affects the conduction of stress waves within the steel beam. It is evident that in a random vibration environment, the voltage output signal of the PMN-PT sensor can correspond to the applied load in real-time, and the sensitivity is high. Furthermore, it can accurately reflect the internal stress change state of the steel beam and has strong applicability.
The output time domain curve of the PMN-PT piezoelectric sensor is Fourier transformed to obtain the sensor output frequency domain curve, Figure 12, which is then compared with the frequency domain curve of the random excitation load in Figure 10. It is evident that the two curves exhibit a similar waveform. The sensor output voltage curve is relatively smooth in the low-frequency state, with a reduced incidence of voltage mutation. In the high-frequency state, the input load is in a state of constant change, and the output voltage curve of the sensor can produce a frequency corresponding to the frequency of the external load. This demonstrates that the PMN-PT sensor has an excellent performance under high-frequency and low-frequency loads. The sensor is capable of responding to external load excitation at each frequency, providing an accurate representation of the actual stress state of the structure.

4.2. Drop Hammer Impact Loading Test

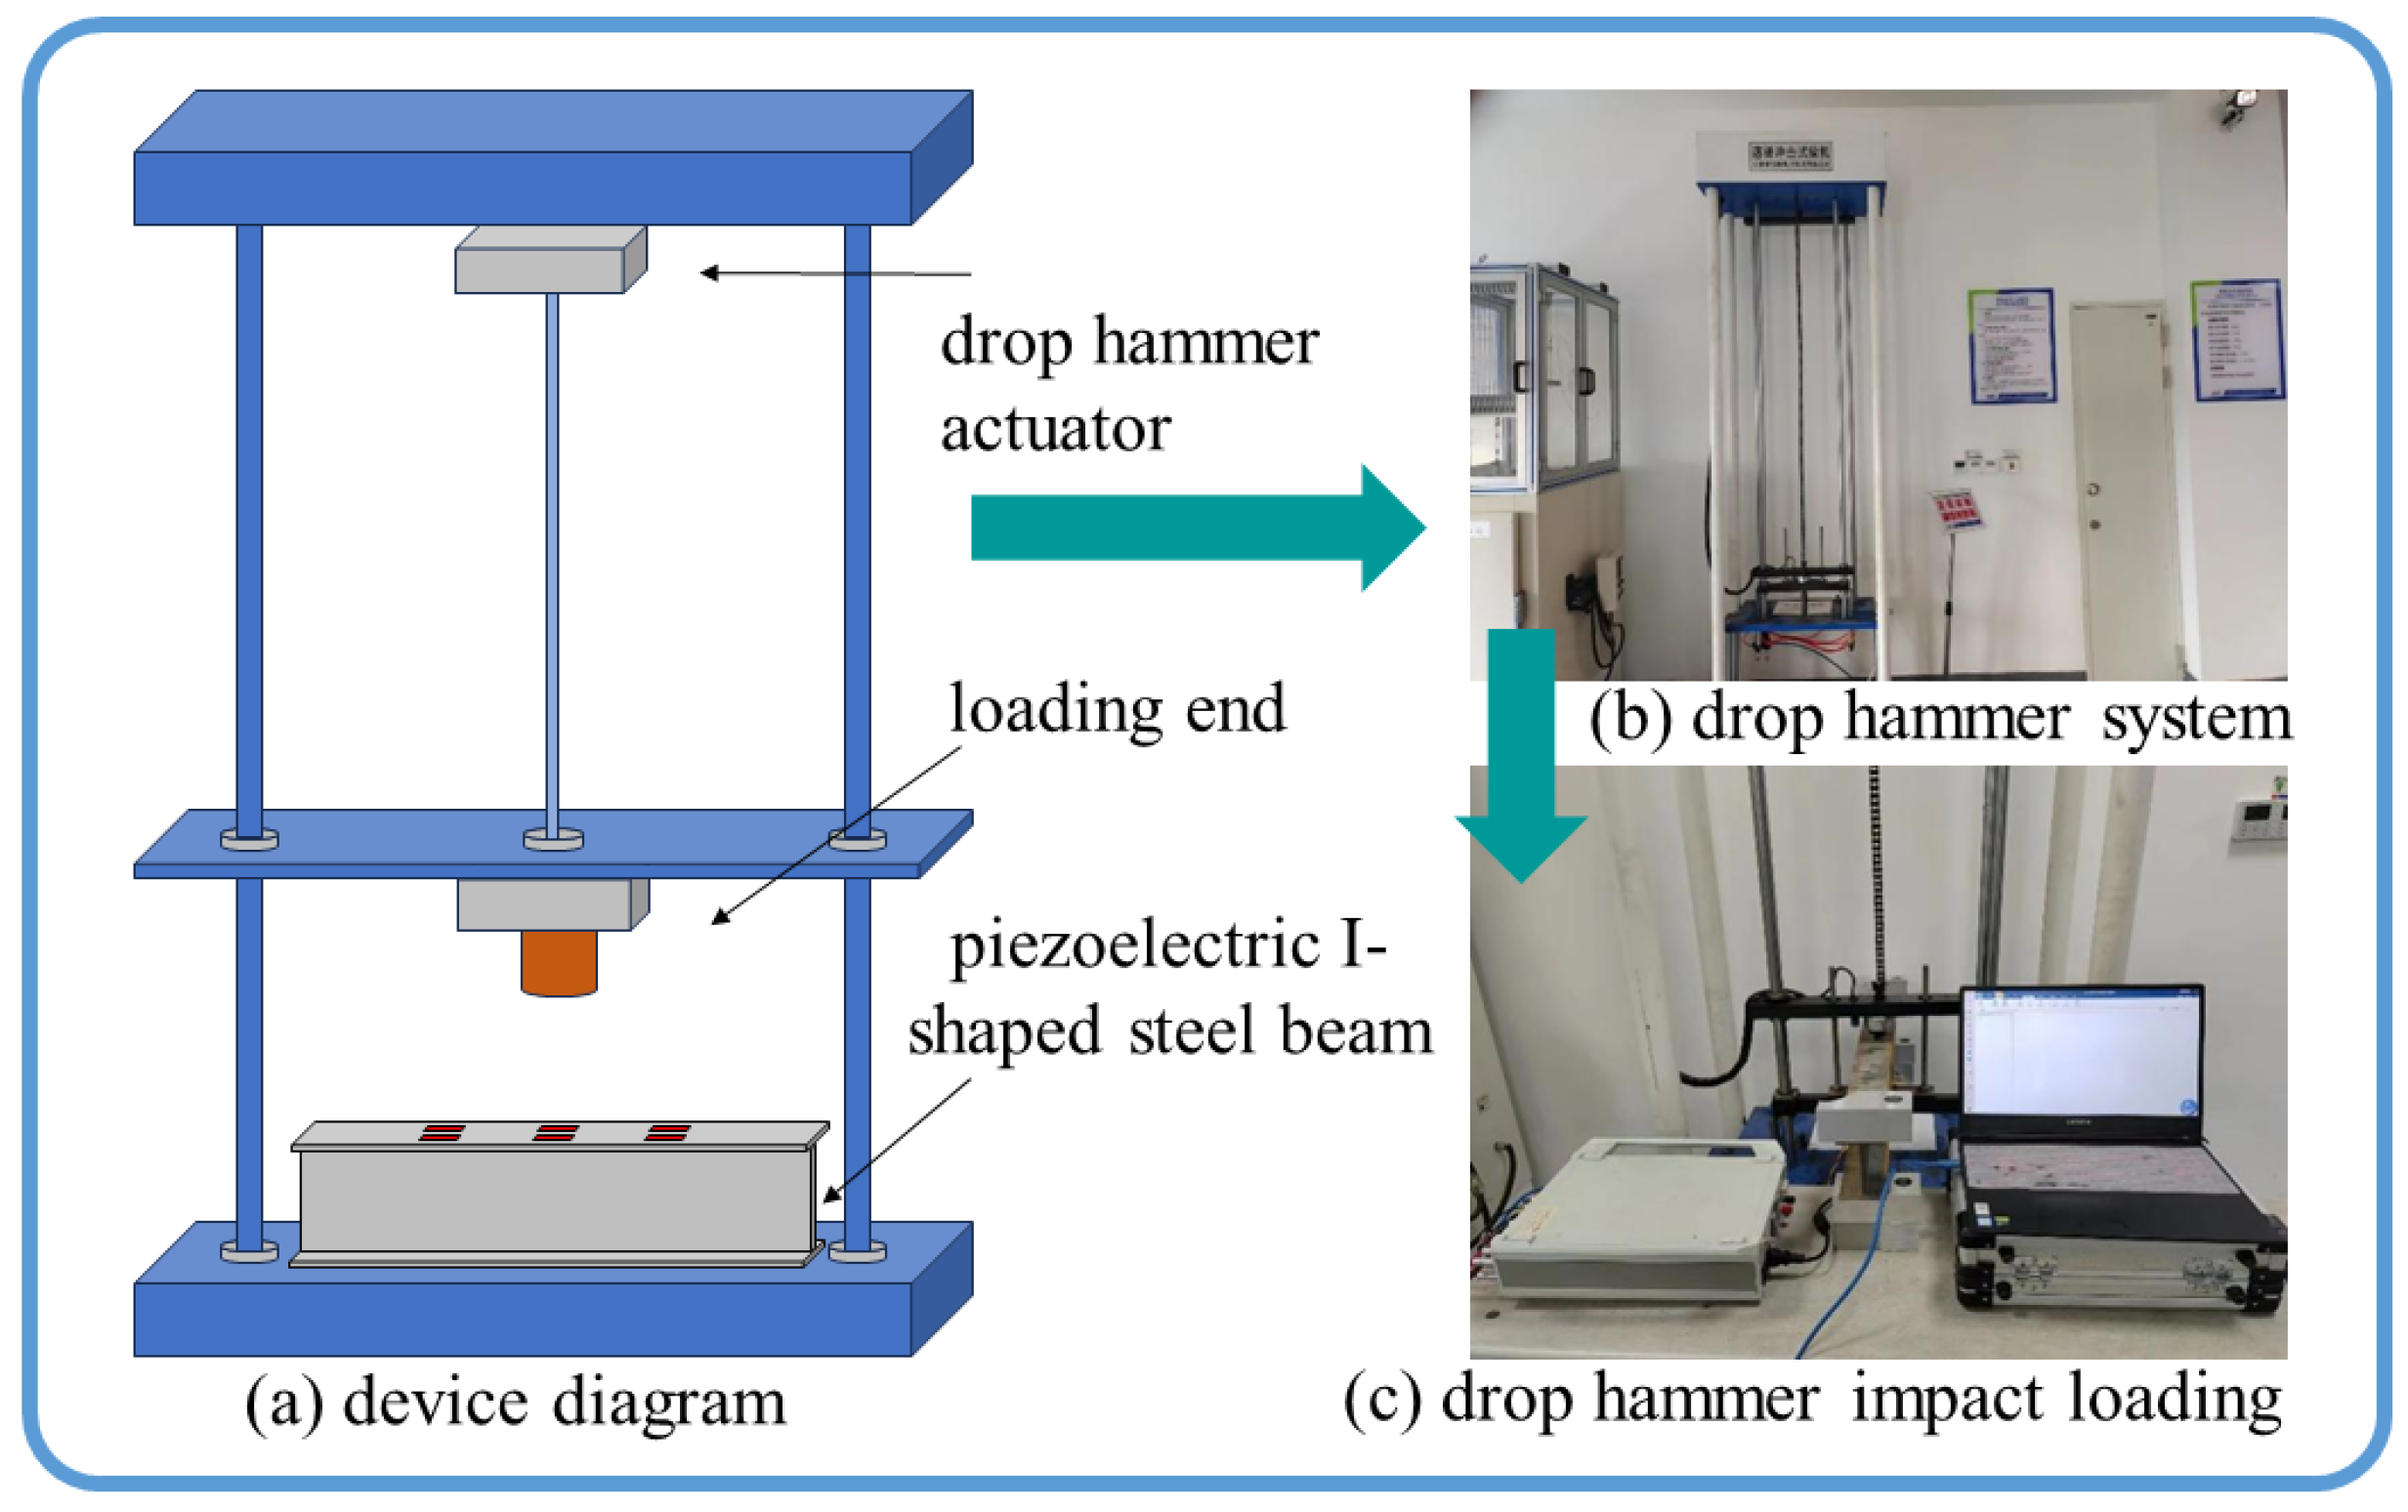
4.2.1. Test Device and Loading Scheme

In order to study the practical effect of the PMN-PT sensor on structural health monitoring under impact load, a drop hammer impact test was designed for the I-steel beam pasted with the PMN-PT sensor. The component size and sensor paste arrangement are consistent with Figure 9. The drop hammer impact system used in the test is shown in Figure 13, which is composed of a drop hammer test machine, a 15 kg drop hammer, and a data acquisition system.
The I-shaped steel beam, onto which a PMN-PT piezoelectric sensor has been fixed, is positioned on a test bench. The central axis of the drop hammer is controlled to be positioned at the center of the mid-span position of the piezoelectric steel beam structure. Four sets of drop hammer falling heights are set as 20 cm, 40 cm, 60 cm, and 80 cm, respectively. The voltage signal output by the sensor is amplified by the HK9209 charge amplifier and collected by the Donghua DH5922D data acquisition instrument. The impact force and energy on the surface of the structure at different heights can be calculated using basic formulas such as V = 2 g h and F t = m v . The calculation results are shown in Table 2.

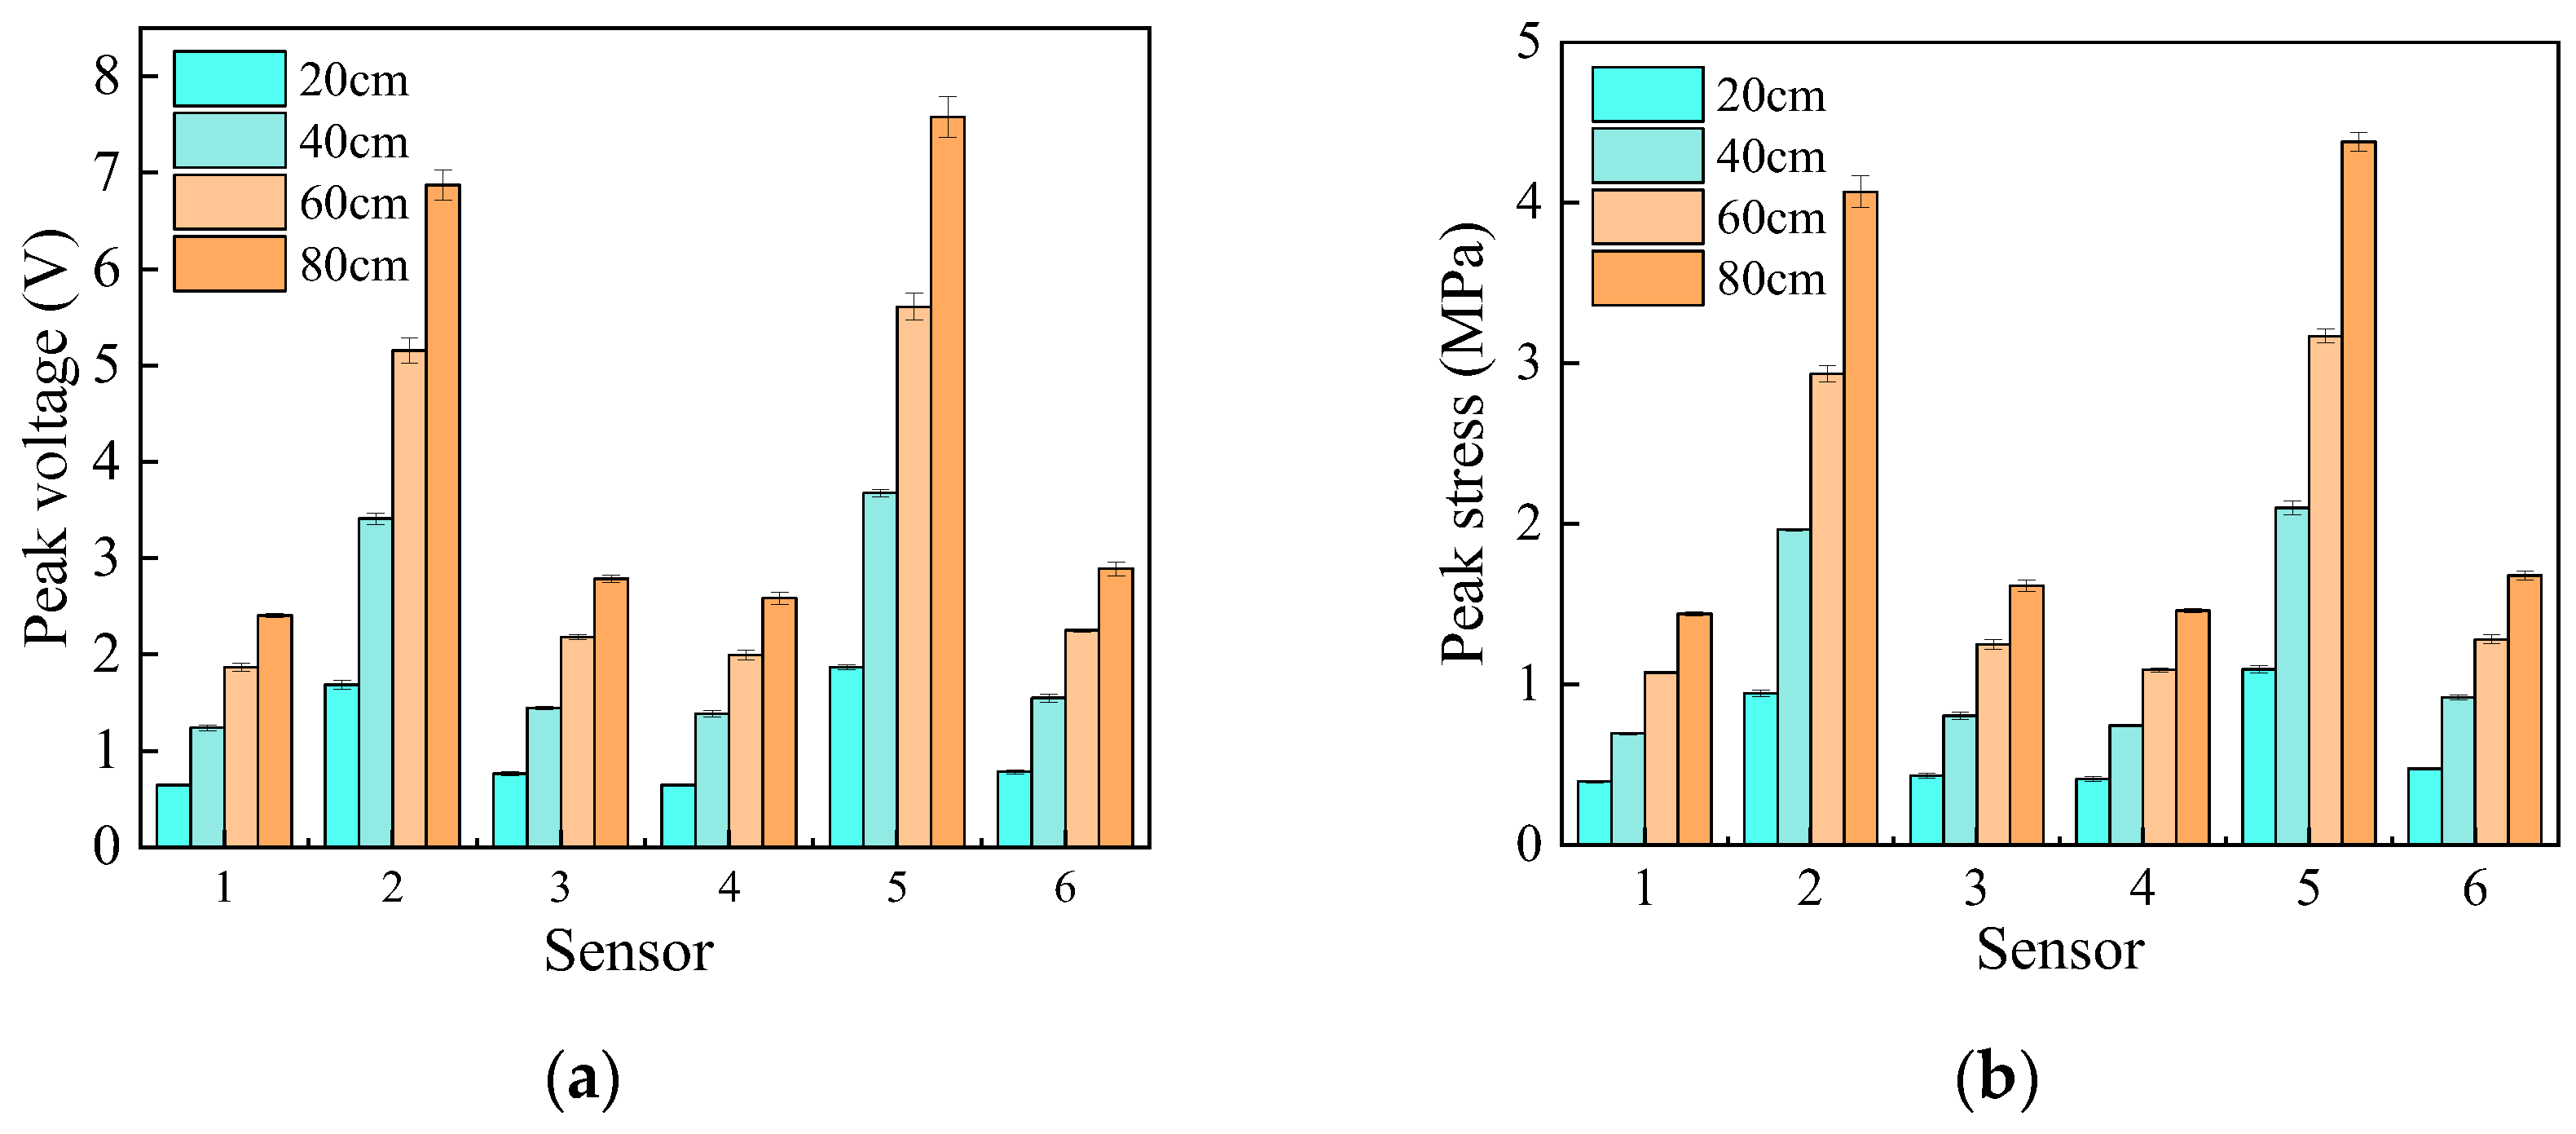
4.2.2. Sensor Voltage Analysis

The quantity of data collected by the six sensors at varying heights of impact is considerable, and the stress generated by the drop hammer impact on the surface of the steel beam is primarily contingent on the drop height. The voltage output trend of the sensor at different drop hammer heights is consistent. Consequently, this section describes the output signal curve of the piezoelectric sensor with a drop height of 20 cm as an illustrative example. In the range of 0.8–1.2 s, the drop hammer makes contact with the piezoelectric smart steel beam structure at 1 s. Figure 14 illustrates that the sensor output signal exhibits a step when the drop hammer contacts the surface of the structure, reaching a peak at 1.001 s The impact force generated by the falling hammer has a very short duration on the structure and the output signal of the sensor undergoes a sudden change when the structure is subjected to the impact. This indicates that the piezoelectric sensor has an excellent ability to perceive the impact load and can rapidly generate a voltage signal to reflect the structural stress.
Following the attainment of the peak voltage at 1.001 s, the amplitude and deformation of the piezoelectric steel beam exhibit a gradual decline due to the influence of self-vibration damping, accompanied by a corresponding reduction in stress. The charge generated by the impact of the drop hammer is consumed by the resistance of the measuring circuit, with a concomitant decrease in amplitude. Once the structural vibration has ceased, the output signal of the piezoelectric sensor is reduced to 0 V. The duration of the sensor voltage from the abrupt change to the attenuation to 0 V is 0.019 s. The peak voltages of sensors #1~#6 can reach 0 V. The output voltages of the sensors were found to be 0.65 V, 1.65 V, 0.78 V, 0.64 V, 1.85 V, and 0.77 V, respectively. Among these, the output voltages of sensors #2 and #5 were found to be the largest. This is due to the fact that sensors #2 and #5 are situated in closer proximity to the contact point of the drop hammer on the steel beam than the other sensors. However, due to the uneven material of the steel beam, the stress transfer is uneven, resulting in a slight difference in the perception of the impact force between the two sensors.
The time domain curve of the sensor is Fourier transformed to obtain the corresponding frequency domain curve. Figure 15 illustrates that the voltage amplitude of each sensor exhibits an initial increase followed by a subsequent decrease between 0 Hz and 5 Hz, reaching a maximum peak. While the voltage amplitude increases slightly in some intervals, it demonstrates a downward trend overall. Sensors #1 to #6 all exhibit a maximum peak at a frequency of 2.44 Hz. Among these, the output values of sensors #2 and #5 are notably higher than those of the other sensors, reaching 0.338 V and 0.379 V, respectively. This indicates that the low frequency of 2.44 Hz can be regarded as the main frequency of the sensor output signal. Consequently, as the frequency continues to increase, the sensor is no longer capable of generating an effective signal. The piezoelectric sensor is capable of producing a specific effective signal response in response to internal force changes of different frequencies caused by impact loads. This provides a highly practical and efficient means of monitoring the internal force changes of steel beam structures under impact load environments.
Figure 16 illustrates the drop hammer drop height (20 cm, 40 cm, 60 cm, 80 cm) in relation to the sensor voltage output peak diagram. It is evident that, under the same falling height condition, the voltage output value of sensors #2 and #5 is greater, with a difference of 10%. The voltage signals of the sensors at #1, #3, #4, and #6 are similar to those of sensors #2 and #5, with a difference of approximately one-third. This is due to the fact that sensors #2 and #5 are closer to the mid-span position. As the propagation and consumption of vibration occur, the output voltage decreases in accordance with the aforementioned position. The peak output signals of the two sensors at the same x-axis coordinates differ by 1/6. This is due to the fact that the steel material is not uniform, which results in the impact inside the steel beam not fully conforming to the law of symmetrical transmission.

4.2.3. Calculation of Peak Stress of Steel Beam

The first type of piezoelectric equation, based on the voltage output of the piezoelectric sensor, enables the external excitation of the piezoelectric sensor to be inversely calculated. This allows the theoretical calculation results of the peak stress of the steel beam with different falling heights of 20 cm, 40 cm, 60 cm and 80 cm at the position of sensors #1~#6 to be obtained. In order to provide further intuitive expression of the difference in theoretical stress calculation results for each height and each sensor, Figure 17 is presented. It is evident that the peak stress of sensors #2 and #5 at each height is considerably higher than that of the other sensors. Furthermore, with the increase in falling height, the stress gap between sensors #2 and #5 and the other sensors is becoming more pronounced.

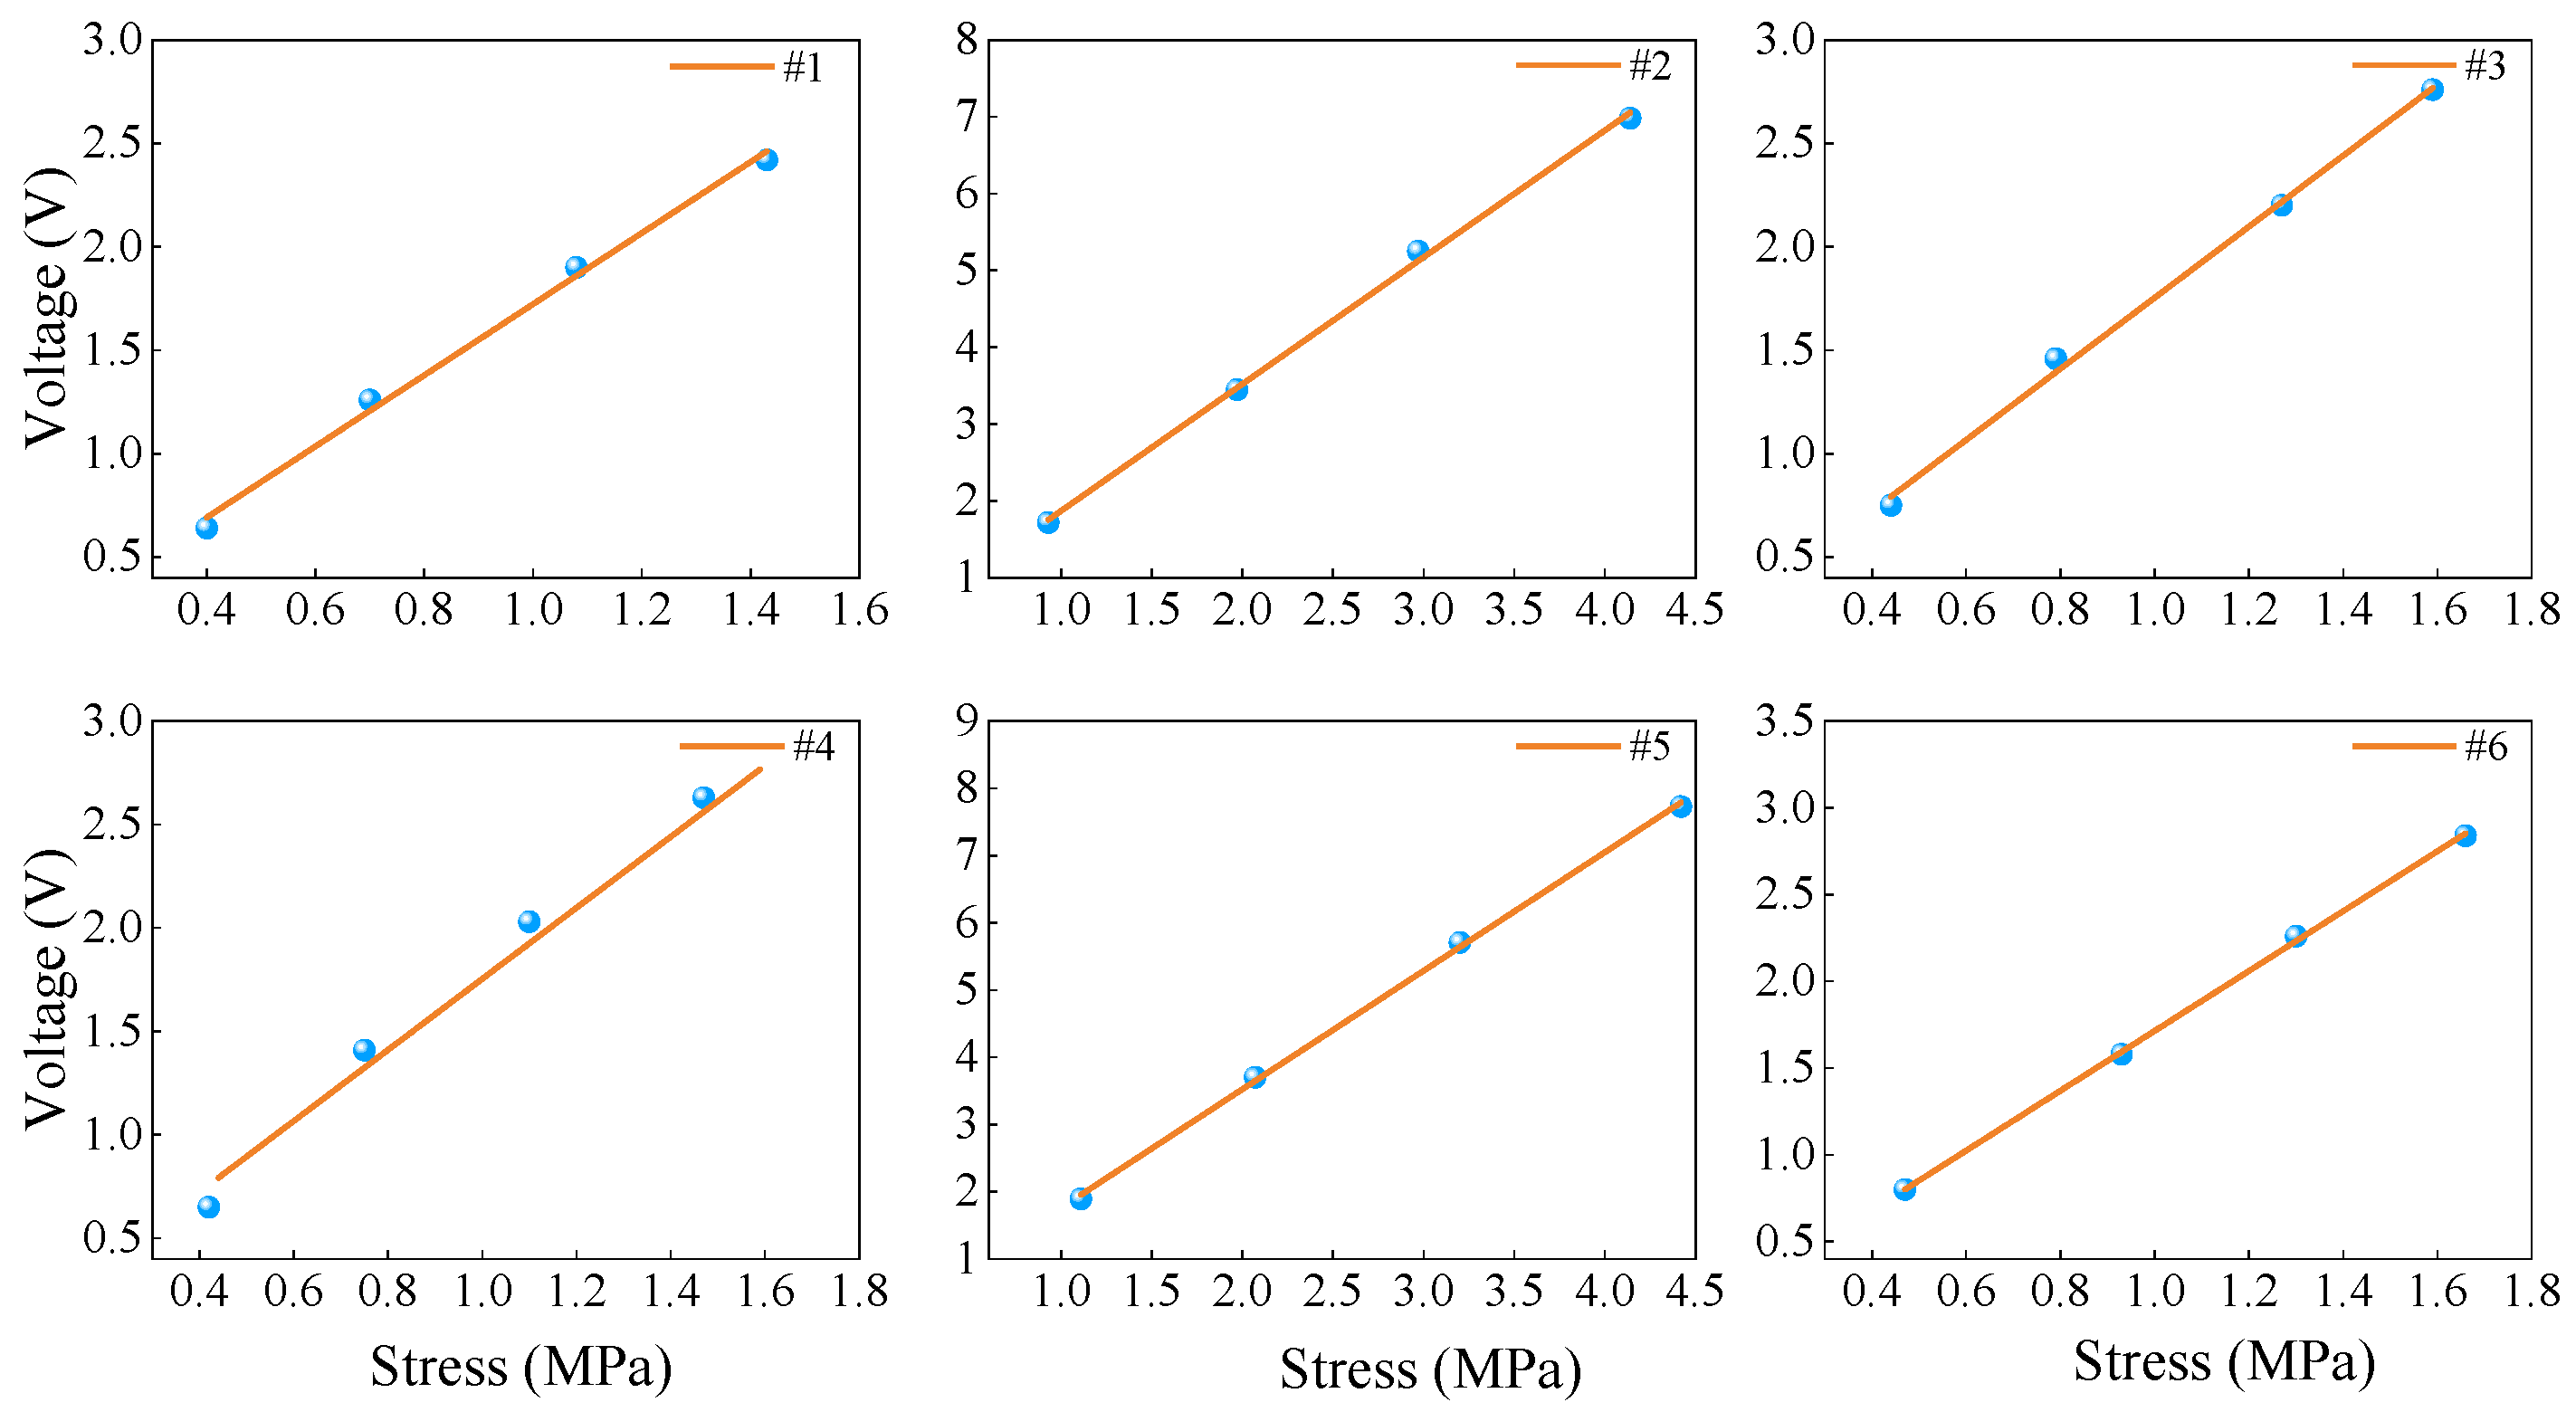
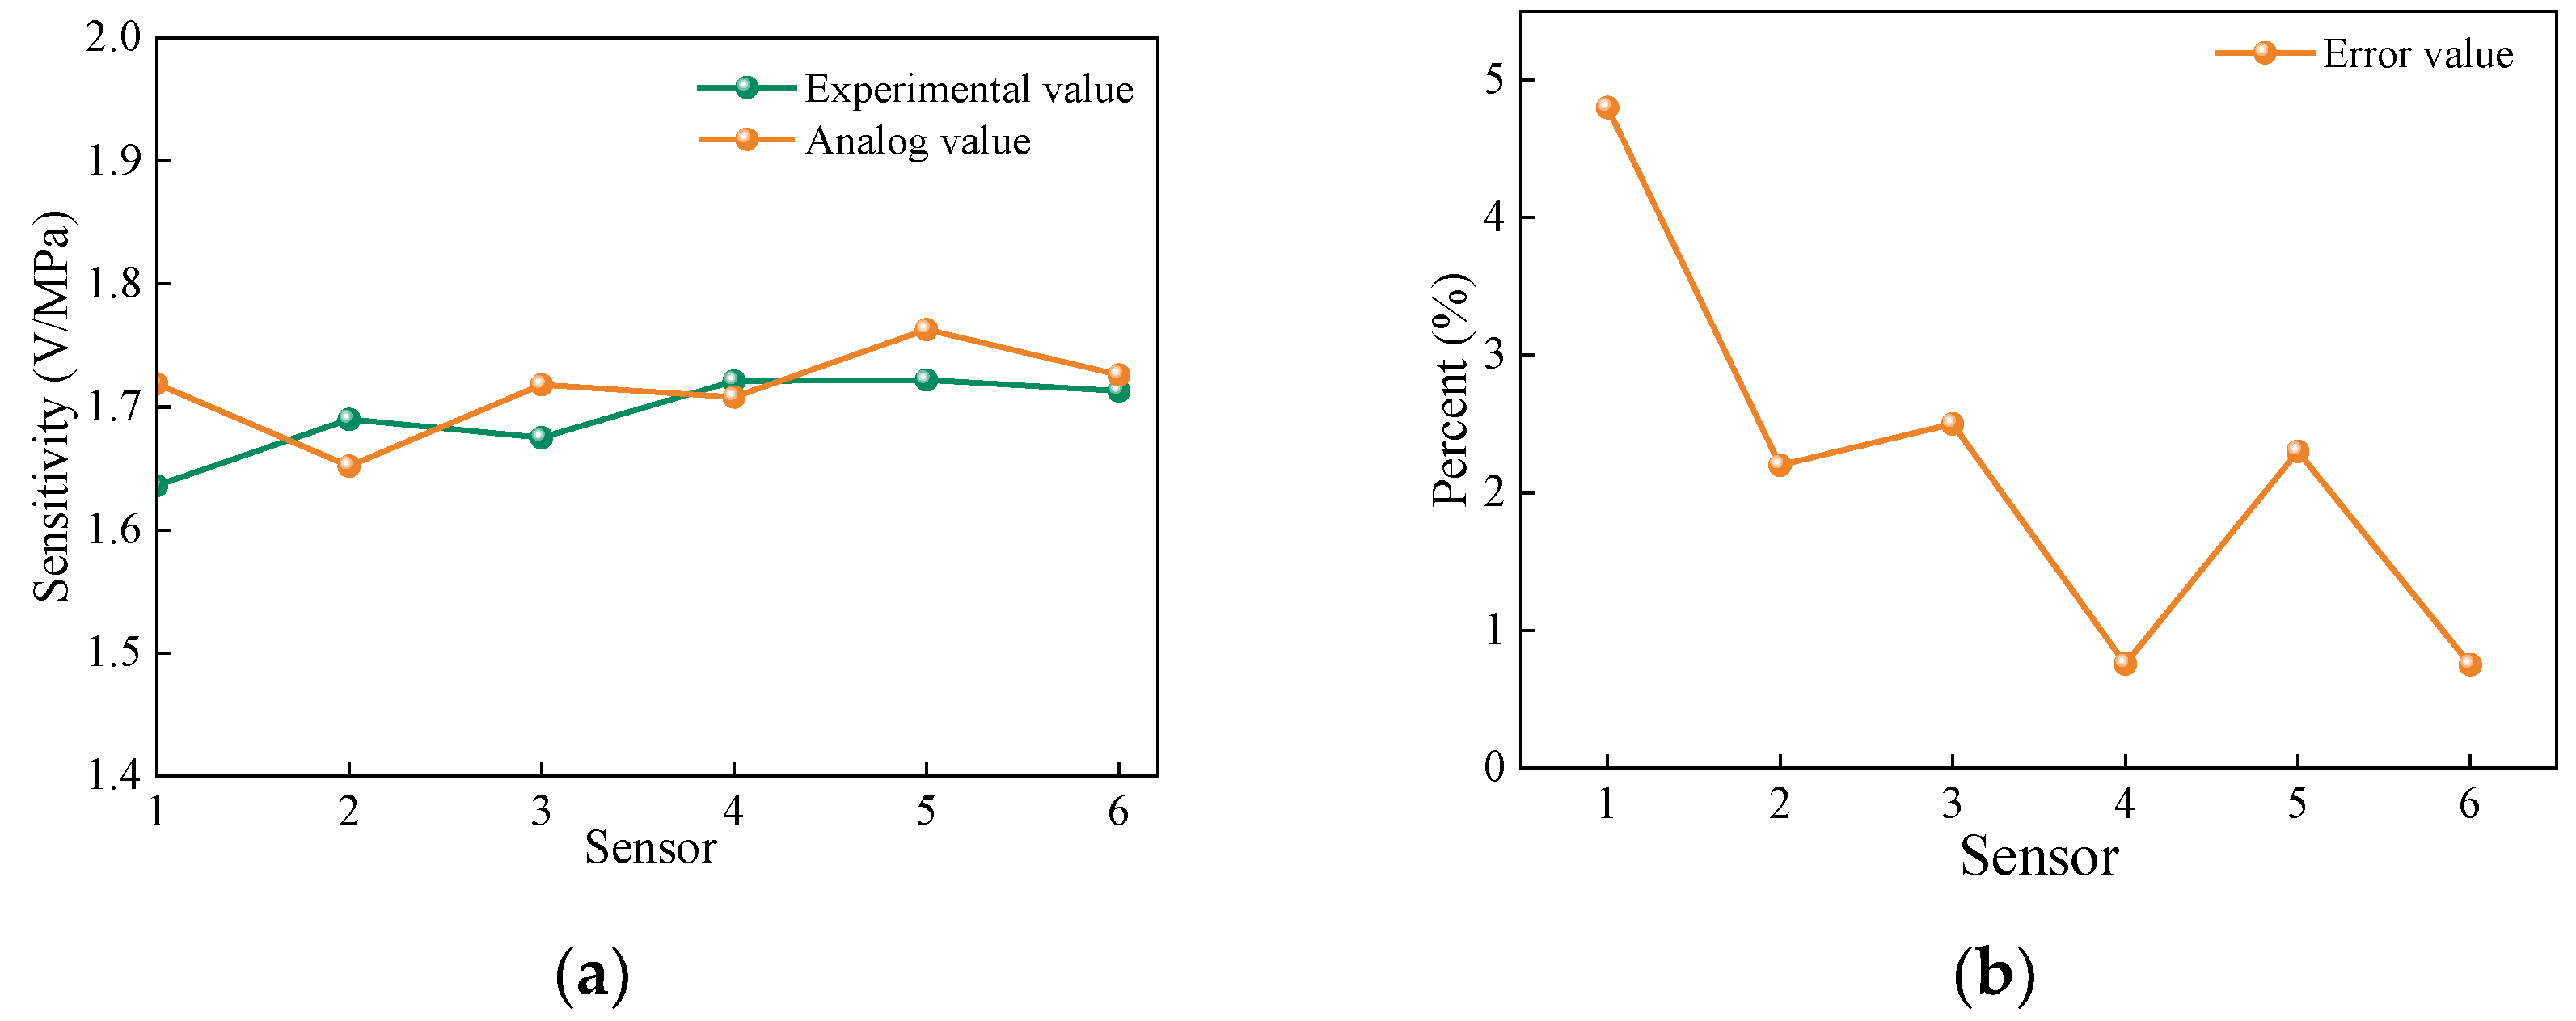
4.2.4. Sensor Sensitivity Analysis

The output peak voltage signal of the PMN-PT piezoelectric sensor under drop hammer impact at different heights is fitted with the stress peak obtained by inversion calculation. The sensitivity fitting curve of each sensor is shown in Figure 18a, and Figure 18b gives the sensitivity results of #1–#6 sensors. The minimum sensitivity of the # 1 sensor is 1.636 V/MPa, the maximum sensitivity of the #5 sensor is 1.722 V/MPa, and the maximum error is 4.9%. The average sensitivity of the six sensors is 1.693 V/MPa, which is consistent with the sensitivity calibration result of 1.721 V/MPa in Section 3.2. It can be seen from Figure 17 that the sensitivity fitting linearity of #1–#6 sensors is high, indicating that PMN-PT sensors have good working performance under different impact loads and can be effectively used for steel beam structure monitoring under impact loads.

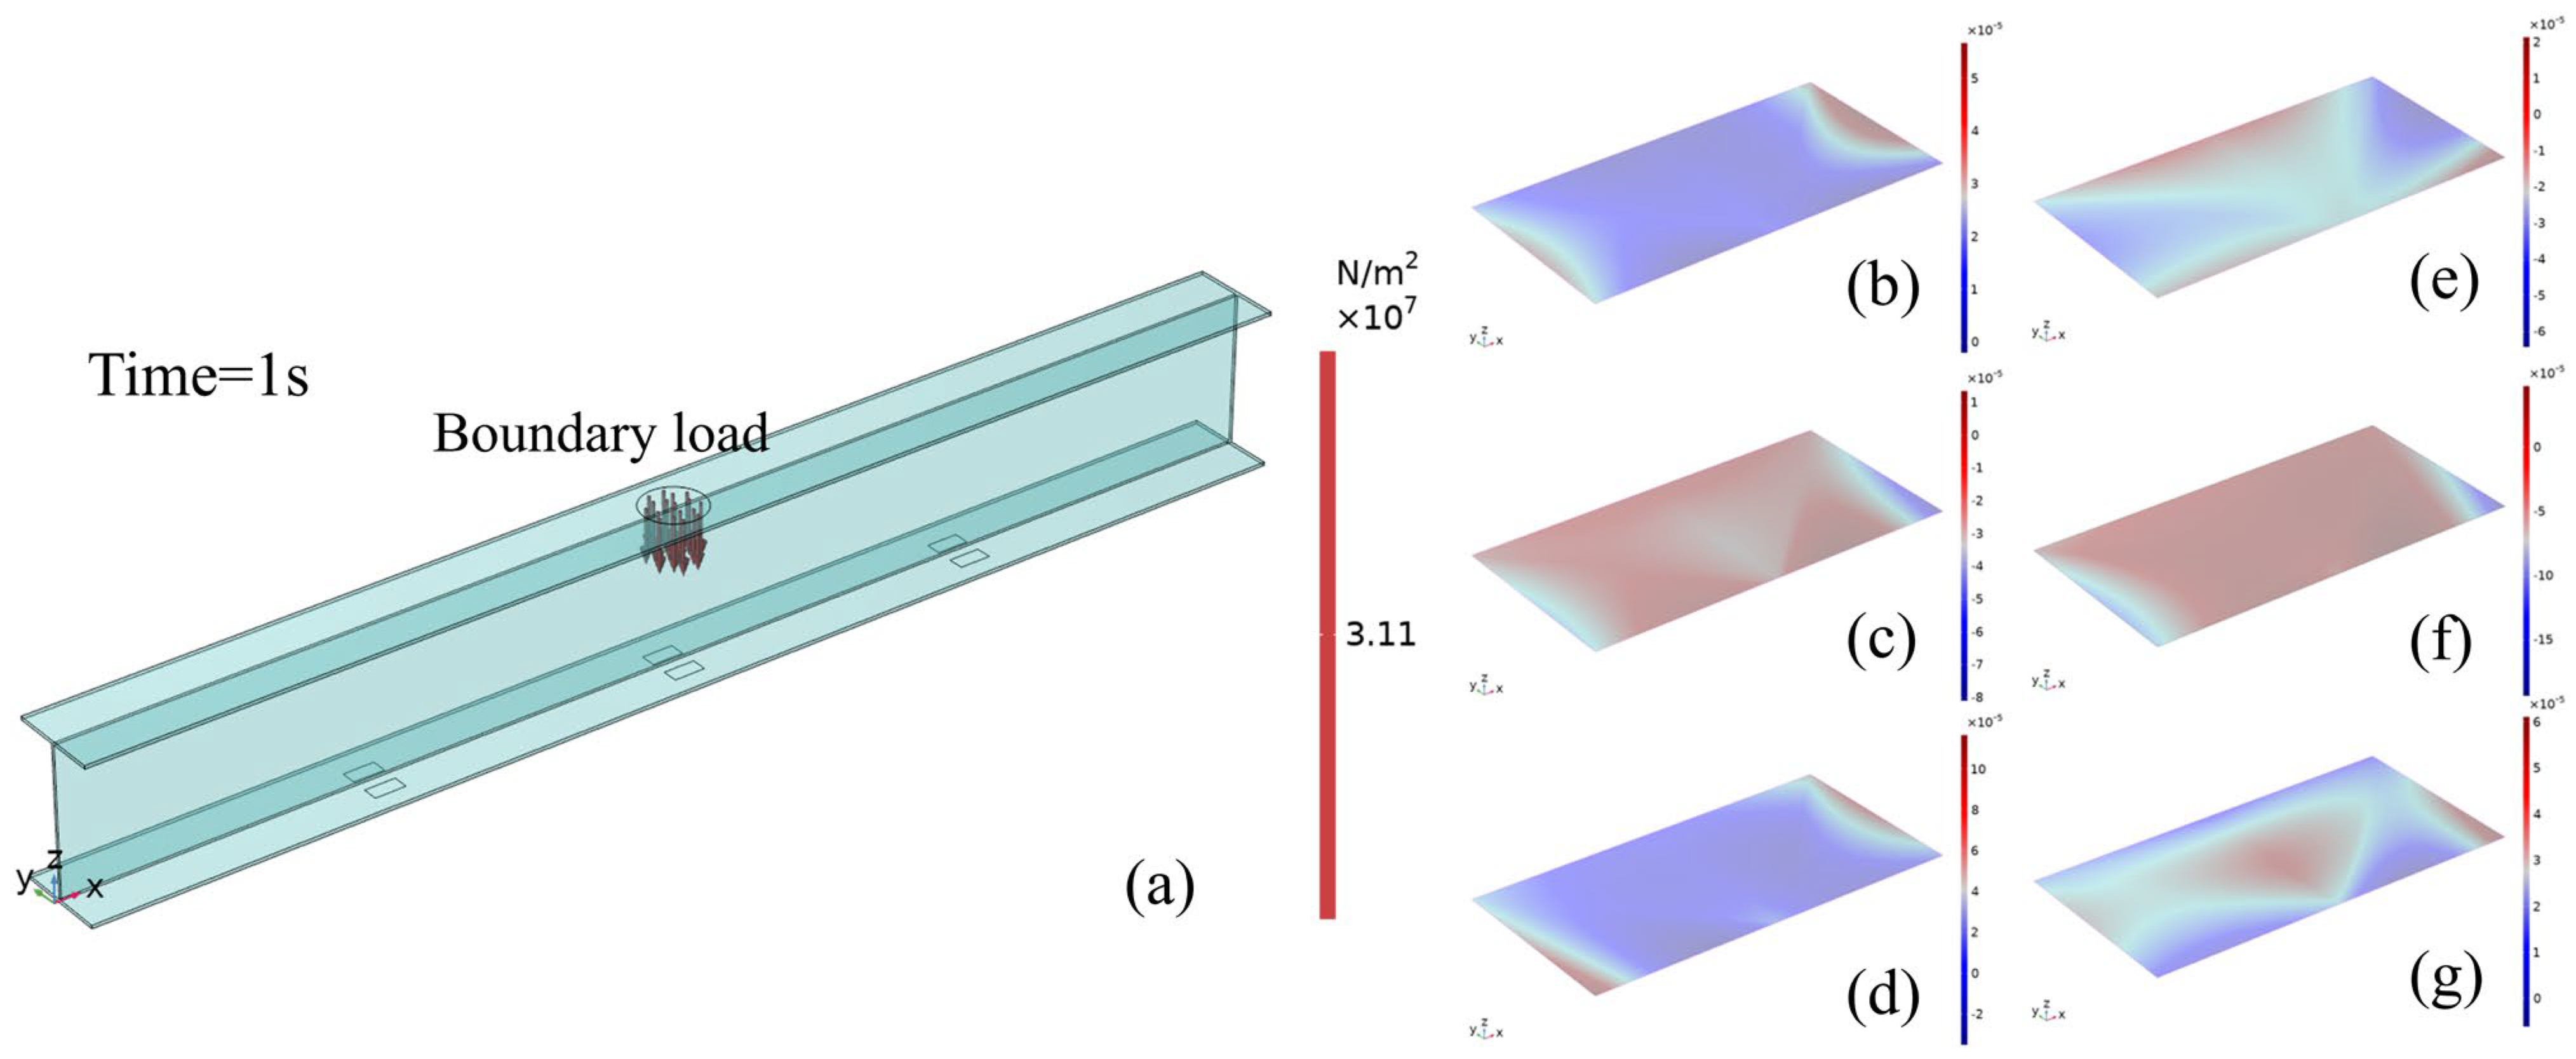
4.3. Model Establishment

In order to verify the accuracy of the sensor response in the test, a numerical calculation model of an I-steel beam suitable for different vibration loads was established based on COMSOL 6.0 finite element software, as shown in Figure 19. The model simulation grid contains 121,703 units, with a minimum mass of 0.2957 and an average mass of 0.5692. The piezoelectric layer was constructed using PMN-PT material. The specific material parameters are presented in Table 3 and Table 4. The model sensor is positioned in accordance with Figure 8. Fixed constraints are applied at both ends of the steel beam model to simulate the consolidation form. The piezoelectric layer of the sensor is set to be in the electrostatic physical field, and the remaining layer is the solid mechanical field. The lower surface of the piezoelectric layer is grounded, and the upper surface is the terminal. Finally, the solid mechanics and electrostatic physical field are coupled through the piezoelectric effect to complete the model establishment.

4.4. Comparative Analysis of Simulation and Experimental Results

4.4.1. Random Vibration

In order to verify the response law of the PMN-PT piezoelectric sensor under random excitation, a circular boundary load is applied to the local area of the surface of the I-steel beam model in order to simulate the actual loading of the load. The applied load curve is consistent with Section 4.1.1. As shown in Figure 20, Figure 20a is the steel beam model and the simulated load. Figure 20b–g illustrate the potential cloud diagram of sensors #1 to #6 at a time node of 1 s. The potential of the red area of the sensor section is positive, while the blue area is negative.
The COMSOL model is post-processed to derive the terminal voltage data and draw the sensor voltage time domain curve. The sensor voltage time history curve is subjected to Fourier transform to obtain the output voltage frequency domain curve of each sensor. The response frequency range is in the range of 0.02–55 Hz, with a concentration in the 2–55 Hz range. The voltage output curves of each sensor exhibit a high degree of stability, which is in accordance with the voltage output curve waveform observed in the experimental study. The voltage output peaks of each sensor are 1.65 V, 4.70 V, 1.75 V, 1.80 V, 4.62 V, and 2.07 V, respectively. The corresponding stress values are 1.04 MPa, 2.97 Mpa, 1.11 Mpa, 1.14 Mpa, 2.92 Mpa, and 1.31 Mpa, respectively. The results of the comparative test are presented in Figure 21. The maximum error of the output voltage peak of sensor #2 is 5.38%, and the maximum error of sensor #5 stress peak is 5.48%, both of which are within the allowable range of error.

4.4.2. Drop Hammer Impact

In order to verify the accuracy of the health monitoring response of the PMN-PT piezoelectric sensor under structural vibration impact, a simulation model of impact vibration is established. The loading mode is set to a step function with the same impact force as in 4.2 to simulate the actual drop hammer impact. Because the voltage change trend of the sensor at each drop hammer height is relatively consistent, the sensor characteristics at 20 cm drop hammer height are analyzed as an example. The interception time node is set to 1 s, and the sensor potential cloud map at a drop hammer height of 20 cm is shown in Figure 22. Figure 22a–f represent the potential cloud maps of sensors #1 to #6, respectively. Due to the stress change of the steel beam caused by the drop hammer impact, the positive and negative charges on the surface of the multi-layer material inside the sensor produce the opposite moving direction to form the potential difference.
The terminal voltage of the external circuit terminal is obtained by means of a post-processing function in COMSOL, and the time domain voltage output time domain curve of the sensor is drawn. The curve exhibits a similar change trend to that observed in the voltage time domain curve in the experimental study. The output signal undergoes a mutation when the drop hammer makes contact with the surface of the structure, reaching a peak value after 0.001 s. The peak voltages of each sensor are 0.64 V, 1.72 V, 0.75 V, 0.65 V, 1.89 V, and 0.80 V, respectively, after which the signal decreases to 0 V as the vibration disappears. The voltage frequency domain curve was obtained by Fourier transform. In comparison with the voltage frequency domain diagram from the experimental study, the maximum voltage amplitude was reached at the main frequency of 2.44 Hz. The maximum voltage amplitudes of sensors #2 and #5 were 0.35 V and 0.387 V, respectively. The curve exhibited a high degree of consistency with the frequency domain curve obtained from the test, with the overall trend becoming attenuated with increasing frequency.
The results of the comparison between the simulation and the test are presented in Figure 23. It is evident that as the drop hammer height increases, the discrepancy between the test value and the simulated value of the output voltage and stress of some sensors gradually widens. This is due to the fact that the finite element software is unable to simulate the same level of friction in the test machine as in the test process. The maximum discrepancy between the simulated and experimental values of the output voltage of each sensor at a drop hammer height of 20~80 cm is 4.56%, 3.89%, 3.86% and 4.12%, and the maximum discrepancy of the stress is 3.94%, 2.07%, 3.02%, 3.46%, all within the allowable error range. The results demonstrate a high degree of correlation between the impact vibration test response and the simulated response of the piezoelectric sensor. The sensor exhibits a stable voltage output under varying impact energy conditions. Furthermore, the theoretical stress value obtained through inversion calculation is consistent with the finite element simulation value, indicating a high degree of reliability.
The output voltage in this section is fitted with the stress simulation results, and the sensitivity fitting curve Figure 24 of each sensor is obtained. It is evident that the sensitivity of each sensor exhibits high linearity, with a linear fitting degree R2 exceeding 0.9. Furthermore, the sensitivity stability is excellent. The sensitivity results of each sensor are presented in Figure 25. Among these, the sensitivity of sensor #2 is the lowest, at 1.652 V/MPa, while the sensitivity of sensor #5 is the highest, at 1.763 V/MPa. When comparing the sensitivity test values of sensors #1~#6 with the finite element simulation values, the maximum error is only 4.8%, which is within the allowable range. This indicates that the sensor can ensure the accuracy and authenticity of the output signal during actual use. The sensor exhibits a relatively stable sensitivity, rendering it suitable for stress monitoring of steel beams under varying impact levels.

5. Conclusions

Based on the positive piezoelectric effect, this paper uses PMN-PT external sensors to carry out random vibration and impact loading stress monitoring tests on I-shaped scaled steel beams, and it uses finite element simulation to analyze the stress state of the steel beam under different loads. The following main conclusions are obtained:
(1)
A new PMN-PT sensor is designed, and calibration tests of the sensitivity and frequency response range are carried out. Compared with the PVDF sensor, the sensor has higher sensitivity and smaller fluctuations in the frequency range of 0–1000 Hz, indicating that the sensor has a wider applicable frequency range and stronger stability.
(2)
In the random vibration steel beam stress monitoring test, the waveform of the sensor output voltage in the time-frequency domain is consistent with the waveform of the low-frequency vibration load, and there is no phase difference. It has excellent performance in both high- and low-frequency environments and can provide real-time feedback on the stress change state of the steel beam. In the steel beam stress monitoring test under impact load, the delay of the sensor signal mutation relative to the drop hammer contacting the structural surface is only 0.001 s, which has good perception ability for 0~5 Mpa impact loads. At the same time, the linear sensitivity R2 of each sensor is above 0.9, indicating that PMN-PT is more sensitive to minor damage.
(3)
Comparing the finite element model with the steel beam stress monitoring test results, the maximum stress error is 5.38% under random vibration and 3.94% under impact vibration, both of which are within the allowable error range, indicating that the sensor can achieve accurate steel beam stress monitoring and has broad development prospects.
(4)
In future engineering applications, the sensor’s packaging form and wire connection method need to be further optimized to avoid wire breakage and PMN-PT sheet debonding during use, thereby improving the durability of the sensor. In addition, it is necessary to conduct on-site long-term monitoring tests on the vibration environment of large steel beams in the project to study the feasibility of using PMN-PT materials in actual projects.

Author Contributions

Conceptualization, H.K. and L.T.; methodology, Y.Z.; software, Z.Y.; validation, Q.W., H.K. and L.T.; data curation, L.T.; writing—original draft preparation, L.T.; writing—review and editing, L.T.; supervision, H.K. and L.Z. All authors have read and agreed to the published version of the manuscript.

Funding

This research received no external funding.

Data Availability Statement

The authors will make the raw data supporting this article’s conclusions available on request. Due to privacy concerns, the data are not publicly available.

Conflicts of Interest

Authors Lihua Tan, Zhiliang Yue and Qilong Wang were employed by the company No. Three Engineering Co., Ltd. of CCCC First Highway Engineering Co., Ltd. Author Yingjie Zhou was employed by the company Chongqing Wanzhou Economic and Technological Development Zone Construction and Development Co., Ltd. The remaining authors declare that the research was conducted in the absence of any commercial or financial relationships that could be construed as a potential conflict of interest.

References

  1. Sam, V.S.; Nammalvar, A.; Andrushia, D.; Gurupatham, B.G.A.; Roy, K. Flexural Behavior of Galvanized Iron Based Cold-Formed Steel Back-to-Back Built-Up Beams at Elevated Temperatures. Buildings 2024, 14, 2456. [Google Scholar] [CrossRef]
  2. Samuel, J.; Nair, S.R.; Joanna, P.S.; Gurupatham, B.G.A.; Roy, K.; Lim, J.B.P. Composite cold-formed steel beams with diagonal rebars for earthquake-resistant buildings. Materials 2023, 16, 3002. [Google Scholar] [CrossRef] [PubMed]
  3. Fan, W.; Qiao, P. Vibration-based damage identification methods: A review and comparative study. Struct. Health Monit. 2011, 10, 83–111. [Google Scholar] [CrossRef]
  4. Ben Seghier, M.E.A.; Knudsen, O.Ø.; Skilbred, A.W.B.; Höche, D. An intelligent framework for forecasting and investigating corrosion in marine conditions using time sensor data. npj Mater. Degrad. 2023, 7, 91. [Google Scholar] [CrossRef]
  5. Roy, K.; Ananthi, G.B.G. Sustainable Composite Construction Materials; MDPI-Multidisciplinary Digital Publishing Institute: Basel, Switzerland, 2023. [Google Scholar]
  6. Abbas, M.; Shafiee, M. Structural health monitoring (SHM) and determination of surface defects in large metallic structures using ultrasonic guided waves. Sensors 2018, 18, 3958. [Google Scholar] [CrossRef]
  7. Garrido, I.; Lagüela, S.; Arias, P. Infrared thermography’s application to infrastructure inspections. Infrastructures 2018, 3, 35. [Google Scholar] [CrossRef]
  8. Doshvarpassand, S.; Wu, C.; Wang, X. An overview of corrosion defect characterization using active infrared thermography. Infrared Phys. Technol. 2019, 96, 366–389. [Google Scholar] [CrossRef]
  9. Glisic, B. Concise historic overview of strain sensors used in the monitoring of civil structures: The first one hundred years. Sensors 2022, 22, 2397. [Google Scholar] [CrossRef]
  10. Arango, M.A.P.; Mendez, H.F.G.; Pardo, I.E.D. Crack Detection Using An Electromagnetic Sensor-Antenna For Structures. In Proceedings of the Congreso Internacional de Innovación y Tendencias en Ingenieria (CONIITI), Bogota, Colombia, 2–4 October 2019; IEEE: Piscataway, NJ, USA, 2019; pp. 1–6. [Google Scholar]
  11. García, I.; Zubia, J.; Durana, G. Optical fiber sensors for aircraft structural health monitoring. Sensors 2015, 15, 15494–15519. [Google Scholar] [CrossRef]
  12. Silva, K.K.S.; Silva, F.A.N.; Mahfoud, T. On the Use of Embedded Fiber Optic Sensors for Measuring Early-Age Strains in Concrete. Sensors 2021, 21, 4171. [Google Scholar] [CrossRef]
  13. Wang, B.; Zhong, S.; Lee, T. Non-destructive testing and evaluation of composite materials/structures: A state-of-the-art review. Adv. Mech. Eng. 2020, 12, 1687814020913761. [Google Scholar] [CrossRef]
  14. Khedmatgozar Dolati, S.S.; Caluk, N.; Mehrabi, A. Non-destructive testing applications for steel bridges. Appl. Sci. 2021, 11, 9757. [Google Scholar] [CrossRef]
  15. Tuschl, C.; Oswald-Tranta, B.; Eck, S. Inductive thermography as non-destructive testing for railway rails. Appl. Sci. 2021, 11, 1003. [Google Scholar] [CrossRef]
  16. Kylili, A.; Fokaides, P.A.; Christou, P. Infrared thermography (IRT) applications for building diagnostics: A review. Appl. Energy 2014, 134, 531–549. [Google Scholar] [CrossRef]
  17. Yao, Y.; Glisic, B. Detection of steel fatigue cracks with strain sensing sheets based on large area electronics. Sensors 2015, 15, 8088–8108. [Google Scholar] [CrossRef] [PubMed]
  18. Imai, M.; Nakano, R.; Kono, T. Crack detection application for fiber reinforced concrete using BOCDA-based optical fiber strain sensor. J. Struct. Eng. 2010, 136, 1001–1008. [Google Scholar] [CrossRef]
  19. Kang, I.; Schulz, M.J.; Kim, J.H. A carbon nanotube strain sensor for structural health monitoring. Smart Mater. Struct. 2006, 15, 737. [Google Scholar] [CrossRef]
  20. Micro-Measurements, V. Strain gage installations for concrete structures. Appl. Note TT 2007, 611, 217–220. [Google Scholar]
  21. Gkantou, M.; Muradov, M.; Kamaris, G.S. Novel electromagnetic sensors embedded in reinforced concrete beams for crack detection. Sensors 2019, 19, 5175. [Google Scholar] [CrossRef]
  22. López-Higuera, J.M.; Cobo, L.R.; Incera, A.Q. Fiber optic sensors in structural health monitoring. J. Light. Technol. 2011, 29, 587–608. [Google Scholar] [CrossRef]
  23. Fang, Z.; Chin, K.; Qu, R. Fundamentals of Optical Fiber Sensors; John Wiley & Sons: Hoboken, NJ, USA, 2012. [Google Scholar]
  24. Barrias, A.R.; Casas, J.; Villalba, S. Embedded distributed optical fiber sensors in reinforced concrete structures—A case study. Sensors 2018, 18, 980. [Google Scholar] [CrossRef]
  25. Fischer, O.; Thoma, S.; Crepaz, S. Distributed fiber optic sensing for crack detection in concrete structures. Civ. Eng. Des. 2019, 1, 97–105. [Google Scholar] [CrossRef]
  26. Wang, D.; Li, Q.; Zhu, H. Experimental and Numerical Study on Damage Detection in I-type Steel Beam Based on PZT Admittance Signals. In Earth and Space 2010: Engineering, Science, Construction, and Operations in Challenging Environments; American Society of Civil Engineers: Reston, VA, USA, 2010; pp. 2369–2375. [Google Scholar]
  27. Qiao, H.Y.; Li, J.C.; Lin, L. Quantitatively characterizing damages on steel beams by using PZT impedance method. In Materials Science Forum; Trans Tech Publications Ltd.: Wollerau, Switzerland, 2011; Volume 675, pp. 1135–1138. [Google Scholar]
  28. Du, G.; Zhang, J.; Zhang, J. Experimental study on stress monitoring of sand-filled steel tube during impact using piezoceramic smart aggregates. Sensors 2017, 17, 1930. [Google Scholar] [CrossRef]
  29. Aabid, A.; Parveez, B.; Raheman, M.A. A review of piezoelectric material-based structural control and health monitoring techniques for engineering structures: Challenges and opportunities. Actuators 2021, 10, 101. [Google Scholar] [CrossRef]
  30. Mrlík, M.; Osička, J.; Cvek, M. Comparative study of PVDF sheets and their sensitivity to mechanical vibrations: The role of dimensions, molecular weight, stretching and poling. Nanomaterials 2021, 11, 1637. [Google Scholar] [CrossRef] [PubMed]
  31. Fotouhi, S.; Akrami, R.; Ferreira-Green, K. Piezoelectric PVDF sensor as a reliable device for strain/load monitoring of engineering structures. In IOP Conference Series: Materials Science and Engineering; IOP Publishing: Bristol, UK, 2019; Volume 659, p. 012085. [Google Scholar]
  32. Hong, Y.K.; Park, H.K.; Lee, S.Q. Design and performance of a self-sensing, self-actuating piezoelectric monomorph with interdigitated electrodes. In Optomechatronic Sensors, Actuators, and Control; SPIE: San Francisco, CA, USA, 2004; Volume 5602, pp. 210–217. [Google Scholar]
  33. Wang, W.; Zhang, H.; Lynch, J.P. Numerical and experimental simulation of linear shear piezoelectric phased arrays for structural health monitoring. In Nondestructive Characterization and Monitoring of Advanced Materials, Aerospace, and Civil Infrastructure; SPIE: San Francisco, CA, USA, 2017; Volume 10169, pp. 233–242. [Google Scholar]
  34. Lv, P.; Qian, J.; Yang, C. Flexible all-inorganic Sm-doped PMN-PT film with ultrahigh piezoelectric coefficient for mechanical energy harvesting, motion sensing, and human-machine interaction. Nano Energy 2022, 97, 107182. [Google Scholar] [CrossRef]
  35. Sun, C.; Qin, L.; Li, F. Piezoelectric energy harvesting using single crystal Pb (Mg1/3Nb2/3) O 3-xPbTiO3 (PMN-PT) device. J. Intell. Mater. Syst. Struct. 2009, 20, 559–568. [Google Scholar]
  36. Zhao, X.; Li, H. Health monitoring of reinforced concrete frame-shear wall using piezoceramic transducer. J. Vib. Shock 2006, 25, 82–84. [Google Scholar]
  37. Zhang, L.S.; Liu, Y.B.; Pan, C.L. Leakage current characterization and compensation for piezoelectric actuator with charge drive. Sens. Actuators A Phys. 2013, 199, 116–122. [Google Scholar] [CrossRef]
Figure 1. Frame structure of this study.
Buildings 14 02831 g001
Figure 2. Polarization diagram of piezoelectric material. (1, 2, 3 are three directions of normal stress of piezoelectric material, 4, 5, 6 are three directions of shear stress).
Buildings 14 02831 g002
Figure 3. Specimen size and sensor paste position diagram.
Buildings 14 02831 g003
Figure 4. Loading diagram of sensor performance test.
Buildings 14 02831 g004
Figure 5. (a) MTS loading curve of sensitivity test; (b) stress–voltage time–history curve of 0.5 mm adhesive layer.
Buildings 14 02831 g005
Figure 6. Sensitive fitting of 0.5 mm adhesive layer sensor.
Buildings 14 02831 g006
Figure 7. Voltage output response of PMN-PT sensor.
Buildings 14 02831 g007
Figure 8. Stress–voltage time–history curve of 0.5 mm adhesive layer.
Buildings 14 02831 g008
Figure 9. Steel beam structure and test diagram.
Buildings 14 02831 g009
Figure 10. (a) Time domain loading curve; (b) Frequency domain loading curve.
Buildings 14 02831 g010
Figure 11. The output time domain curve of PMN-PT sensor under random vibration.
Buildings 14 02831 g011
Figure 12. The output frequency domain curve of PMN-PT sensor under random vibration.
Buildings 14 02831 g012
Figure 13. Drop hammer impact system.
Buildings 14 02831 g013
Figure 14. Time domain curve of PMN-PT sensor output at 20 cm drop hammer height.
Buildings 14 02831 g014
Figure 15. Frequency domain curve of sensor output at 20 cm drop hammer height.
Buildings 14 02831 g015
Figure 16. The peak voltage of each sensor at different drop hammer heights.
Buildings 14 02831 g016
Figure 17. (a) Peak stress of different drop hammer height; (b) peak stress of each sensor.
Buildings 14 02831 g017
Figure 18. (a) Sensitivity fitting of sensor under impact vibration; (b) sensitivity of each sensor under impact vibration.
Buildings 14 02831 g018
Figure 19. Steel beam and sensor paste model.
Buildings 14 02831 g019
Figure 20. Loading simulation and sensor potential cloud diagram. (a) loading simulation; (bg) is the simulated potential cloud diagram of 1~6 sensors.
Buildings 14 02831 g020
Figure 21. (a) Peak voltage comparison; (b) peak stress comparison.
Buildings 14 02831 g021
Figure 22. Sensor potential cloud diagram under drop hammer impact. (af) is sensor number 1~6.
Buildings 14 02831 g022
Figure 23. (a) Sensor output voltage comparison diagram; (b) theoretical stress contrast diagram.
Buildings 14 02831 g023
Figure 24. Simulation of sensor sensitivity fitting under impact vibration.
Buildings 14 02831 g024
Figure 25. (a) Comparison of sensor sensitivity under impact vibration; (b) sensitivity error of sensor under impact vibration.
Buildings 14 02831 g025
Table 1. Voltage and stress peak under random load.
Sensor Number#1#2#3#4#5#6
Voltage (V)1.574.461.881.714.811.97
Stress (N/mm2)1.012.861.211.103.081.26
Table 2. Drop hammer impact loading system.
Falling Weight HeightThe Initial Velocity of the Structure Surface (m/s)Impact Energy (J)Impact Force (N)
20 cm1.9619.2500
40 cm3.9276.81000
60 cm5.88172.91500
80 cm7.84307.32000
Table 3. Material parameters used in simulation calculation.
MaterialYoung s’ Modulus (Gpa)Poisson’s RatioDensity/(kg × m−1)
Protective layer0.020.381200
Electrode layer700.337800
Bonding layer0.020.381200
Table 4. Piezoelectric material parameter settings in the model.
Material PropertiesParameter ValueUnitDimension
Density8100kg/m31 × 1
Relative dielectric constant{S11, S12, S13} = [1.65 × 10⁻¹¹, −4.78 × 10⁻¹², −8.45 × 10⁻¹²]-1 × 3
Elastic matrix{ε11, ε22, ε33} = [5500, 5500, 6000]1/Pa6 × 6
Coupling matrix{d31, d32, d33, d15} = [−8 × 10⁻¹⁰, −8 × 10⁻¹⁰, 1.435 × 10⁻⁹, 6 × 10⁻¹⁰]C/N3 × 6
Disclaimer/Publisher’s Note: The statements, opinions and data contained in all publications are solely those of the individual author(s) and contributor(s) and not of MDPI and/or the editor(s). MDPI and/or the editor(s) disclaim responsibility for any injury to people or property resulting from any ideas, methods, instructions or products referred to in the content.

