
A Prediction Model for the Unconfined Compressive Strength of Pervious Concrete Based on Mix Design and Compaction Energy Variables Using the Response Surface Methodology

 , , and
Abstract
1. Introduction
2. Materials and Methods
2.1. Materials
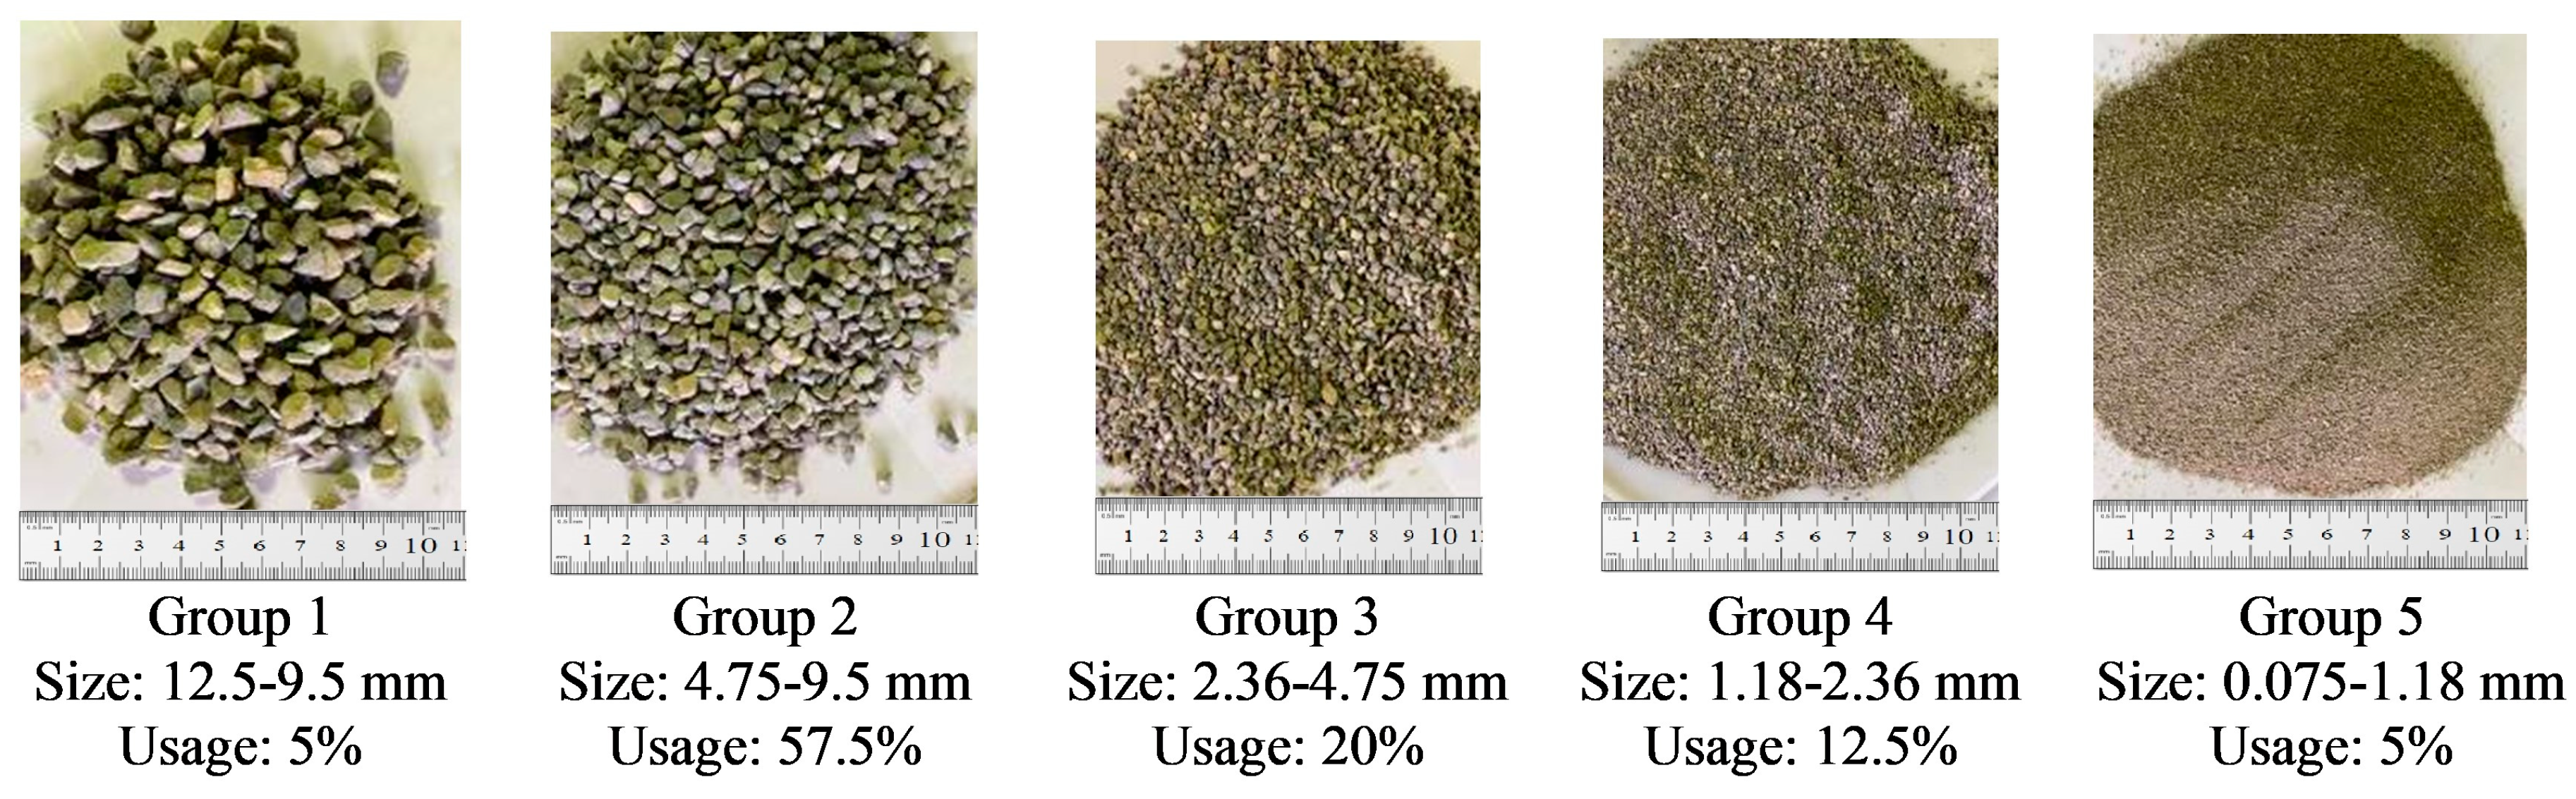
2.1.1. Aggregates
2.1.2. Cementitious Materials
2.1.3. Preparation of Test Conditions and VeBe Apparatus
2.2. Methods
2.2.1. Phases of Experiments
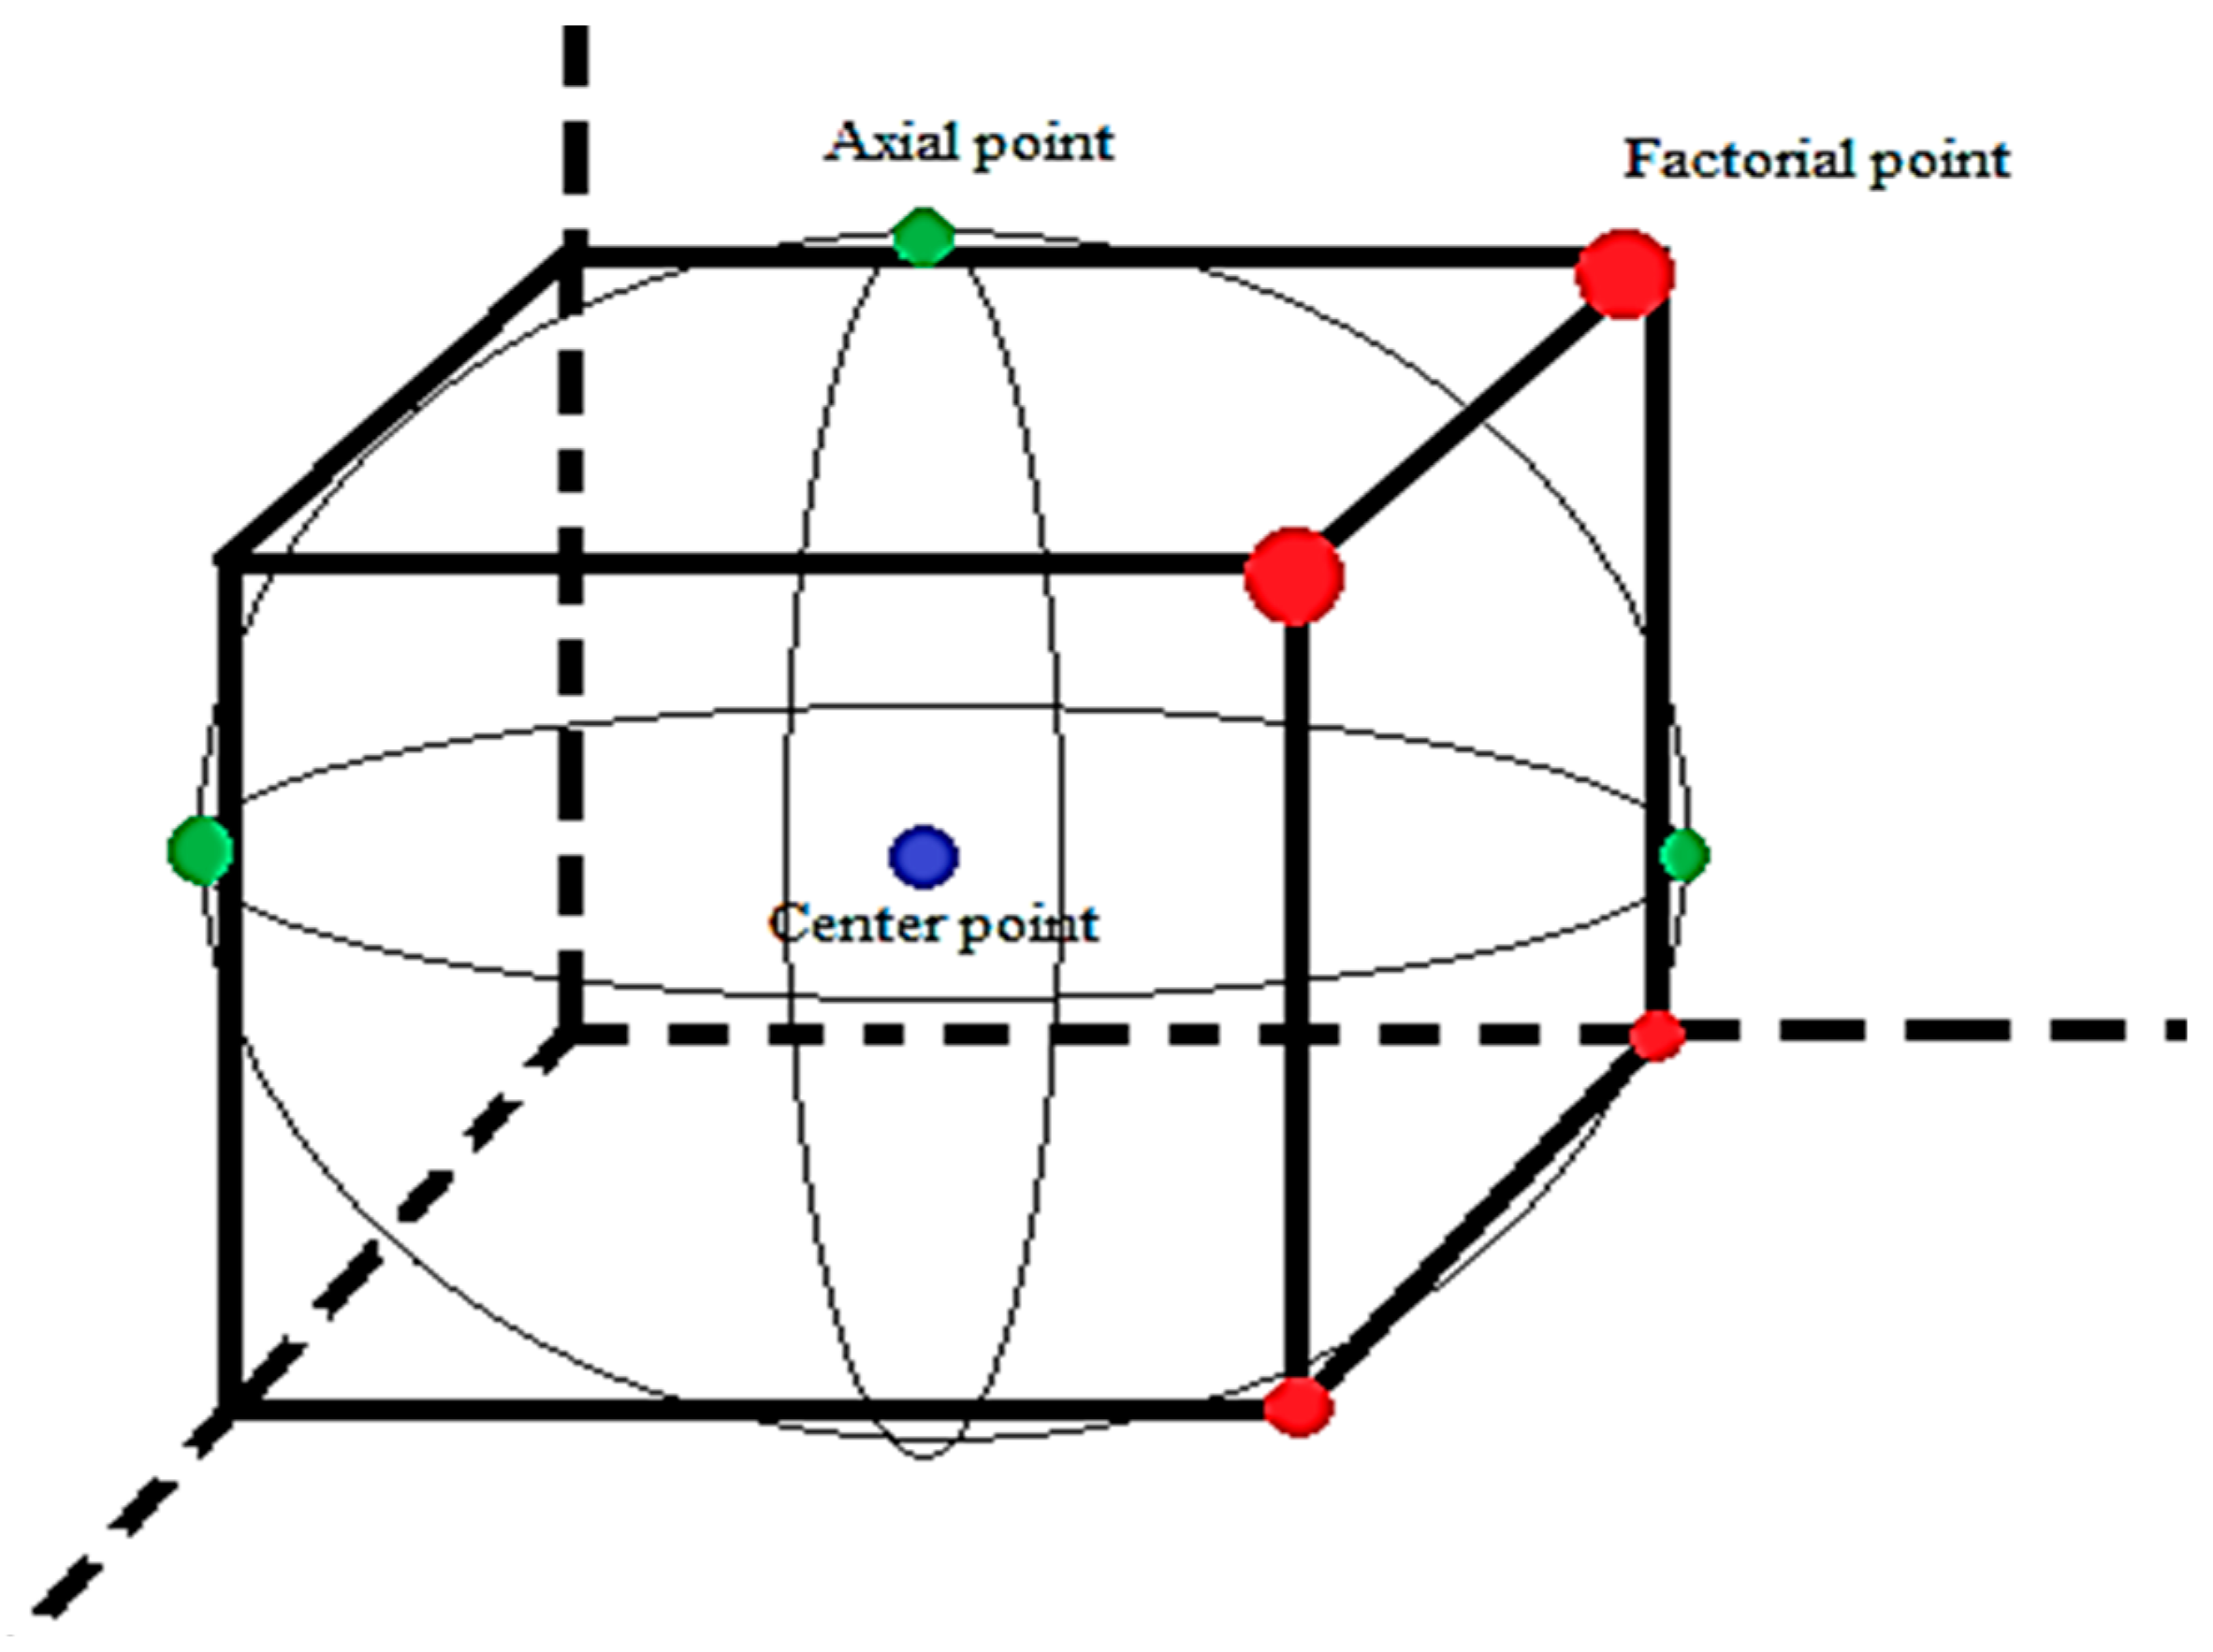
2.2.2. Response Surface Methodology (RSM) for Determining Mix Designs
2.2.3. Analyzing the Results
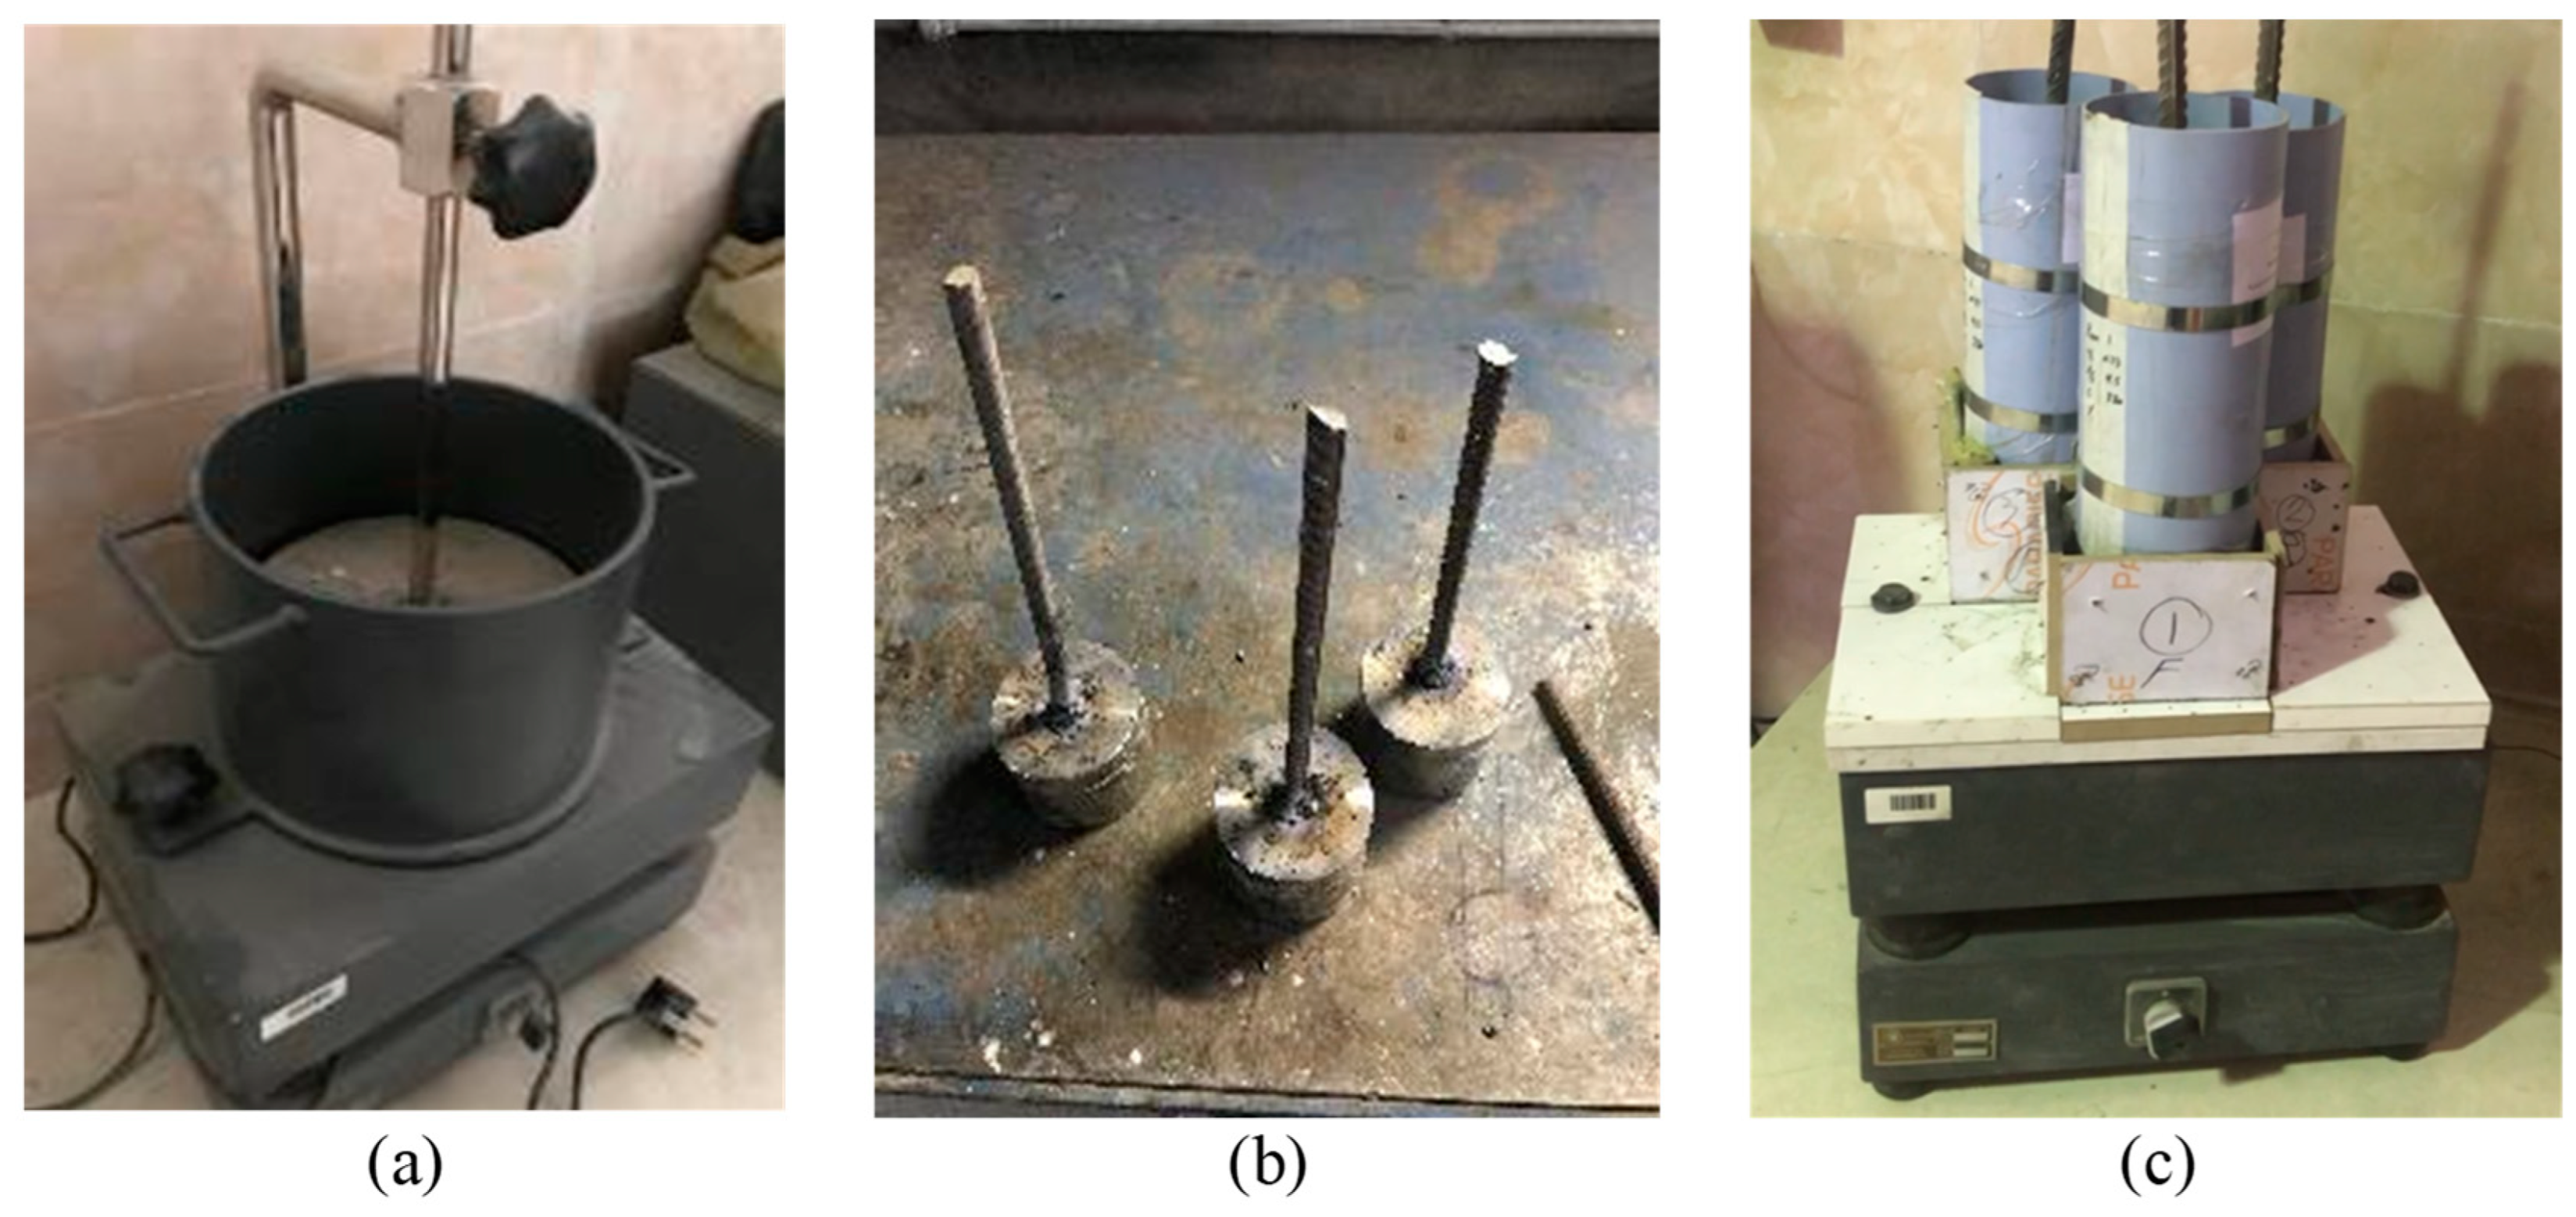
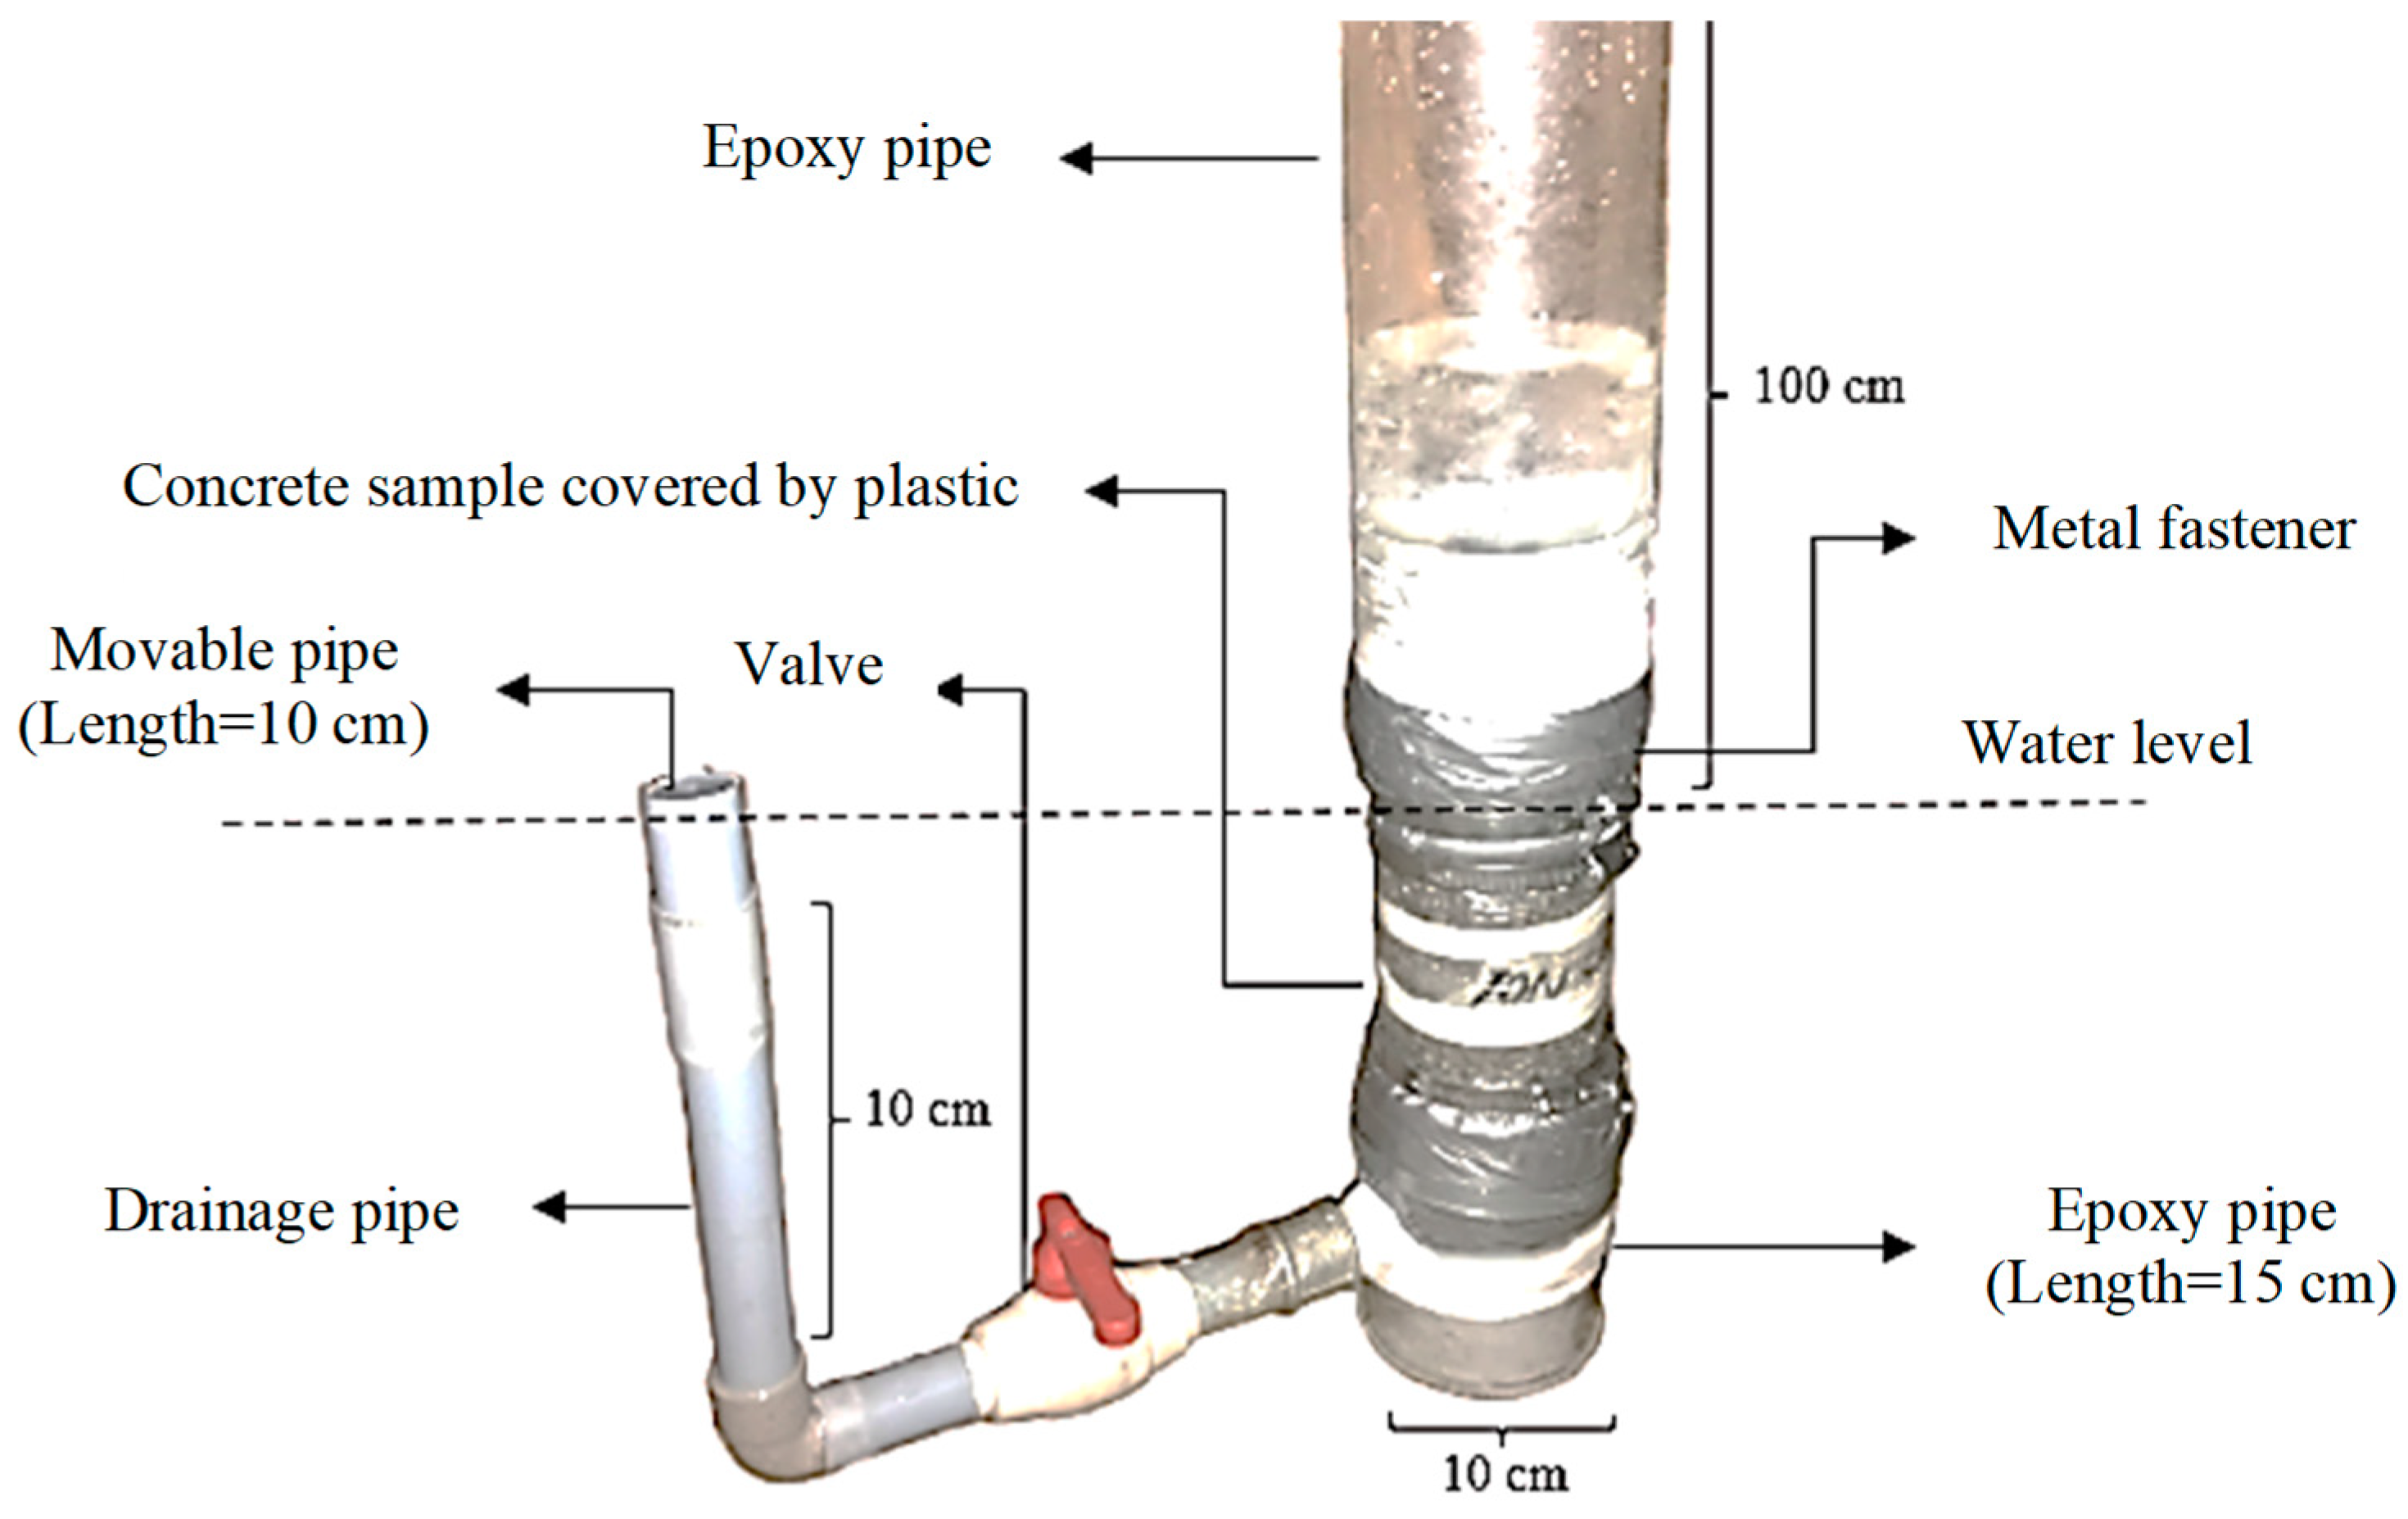
2.2.4. Porosity, Permeability, and UCS Experiments
3. Results and Discussion
3.1. Phase I
3.2. Phase II
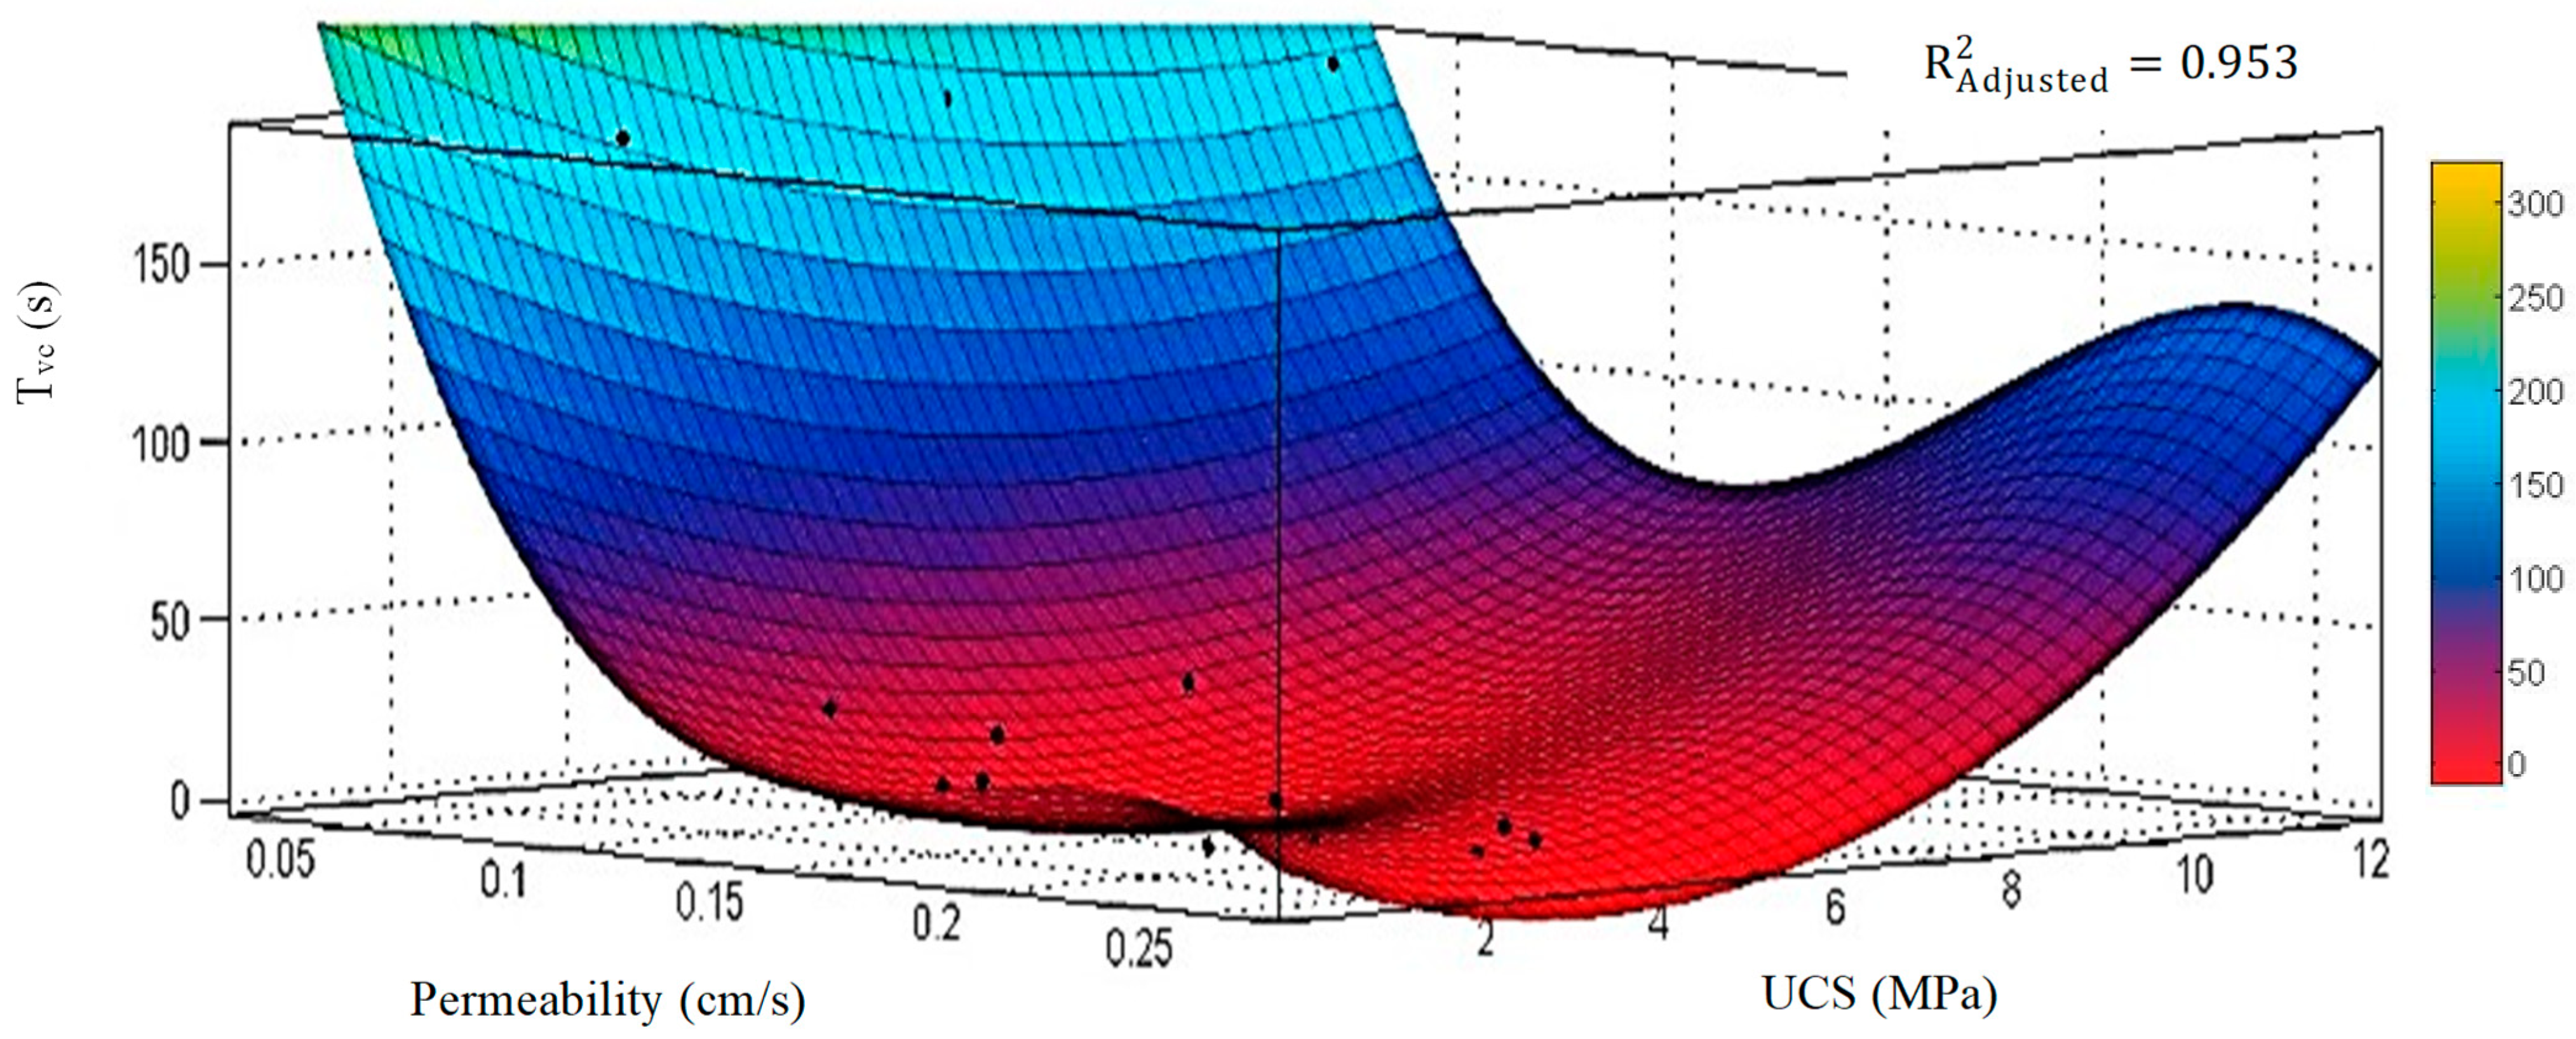
3.2.1. Developing a Regression Model for the UCS of Pervious Concrete
3.2.2. Sensitivity, Prediction Analyses, and Pore Dispersion
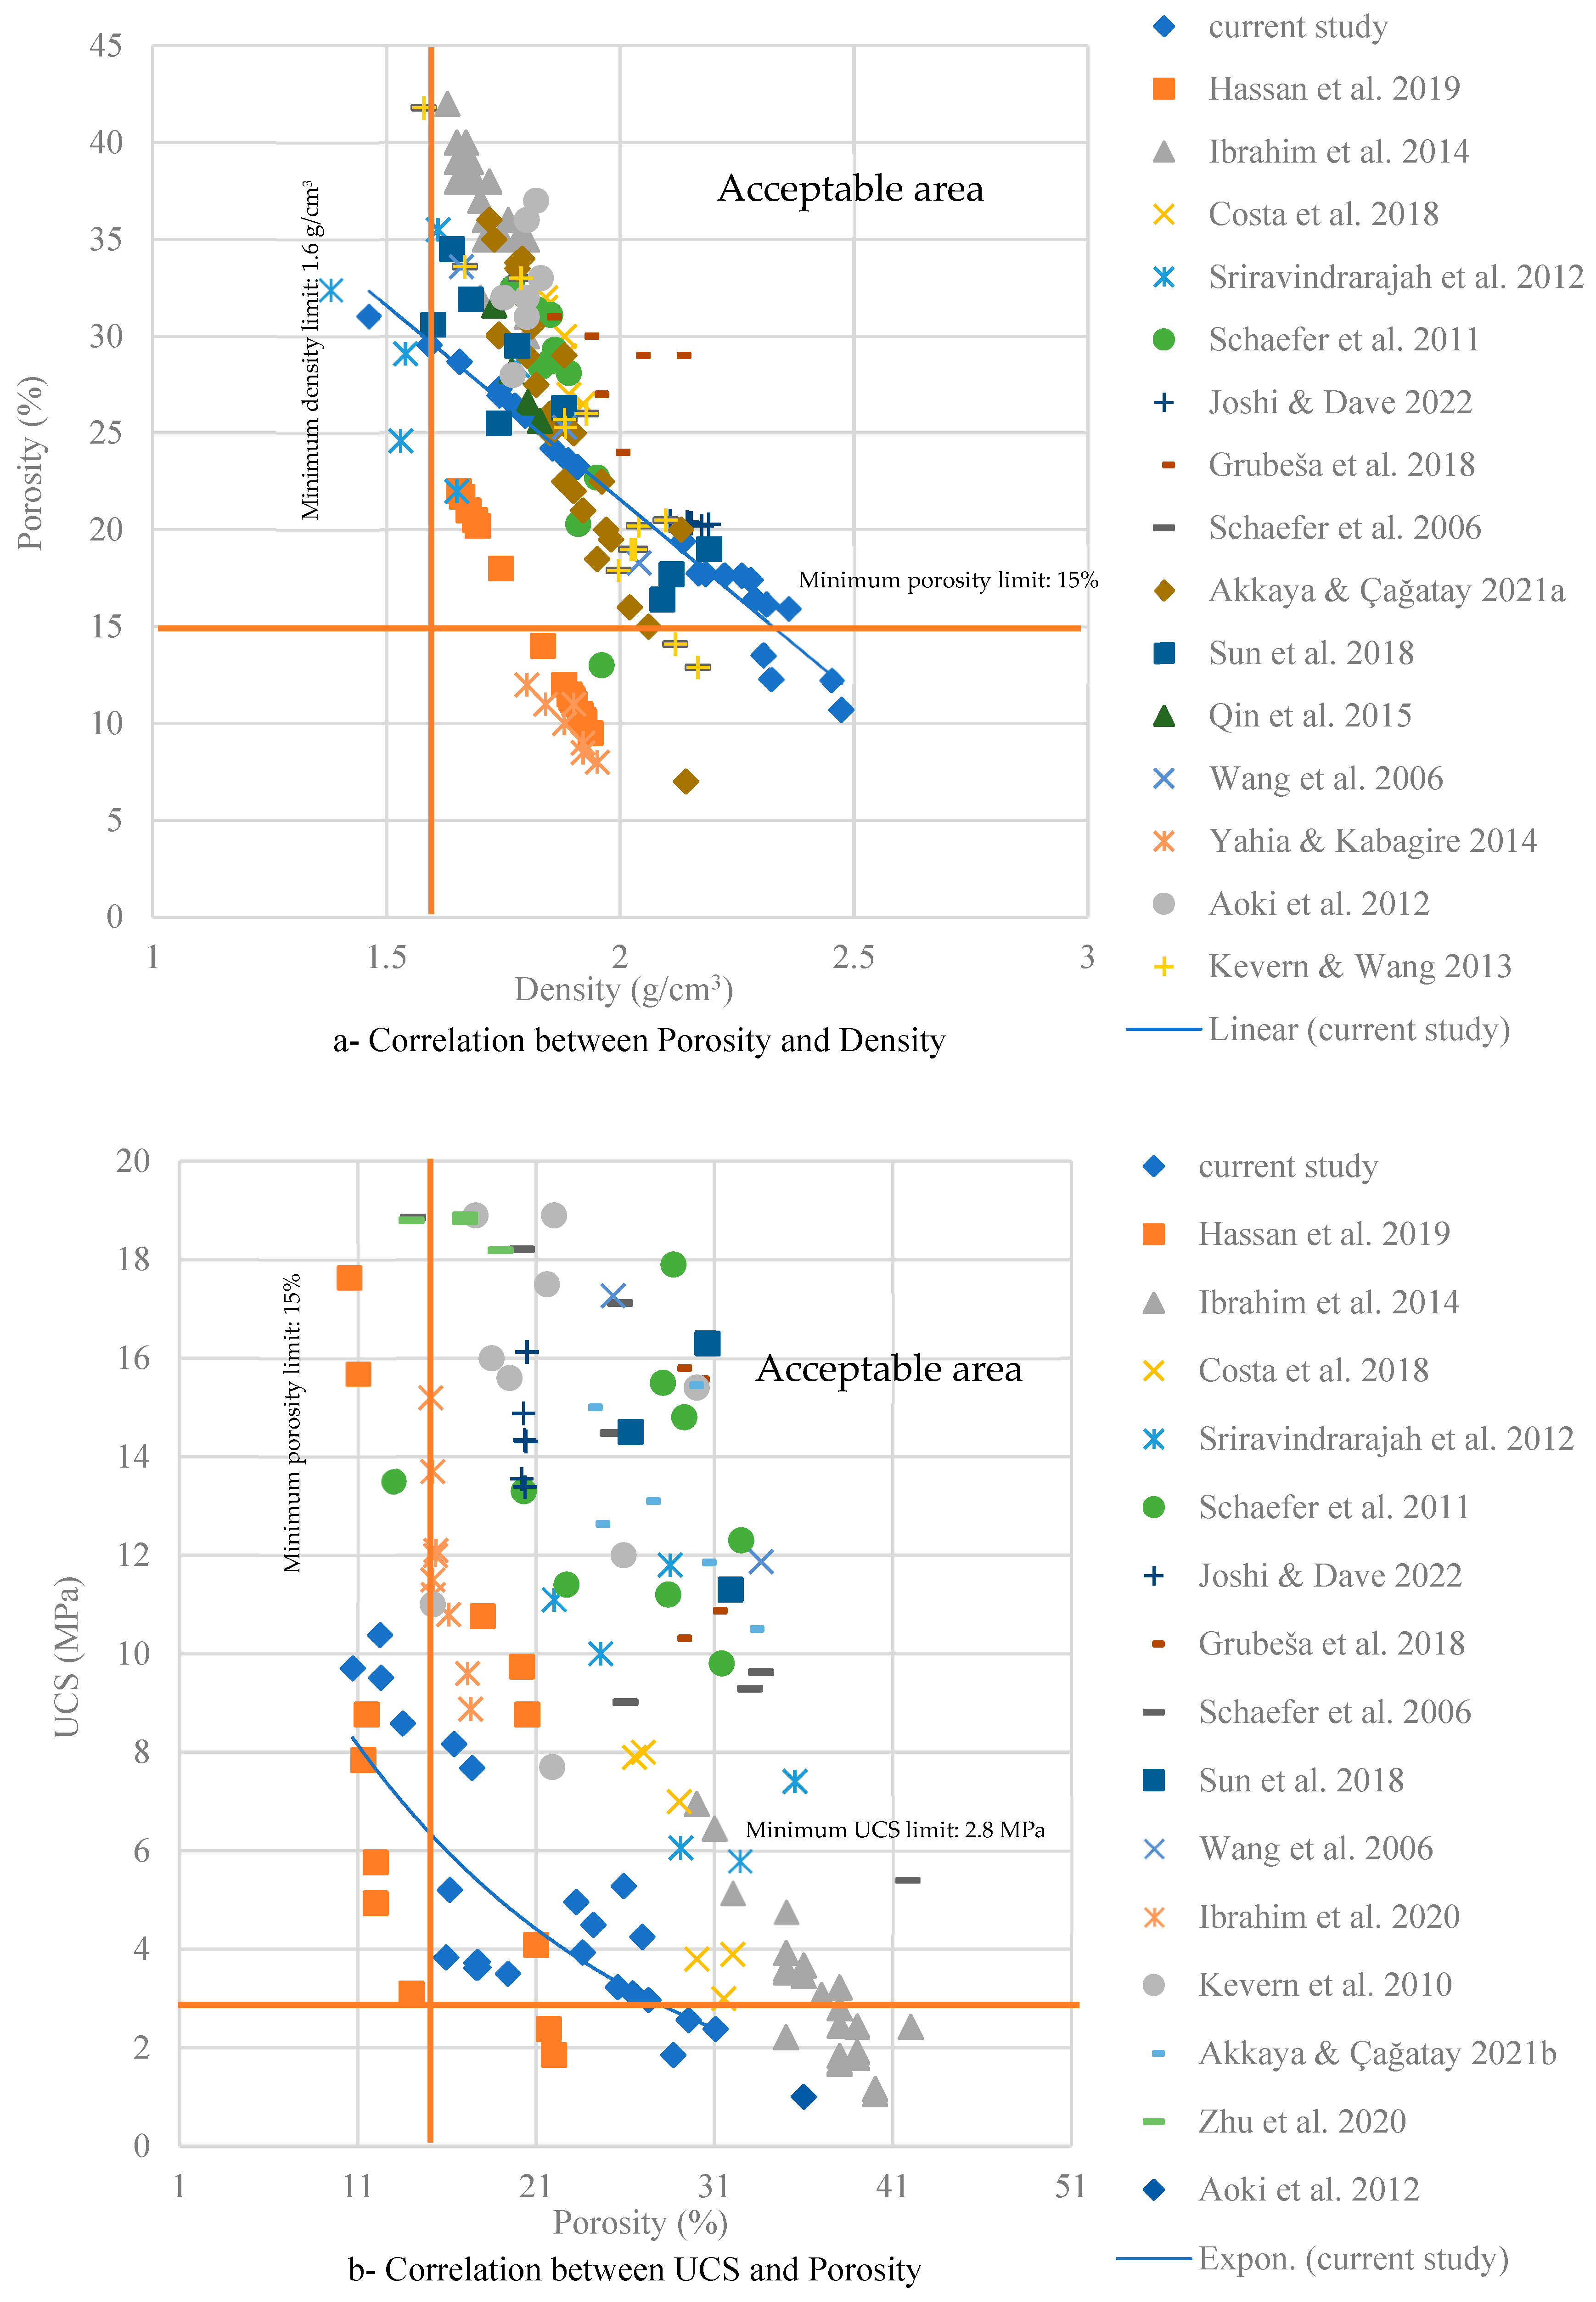
3.2.3. Comparison of UCS Prediction Models Reported in Various Studies
3.2.4. Failure Modes Observed in UCS Tests
3.2.5. Determining the Recommended Mix Designs
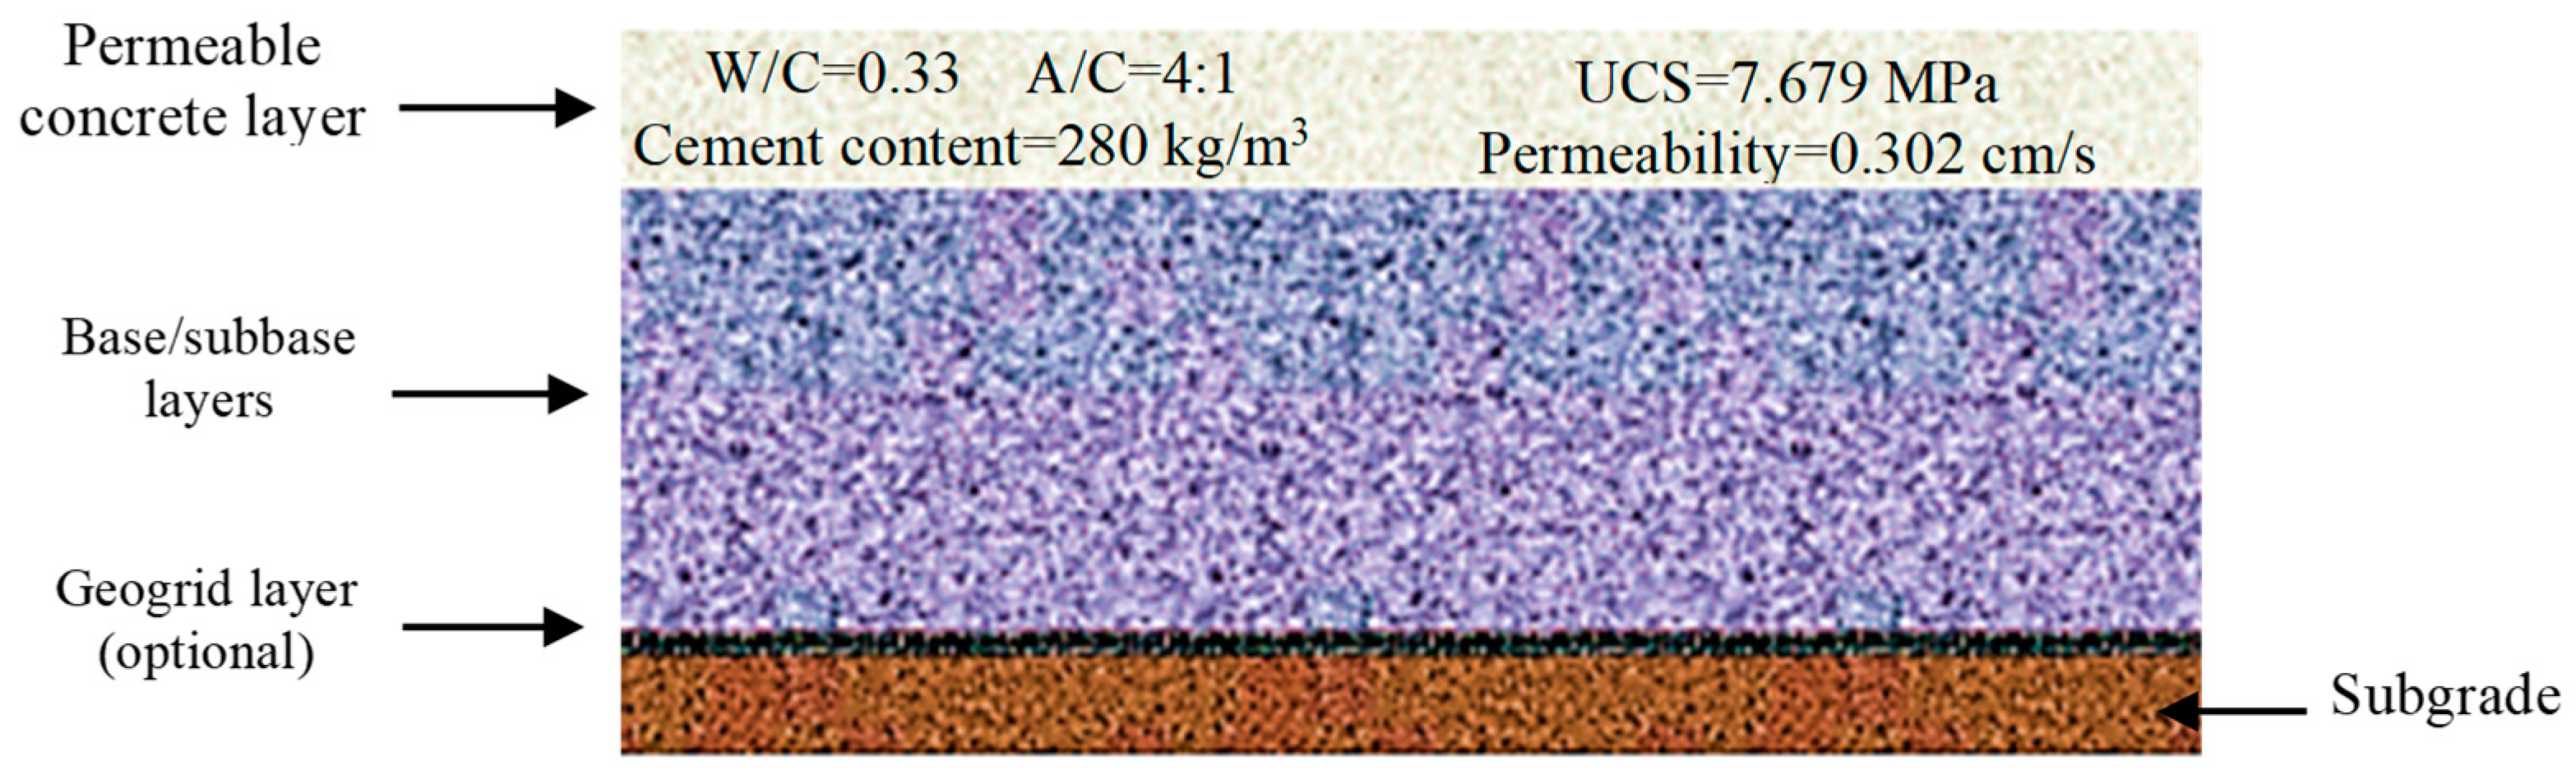
3.2.6. Preliminary Schematic of a Pervious Concrete Structure
4. Conclusions
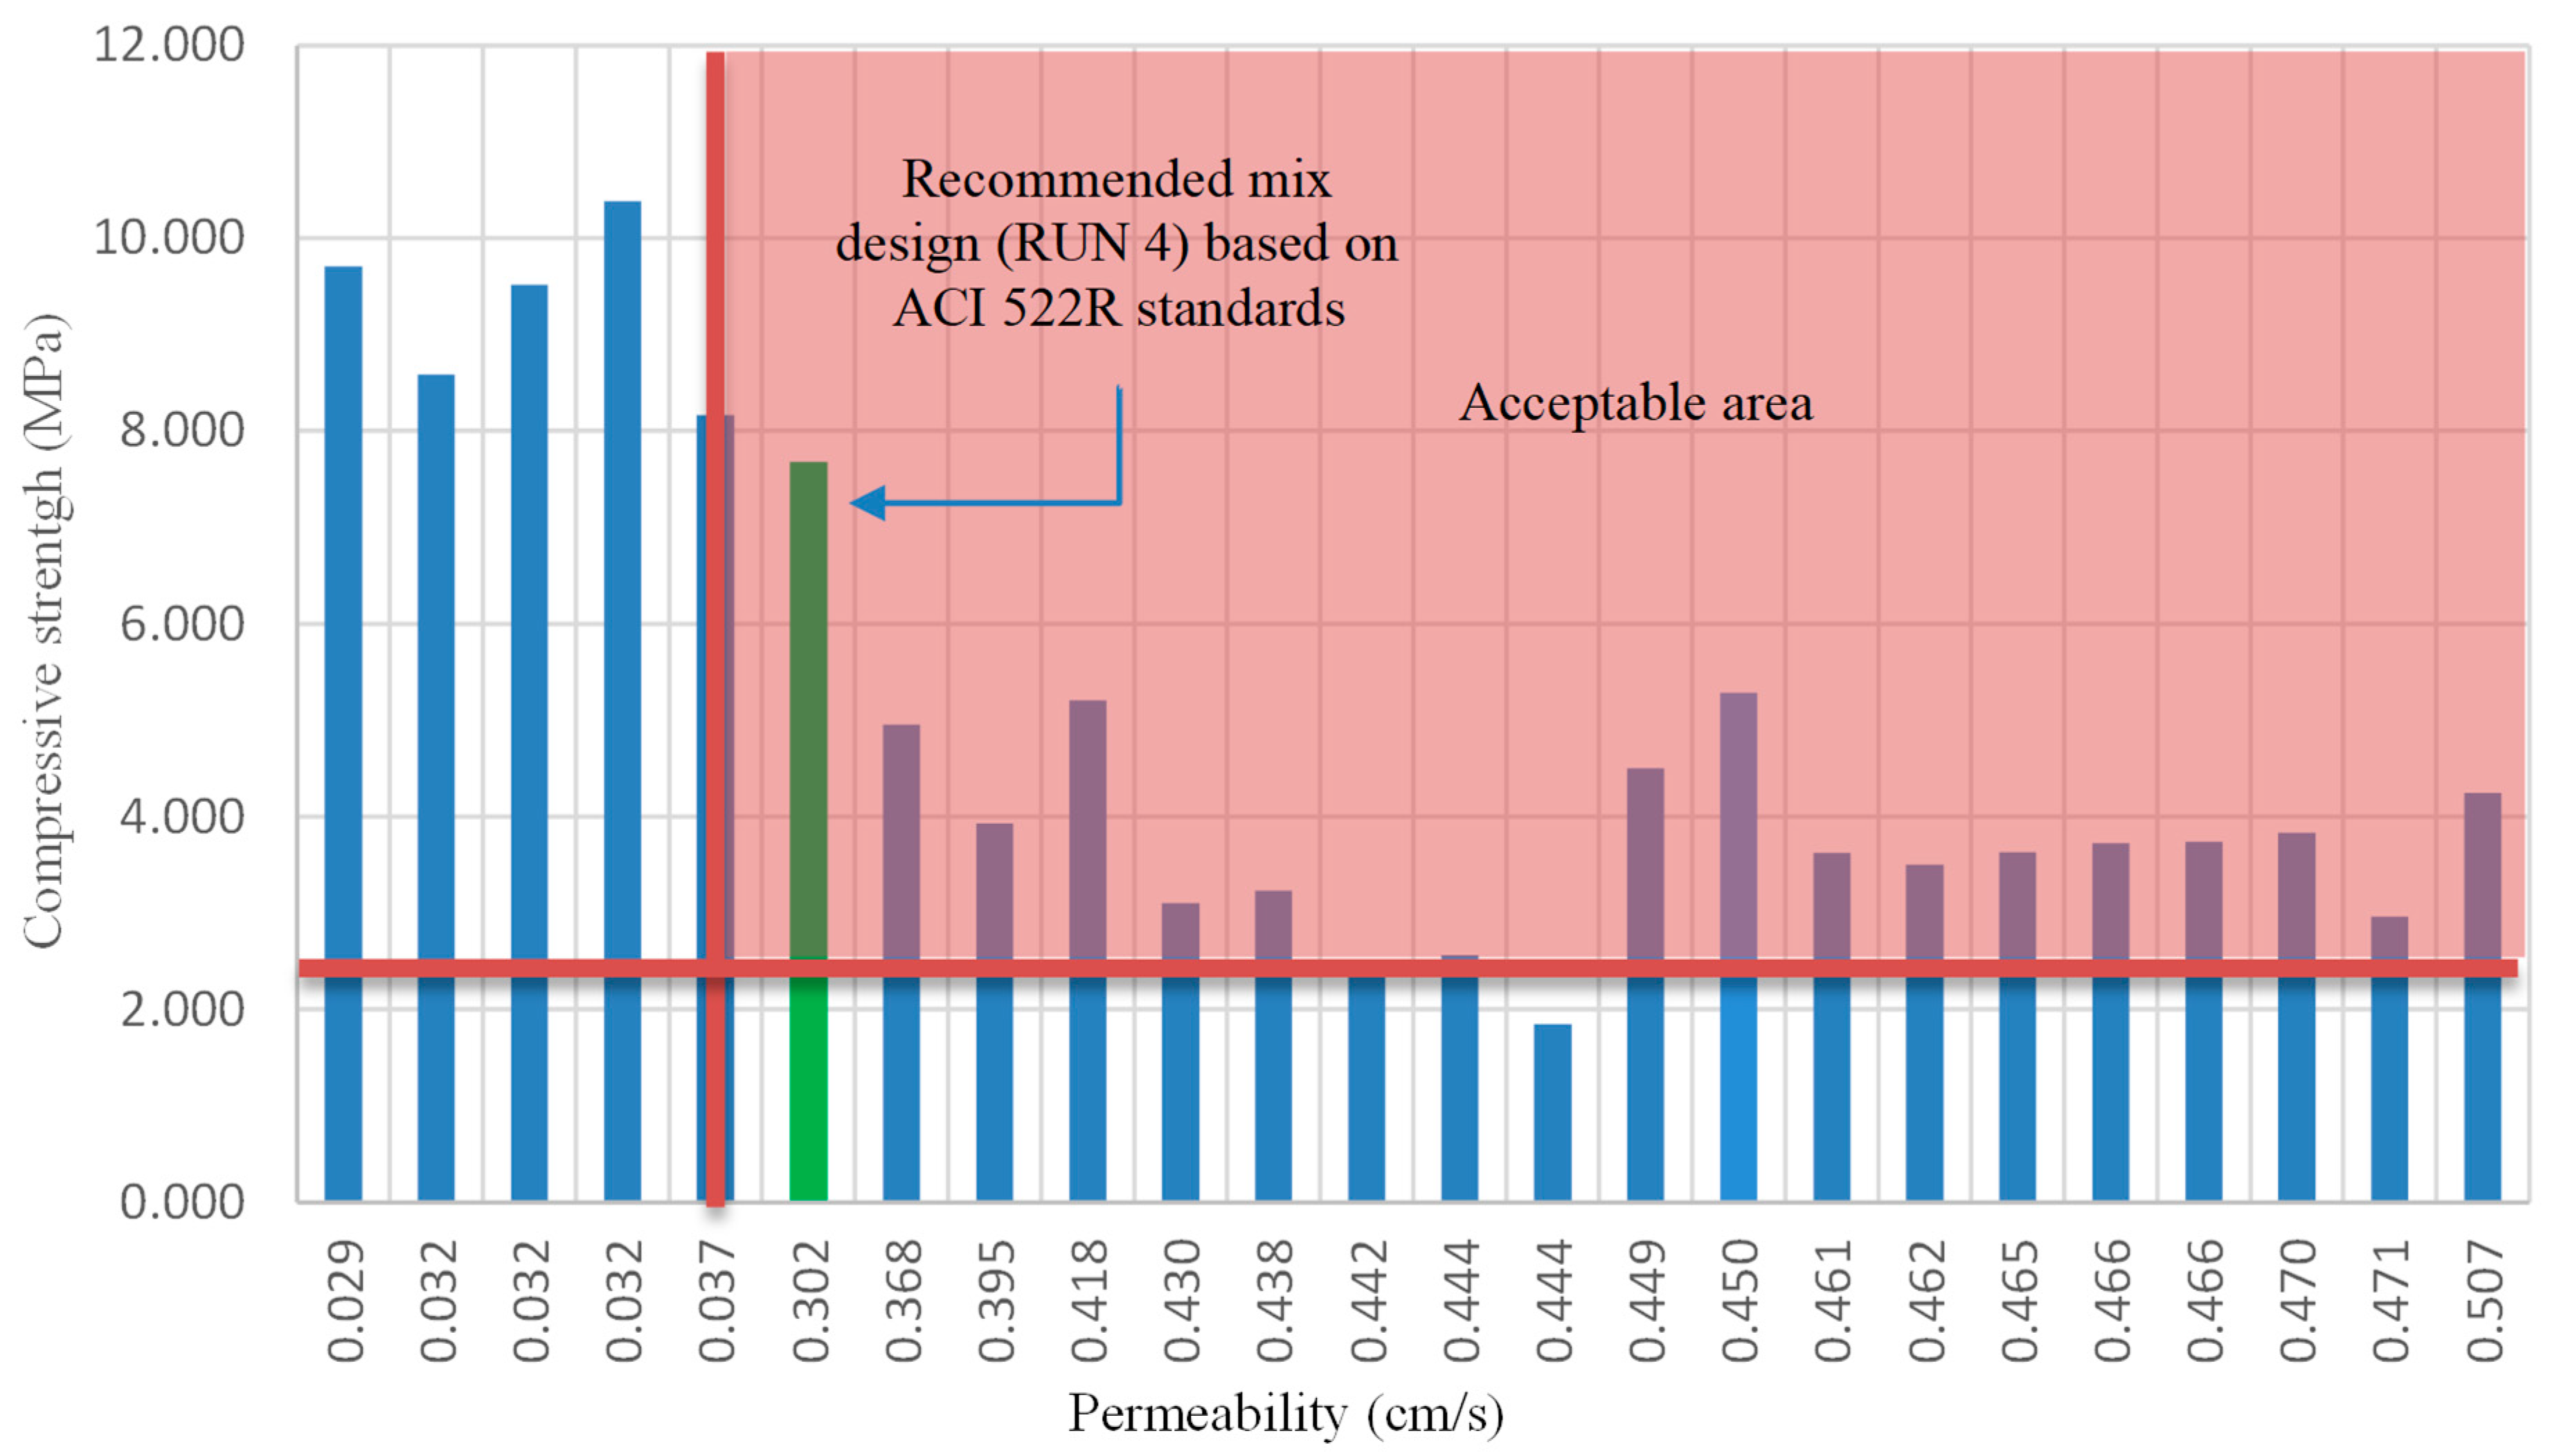
- Based on the ACI 522R criteria, Run 4 emerged as the recommended mixture for the pervious concrete layer. This mix comprised a water-to-cement ratio of 0.33, an aggregate-to-cement ratio of 4.00, and a cement content of 280.00 kg/m3. It achieved a UCS of 7.68 MPa, a permeability of 0.302 cm/s, a porosity of 17.4%, and a density of 2.28 g/cm3, making it suitable for low-traffic applications.
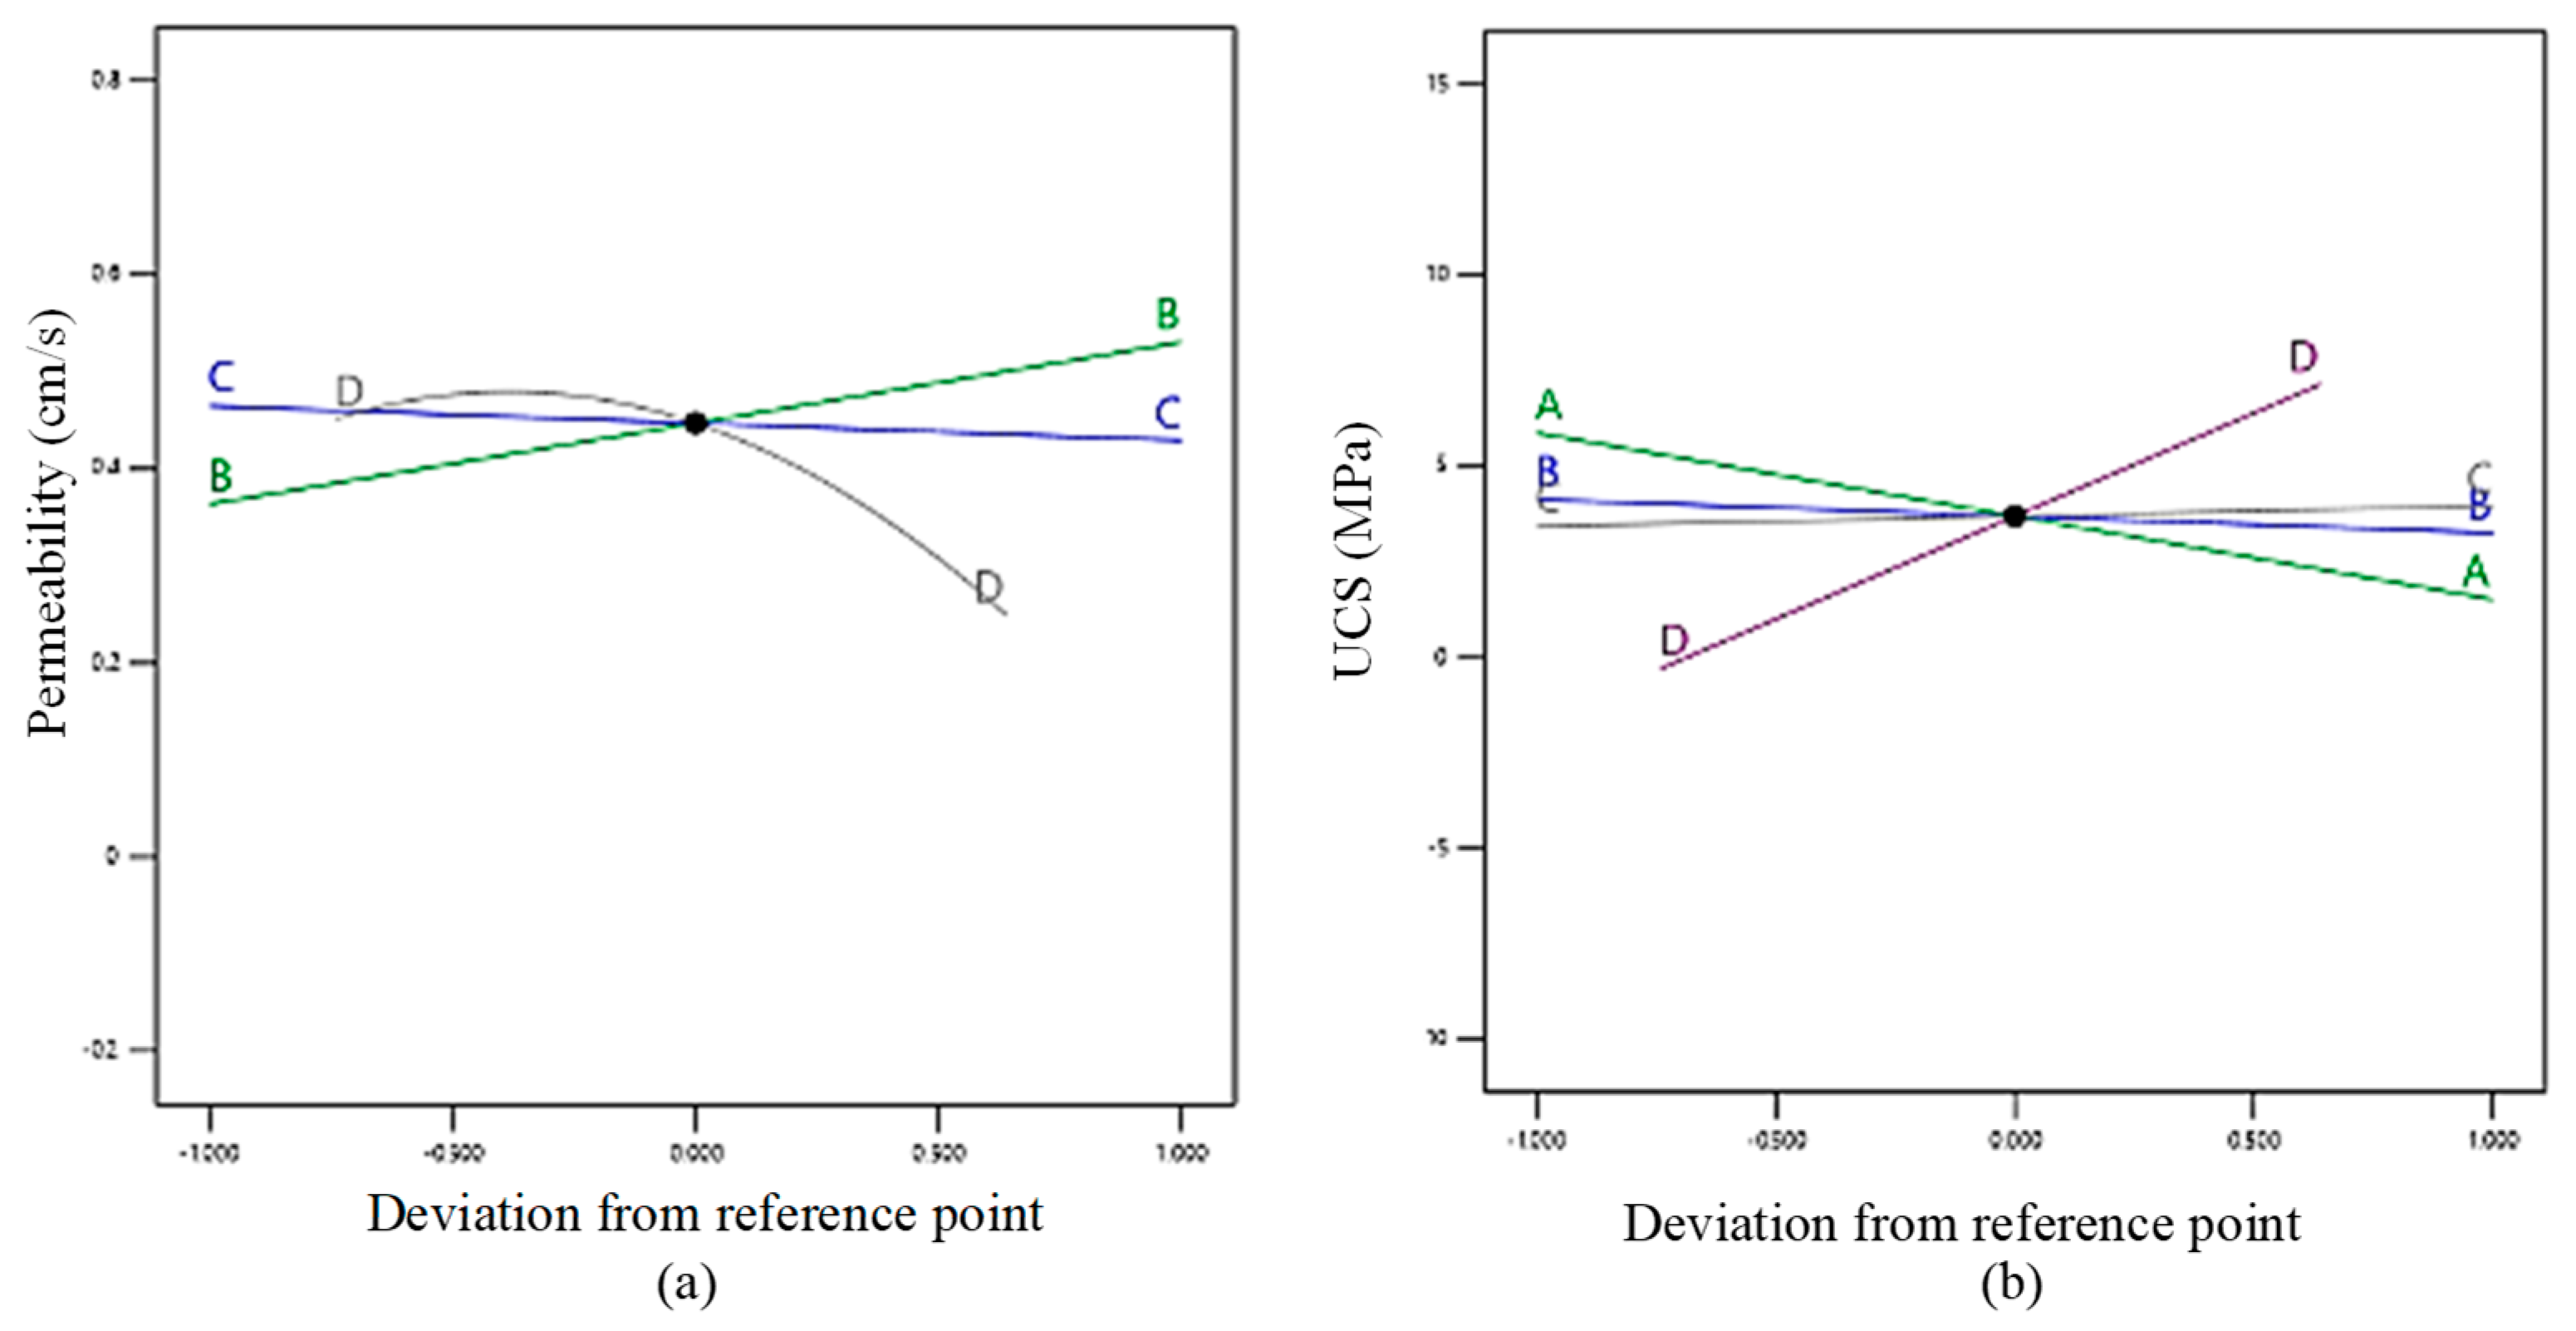
- The established UCS model demonstrated a good fit (R2 = 0.878). Sensitivity analysis revealed that the compaction energy had the most significant influence on the UCS, followed by the water-to-cement ratio. This suggests that compaction can potentially enhance strength while reducing cement content.
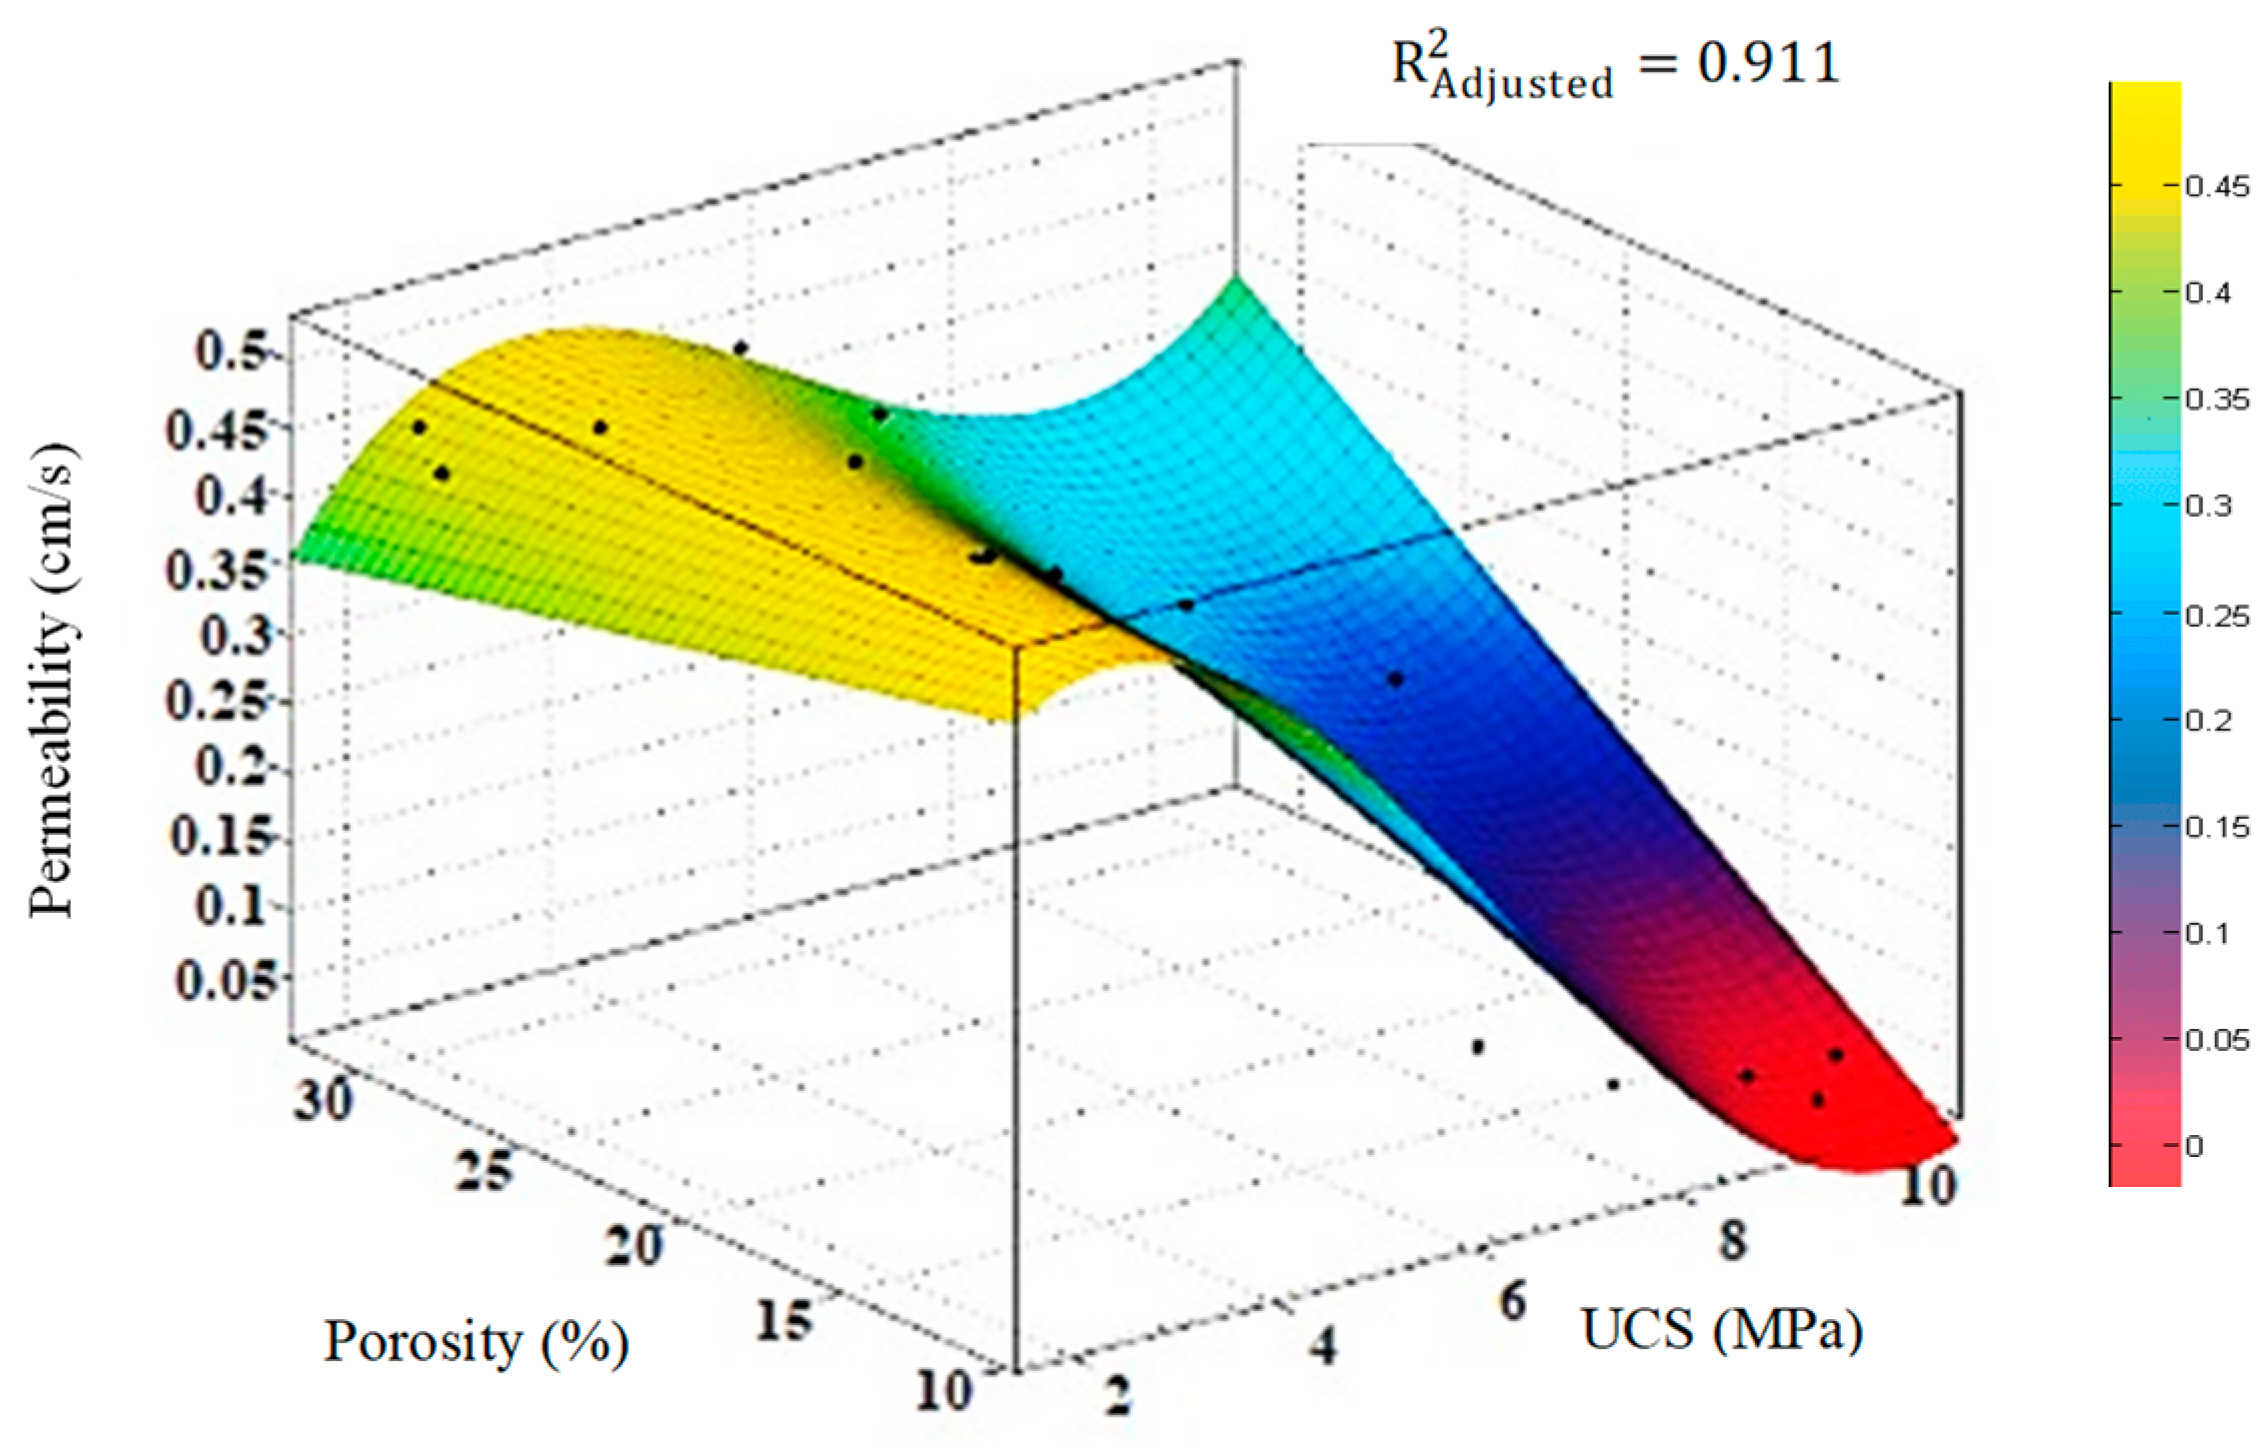
- The compaction energy level significantly influenced the mechanical and permeability properties. An increase in the compaction time from 13 to 82 s resulted in an increase in the UCS from 1.851 to 10.38 MPa, while the permeability decreased from approximately 0.4 cm/s to nearly 0.03 cm/s.
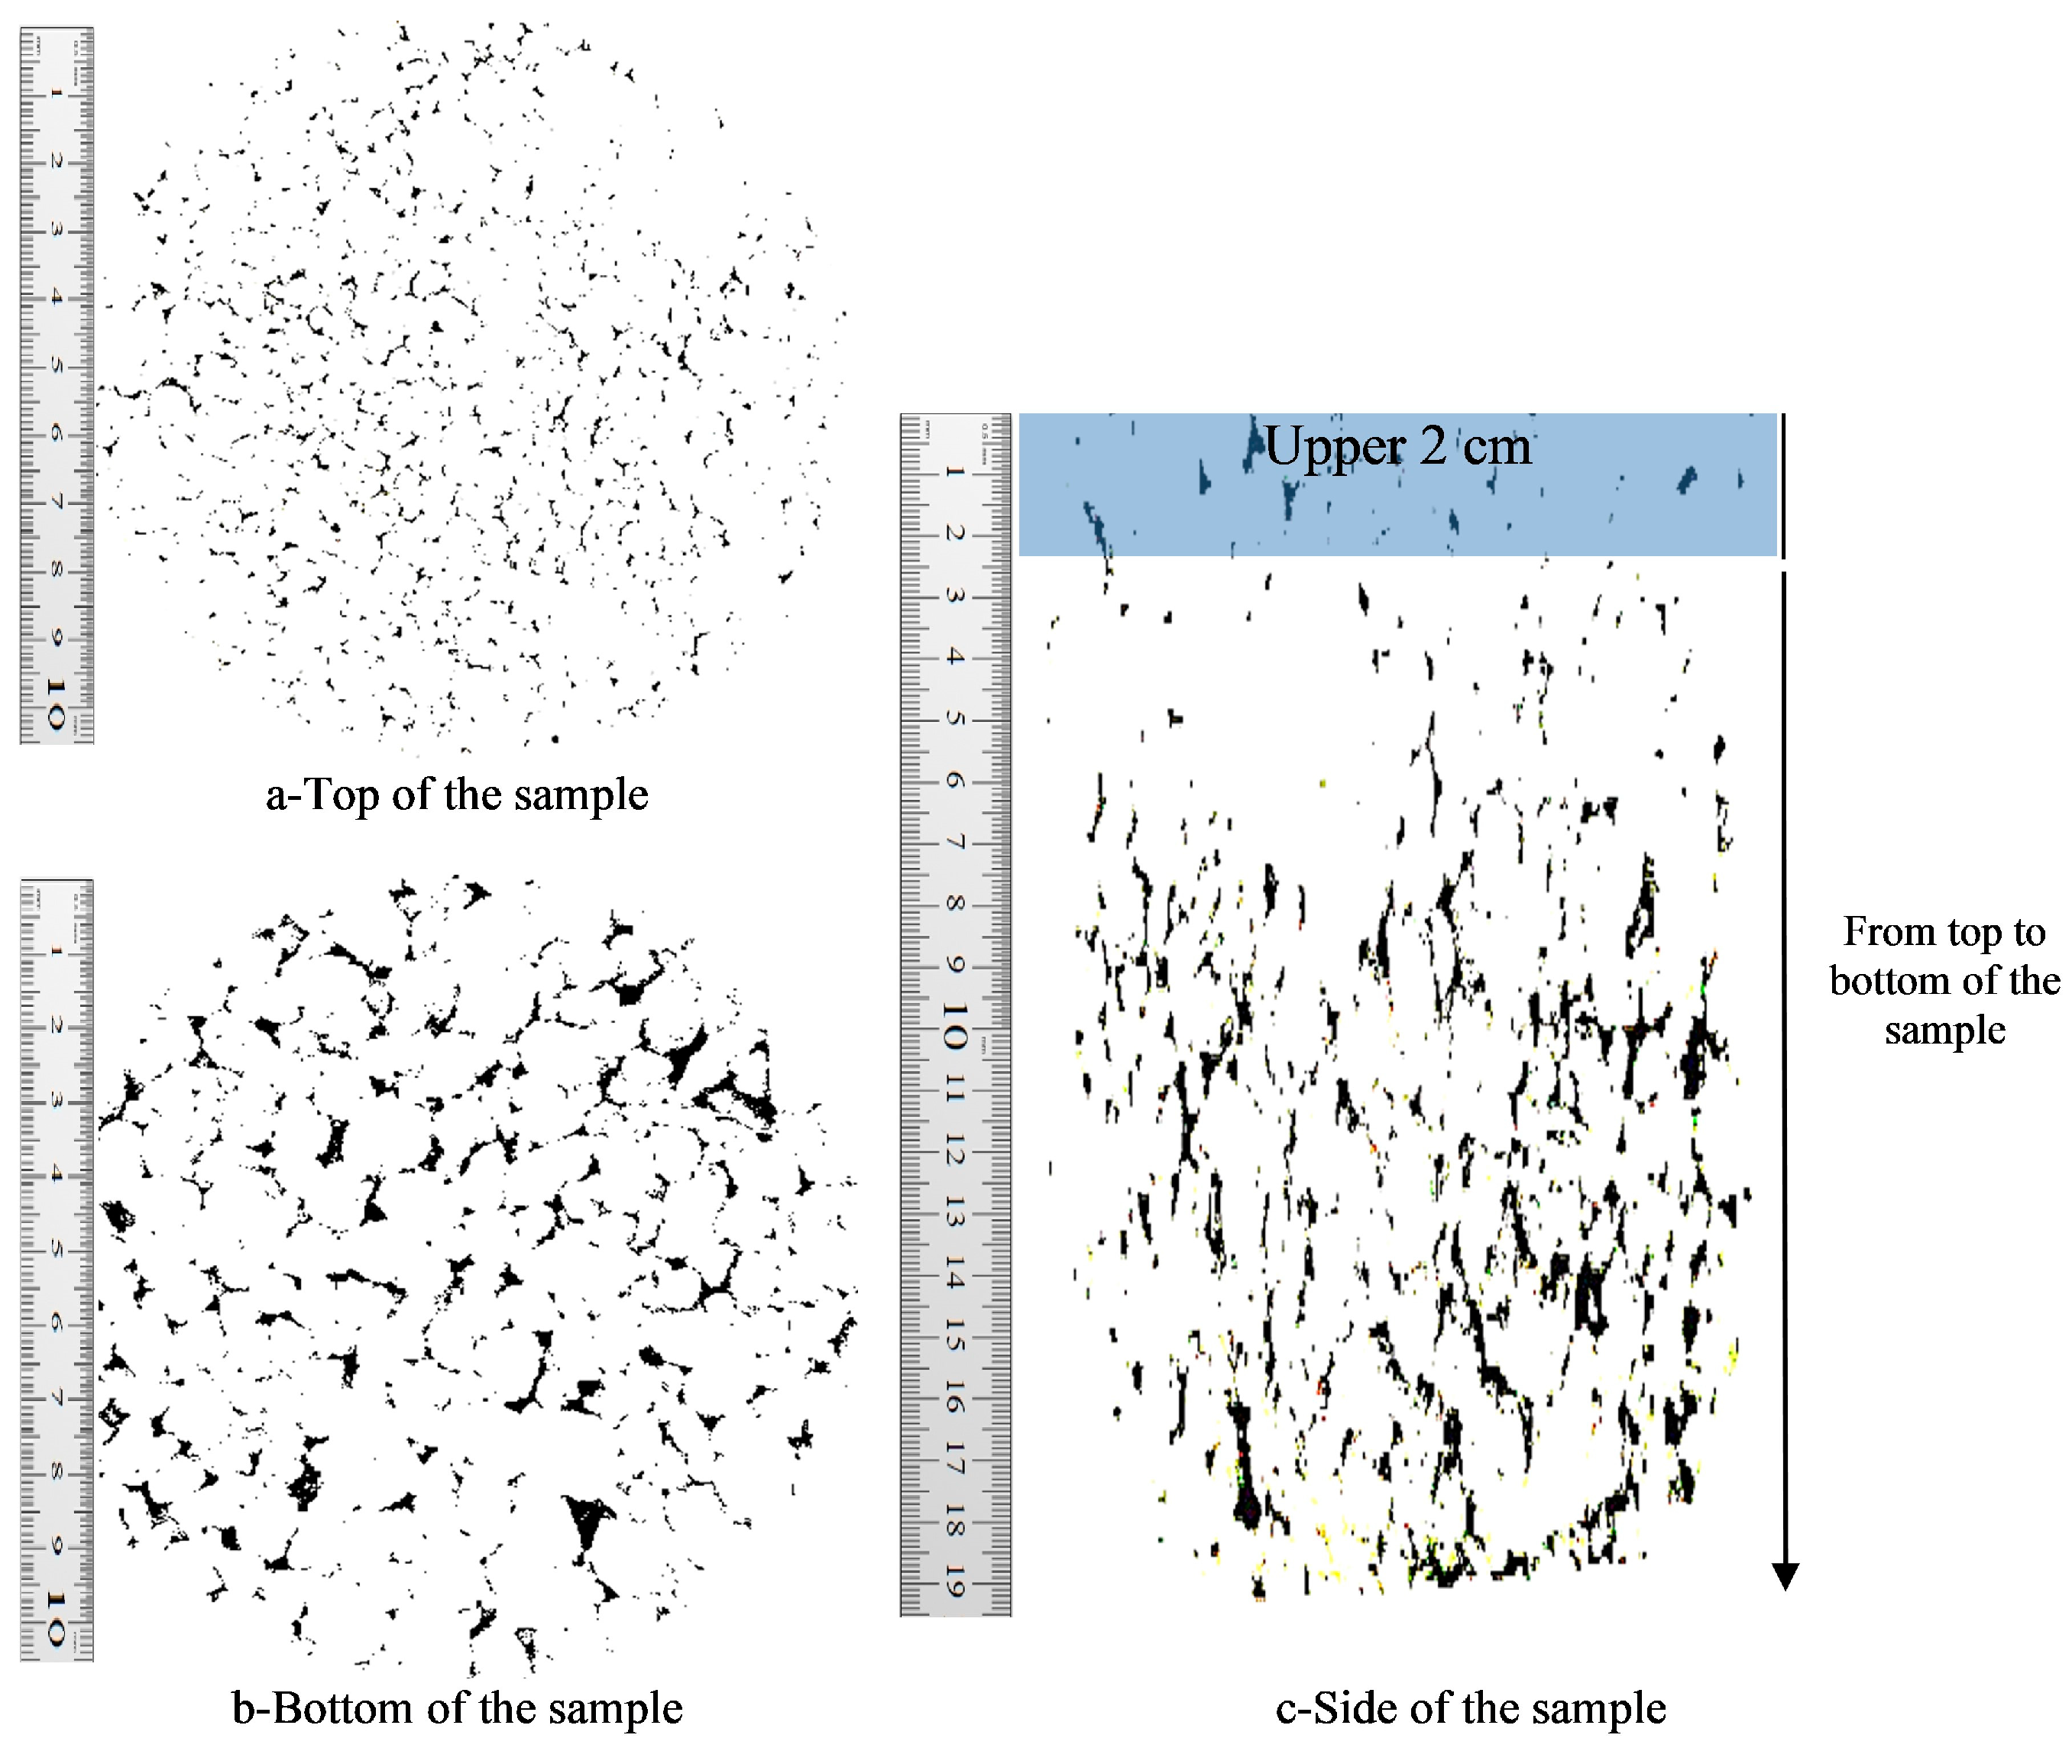
- The results of this study revealed a nonuniform distribution of porosity and permeability within the pervious concrete layer. These properties increased from the upper two centimeters of the layer (compaction zone) toward the bottom.
Author Contributions
Funding
Data Availability Statement
Conflicts of Interest
References
- Madakalapuge, C.M.; Dutta, T.T.; Kodikara, J. Evaluation of climatic effects on moisture variation and performance of unbound pavements with sprayed seals. Acta Geotech. 2024, 19, 5481–5502. [Google Scholar] [CrossRef]
- Madakalapuge, C.M.; Dutta, T.T.; Kodikara, J. Effect of material hydraulic properties on temporal moisture variations and performance of unbound pavements with sprayed seals. Transp. Geotech. 2023, 42, 101071. [Google Scholar] [CrossRef]
- Omar, H.A.; Yusoff, N.I.M.; Mubaraki, M.; Ceylan, H. Effects of moisture damage on asphalt mixtures. J. Traffic Transp. Eng. 2020, 7, 600–628. [Google Scholar] [CrossRef]
- Khan, M.U.; Mesbah, M.; Ferreira, L.; Williams, D.J. A case study on pavement performance due to extreme moisture intrusion at untreated layers. Int. J. Pavement Eng. 2019, 20, 1309–1322. [Google Scholar] [CrossRef]
- Zhang, J.; Li, H.; Yang, X.; Cheng, Z.; Zou, P.X.; Gong, J.; Ye, M.; Zhang, J.; Li, H.; Yang, X.; et al. A novel moisture damage detection method for asphalt pavement from GPR signal with CWT and CNN. NDT E Int. 2024, 145, 103116. [Google Scholar] [CrossRef]
- Kia, A. Freeze-thaw durability of air-entrained high-strength clogging resistant permeable pavements. Constr. Build. Mater. 2023, 400, 132767. [Google Scholar] [CrossRef]
- Madrazo-Uribeetxebarria, E.; Antín, M.G.; Eguilegor, G.A.; Andrés-Doménech, I. Analysis of the hydraulic performance of permeable pavements on a layer-by-layer basis. Constr. Build. Mater. 2023, 387, 131587. [Google Scholar] [CrossRef]
- Yaghmour, E.; Abu Qamar, M.; Naito, C.; Suleiman, M.; Fox, J.; Romero, C.; Neti, S. Pressure drop and heat transfer properties for normal weight and lightweight pervious concrete. Constr. Build. Mater. 2024, 425, 135947. [Google Scholar] [CrossRef]
- Tan, K.; Zhang, T.; Zhu, W.; Yang, D.; Lin, D.; Wang, H.; Wei, J.; Yu, Q. Innovative high-strength, high-permeability concrete for large-scale applications in permeable subgrade of highway tunnel. Case Stud. Constr. Mater. 2024, 20, e02977. [Google Scholar] [CrossRef]
- Al Shareedah, O.; Nassiri, S.; Chen, Z.; Englund, K.; Li, H.; Fakron, O. Field performance evaluation of pervious concrete pavement reinforced with novel discrete reinforcement. Case Stud. Constr. Mater. 2019, 10, e00231. [Google Scholar] [CrossRef]
- Ahmadi, A.; Gogheri, M.K.; Adresi, M.; Amoosoltani, E. Laboratory evaluation of roller compacted concrete containing RAP Amin. Adv. Concr. Constr. 2020, 10, 489–498. [Google Scholar] [CrossRef]
- Elango, K.S.; Gopi, R.; Saravanakumar, R.; Rajeshkumar, V.; Vivek, D.; Raman, S.V. Properties of pervious concrete—A state of the art review. Mater. Today Proc. 2021, 45, 2422–2425. [Google Scholar] [CrossRef]
- Li, Q.; Zheng, J.; Fu, M. Experimental Investigation on Influence of Molding Methods on Properties of Pervious Concrete. J. Phys. Conf. Ser. 2022, 2148, 012055. [Google Scholar] [CrossRef]
- Adresi, M.; Lacidogna, G. Investigating the micro/macro-texture performance of roller-compacted concrete pavement under simulated traffic abrasion. Appl. Sci. 2021, 11, 5704. [Google Scholar] [CrossRef]
- Chhorn, C.; Hong, S.J.; Lee, S.W. A study on performance of roller-compacted concrete for pavement. Constr. Build. Mater. 2017, 153, 535–543. [Google Scholar] [CrossRef]
- Yekrangnia, M.; Adresi, M. Study on the effects of Polypropylene fibers on the splitting strength, strain capacity and energy absorption of rolled compacted semi-lightweight concrete with applicability in concrete blocks. J. Struct. Constr. Eng. 2021, 37, 135–141. [Google Scholar] [CrossRef]
- Rooholamini, H.; Sedghi, R.; Ghobadipour, B.; Adresi, M. Effect of electric arc furnace steel slag on the mechanical and fracture properties of roller-compacted concrete. Constr. Build. Mater. 2019, 211, 88–98. [Google Scholar] [CrossRef]
- Vebe Consistometer; Azmoon Saz Mabna Company: Tehran, Iran, 2016; pp. 1–9. Available online: www.azmoontest.com (accessed on 3 October 2022).
- Rangelov, M.; Nassiri, S.; Chen, Z.; Russell, M.; Uhlmeyer, J. Quality evaluation tests for pervious concrete pavements’ placement. Int. J. Pavement Res. Technol. 2017, 10, 245–253. [Google Scholar] [CrossRef]
- Barnhouse, P.W.; Srubar, W.V. Material characterization and hydraulic conductivity modeling of macroporous recycled-aggregate pervious concrete. Constr. Build. Mater. 2016, 110, 89–97. [Google Scholar] [CrossRef]
- Shen, W.; Shan, L.; Zhang, T.; Ma, H.; Cai, Z.; Shi, H. Investigation on polymer–rubber aggregate modified porous concrete. Constr. Build. Mater. 2013, 38, 667–674. [Google Scholar] [CrossRef]
- Agar-Ozbek, A.S.; Weerheijm, J.; Schlangen, E.; Van Breugel, K. Investigating porous concrete with improved strength: Testing at different scales. Constr. Build. Mater. 2013, 41, 480–490. [Google Scholar] [CrossRef]
- Sumanasooriya, M.S.; Deo, O.; Neithalath, N. Particle Packing-Based Material Design Methodology for Pervious Concretes. ACI Mater. J. 2012, 109, 205. [Google Scholar] [CrossRef]
- Elizondo-Martínez, E.J.; Andrés-Valeri, V.C.; Jato-Espino, D.; Rodriguez-Hernandez, J. Review of porous concrete as multifunctional and sustainable pavement. J. Build. Eng. 2020, 27, 100967. [Google Scholar] [CrossRef]
- Yu, F.; Guo, J.; Liu, J.; Cai, H.; Huang, Y. A review of the pore structure of pervious concrete: Analyzing method, characterization parameters and the effect on performance. Constr. Build. Mater. 2023, 365, 129971. [Google Scholar] [CrossRef]
- Nassiri, S.; Alshareedah, O. Preliminary Procedure for Structural Design of Pervious Concrete Pavements; Department of Transportation: Washington, DC, USA, 2017; Volume 46. [Google Scholar] [CrossRef]
- Ibrahim, A.; Mahmoud, E.; Yamin, M.; Patibandla, V.C. Experimental study on Portland cement pervious concrete mechanical and hydrological properties. Constr. Build. Mater. 2014, 50, 524–529. [Google Scholar] [CrossRef]
- Zhang, N.; Zheng, K.; Zhai, W.; Yin, S.; Wang, C. Experimental study on the thermodynamic performance optimization of phase change energy storage permeable concrete. Constr. Build. Mater. 2024, 411, 134127. [Google Scholar] [CrossRef]
- Brasileiro, K.P.T.V.; Nahime, B.d.O.; Lima, E.C.; Alves, M.M.; Ferreira, W.P.; dos Santos, I.S.; Filho, C.P.B.; dos Reis, I.C. Influence of recycled aggregates and silica fume on the performance of pervious concrete. J. Build. Eng. 2024, 82, 108347. [Google Scholar] [CrossRef]
- Muthu, M.; Sadowski, Ł. Performance of permeable concrete mixes based on cement and geopolymer in aggressive aqueous environments. J. Build. Eng. 2023, 76, 107143. [Google Scholar] [CrossRef]
- El-Hassan, H.; Kianmehr, P.; Tavakoli, D.; El-Mir, A.; Dehkordi, R.S. Synergic effect of recycled aggregates, waste glass, and slag on the properties of pervious concrete. Dev. Built Environ. 2023, 15, 100189. [Google Scholar] [CrossRef]
- Khankhaje, E.; Kim, T.; Jang, H.; Kim, C.S.; Kim, J.; Rafieizonooz, M. A review of utilization of industrial waste materials as cement replacement in pervious concrete: An alternative approach to sustainable pervious concrete production. Heliyon 2024, 10, e26188. [Google Scholar] [CrossRef]
- Aci 522R-10; Report on Pervious Concrete. American Concrete Institute: Farmington Hills, MI, USA, 2010; p. 38.
- Nassiri, S.; Rangelov, M.; Chen, Z. Preliminary Study to Develop Standard Acceptance Tests for Pervious Concrete; Department of Transportation, Office of Research & Library Services: Washington, DC, USA, 2017; pp. 1–67. [Google Scholar]
- Meng, D.; Feng, J.; Yeo, H.X.; Qian, S. Effect of carbonation on development of reactive MgO-based pervious concrete. Constr. Build. Mater. 2024, 422, 135839. [Google Scholar] [CrossRef]
- Tennis, D.; Michael, L.; Leming, L.; Akers, D. Pervious concrete pavement. Int. J. Civ. Eng. Technol. 2004, 8, 413–421. [Google Scholar]
- Tahiri, I.; Dangla, P.; Vandamme, M.; Vu, Q.H. Numerical investigation of salt-frost damage of pervious concrete at the scale of a few aggregates. Cem. Concr. Res. 2022, 162, 106971. [Google Scholar] [CrossRef]
- Chen, Y.; Wang, K.; Wang, X.; Zhou, W. Strength, fracture and fatigue of pervious concrete. Constr. Build. Mater. 2013, 42, 97–104. [Google Scholar] [CrossRef]
- Rajasekhar, K.; Spandana, K. Strength Properties of Pervious Concrete Compared with Conventional Concrete. IOSR J. Mech. Civ. Eng. 2016, 13, 7. Available online: https://www.iosrjournals.org/iosr-jmce/papers/vol13-issue4/Version-3/P13040397103.pdf (accessed on 15 February 2022).
- Alam, A.; Haselbach, L. Estimating the Modulus of Elasticity of Pervious Concrete Based on Porosity. Adv. Civ. Eng. Mater. 2014, 3, 20130081. [Google Scholar] [CrossRef]
- Yahia, A.; Kabagire, K.D. New approach to proportion pervious concrete. Constr. Build. Mater. 2014, 62, 38–46. [Google Scholar] [CrossRef]
- Shi, Z.; Zhu, P.; Yan, X.; Yang, L.; Qiao, S.; Li, H. The rainstorm waterlogging resistance of a novel fiber-reinforced self-compacting recycled pervious concrete after freeze-thaw cycles. J. Build. Eng. 2024, 86, 108820. [Google Scholar] [CrossRef]
- Al Shareedah, O.; Nassiri, S. Pervious concrete mixture optimization, physical, and mechanical properties and pavement design: A review. J. Clean. Prod. 2021, 288, 125095. [Google Scholar] [CrossRef]
- Xie, N.; Akin, M.; Shi, X. Permeable concrete pavements: A review of environmental benefits and durability. J. Clean. Prod. 2019, 210, 1605–1621. [Google Scholar] [CrossRef]
- Sičáková, A.; Kováč, M. Relationships between functional properties of pervious concrete. Sustainability 2020, 12, 6318. [Google Scholar] [CrossRef]
- Chandrappa, A.K.; Biligiri, K.P. Investigation on flexural strength and stiffness of pervious concrete for pavement applications. Adv. Civ. Eng. Mater. 2018, 7, 223–242. [Google Scholar] [CrossRef]
- Ulloa-Mayorga, V.A.; Uribe-Garcés, M.A.; Paz-Gómez, D.P.; Alvarado, Y.A.; Torres, B.; Gasch, I. Performance of pervious concrete containing combined recycled aggregates. Ing. E Investig. 2018, 38, 34–41. [Google Scholar] [CrossRef]
- Ozel, B.F.; Sakallı, Ş.; Şahin, Y. The effects of aggregate and fiber characteristics on the properties of pervious concrete. Constr. Build. Mater. 2022, 356, 129294. [Google Scholar] [CrossRef]
- Wu, F.; Yu, Q.; Brouwers, H.J.H. Mechanical, absorptive and freeze–thaw properties of pervious concrete applying a bimodal aggregate packing model. Constr. Build. Mater. 2022, 333, 127445. [Google Scholar] [CrossRef]
- Akkaya, A.; Çağatay, İ.H. Experimental investigation of the use of pervious concrete on high volume roads. Constr. Build. Mater. 2021, 279, 122430. [Google Scholar] [CrossRef]
- Al Shareedah, O.S.M. Numerical Modeling of Pervious Concrete for Optimizing Mixture Design and Pavement Thickness; Washington State University: Washington, DC, USA, 2021. [Google Scholar] [CrossRef]
- Eisenberg, B.; Lindow, K.C.; Smith, D.R. Permeable pavements. In Green Infrastructure; Routledge: Reston, WV, USA, 2015; pp. 105–118. [Google Scholar]
- Chandrappa, A.K.; Biligiri, K.P. Pervious concrete as a sustainable pavement material—Research findings and future prospects: A state-of-the-art review. Constr. Build. Mater. 2016, 111, 262–274. [Google Scholar] [CrossRef]
- Kevern, J.; Schaefer, V.; Wang, K. Design of Pervious Concrete Mixtures; NPCPA: Millersville, MD, USA, 2009; Volume 3, Available online: https://www.researchgate.net/publication/237654465 (accessed on 26 June 2022).
- TechBrief. Pervious Concrete (TechBrief). 2012; Volume 2, pp. 1–8. Available online: https://www.fhwa.dot.gov/pavement/concrete/pubs/hif13006/hif13006.pdf (accessed on 5 September 2018).
- Adresi, M.; Yamani, A.; Tabarestani, M.K.; Rooholamini, H. A comprehensive review on pervious concrete. Constr. Build. Mater. 2023, 407, 133308. [Google Scholar] [CrossRef]
- Elango, K.S.; Revathi, V. Mechanical and durability studies on pervious concrete using different types of binders. Rev. Romana De. Mater./Rom. J. Mater. 2020, 50, 258–267. [Google Scholar]
- Zhong, R.; Wille, K. Compression response of normal and high strength pervious concrete. Constr. Build. Mater. 2016, 109, 177–187. [Google Scholar] [CrossRef]
- ASTM C127-15; Standard Test Method for Relative Density (Specific Gravity) and Absorption of Coarse Aggregate. ASTM International: West Conshohocken, PA, USA, 2015; pp. 1–5. [CrossRef]
- ASTM C128-15; Standard Test Method for Relative Density (Specific Gravity) and Absorption of Fine Aggregate. ASTM International: West Conshohocken, PA, USA, 2015; Volume i, pp. 2–7. [CrossRef]
- ASTM C29/C29M; Standard Test Method for Bulk Density (‘Unit Weight’) and Voids in Aggregate. ASTM International: West Conshohocken, PA, USA, 2016; Volume i, pp. 1–5. [CrossRef]
- ASTM C566-13; Standard Test Method for Total Evaporable Moisture Content of Aggregate by Drying. ASTM International: West Conshohocken, PA, USA, 2013; Volume i, pp. 2–4. [CrossRef]
- ASTM C131/C131M; Standard Test Method for Resistance to Degradation of Small-Size Coarse Aggregate by Abrasion and Impact in the Los Angeles Machine. ASTM International: West Conshohocken, PA, USA, 2014; Volume i, pp. 1–5. [CrossRef]
- ASTM C136/C136M; Standard Test Method for Sieve Analysis of Fine and Coarse Aggregates. ASTM International: West Conshohocken, PA, USA, 2015; pp. 1–5. [CrossRef]
- ASTM C150/C150M; Standard Specification for Portland Cement. ASTM International: West Conshohocken, PA, USA, 2015; Volume 4, pp. 1–8. [CrossRef]
- ASTM C1170; Standard Test Methods for Determining Consistency and Density of Roller-Compacted Concrete Using a Vibrating Table. ASTM International: West Conshohocken, PA, USA, 1998; Volume 91, pp. 1–5.
- ASTM C 470; Standard Specification for Molds for Forming Concrete Test Cylinders Vertically 1. ASTM International: West Conshohocken, PA, USA, 2003; Volume 8, pp. 1–5. [CrossRef]
- ASTM C192/C192M-15; Standard Practice for Making and Curing Concrete Test Specimens in the Laboratory. ASTM International: West Conshohocken, PA, USA, 2015; pp. 1–8. [CrossRef]
- Esfandmaz, S.; Feizi, A.; Tabarestani, M.K. Application of Taguchi method in reducing the number of experiments and optimizing the factors of artificial neural network related to the phenomenon of design of stable size of RipRap around bridge piers. J. Hydraul. 2021, 16, 63–77. [Google Scholar] [CrossRef]
- Chauhan, V.; Kärki, T.; Varis, J. Optimization of compression molding process parameters for nfpc manufacturing using taguchi design of experiment and moldflow analysis. Processes 2021, 9, 1853. [Google Scholar] [CrossRef]
- Naranje, V.; Sankar, A.R.; Salunkhe, S.; Bachchhav, B.D. Experimental Evaluation of Mechanical Properties of Epoxy Based Composite Material Using Taguchi Method. Lect. Notes Mech. Eng. 2021, 381–395. [Google Scholar] [CrossRef]
- Montgomery, D.C. Design and Analysis of Experiments, 10th ed.; Arizona State University: Tempe, AZ, USA; John Wiley & Sons, Inc.: Hoboken, NJ, USA, 2019. [Google Scholar]
- Shetty, A.A.; Shetty, R.; Hegde, N.T.; Vaz, A.C.; Srinivasan, C.R. A Study on the Effect of Radiometric Variations on A Fuzzy Stereo Matching Algorithm: A Statistical Analysis. Eng. Sci. 2021, 16, 269–280. [Google Scholar] [CrossRef]
- Khodaparasti, M.; Alijamaat, A.; Pouraminian, M. Prediction of the concrete compressive strength using improved random forest algorithm. J. Build. Pathol. Rehabil. 2023, 8, 92. [Google Scholar] [CrossRef]
- Naderpour, H.; Rafiean, A.H.; Fakharian, P. Compressive strength prediction of environmentally friendly concrete using artificial neural networks. J. Build. Eng. 2018, 16, 213–219. [Google Scholar] [CrossRef]
- Ghattas, B.; Manzon, D. Machine Learning Alternatives to Response Surface Models. Mathematics 2023, 11, 3406. [Google Scholar] [CrossRef]
- Boehmke, B.; Greenwell, B. Random Forests. In Hands-On Machine Learning with R; Chapman and Hall/CRC: London, UK, 2019; pp. 203–219. [Google Scholar]
- Barbierato, E.; Gatti, A. The Challenges of Machine Learning: A Critical Review. Electronics 2024, 13, 416. [Google Scholar] [CrossRef]
- Wang, H.; Ma, C.; Zhou, L. A Brief Review of Machine Learning and Its Application. In Proceedings of the 2009 International Conference on Information Engineering and Computer Science, Wuhan, China, 19–20 December 2009; pp. 1–4. [Google Scholar] [CrossRef]
- Fu, M.C. Handbook of Simulation Optimization; Springer: New York, NY, USA, 2015; Volume 216. [Google Scholar]
- Box, G.E.P.; Wilson, K.B. On the Experimental Attainment of Optimum Conditions. J. R. Stat. Soc. Ser. B 1951, 13, 270–310. [Google Scholar] [CrossRef]
- Murray, L.; Mason, R.L.; Gunst, R.F.; Hess, J.L. Statistical Design and Analysis of Experiments: With Applications to Engineering and Science. J. Am. Stat. Assoc. 1990, 85, 1170–1172. [Google Scholar] [CrossRef]
- Menkiti, M.C.; Aneke, M.C.; Ogbuene, E.B.; Onukwuli, O.D.; Ekumankama, E.O. Optimal Evaluation of Coag-Flocculation Factors for Alum-Brewery Effluent System by Response Surface Methodology. J. Miner. Mater. Charact. Eng. 2012, 11, 543–558. [Google Scholar] [CrossRef]
- Yıldırım, Z.B.; Karacasu, M. Modelling of waste rubber and glass fibber with response surface method in hot mix asphalt. Constr. Build. Mater. 2019, 227, 117070. [Google Scholar] [CrossRef]
- Khodaii, A.; Haghshenas, H.F.; Tehrani, H.K. Effect of grading and lime content on HMA stripping using statistical methodology. Constr. Build. Mater. 2012, 34, 131–135. [Google Scholar] [CrossRef]
- Vecchio, R.J.D. Understanding Design of Experiments: A Primer for Technologists; Hanser Publishers: Munich, Germany, 1997. [Google Scholar]
- Heydari, S.; Hajimohammadi, A.; Javadi, N.H.S.; Ng, J.J.K.C.; Kypreos, J.E.; Khalili, N. Modified asphalt by coffee cup Fibres: An optimum mix design using response surface method. Constr. Build. Mater. 2023, 401, 133005. [Google Scholar] [CrossRef]
- Hamzah, M.O.; Golchin, B.; Tye, C.T. Determination of the optimum binder content of warm mix asphalt incorporating Rediset using response surface method. Constr. Build. Mater. 2013, 47, 1328–1336. [Google Scholar] [CrossRef]
- Moghaddam, T.B.; Soltani, M.; Karim, M.R.; Baaj, H. Optimization of asphalt and modifier contents for polyethylene terephthalate modified asphalt mixtures using response surface methodology. Meas. J. Int. Meas. Confed. 2015, 74, 159–169. [Google Scholar] [CrossRef]
- Al-Khateeb, G.G.; Obaidat, T.I.A.-S.; Khedaywi, T.S.; Elayan, M.S. Studying rutting performance of Superpave asphalt mixtures using unconfined dynamic creep and simple performance tests. Road Mater. Pavement Des. 2018, 19, 315–333. [Google Scholar] [CrossRef]
- Frost, J. Hypothesis Testing. 2002. Available online: https://statisticsbyjim.com (accessed on 15 June 2021).
- Design-Expert; Stat-Ease: Minneapolis, MN, USA, 2022; Available online: https://www.statease.com/software/design-expert/ (accessed on 8 March 2023).
- MathWorks. Image Processing with MATLAB; The MathWorks, Inc.: Natick, MA, USA, 2023; Available online: https://www.mathworks.com/products/image.html (accessed on 12 November 2023).
- ASTM B962-17; Standard Test Methods for Density of Compacted or Sintered Powder Metallurgy (PM) Products Using Archimedes’ Principle. ASTM International: West Conshohocken, PA, USA, 2009.
- Neithalath, N.; Weiss, J.; Olek, J. Predicting the Permeability of Pervious Concrete (Enhanced Porosity Concrete) from Non-Destructive Electrical Measurements; ResearchGate: Berlin, Germany, 2006; pp. 1–22. Available online: https://www.researchgate.net/publication/228788494_Predicting_the_Permeability_of_Pervious_Concrete_Enhanced_Porosity_Concrete_from_Non-Destructive_Electrical_Measurements?enrichId=rgreq-eac44b75b2dc10557296cdd1b2860a41-XXX&enrichSource=Y292ZXJQYWdlOzIyOD (accessed on 24 January 2022).
- Montes, F.; Haselbach, L. Measuring hydraulic conductivity in pervious concrete. Environ. Eng. Sci. 2006, 23, 960–969. [Google Scholar] [CrossRef]
- ASTM C39; Standard Test Method for Compressive Strength of Cylindrical Concrete Specimens 1. ASTM International: West Conshohocken, PA, USA, 2005; Volume i, pp. 1–7.
- López-Carrasquillo, V.; Hwang, S. Comparative assessment of pervious concrete mixtures containing fly ash and nanomaterials for compressive strength, physical durability, permeability, water quality performance and production cost. Constr. Build. Mater. 2017, 139, 148–158. [Google Scholar] [CrossRef]
- El-Hassan, H.; Kianmehr, P.; Zouaoui, S. Properties of pervious concrete incorporating recycled concrete aggregates and slag. Constr. Build. Mater. 2019, 212, 164–175. [Google Scholar] [CrossRef]
- Ibrahim, H.A.; Goh, Y.; Ng, Z.A.; Yap, S.P.; Mo, K.H.; Yuen, C.W.; Abutaha, F. Hydraulic and strength characteristics of pervious concrete containing a high volume of construction and demolition waste as aggregates. Constr. Build. Mater. 2020, 253, 119251. [Google Scholar] [CrossRef]
- Akkaya, A.; Çağatay, İ.H. Investigation of the density, porosity, and permeability properties of pervious concrete with different methods. Constr. Build. Mater. 2021, 294, 123539. [Google Scholar] [CrossRef]
- Sun, Z.; Lin, X.; Vollpracht, A. Pervious concrete made of alkali activated slag and geopolymers. Constr. Build. Mater. 2018, 189, 797–803. [Google Scholar] [CrossRef]
- Costa, F.B.P.; Lorenzi, A.; Haselbach, L.; Filho, L.C.P.S.I.V. Best practices for pervious concrete mix design and laboratory tests. Rev. IBRACON Estrut. E Mater. 2018, 11, 1151–1159. [Google Scholar] [CrossRef]
- Sriravindrarajah, R.; Wang, N.D.H.; Ervin, L.J.W. Mix Design for Pervious Recycled Aggregate Concrete. Int. J. Concr. Struct. Mater. 2012, 6, 239–246. [Google Scholar] [CrossRef]
- Schaefer, V.R.; Kevern, J.T. An Integrated Study of Pervious Concrete Mixture Design for Wearing Course Applications; National Concrete Pavement Technology Center: Ames, IA, USA, 2011. [Google Scholar]
- Joshi, T.; Dave, U. Construction of pervious concrete pavement stretch, Ahmedabad, India—Case study. Case Stud. Constr. Mater. 2022, 16, e00622. [Google Scholar] [CrossRef]
- Wang, G.; Chen, X.; Dong, Q.; Yuan, J.; Hong, Q. Mechanical performance study of pervious concrete using steel slag aggregate through laboratory tests and numerical simulation. J. Clean. Prod. 2020, 262, 121208. [Google Scholar] [CrossRef]
- Qin, Y.; Yang, H.; Deng, Z.; He, J. Water permeability of pervious concrete is dependent on the applied pressure and testing methods. Adv. Mater. Sci. Eng. 2015, 2015, 404136. [Google Scholar] [CrossRef]
- Wang, K.; Schaefer, V.R.; Kevern, J.T.; Suleiman, M.T. Development of Mix Proportion for Functional and Durable Pervious Concrete. In Proceedings of the NRMCA Concrete Technology Forum: Focus on Pervious Concrete, Nashville, TN, USA, 24–25 May 2006. [Google Scholar]
- Grubeša, I.N.; Barišić, I.; Ducman, V.; Korat, L. Draining capability of single-sized pervious concrete. Constr. Build. Mater. 2018, 169, 252–260. [Google Scholar] [CrossRef]
- Schaefer, V.R.; Suleiman, K.W.A.T.; Kevern, J. Mix Design Development for Pervious Concrete in Cold Weather Climates. 2006. Available online: https://www.researchgate.net/publication/237226150_Mix_Design_Development_for_Pervious_Concrete_in_Cold_Weather_Climates?enrichId=rgreq-e917994caf793d90ec09caacd201cfe7-XXX&enrichSource=Y292ZXJQYWdlOzIzNzIyNjE1MDtBUzo5OTUwMTgzMDMxMTk1MUAxNDAwNzM0NDkzNjQ4&el=1_x_2&_esc=publicationCoverPdf (accessed on 7 March 2023).
- Kevern, J.T.; Wang, K.; Schaefer, V.R. Effect of Coarse Aggregate on the Freeze-Thaw Durability of Pervious Concrete. J. Mater. Civ. Eng. 2010, 22, 469–475. [Google Scholar] [CrossRef]
- Zhu, H.; Wen, C.; Wang, Z.; Li, L. Study on the permeability of recycled aggregate pervious concrete with fibers. Materials 2020, 13, 321. [Google Scholar] [CrossRef] [PubMed]
- Aoki, Y.; Ravindrarajah, R.S.; Khabbaz, H. Properties of pervious concrete containing fly ash. Road Mater. Pavement Des. 2012, 13, 1–11. [Google Scholar] [CrossRef]
- Kevern, J.; Wang, K. Mix Design Development for Pervious Concrete in Cold Weather Climates. In Climate Change 2013 The Physical Science Basis; Cambridge University Press: Cambridge, UK, 2013; Volume 53, pp. 1–30. [Google Scholar]
- Liu, R.T.; Liu, H.J.; Sha, F.; Yang, H.L.; Zhang, Q.S.; Shi, S.S.; Zheng, Z. Investigation of the porosity distribution, permeability, and mechanical performance of pervious concretes. Processes 2018, 6, 78. [Google Scholar] [CrossRef]
- Elango, K.S.; Saravanakumar, R.; Annadurai, S.; Vivek, D.; Rajeshkumar, K.; Karthikeyan, S. Comparative analysis of infiltration and pore clogging effects in pervious concrete. Mater. Today Proc. 2023, 1–4. [Google Scholar] [CrossRef]
- Zhang, J.; Meng, B.; Wang, Z.; Xiong, J.; Tang, W.; Tan, Y.; Zhang, Z. Numerical simulation on cleaning of clogged pervious concrete pavement. J. Clean. Prod. 2022, 341, 130878. [Google Scholar] [CrossRef]
- Kayhanian, M.; Anderson, D.; Harvey, J.T.; Jones, D.; Muhunthan, B. Permeability measurement and scan imaging to assess clogging of pervious concrete pavements in parking lots. J. Environ. Manag. 2012, 95, 114–123. [Google Scholar] [CrossRef]
- Guthrie, W.S.; DeMille, C.B.; Eggett, D.L. Effects of soil clogging and water saturation on freeze-thaw durability of pervious concrete. Transp. Res. Rec. 2010, 2164, 89–97. [Google Scholar] [CrossRef]
- Pareek, K.; Hong, Y.M. Prediction of Permeability and Compressive strength for Pervious Concrete. In IOP Conference Series: Materials Science and Engineering; IOP Publishing: Bristol, UK, 2020; Volume 812. [Google Scholar] [CrossRef]


| Author | Aggregate Content (kg/m3) | Cement Content (kg/m3) | Water Content (kg/m3) | A/C (by Mass) 1 | W/C (by Mass) 2 | Main Results |
|---|---|---|---|---|---|---|
| Zhang et al. (2024) [28]. | 1513.2 1522.7 1522.7 | 317.4 305.6 330.1 | 95.20 107.00 82.50 | 4.77:1 4.98:1 4.61:1 | 0.30 0.35 0.25 | The performance of the pervious concrete pavement under extreme temperatures was improved by adjusting the mix of the pervious concrete and using microencapsulated phase change material (MPCM) and carbon nanotubes (CNTs). |
| Kanghao Tan et al. (2024) [9] | 1715.2–1716.5 | 236.6–513.7 | 28.39–113.014 | 3.3:1–7.2:1 | 0.12–0.22 | Incorporating hydroxypropyl methyl cellulose caused metallic sheen and filamentous features in cement pastes. The control mixture showed minor dry and hardened characteristics after 80 min of rest. |
| Kelly Brasileiro et al. (2024) [29] | 1499.20 | 374.80 | 112.44 | 4:1 | 0.30 | Samples with varying percentages of recycled aggregates (40%, 50%, and 60%) exhibited reductions in compressive strength (48%, 56%, and 52%, respectively) compared to samples with natural aggregates at 28 days. |
| Muthu & Sadowski (2023) [30] | 1350 | 300 | 105 | 4.5:1 | 0.35 | Geopolymer-based permeable pavements have ecological benefits. They harden quickly in moist air, gain strength early, resist acid, and aid in groundwater contamination remediation. |
| Hilal El-Hassan et al. (2023) [31] | 1400 | 190–380 | 115 | 3.68:1–7.3:1 | 0.30–0.60 | The addition of ground-granulated blast furnace slag improved the performance of the pervious concrete. |
| Behlul Furkan Ozel et al. (2022) [48] | 519–1502 | 300 | 105 | 1.73:1–5:1 | 0.35 | The addition of steel fiber positively impacted all the mechanical properties. Nevertheless, they experienced a significant decrease when polypropylene fiber was included. |
| Fan Wu et al. (2022) [49] | 1684–1903.32 | 301 | 111.4 | 5.59:1–6.32:1 | 0.37 | When 50% steel slag (1–2 mm) was added to pervious concrete, its compressive strength and flexural strength increased by 150.8% and 130.7%, respectively. Additionally, the mass loss from freeze–thaw cycles decreased by 73.7% compared to the control concrete. |
| Akkaya and Ismail Hakki (2021) [50] | 1219.66–1868.31 | 448.72 | 95.00–115.00 | 2.7:1–4:1 | 0.21–0.25 | The size of aggregates in pervious concrete positively affects its mechanical properties when reduced while maintaining a constant aggregate-to-cement ratio. |
| Properties | Standards | Unit | Ranges | Reference |
|---|---|---|---|---|
| Specific gravity in a saturated surface dry state | ASTM C127-128 | - | 2.61–2.73 | [59,60] |
| Bulk density in a saturated surface dry state | ASTM C29/C29M | g/cm3 | 1.35–1.44 | [61] |
| Water absorption | ASTM C127-128 | ٪ | 1.72–4.95 | [59,60] |
| Moisture content | ASTM C566 | ٪ | 0.25–1.67 | [62] |
| Los Angeles aggregate abrasion loss | ASTM C131 | ٪ | 14.20–18.6 | [63] |
| Parameters | Value |
|---|---|
| Loss on ignition (%) | 1.30 |
| Insoluble residue (%) | 0.60 |
| Specific gravity | 3.15 |
| SiO2 (%) | 21.74 |
| Al2O3 (%) | 5.00 |
| Fe2O3 (%) | 4.00 |
| CaO (%) | 63.04 |
| MgO (%) | 2.00 |
| SO3 (%) | 2.30 |
| Alkalis [Na2O (%) + 0.658K2O (%)] | 1.00 |
| Free Cao (%) | 1.40 |
| C3S (%) | 45.50 |
| C2S (%) | 28.00 |
| C3A (%) | 6.50 |
| C4AF (%) | 12.20 |
| Factors | Name | Min | Max | Mean | Lower Limit (−1) | Upper Limit (+1) |
|---|---|---|---|---|---|---|
| A | Water-to-cement ratio | 0.27 | 0.33 | 0.30 | −1 ↔ 0.27 | +1 ↔ 0.33 |
| B | Aggregate-to-cement ratio | 4.00 | 4.50 | 4.25 | −1 ↔ 4.00 | +1 ↔ 4.50 |
| C | Cement content (kg/m3) | 280.00 | 340.00 | 310.00 | −1 ↔ 280.00 | +1 ↔ 340.00 |
| Run | Water-to-Cement Ratio | Aggregate-to-Cement Ratio | Cement Content (kg/m3) |
|---|---|---|---|
| 1 | 0.33 | 4.50 | 280.00 |
| 2 | 0.27 | 4.00 | 280.00 |
| 3 | 0.27 | 4.50 | 340.00 |
| 4 | 0.33 | 4.00 | 280.00 |
| 5 | 0.30 | 4.00 | 310.00 |
| 6 | 0.30 | 4.25 | 310.00 |
| 7 | 0.30 | 4.25 | 280.00 |
| 8 | 0.30 | 4.50 | 310.00 |
| 9 | 0.30 | 4.25 | 340.00 |
| 10 | 0.30 | 4.25 | 310.00 |
| 11 | 0.27 | 4.00 | 340.00 |
| 12 | 0.30 | 4.25 | 310.00 |
| 13 | 0.30 | 4.25 | 310.00 |
| 14 | 0.27 | 4.50 | 280.00 |
| 15 | 0.30 | 4.25 | 310.00 |
| 16 | 0.33 | 4.25 | 310.00 |
| 17 | 0.33 | 4.50 | 340.00 |
| 18 | 0.27 | 4.25 | 310.00 |
| 19 | 0.3 | 4.25 | 310.00 |
| 20 | 0.33 | 4.00 | 340.00 |
| 21 | 0.33 | 4.00 | 300.00 |
| 22 | 0.33 | 4.00 | 320.00 |
| 23 | 0.30 | 4.00 | 300.00 |
| 24 | 0.30 | 4.00 | 320.00 |
| Independent Variables | Dependent Variable | R | R2 | p-Value | Standard Error of the Estimate | ||
|---|---|---|---|---|---|---|---|
| Permeability, cement content, and water-to-cement ratio | Tvc | 0.749 | 0.63 | 0.582 | <0.0001 | 35.3134 | |
| Run | Tvc (s) | Run | Tvc (s) | Run | Tvc (s) | Run | Tvc (s) |
|---|---|---|---|---|---|---|---|
| 1 | 80 | 7 | 47 | 13 | 47 | 19 | 47 |
| 2 | 13 | 8 | 47 | 14 | 13 | 20 | 82 |
| 3 | 14 | 9 | 48 | 15 | 47 | 21 | 80 |
| 4 | 80 | 10 | 47 | 16 | 81 | 22 | 80 |
| 5 | 47 | 11 | 14 | 17 | 82 | 23 | 80 |
| 6 | 47 | 12 | 47 | 18 | 13 | 24 | 80 |
| Run | Density (g/cm3) | Porosity (%) | Permeability (cm/s) | UCS (MPa) |
|---|---|---|---|---|
| 1 | 1.909 | 23.241 | 0.368 | 4.955 |
| 2 | 1.656 | 28.683 | 0.444 | 1.851 |
| 3 | 2.313 | 16.155 | 0.418 | 5.202 |
| 4 | 2.279 | 17.407 | 0.302 | 7.679 |
| 5 | 1.592 | 29.542 | 0.444 | 2.560 |
| 6 | 2.223 | 17.639 | 0.461 | 3.623 |
| 7 | 1.774 | 26.404 | 0.430 | 3.103 |
| 8 | 1.741 | 27.287 | 0.471 | 2.964 |
| 9 | 1.824 | 25.572 | 0.438 | 3.230 |
| 10 | 2.182 | 17.717 | 0.466 | 3.738 |
| 11 | 1.462 | 31.048 | 0.442 | 2.379 |
| 12 | 2.133 | 19.413 | 0.462 | 3.503 |
| 13 | 2.167 | 17.753 | 0.465 | 3.627 |
| 14 | 1.797 | 25.898 | 0.450 | 5.283 |
| 15 | 2.359 | 15.952 | 0.470 | 3.831 |
| 16 | 1.888 | 23.596 | 0.395 | 3.931 |
| 17 | 1.855 | 24.205 | 0.449 | 4.497 |
| 18 | 1.741 | 26.941 | 0.507 | 4.247 |
| 19 | 2.260 | 17.632 | 0.466 | 3.719 |
| 20 | 2.451 | 12.243 | 0.032 | 10.380 |
| 21 | 2.288 | 16.393 | 0.037 | 8.164 |
| 22 | 2.323 | 12.289 | 0.032 | 9.512 |
| 23 | 2.306 | 13.513 | 0.032 | 8.584 |
| 24 | 2.473 | 10.707 | 0.029 | 9.704 |
| Name of the Model | Type of the Model | p-Value | Standard Deviation | |||
|---|---|---|---|---|---|---|
| UCS | 2FI | 0.9049 | 0.8785 | 0.8379 | <0.0001 | 0.8836 |
| No. | Model | Reference |
|---|---|---|
| Study 1 | The unconfined compressive strength (UCS) varied from 1.85 to 10.38 MPa. The water-to-cement ratio (W/C) was between 0.27 and 0.33, the aggregate-to-cement ratio (A/C) ranged from 4.00 to 4.50, and Tvc varied between 13 and 82 s. Based on the DESIGN EXPERT software, this model can be utilized to predict the response for specific factor levels. High levels of the factors are presented as +1 and low levels as −1. | Current study |
| Study 2 | varied from 0.90 to 23.70 MPa, with porosity (P) ranging between 13% and 24%. The water-to-cement ratio (W/C) ranged from 0.14 to 0.40, while the cement content (C) ranged from 150 to 412 kg/m3. | [26] |
| Study 3 | ranged from 1 to 6.95 MPa, while the water-to-cement ratio (W/C) varied between 0.30 and 0.40. The quantity of cement (C) and water (W) utilized ranged from 150 to 250 kg/m3 and 45 to 100 kg/m3, respectively. The mixes A1 to A3 were designed with aggregate sizes of 4.50 mm, 9.50 mm, and 19.50 mm. | [27] |
| Failure Modes | Photos | Failure Modes in ASTM C39 | Explanation |
|---|---|---|---|
| Columnar cracks | 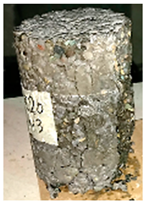 |  | The cracks are evenly distributed vertically around the sample, following the Type III model [97]. Columnar crack failure was observed in the samples tested for compressive strength, within an estimated UCS range of 1.00 to 4.00 MPa. |
| Cone | 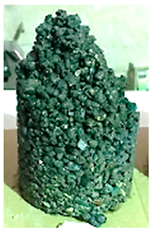 | 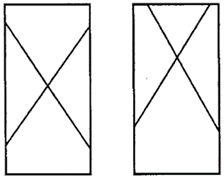 | Two cones were formed at both ends of the sample with intact corners, as described by the Type I model [97]. Cone failure occurred in the samples examined for compressive strength, falling within a projected UCS range of 8.50 to 10.50 MPa. |
| Shear | 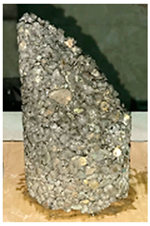 |  | The fracture extended throughout the entire sample without affecting the starting and ending points, as indicated by the Type IV model [97]. Shear failure was detected in the samples examined for compressive strength, falling within an estimated UCS range of 4.50 to 6.00 MPa. |
| Side fractures | 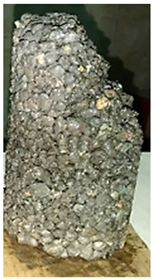 | 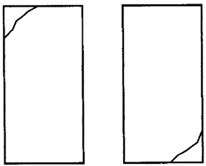 | The side fractures occurred either above or below the sample, in alignment with the Type V model [97]. Side fracture failure was observed in the samples tested for compressive strength, within an estimated UCS range of 6.00 to 8.00 MPa. |
| Run | UCS (MPa) | Permeability (cm/s) | Cement Content (kg/m3) | Tvc (s) | Standard |
|---|---|---|---|---|---|
| 4 | 7.679 | 0.302 | 280.00 | 80 | ACI 522R [33] |
Disclaimer/Publisher’s Note: The statements, opinions and data contained in all publications are solely those of the individual author(s) and contributor(s) and not of MDPI and/or the editor(s). MDPI and/or the editor(s) disclaim responsibility for any injury to people or property resulting from any ideas, methods, instructions or products referred to in the content. |
© 2024 by the authors. Licensee MDPI, Basel, Switzerland. This article is an open access article distributed under the terms and conditions of the Creative Commons Attribution (CC BY) license (https://creativecommons.org/licenses/by/4.0/).
Share and Cite
Adresi, M.; Yamani, A.; Tabarestani, M.K.; Nalon, G.H. A Prediction Model for the Unconfined Compressive Strength of Pervious Concrete Based on Mix Design and Compaction Energy Variables Using the Response Surface Methodology. Buildings 2024, 14, 2834. https://doi.org/10.3390/buildings14092834
Adresi M, Yamani A, Tabarestani MK, Nalon GH. A Prediction Model for the Unconfined Compressive Strength of Pervious Concrete Based on Mix Design and Compaction Energy Variables Using the Response Surface Methodology. Buildings. 2024; 14(9):2834. https://doi.org/10.3390/buildings14092834
Chicago/Turabian StyleAdresi, Mostafa, Alireza Yamani, Mojtaba Karimaei Tabarestani, and Gustavo Henrique Nalon. 2024. "A Prediction Model for the Unconfined Compressive Strength of Pervious Concrete Based on Mix Design and Compaction Energy Variables Using the Response Surface Methodology" Buildings 14, no. 9: 2834. https://doi.org/10.3390/buildings14092834
APA StyleAdresi, M., Yamani, A., Tabarestani, M. K., & Nalon, G. H. (2024). A Prediction Model for the Unconfined Compressive Strength of Pervious Concrete Based on Mix Design and Compaction Energy Variables Using the Response Surface Methodology. Buildings, 14(9), 2834. https://doi.org/10.3390/buildings14092834