
A Dynamic Impact Evaluation of the High-Quality Development of China’s Construction Industry Using the Panel Vector Autoregressive Model
Abstract
:1. Introduction
2. Theoretical Analysis and Literature Review
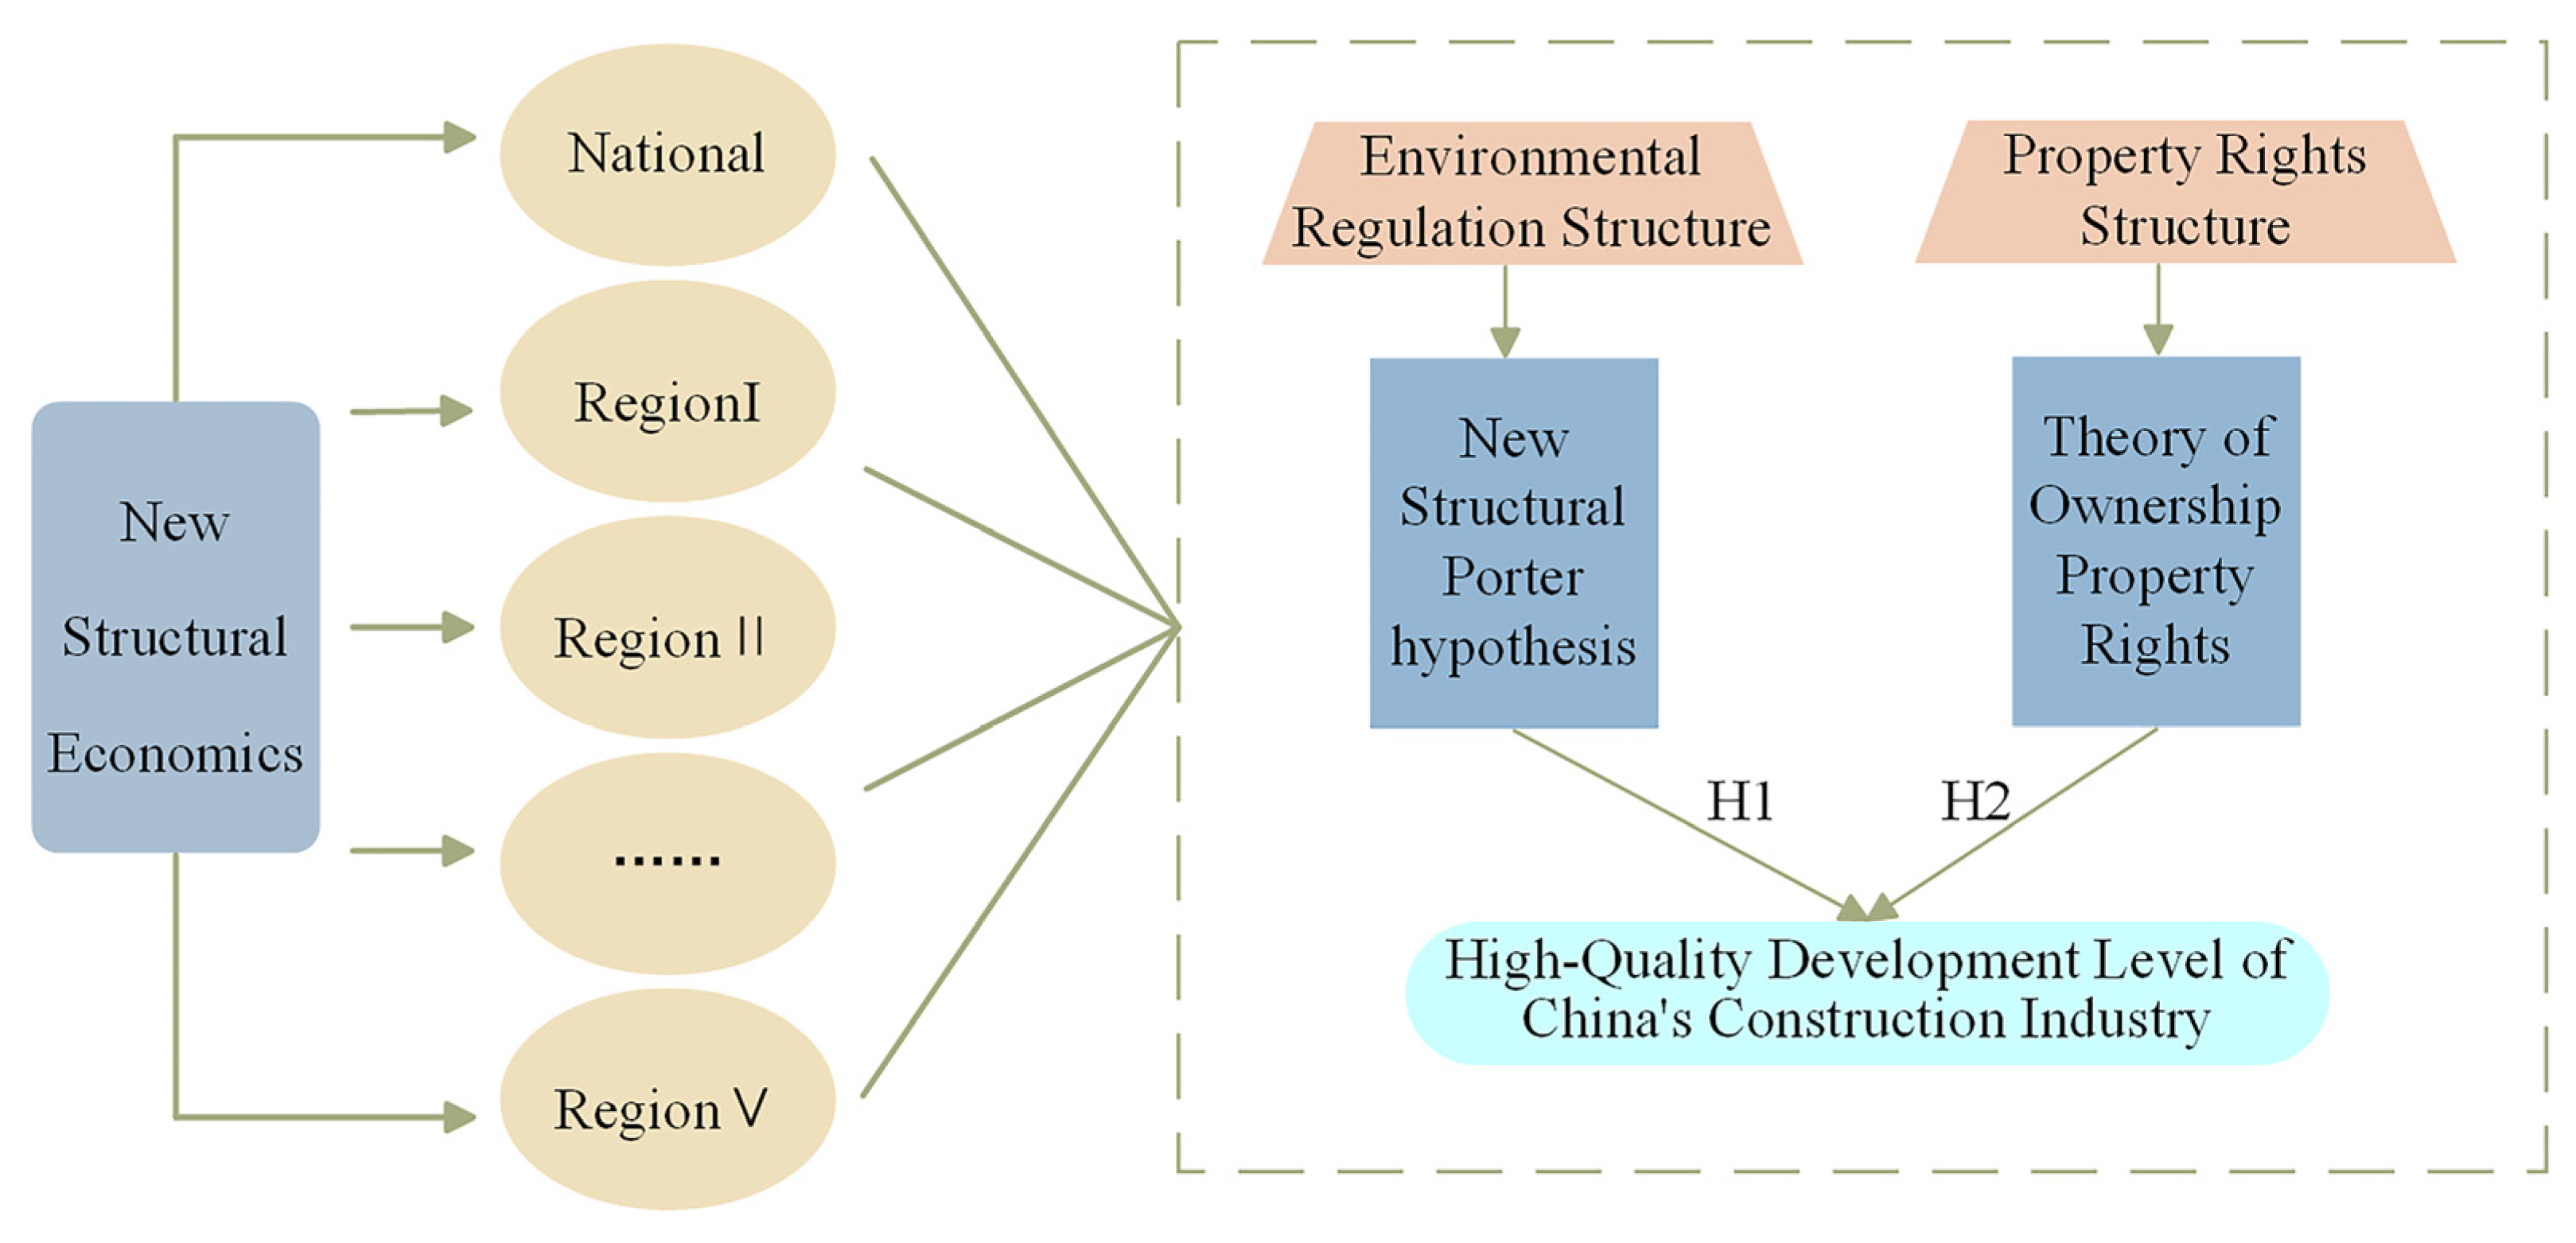
2.1. New Structural Economics
2.2. The Relationship between Environmental Regulation and High-Quality Development
2.3. The Relationship between Property Rights Structures and High-Quality Development
3. Main Variables and Model Specification
3.1. Main Variables
3.1.1. Level of High-Quality Development (HQ)
3.1.2. Environmental Regulation Structures (ERSs)
3.1.3. Property Rights Structures (PRSs)
3.2. Data Sources and Descriptive Statistics
3.3. Panel Vector Autoregressive Model
4. Regional Analysis by K-Means Clustering
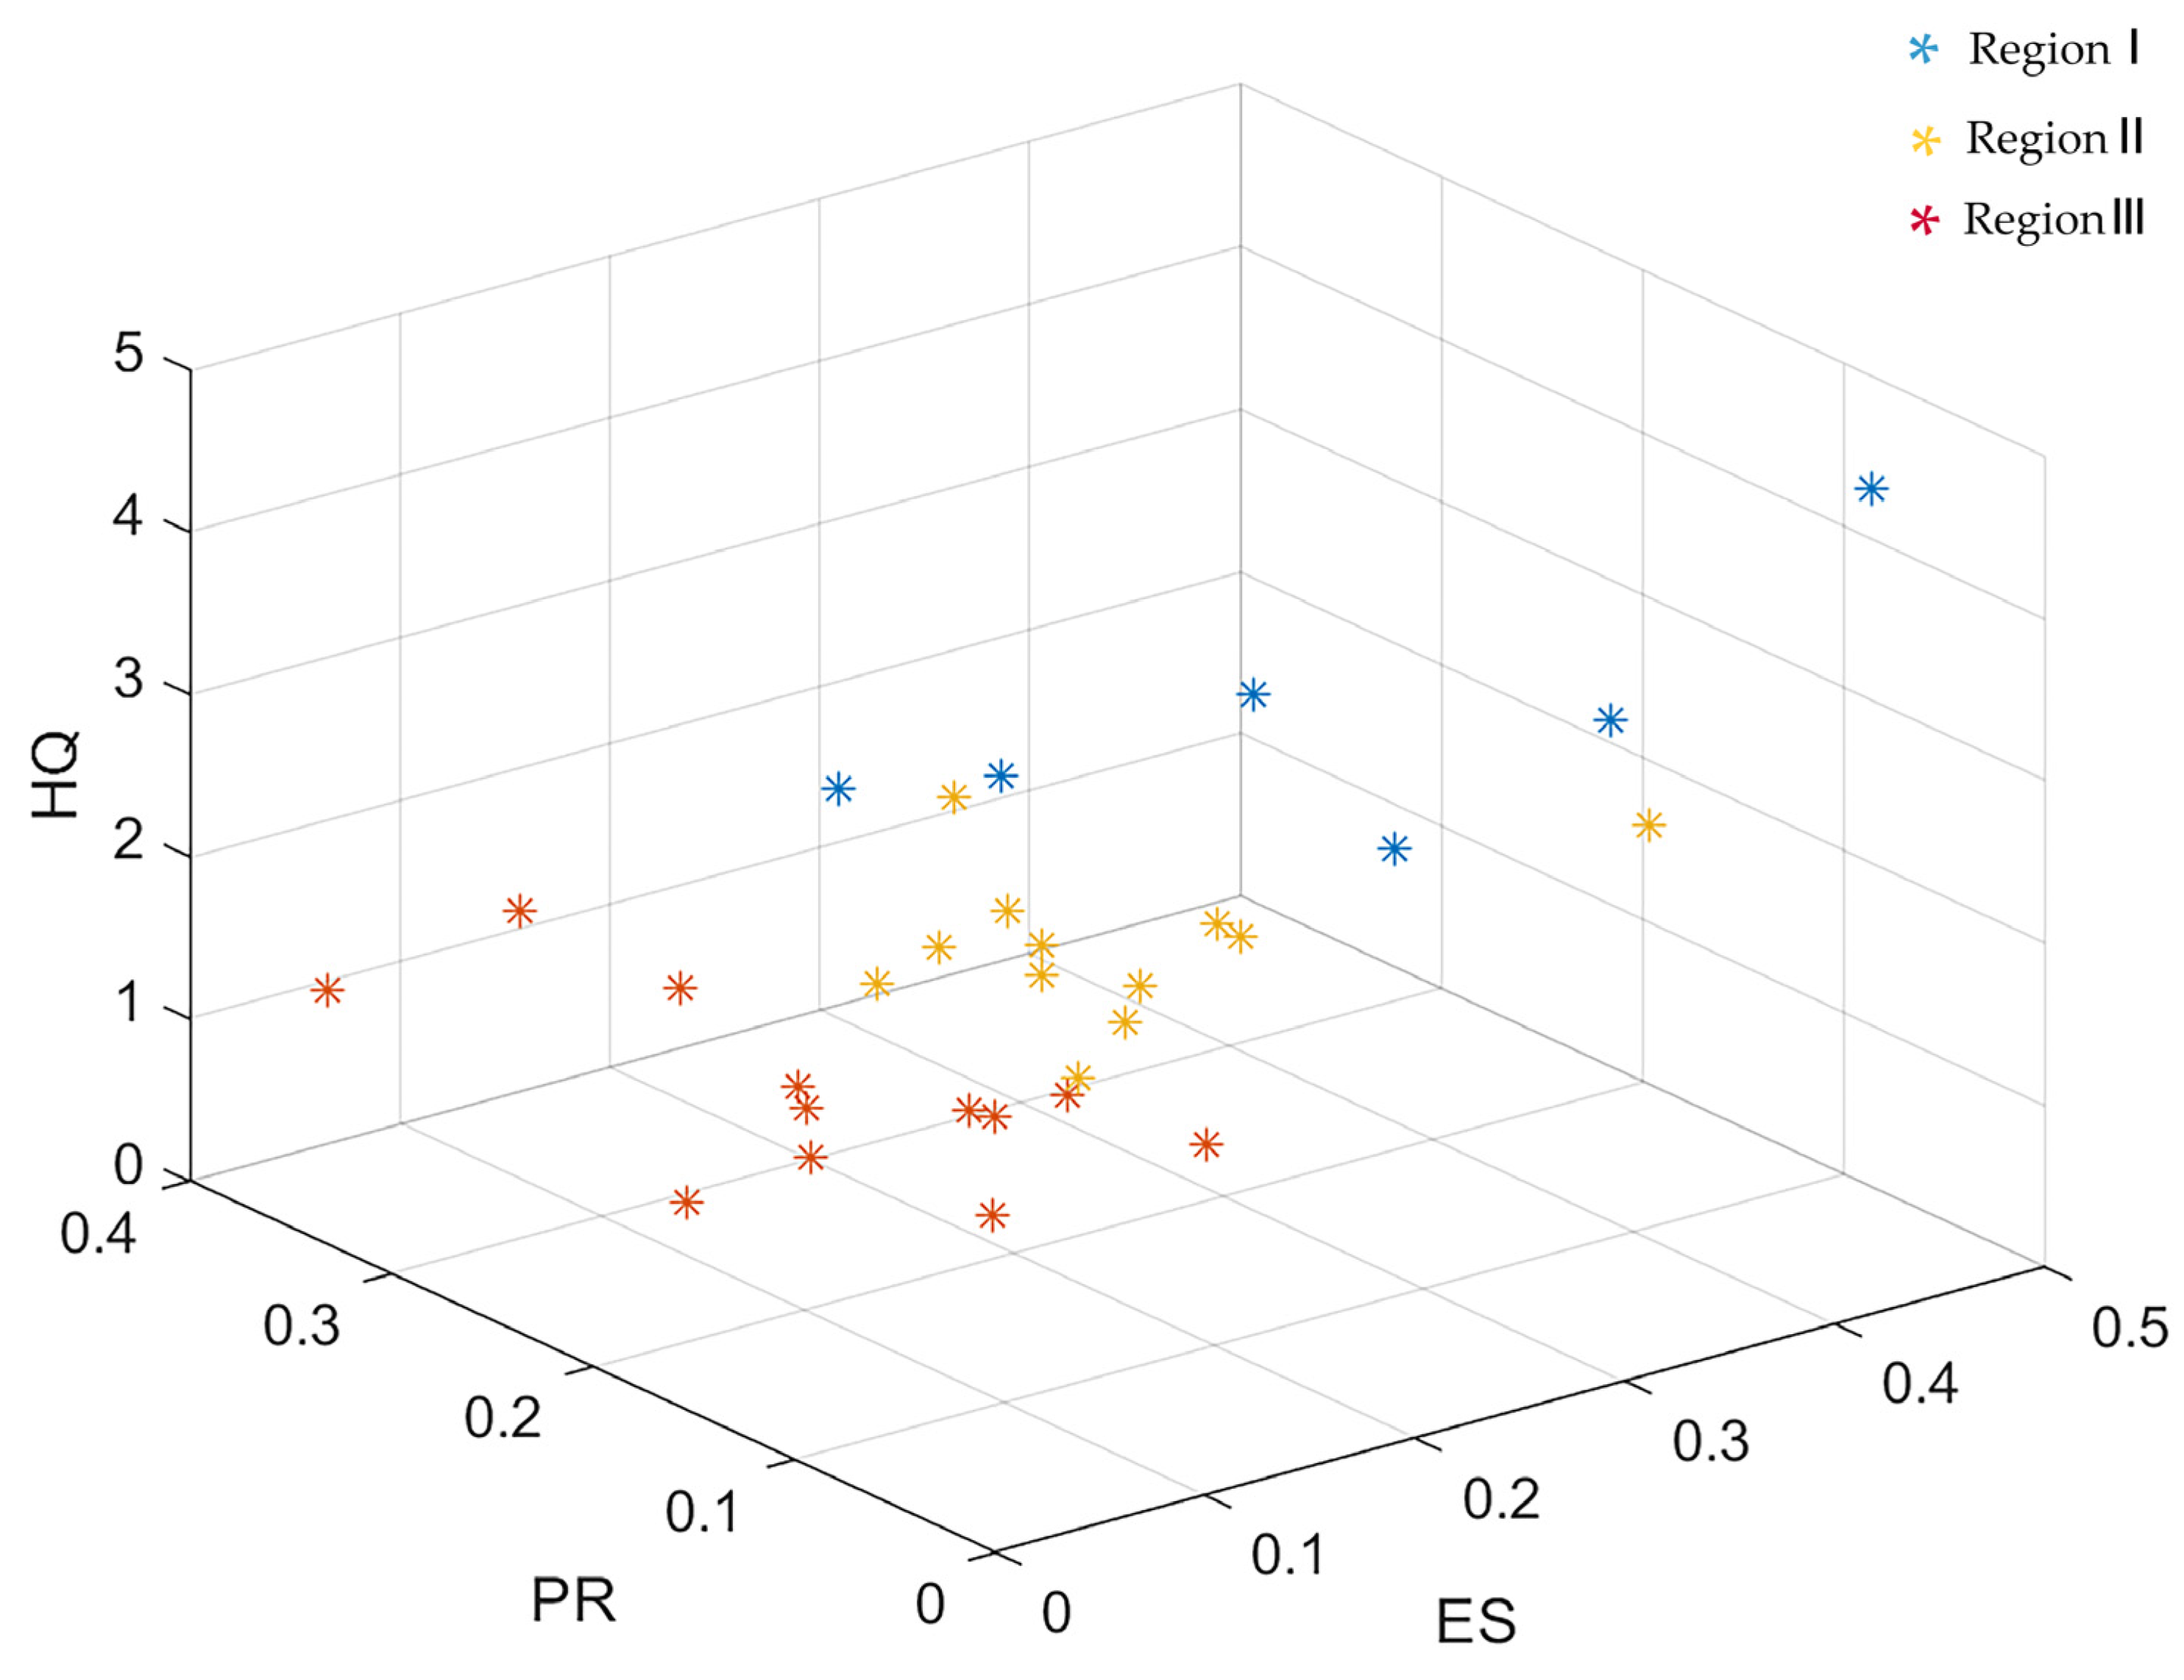
4.1. K-Means Clustering
4.2. Cluster Analysis Results
5. Empirical Results and Analysis
5.1. Unit Root Tests
5.2. Cointegration Test
5.3. PVAR Estimation
5.3.1. Lag Selection
5.3.2. PVAR Model Regression
5.4. Granger Causality Test
5.5. Model Stability Test
5.6. Impulse Response
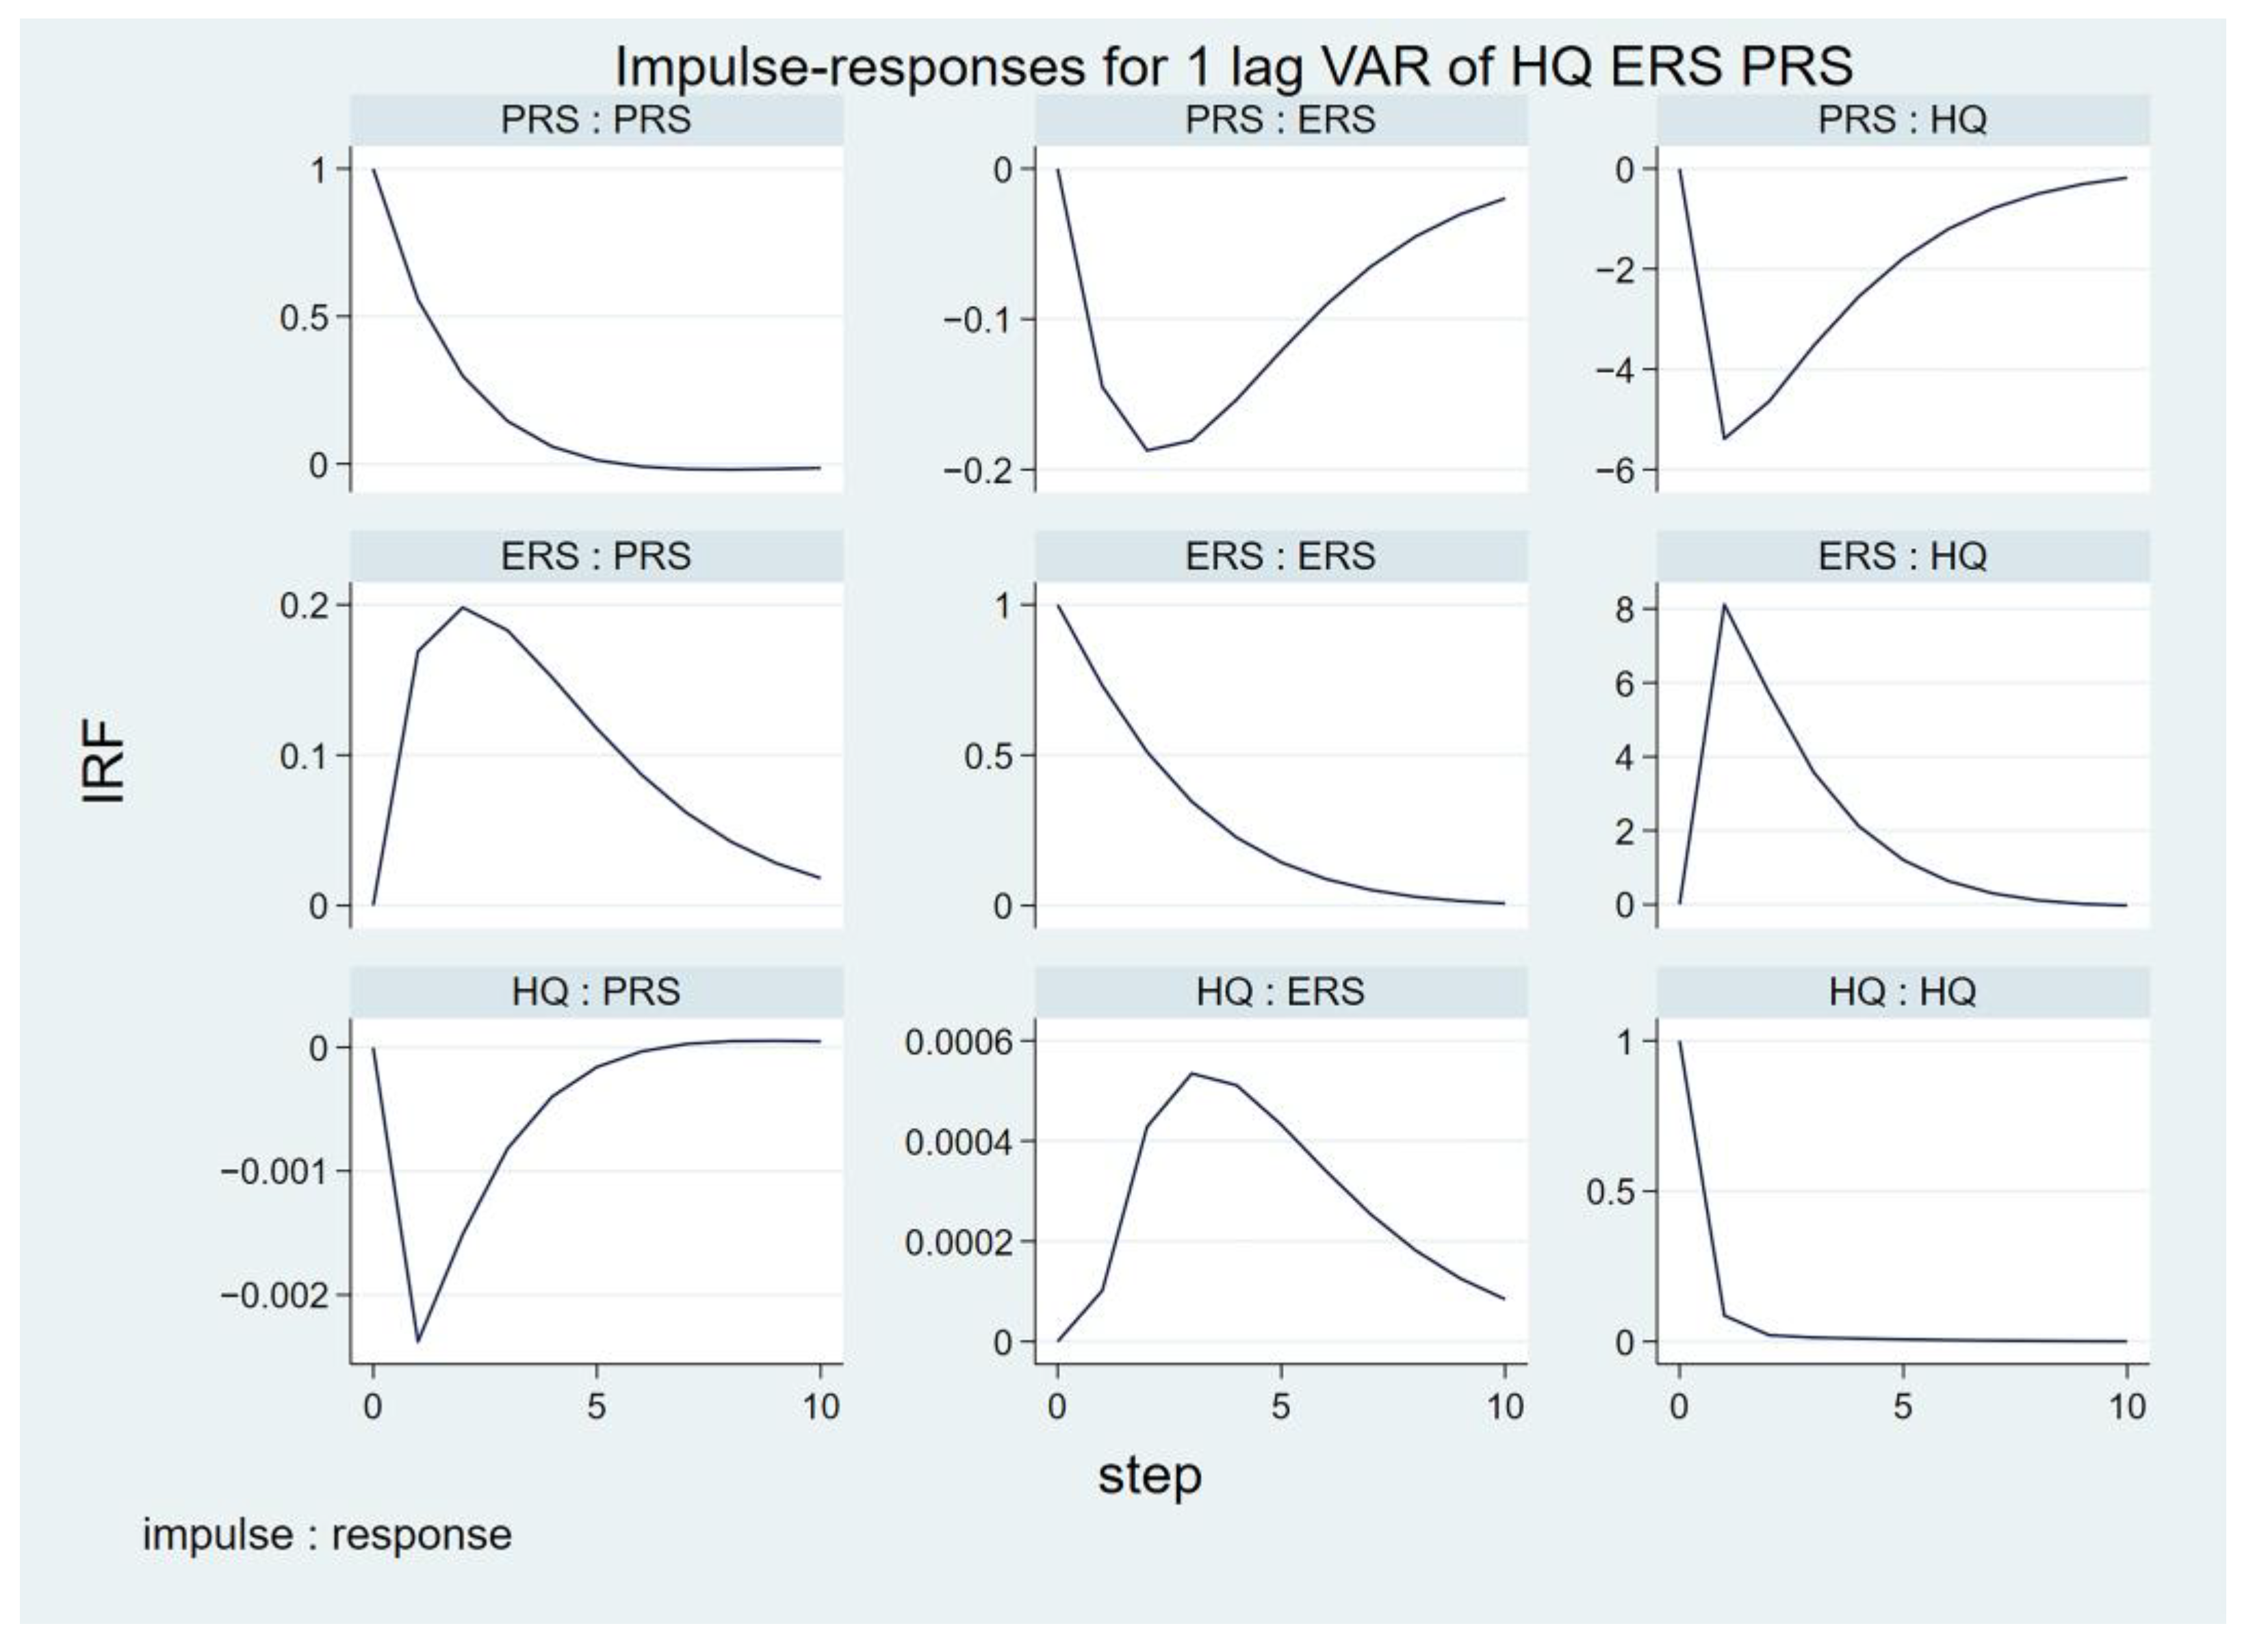
5.6.1. Impulse Response in China
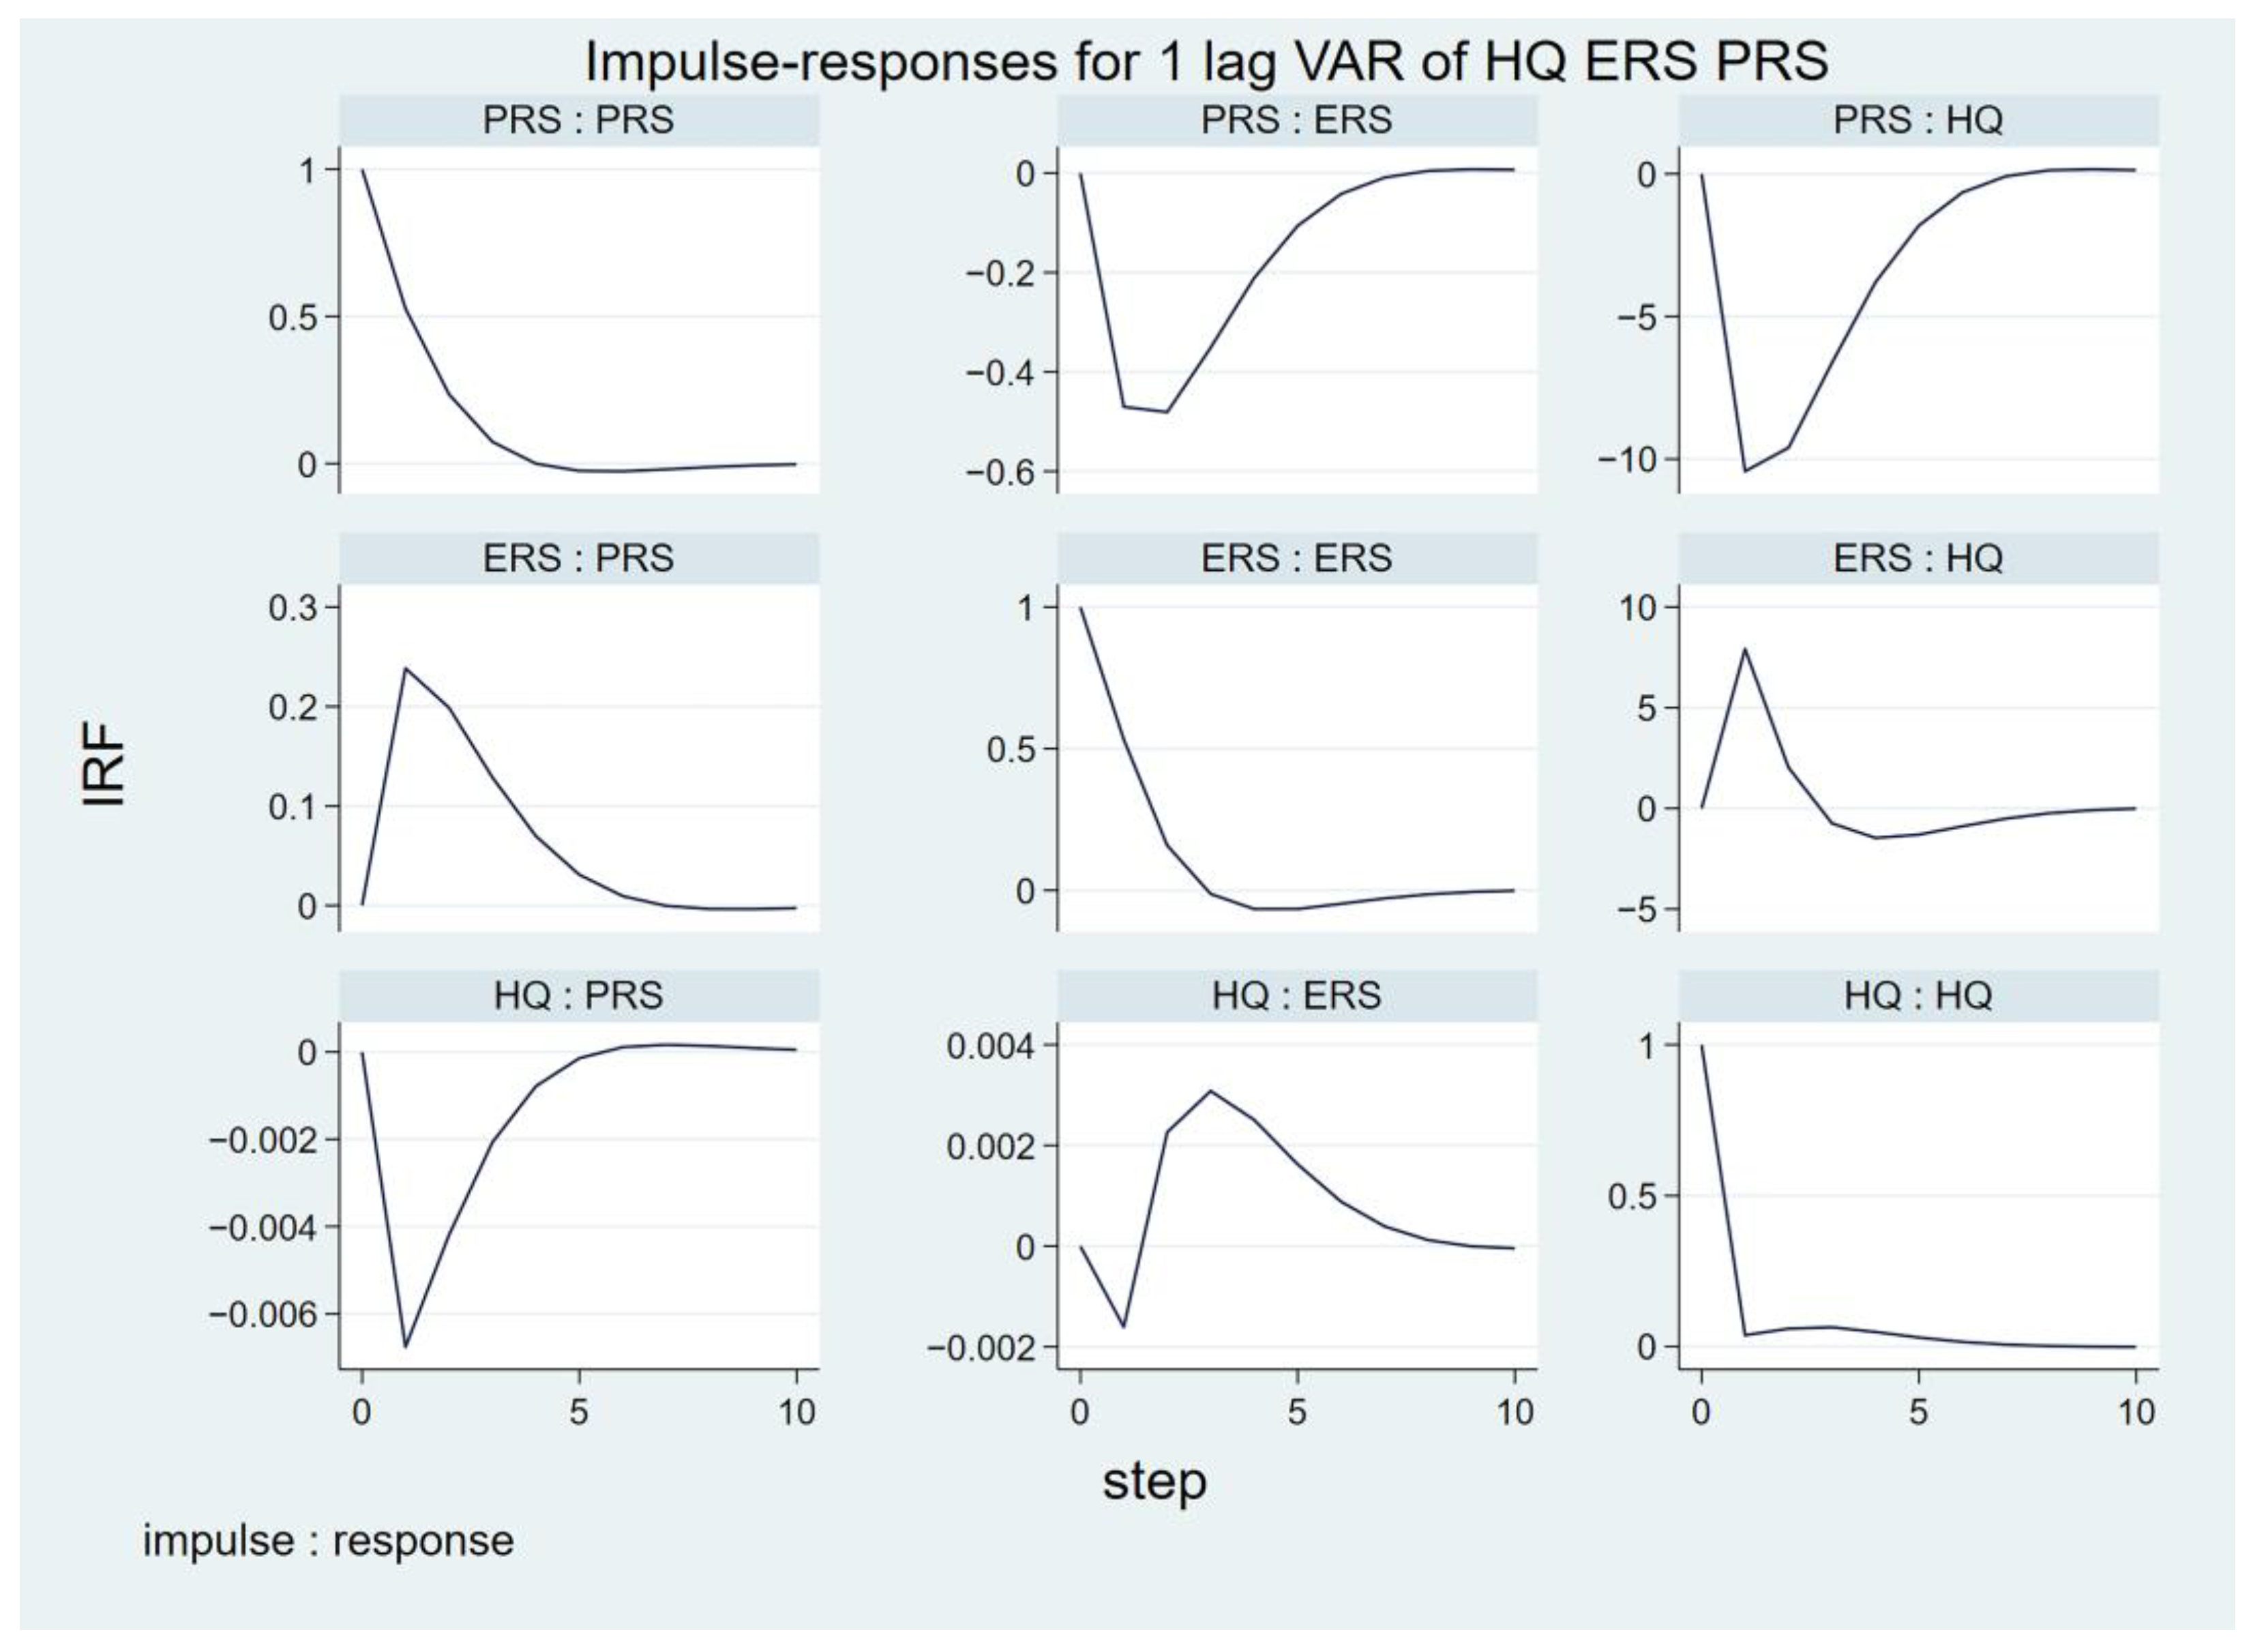
5.6.2. Impulse Response in Region I
5.6.3. Impulse Response in Region II
5.6.4. Impulse Response in Region III
5.7. Variance Decomposition
6. Discussion
7. Conclusions and Contributions
7.1. Conclusions
- (1)
- At the national level, ERS is a positive factor for HQ, whereas PRS is an inhibitor. It can be concluded from the GMM regression results and the granger causality test that there is a unidirectional causality between ERS and HQ and PRS and HQ. According to the regression coefficient, strict environmental regulations will promote the high-quality development of the construction industry, while state-owned property structures will be inhibited at the national level.
- (2)
- ERS has varying impacts on HQ in different regions. The results from the IRFs indicate that the positive effect of ERS on HQ is most significant in provinces with a lower degree of environmental regulations in Region III. The FEVD results suggest that the future ERS will play a relatively important role in influencing HQ in Regions II and III over the next 10 years.
- (3)
- PRS has distinct impacts on HQ in different regions. The results from the IRFs show that the short-term dampening effect of the PRS on HQ is most pronounced in Region I, which exhibits a higher degree of construction development. Conversely, PRS will produce a weak positive effect in the near future in Region III. The FEVD analysis demonstrates that the impact of PRS on HQ becomes more significant as time progresses, compared with ERS.
- (4)
- HQ demonstrates a notably weak differential effect on ERS and PRS across various regions. Additionally, ERS and PRS exhibit distinct interactions, as illustrated by the IRF figures. In different regions, these factors may either promote or inhibit one another. The local government should not ignore the coordination between the environment and property rights. A unilateral increase in the intensity of environmental regulations could significantly impede growth.
7.2. Academic and Practical Contributions
Author Contributions
Funding
Data Availability Statement
Conflicts of Interest
References
- Liu, T. Strategic Thinking on Advancing Socialism with Chinese Characteristics on All Fronts in the New Era-Studying the Spirit of the 20th National Congress of the Communist Party of China. Front. Philos. China 2022, 17, 449–470. [Google Scholar] [CrossRef]
- Liu, R.N. Theoretical Analysis and Practical Discussion of “Supply-side Reform”. In Proceedings of the Meeting International Conference on Information, Computer and Education Engineering (ICICEE), Hong Kong, China, 11–12 November 2017. [Google Scholar]
- Lin, J.Y. New structural economics: A framework for rethinking development. World Bank Res. Obs. 2011, 26, 193–221. [Google Scholar] [CrossRef]
- Zhang, Y.; Diao, X. The changing role of agriculture with economic structural change—The case of China. China Econ. Rev. 2020, 62, 101504. [Google Scholar] [CrossRef]
- Losch, B. Decent employment and the future of agriculture. How dominant narratives prevent addressing structural issues. Front. Sustain. Food Syst. 2022, 6, 862249. [Google Scholar] [CrossRef]
- Haas, C.; Kempa, K. Directed technical change and energy intensity dynamics: Structural change vs. energy efficiency. Energy J. 2018, 39, 127–151. [Google Scholar] [CrossRef]
- Zhou, S.; Liu, A.; Hu, R.; Guo, J. Research on the impact of structural heterogeneity on the high quality development of energy in China. Theory Pract. Financ. Econ. 2023, 44, 86–91. [Google Scholar] [CrossRef]
- Chen, Y.; Ma, L.; Zhu, Z. The environmental-adjusted energy efficiency of China’s construction industry: A three-stage undesirable SBM-DEA model. Environ. Sci. Pollut. Res. 2021, 28, 58442–58455. [Google Scholar] [CrossRef]
- Xie, H.; Yang, Z. The risk management mode of construction project management in the multimedia environment of internet of things. Mob. Inf. Syst. 2021, 2021, 1311474. [Google Scholar] [CrossRef]
- Chen, Y.; Liu, B.; Shen, Y.; Wang, X. The energy efficiency of China’s regional construction industry based on the three-stage DEA model and the DEA-DA model. KSCE J. Civ. Eng. 2016, 20, 34–47. [Google Scholar] [CrossRef]
- Du, Q.; Lu, X.; Li, Y.; Wu, M.; Bai, M.; Yu, M. Carbon emissions in China’s construction industry: Calculations, factors and regions. Int. J. Environ. Res. Public Health 2018, 15, 1220. [Google Scholar] [CrossRef]
- Lin, J.Y. New structural economics: Reconstructing the framework of development economics. China Econ. Q. 2011, 10, 1–32. [Google Scholar] [CrossRef]
- Zhou, F.; Wang, X. The carbon emissions trading scheme and green technology innovation in China: A new structural economics perspective. Econ. Anal. Policy 2022, 74, 365–381. [Google Scholar] [CrossRef]
- Zhu, Y.; Zhang, J.; Duan, C. How does green finance affect the low-carbon economy? Capital allocation, green technology innovation and industry structure perspectives. Econ. Res. Istraživanja 2022, 36, 2110138. [Google Scholar] [CrossRef]
- Zhang, L.; Zhang, J. Evaluation and promotion path of high-quality development in the Chinese construction industry under the context of carbon neutrality. Environ. Dev. Sustain. 2024, 1–32. [Google Scholar] [CrossRef]
- Du, X. Thoughts on strategies and paths to achieve carbon peaking and carbon neutrality in China. Front. Energy 2023, 17, 324–331. [Google Scholar] [CrossRef]
- He, Y.; Shen, Y.; Xie, C. Internal adjustment and digital transformation of intermediate inputs: Economic performance and environmental effects. J. Clean. Prod. 2023, 419, 138155. [Google Scholar] [CrossRef]
- Jiang, X.; Shen, J.H.; Lee, C.C.; Chen, C. Supply-side structural reform and dynamic capital structure adjustment: Evidence from Chinese-listed firms. Pac. Basin Financ. J. 2021, 65, 101482. [Google Scholar] [CrossRef]
- Lin, J.Y. New structural economics: The third generation of development economics. Asian Educ. Dev. Stud. 2020, 9, 279–286. [Google Scholar] [CrossRef]
- Lin, J.Y. China’s belt and road initiative: The rationale and likely impacts of the new structural economics perspective. J. Int. Bus. Policy 2022, 5, 259–265. [Google Scholar] [CrossRef]
- Lin, J.Y.; Wang, Y. Seventy years of economic development: A review from the angle of new structural economics. China World Econ. 2020, 28, 26–50. [Google Scholar] [CrossRef]
- Wang, Y.; Wu, X. Research on high-quality development evaluation, space-time characteristics and driving factors of China’s construction industry under carbon emission constraints. Sustainability 2022, 14, 10729. [Google Scholar] [CrossRef]
- Shadbegian, R.; Gray, W. Pollution abatement expenditures and plant-level productivity: A production function approach. Ecol. Econ. 2005, 54, 196–208. [Google Scholar] [CrossRef]
- Greenstone, M.; List, J.A.; Syverson, C. The effects of environmental regulation on the competitiveness of US manufacturing (No. w18392). Natl. Bur. Econ. Res. 2012, 93, 431–435. [Google Scholar]
- Porter, M.E.; Linde, C.V.D. Toward a new conception of the environment-competitiveness relationship. J. Econ. Perspect. 1995, 9, 97–118. [Google Scholar] [CrossRef]
- Porter, M.E. America’s green strategy. Bus. Environ. 1996, 33, 1072. [Google Scholar]
- Zheng, J.; Liu, F.; Zhao, Q.; Fu, C. Environmental regulation and innovative development of high quality: A theoretical study of the new structure porter hypothesis. Inq. Econ. Issues 2020, 15, 171–177. [Google Scholar]
- Böhringer, C.; Moslener, U.; Oberndorfer, U.; Ziegler, A. Clean and productive? Empirical evidence from the German manufacturing industry. Res. Policy 2012, 41, 442–451. [Google Scholar] [CrossRef]
- Zhou, X. Property rights as a relational concept: A sociological approach. Sociol. Stud. 2005, 2, 1–31. [Google Scholar]
- Yang, H.; Zeng, Q. Influence of market structure and ownership structure of construction industry of Yangtze River economic belt on market performance—Empirical analysis based on provincial panel data. J. Chongqing Tech. Bus. Uni. (Soc. Sci. Edit.) 2017, 34, 54–63. [Google Scholar]
- Lin, J.Y. State-owned enterprise reform in China: The new structural economics perspective. Struct. Change Econ. Dyn. 2021, 58, 101–111. [Google Scholar] [CrossRef]
- Wu, Y. Market structure ownership structure and R&D. Stat. Res. 2007, 67–75. [Google Scholar] [CrossRef]
- Li, B.; Wang, H. Comprehensive evaluation of urban high-quality development: A case study of Liaoning province. Environ. Dev. Sustain. 2023, 25, 1809–1831. [Google Scholar] [CrossRef]
- Sun, J.; Zheng, M.; Fu, J. Connotation and policy suggestions of high-quality development of construction industry in new era. Const. Econ. 2019, 40, 5–9. [Google Scholar] [CrossRef]
- Wang, W.; Qi, Z.; Zhang, L. Construction and evaluation of the measuring system for high-quality development of construction industry in new era. Const. Econ. 2019, 40, 21–26. [Google Scholar] [CrossRef]
- Chao, X.; Hui, K. Measuring quality of economic growth of China. Quant. Tech. Econ. 2009, 26, 75–86. [Google Scholar]
- Jolliffe, I.; Cadima, J. Principal component analysis: A review and recent developments. Philos. Trans. R. Soc. A 2016, 374, 20150202. [Google Scholar] [CrossRef]
- Liao, J.; Han, F.; Zhang, W.; Xu, D. The positive analysis of the effect of urbanization on land utilization efficiency in Changsha, Zhuzhou and Xiangtan. China Popul. Resour. Environ. 2010, 20, 30–36. [Google Scholar]
- Zhao, Y.; Zhu, F.; He, L. Definition classification and evolution of environmental regulations. China Popul. Resour. Environ. 2009, 19, 85–90. [Google Scholar]
- Peng, X.; Li, B. On green industrial transformation in China under different types of environmental regulation. J. Financ. Econ. 2016, 42, 134–144. [Google Scholar] [CrossRef]
- Pan, F.; Xu, J.; Xue, L. Voluntary environmental program: Research progress and future prospect. China Popul. Resour. Environ. 2020, 30, 74–82. [Google Scholar]
- Pargal, S.; Wheeler, D. Informal regulation of industrial pollution in developing countries: Evidence from Indonesia. J. Political Econ. 1996, 104, 1314–1327. [Google Scholar] [CrossRef]
- Li, R.Y.M.; Li, Y.L.; Crabbe, M.J.C.; Manta, O.; Shoaib, M. The impact of sustainability awareness and moral values on environmental laws. Sustainability 2021, 13, 5882. [Google Scholar] [CrossRef]
- Li, R.Y.M. Achieving Compliance with Environmental Health–Related Land Use Planning Conditions in Hong Kong: Perspectives from Traditional Motivation Theories. J. Environ. Health 2009, 72, 22–25. [Google Scholar]
- Li, Y.; Wang, M. Thereshold effects of financial strategies and property structure on economic growth. J. Financ. Econ. 2012, 38, 59–68. [Google Scholar] [CrossRef]
- Li, J.; Wei, P.; Zhang, L. Change of ownership structure and regional innovation inputs—An empirical study based on provincal panel data of China. RD Manag. 2017, 29, 11–22. [Google Scholar] [CrossRef]
- National Bureau of Statistics. China Statistical Yearbook; China Statistics Press: Beijing, China, 2023.
- National Bureau of Statistics; Ministry of Ecology and Environment. China Environmental Yearbook; China Statistics Press: Beijing, China, 2023.
- National Bureau of Statistics; Ministry of Housing and Urban-Rural Development. China Construction Industry Statistical Yearbook; China Statistics Press: Beijing, China, 2023.
- Love, I.; Zicchino, L. Financial development and dynamic investment behavior: Evidence from panel VAR. Q. Rev. Econ. Financ. 2006, 46, 190–210. [Google Scholar] [CrossRef]
- Yang, K.; Yi, J.; Chen, A.; Liu, J.; Chen, W.; Jin, Z. ConvPatchTrans: A script identification network with global and local semantics deeply integrated. Eng. Appl. Artif. Intell. 2022, 113, 104916. [Google Scholar] [CrossRef]
- Yang, K.; Yi, J.; Chen, A.; Liu, J.; Chen, W.; Jin, Z. ConDinet++: Full-scale fusion network based on conditional dilated convolution to extract roads from remote sensing images. IEEE Geosci. 2021, 19, 8015105. [Google Scholar] [CrossRef]
- Chen, H.; Yi, J.; Chen, A.; Zhou, G. Application of PVAR model in the study of influencing factors of carbon emissions. Math. Biosci. Eng. 2022, 19, 13227–13251. [Google Scholar] [CrossRef]
- Wu, X.; Kumar, V.; Ross Quinlan, J.; Ghosh, J.; Yang, Q.; Motoda, H.; Steinberg, D. Top 10 algorithms in data mining. Knowl. Inf. Syst. 2008, 14, 1–37. [Google Scholar] [CrossRef]
- Mac Queen, J.B. Some methods for classification and analysis of multivariate observations. In Fifth Berkeley Symposium on Mathematical Statistics and Probability; University of California Press: Berkeley, CA, USA, 1967. [Google Scholar]
- Sinaga, K.P.; Yang, M.-S. Unsupervised K-Means Clustering Algorithm. IEEE ACCESS 2020, 8, 80716–80727. [Google Scholar] [CrossRef]
- Jain, A.K. Data clustering: 50 years beyond K-means. Pattern Recognit. Lett. 2010, 31, 651–666. [Google Scholar] [CrossRef]
- Andrew, N.G. Clustering with the K-Means Algorithm. Mach. Learn. 2012. [Google Scholar]
- Shao, Q.L.; Guo, J.J.; Kang, P. Environmental response to growth in the marine economy and urbanization: A heterogeneity analysis of 11 Chinese coastal regions using a panel vector autoregressive model. Mar. Policy 2021, 124, 104350. [Google Scholar] [CrossRef]
- Abrigo, M.R.M.; Love, I. Estimation of panel vector autoregression in Stata. Stata J. 2016, 16, 778–804. [Google Scholar] [CrossRef]
- Hurlin, C. What Would Nelson and Plosser Find had They Used Panel Unit Root Test. Appl. Econ. 2010, 42, 1515–1531. [Google Scholar] [CrossRef]
- Ajayi, T.A. Oil price, energy consumption and CO2 emissions as growth determinants: A PVAR system GMM approach. Int. J. Energy Sect. Manag. 2024. ahead-of-print. [Google Scholar] [CrossRef]
- Liu, Z.; Xu, J.; Zhang, C. Technological innovation, industrial structure upgrading and carbon emissions efficiency: An analysis based on PVAR model of panel data at provincial level. J. Nat. Resour. 2022, 37, 508–520. [Google Scholar] [CrossRef]
- Liu, H.; Kim, H. Ecological Footprint, Foreign Direct Investment, and Gross Domestic Production: Evidence of Belt & Road Initiative Countries. Sustainability 2018, 10, 3527. [Google Scholar] [CrossRef]
- Acheampong, A.O. Economic growth, CO2 emissions and energy consumption: What causes what and where? Energy Econ. 2018, 74, 677–692. [Google Scholar] [CrossRef]
- Charfeddine, L.; Kahia, M. Impact of renewable energy consumption and financial development on CO2 emissions and economic growth in the MENA region: A panel vector autoregressive (PVAR) analysis. Renew. Energy 2019, 139, 98–213. [Google Scholar] [CrossRef]
- Dong, Y.; Jin, G.; Deng, X.Z. Dynamic interactive effects of urban land-use efficiency, industrial transformation, and carbon emissions. J. Clean. Prod. 2020, 270, 122547. [Google Scholar] [CrossRef]
- Shangguan, X.; Ge, B. Scientific and technological innovation, environmentalregulation and high-quality economic development: Empirical evidence from 278 Chinese cities at prefecture level and above. China Popul. Resour. Environ. 2020, 30, 95–104. [Google Scholar]
- Shang, L.; Tan, D.; Feng, S.; Zhou, W. Environmental regulation, import trade, and green technology innovation. Environ. Sci. Pollut. Res. 2022, 29, 12864–12874. [Google Scholar] [CrossRef]
- Chen, J.; Wang, X.; Shen, W.; Tan, Y.; Matac, L.M.; Samad, S. Environmental uncertainty, environmental regulation and enterprises’ green technological innovation. Int. J. Environ. Res. Public Health 2022, 19, 9781. [Google Scholar] [CrossRef]
- Porter, M.E.; Montgomery, C.A. Strategy: Seeking and Securing Competitive Advantage; Harvard Business School Press: Boston, MA, USA, 1991. [Google Scholar]
- Tang, D.C.; Tang, J.X.; Ma, T.Y. Environmental regulation efficiency and TFP in China-econometric explanation based on SBM-undesirable and DEA-Malmquist. J. Arid. Land. Resour. Environ. 2016, 11, 7–12. [Google Scholar]
- Zhang, J.; Liu, Y.; Chang, Y.; Zhang, L. Industrial eco-efficiency in China: A provincial quantification using three-stage data envelopment analysis. J. Clean. Prod. 2017, 143, 238–249. [Google Scholar] [CrossRef]
- Lin, G.; Zhang, Y. Two paradigms of the analysis of property rights. Soc. Sci. China 2000, 1, 134–145+207. [Google Scholar]
- Liu, X. The structure of property rights in the Chinese transition economy. Econ. Res. J. 2003, 1, 21–29+92. [Google Scholar]
- Kwon, H.U.; Narita, F.; Narita, M. Resource Reallocation and Zombie Lending in Japan in the 1990s. Rev. Econ. Dyn. 2015, 18, 709–732. [Google Scholar] [CrossRef]
- Sun, Y.; Lin, C. Study on the relationship between environmental regulation and the quality of China’s economic growth—A perspective based on environmental kuznets curve. Shanghai J. Econ. 2018, 3, 84–94. [Google Scholar] [CrossRef]
- You, X.; Wu, J.; Li, Z. Research on the impact of green insurance on regional environmental quality: Evidence from China. Front. Environ. Sci. 2024, 12, 1364288. [Google Scholar] [CrossRef]
- Liu, D.; Zheng, J.; Pan, M. Research on the impact of property rights structure on innovation investment in China’s manufacturing industry. Econ. Aff. 2021, 6, 25–29. [Google Scholar]
- Zhang, J.; Li, H.; Xia, B.; Skitmore, M. Impact of environment regulation on the efficiency of regional construction industry: A 3-stage Data Envelopment Analysis(DEA). J. Clean. Prod. 2018, 200, 770–780. [Google Scholar] [CrossRef]
- Fontana, S.; D’Amico, E.; Coluccia, D.; Solimene, S. Does environmental performance affect companies’ environmental disclosure? Meas. Bus. Excell. 2015, 19, 42–57. [Google Scholar] [CrossRef]
- Simpson, R.; Zimmermann, M. (Eds.) The Economy of Green Cities: A World Compendium on the Green Urban Economy; Springer Science & Business Media: London, UK, 2012. [Google Scholar]
- Lin, J.Y.; Fu, C.; Zheng, J. New structural environmental economics: A theoretical framework. J. Nanchang Uni. (Hum. Soc. Sci.) 2021, 52, 25–43. [Google Scholar] [CrossRef]
- Wang, L.; Jiang, X. Analysis and prospect of China’s economy—Macroeconomics, the large-scale development of the western region, and the reform of state-owned enterprises. China Ind. Econ. 2000, 5–14. [Google Scholar] [CrossRef]
- Shen, G. Comparative Advantages and Zombie Firms:A Study based on New Structural Economics. J. Manag. World 2016, 12, 13–24+187. [Google Scholar] [CrossRef]


| Primary Indicators | Secondary Indicators | Unit | Indicator Attribute |
|---|---|---|---|
| Industry scale | Gross output value of the construction industry | CNY ten thousand | + |
| Number of construction enterprise units | individual | + | |
| Number of contracts signed by construction enterprises | Percentage of CNY million | + | |
| Completion rate of building area | + | ||
| Innovation driven | Technical equipment rate | RMB/person | + |
| Power equipment rate | KW/person | + | |
| Labor productivity | RMB/person | + | |
| Total year-end power of self-owned construction machinery and equipment | Million Kilowatts | + | |
| Green development | Sewage treatment rate | Percent | + |
| Greening coverage of the completed area | Percent | + | |
| Steel consumption with a total output value of CNY 100 million | Tons/CNY 100 million | - | |
| Wood consumption with a total output value of CNY 100 million | m3/CNY 100 million | - | |
| Cement consumption with a total output value of CNY 100 million | Tons/CNY 100 million | - | |
| Open development | The proportion of private enterprises | Percent | + |
| The proportion of foreign-invested enterprises | Percent | + | |
| The proportion of the output value of private enterprises | Percent | + | |
| The proportion of the output value of foreign-invested enterprises | Percent | + | |
| Efficiency level | Value-added of the construction industry | CNY ten thousand | + |
| Profit margin on production value | Percent | + | |
| Employees at the end of the period | Person | + | |
| Asset liability ratio | Percent | - |
| Primary Indicators | Secondary Indicators | Meaning of the Indicator |
|---|---|---|
| Explicit environmental regulations | Command-and-control environmental regulations | Investment in environmental pollution control/CNY 100 million |
| Market incentive environmental regulations | Income from sewage charges/CNY ten thousand | |
| Implicit environmental regulations | Public participatory environmental regulations | The total number of environmental petitions/ individuals |
| Variable | Variable Symbol | Meaning |
|---|---|---|
| Level of high-quality development of the construction industry | HQ | Comprehensive evaluation of the five indicators by principal component analysis |
| Environmental regulation structure | ERS | Entropy weight method for calculating environmental regulation structure |
| Property rights structure | PRS | The proportion of investment, employment, and revenue output of state-owned units in the national total |
| Variable | Obs | Mean | Std. dev | Min | Max | Skewness | Kurtosis | Jarque–Bera |
|---|---|---|---|---|---|---|---|---|
| HQ | 450 | 2.0819 | 1.1053 | 0.0160 | 6.3750 | 0.7470 | 3.6928 | 50.8501 |
| ERS | 450 | 0.1792 | 0.1200 | 0.0506 | 0.9067 | 2.5362 | 11.7488 | 1917.5764 |
| PRS | 450 | 0.1656 | 0.0954 | 0.1299 | 0.5443 | 1.3309 | 4.9930 | 207.3230 |
| Region | Provinces and Municipalities | Characteristics |
|---|---|---|
| I | Beijing, Shanghai, Jiangsu, Zhejiang, Shandong, and Guangdong | High-quality level of development, high degree of environmental regulations, and high proportion of state-owned property rights. |
| II | Tianjin, Hebei, Liaoning, Shanxi, Fujian, Anhui, Henan, Hubei, Hunan, Sichuan, Chongqing, and Shaanxi | Medium level of quality development, medium level of environmental regulations, and medium share of state ownership. |
| III | Inner Mongolia, Jilin, Heilongjiang, Jiangxi, Guangxi, Hainan, Guizhou, Yunnan, Gansu, Qinghai, Ningxia, and Xinjiang | Low quality development, low environmental regulations, and low share of state ownership. |
| Region | HQ | ERS | PRS |
|---|---|---|---|
| China | −4.2426 *** | 1.8874 | −4.4705 |
| I | −1.2332 | 1.5030 | 0.3013 * |
| II | −1.6397 * | −2.3341 *** | −1.0812 |
| III | −1.4258 * | −2.8866 *** | −1.0113 |
| Region | ∆HQ | ∆ERS | ∆PRS |
|---|---|---|---|
| China | −9.9700 *** | −9.2871 *** | −10.4187 *** |
| I | −3.5356 *** | −5.2992 *** | −4.8679 *** |
| II | −4.5091 *** | −11.8601 *** | −5.4196 *** |
| III | −5.5755 *** | −7.2085 *** | −6.0903 *** |
| Region | Modified Phillips–Perron Test | Phillips–Perron Test | Augmented Dickey–Fuller Test |
|---|---|---|---|
| China | 3.2957 *** | −6.1020 *** | −6.0076 *** |
| I | 2.0704 ** | −1.4420 * | −1.7893 ** |
| II | 1.4164 * | −5.7065 *** | −5.8123 *** |
| III | 2.4678 *** | −6.5818 *** | −2.4213 *** |
| Region | Lag | AIC | BIC | HQIC |
|---|---|---|---|---|
| China | 1 | −8.7747 * | −7.7680 * | −8.3756 * |
| 2 | −8.1743 | −7.0084 | −7.7107 | |
| 3 | −7.7812 | −6.4342 | −7.2439 | |
| I | 1 | −7.9531 * | −7.1373 * | −7.6265 * |
| 2 | −7.7236 | −6.5853 | −7.2705 | |
| 3 | −7.3495 | −5.8566 | −6.7596 | |
| II | 1 | −8.7328 * | −7.8530 * | −8.3754 * |
| 2 | −8.1453 | −7.0316 | −7.6927 | |
| 3 | −6.3332 | −4.9573 | −5.7741 | |
| III | 1 | −10.3161 * | −9.1680 * | −9.7570 * |
| 2 | −10.0477 | −8.8197 | −9.6904 | |
| 3 | −9.9334 | −8.9402 | −9.4809 |
| Region | Variable | HQt−1 | ERSt−1 | PRSt−1 |
|---|---|---|---|---|
| China | HQ | 0.0865 | 8.1120 *** | −5.3871 *** |
| ERS | 0.0001 | 0.7311 *** | −1.1451 *** | |
| PRS | −0.0024 | 0.1689 *** | 0.5566 *** | |
| I | HQ | 0.0883 | 1.4157 | −16.2496 ** |
| ERS | 0.0003 | 0.9152 *** | −0.0772 | |
| PRS | 0.0019 | −0.0785 ** | 0.2432 | |
| II | HQ | 0.0377 | 7.9106 *** | −10.4267 *** |
| ERS | −0.0016 | 0.5320 *** | −0.4703 *** | |
| PRS | −0.0067 | 0.2384 *** | 0.5261 *** | |
| III | HQ | −0.0913 | 34.7050 *** | −0.4553 |
| ERS | 0.0033 | 0.3668 *** | −0.0635 ** | |
| PRS | −0.0268 | 2.7607 *** | 0.7782 *** |
| Region | Variable | HQ | ERS | PRS |
|---|---|---|---|---|
| China | HQ | 64.542 *** | 24.511 *** | |
| ERS | 0.002 | 13.355 *** | ||
| PRS | 0.357 | 12.412 *** | ||
| I | HQ | 0.670 | 4.754 ** | |
| ERS | 0.005 | 0.342 | ||
| PRS | 0.663 | 4.458 ** | ||
| II | HQ | 70.387 *** | 32.809 *** | |
| ERS | 0.080 | 38.492 *** | ||
| PRS | 1.730 | 20.111 *** | ||
| III | HQ | 33.488 *** | 0.336 | |
| ERS | 2.188 | 6.410 ** | ||
| PRS | 2.257 | 25.936 *** |
| Region | Period | HQ | ERS | PRS |
|---|---|---|---|---|
| China | 2 | 81.52 | 11.80 | 6.68 |
| 4 | 70.88 | 16.88 | 12.24 | |
| 6 | 69.06 | 17.25 | 13.69 | |
| 8 | 68.75 | 17.24 | 14.01 | |
| 10 | 68.71 | 17.23 | 14.06 | |
| I | 2 | 66.15 | 0.41 | 33.81 |
| 4 | 62.29 | 2.08 | 35.62 | |
| 6 | 60.88 | 4.28 | 34.83 | |
| 8 | 59.90 | 5.82 | 34.28 | |
| 10 | 59.20 | 6.91 | 33.89 | |
| II | 2 | 69.61 | 21.43 | 8.96 |
| 4 | 61.80 | 20.68 | 17.52 | |
| 6 | 60.74 | 20.84 | 18.42 | |
| 8 | 60.62 | 20.98 | 18.39 | |
| 10 | 60.61 | 20.99 | 18.39 | |
| III | 2 | 74.59 | 25.35 | 0.06 |
| 4 | 70.82 | 27.04 | 2.14 | |
| 6 | 69.88 | 26.84 | 3.28 | |
| 8 | 69.57 | 27.01 | 3.41 | |
| 10 | 69.53 | 27.05 | 3.41 |
Disclaimer/Publisher’s Note: The statements, opinions and data contained in all publications are solely those of the individual author(s) and contributor(s) and not of MDPI and/or the editor(s). MDPI and/or the editor(s) disclaim responsibility for any injury to people or property resulting from any ideas, methods, instructions or products referred to in the content. |
© 2024 by the authors. Licensee MDPI, Basel, Switzerland. This article is an open access article distributed under the terms and conditions of the Creative Commons Attribution (CC BY) license (https://creativecommons.org/licenses/by/4.0/).
Share and Cite
Li, H.; Yang, X.; Meng, F.; Hou, Y.; Zhang, J.; Zhang, L.; Yang, G.; Liu, J. A Dynamic Impact Evaluation of the High-Quality Development of China’s Construction Industry Using the Panel Vector Autoregressive Model. Buildings 2024, 14, 2871. https://doi.org/10.3390/buildings14092871
Li H, Yang X, Meng F, Hou Y, Zhang J, Zhang L, Yang G, Liu J. A Dynamic Impact Evaluation of the High-Quality Development of China’s Construction Industry Using the Panel Vector Autoregressive Model. Buildings. 2024; 14(9):2871. https://doi.org/10.3390/buildings14092871
Chicago/Turabian StyleLi, Hui, Xin Yang, Fanyu Meng, Yu Hou, Jinshuai Zhang, Lingyao Zhang, Ge Yang, and Jiyu Liu. 2024. "A Dynamic Impact Evaluation of the High-Quality Development of China’s Construction Industry Using the Panel Vector Autoregressive Model" Buildings 14, no. 9: 2871. https://doi.org/10.3390/buildings14092871