Abstract
This study focused on optimizing a model house for different locations and types of thermal systems to understand better how heating system type affects thermal envelope design, operational greenhouse gas emissions, and life-cycle cost. The study investigated six different thermal system configurations in separate optimizations for five locations. Optimization implies reducing energy consumption, minimizing greenhouse gas emissions (GHG), lowering operational costs, ensuring regulatory compliance, enhancing resilience, and improving occupant comfort and health. The Pareto front, multi-objective optimization, is used to identify a set of optimal solutions, considering multiple goals that may conflict with each other. In determining the least-cost building design envelope, the design balances costs with other goals, such as energy efficiency and environmental impact. The optimizations determine the life-cycle cost versus operational GHG emissions for a single-detached house in Canadian locations with varying climates, emissions factors, and energy costs. Besides natural gas, the study evaluated four electricity-heated options: (a) an air-source heat pump, (b) a ductless mini-split heat pump, (c) a ground-source heat pump, and (d) an electric baseboard. A net-zero-carbon design with grid-tied photovoltaics was also optimized. Results indicate that the heating system type influences the optimal enclosure design. In each location, at least one all-electric kind of design has a lower life-cycle cost than the optimized gas-heated model, and such designs can mitigate the majority of operational GHG emissions from new housing in locations with a low carbon electricity supply.
1. Introduction
In Canada, over half of the homes are single-detached, single-family houses, which also account for 35% of new residential constructions [1,2]. Residential buildings consume 17% of the country’s energy and produce 14% of the annual greenhouse gas emissions (GHG). Single-detached homes, which are the focus of this study, produce 6.39% of the total GHG emissions [3]. The residential emissions come from both off-site electricity generation using fossil fuels and on-site combustion of fossil fuels for space and domestic hot water (DHW) heating. Natural gas is the most used heating fuel in Canada, accounting for 76% of households. Even though 80% of Canadians reside in homes connected to a relatively low carbon electric grid with an average annual emissions factor of 50 gCO2e/kWh or less, the majority of GHG emissions from residential buildings come from on-site combustion of fossil fuels, primarily natural gas [4,5]. The prevalent low-emitting alternatives to natural gas and oil furnaces include electric resistance baseboard heaters and water heaters. The relatively high cost of electricity per unit of energy usually renders electric resistance heating economically punitive.
Canada’s national model codes aim to build all new buildings to net-zero-energy-ready standards by 2030 [6]. New and innovative design approaches are being proposed for net-zero-energy building standards to gain public and industry acceptance and become mandatory. The new strategy should maintain initial and operational costs similarly to the existing norm. Additionally, they should be achievable and scalable in practice. Net-zero energy buildings are energy-efficient buildings equipped with state-of-the-art technologies (heat pumps, heat recovery, air-tight envelope design, etc.) and provisions to integrate renewable energy generation to balance energy demand and carbon emissions [7]. This approach will lead to operational net-zero carbon (NZC) buildings only if electricity is generated from low and non-emitting sources, such as nuclear and renewable energy [8].
In order to reduce GHG emissions and the operating costs of residential buildings, energy standards have tended to become more stringent over time. Building standards either prescribe minimum levels of energy performance for specific building components and ventilation rates , or for the building as whole to control total energy use, annual space heating demand and peak heating load [9]. To support these goals, building standards specify minimum efficiencies for heating systems, heat recovery ventilators (HRVs), DHW heaters and storage tanks, and air-conditioners. Electric heat pumps, with an efficiency ranging from 200% to 500% (coefficient of performance (COP) = 2 to 5) depending on the application, are a promising solution for a sustainable and economical heating transition. However, a more comprehensive study is necessary to evaluate the relative effectiveness of all of these options in the Canadian context, taking into account multiple variables [10,11].
Space heating accounts for about 60% of the energy used in residential homes in Canada. In order to minimize energy consumption and greenhouse gas emissions, the design of the building envelope should consider the local climate as well as factors such as the type of system, fuel type, and fuel price structure. Building energy modelling software (e.g., EnergyPlus, TRNSYS, eQuest, HOT2000, WUFI Plus, etc.) is a powerful design tool and extensively used in house design and performance evaluation [12,13]. The software falls into two general categories: evaluative tools and guidance tools. Evaluative tools rely heavily on expertise and trial and error [14,15]. The recommended guidance-focused tool for low-rise residential buildings, the purpose of this research, is the U.S. Department of Energy’s BEopt program. BEopt allows users to create a building energy model and choose from various design options, as well as analyze capital cost. BEopt uses the “modified sequential search technique” algorithm, which has been enhanced with three-speed techniques to skip certain design variants, thereby reducing overall computation time.
Bucking et al. [16,17] studied the EcoTerra house in Montreal by using BEopt. The optimization function selects energy models with a high probability of being nearer to the optimal Pareto front of the design space. There are 25 variables available for adjustment within this optimization including PV generation. Bucking et al. have suggested future work to gain a better understanding of initial and construction costs as well as to identify the most appropriate incentives to reduce either initial or lifecycle costs.
The aim of this building design optimization study is to evaluate building performance by comparing operating costs, energy consumption, capital cost, and environmental impact. The study compares a model house’s costs and GHG emissions when using electric heating options versus natural gas heating systems that comply with building codes in five major Canadian cities. These cities cover a range of geographical and climatic variations across the country. The optimization of the house design takes into account factors such as natural gas and electricity prices, electricity emissions factors, local climates, and construction costs to determine the most efficient designs and the requirement of solar PV electricity to make it NZC.
2. Methodology
The combustion of fossil fuels, both on-site and off-site, leads to GHG emissions. However, it is important to note that not all energy sources have the same carbon intensities. Therefore, energy use does not always correlate to GHG emissions. On the other hand, excessive energy use can result in high energy costs, but again, different energy sources have varying costs, which may not correlate directly with energy use. Other equally important factors to consider include energy independence, peak electric demand implications, and the possibility of renewable electricity use.
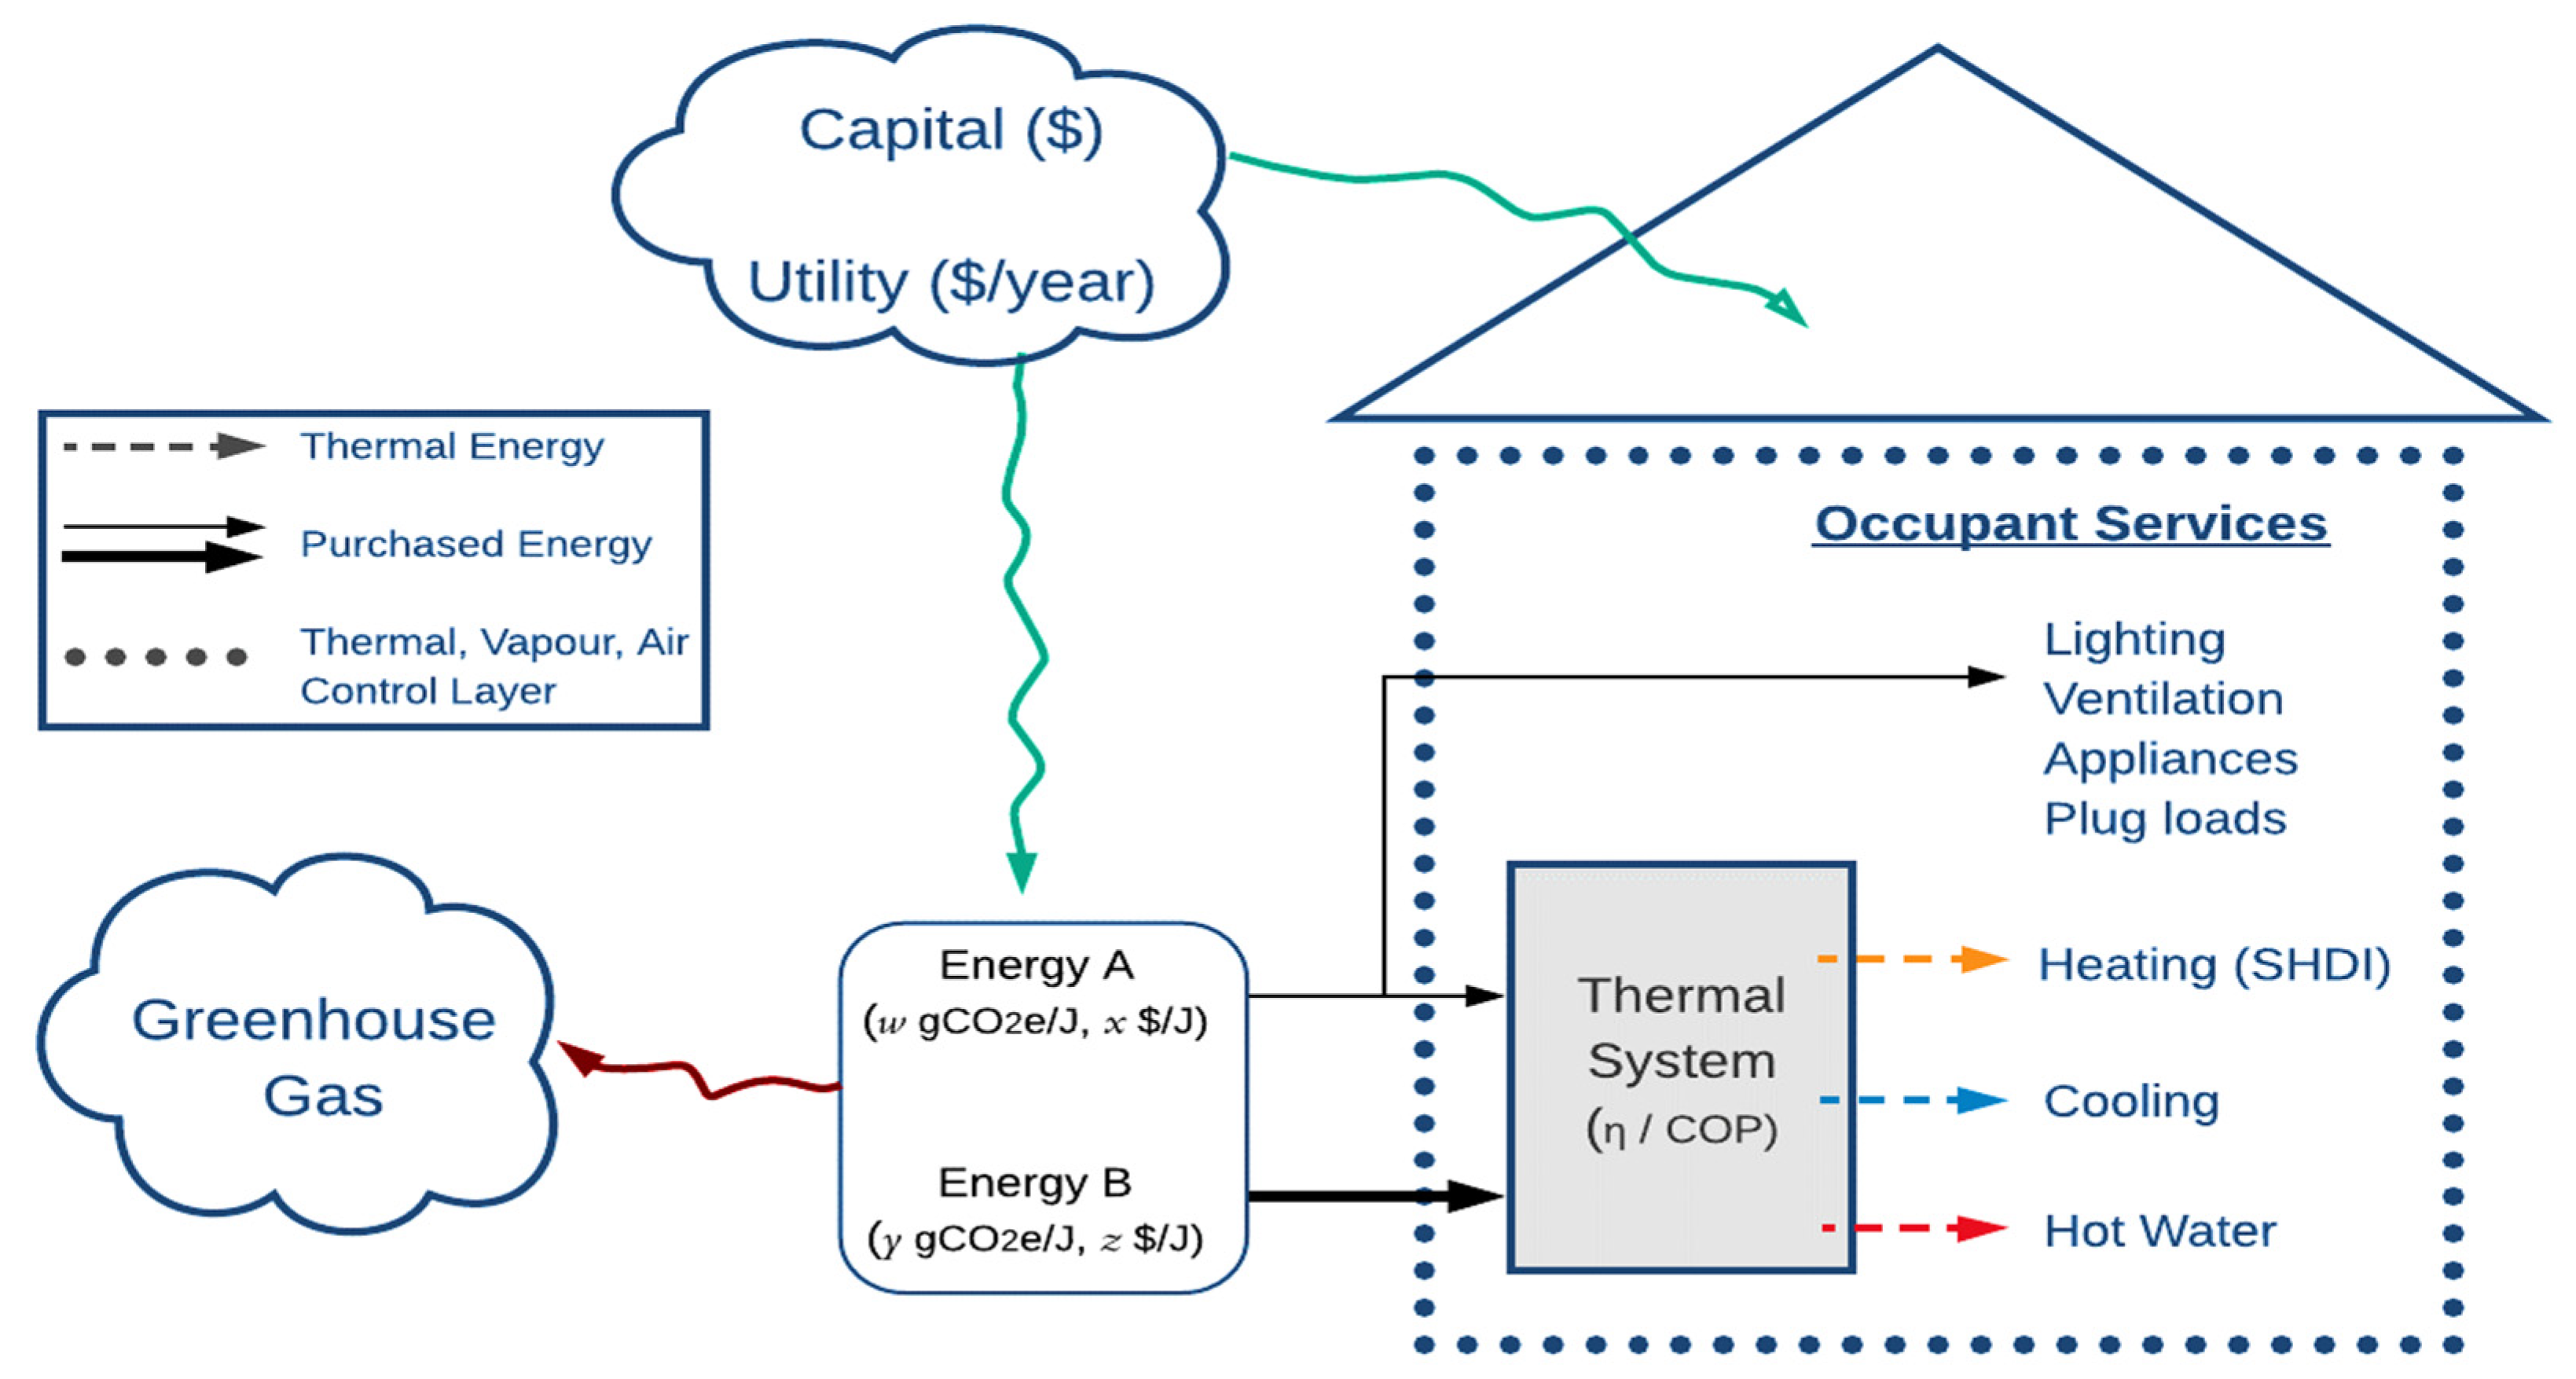
The space heating demand intensity (SHDI) metric is of interest as a proxy measure for the overall thermal performance of the building enclosure, including envelope thermal resistance, window performance, orientation and area, air barrier system performance, HRV thermal efficiency, and occupant density. Another important metric is the Energy Use Intensity (EUI). The EUI is a simple method of comparing building designs that does not differentiate between input purchased energy type. These metrics were selected for this research because of common use for defining the energy consumption of a building [18,19]. However, the building design optimization objectives have been chosen based on the premise that energy demand (EUI and SHDI) is merely an intermediate concern associated with the two primary concerns of life cycle cost (LCC) and GHG emissions. The objectives of this study are (Figure 1):
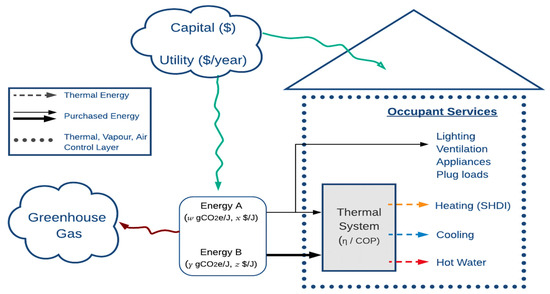
Figure 1.
LCC vs. GHG optimization analysis representation.
- Determine the life cycle cost (LCC) and GHG emissions of least-cost electric and zero-carbon building designs using fundamental economics, building physics, and the best available heating technologies, without subsidies or a carbon price.
- Analyze the correlation between heating system type/efficiency and optimal enclosure design (SHDI). Also, investigate the relationship between energy standard performance metrics (SHDI and EUI), homebuyer/ratepayer primary concern metrics, and electricity emission factors (EFs).
The study analysis is based on the whole-house optimized life cycle least-cost design. The resultant designs will be compared to an optimized gas-heated house design. The reference design in all locations is a gas-heated climate-specific minimum code-compliant design based on the National Building Code (NBC) 9.36 [20,21]. The optimization results have included location-specific factors such as climate, energy prices, construction costs, and electricity EFs.
2.1. Building Energy Performance Optimization
The National Renewable Energy Laboratory (NREL) created BEopt, a residential front-end to EnergyPlus [13]. This software can optimize the design of a typical single-detached house by creating a batch of building energy models. The optimized design is determined by comparing the developed models’ lifetime cost and annual GHG emissions. The objective is to achieve the global minimum, which is the minimum cost. However, for net-zero-carbon optimizations, the design with the lowest lifetime cost to achieve a Greenhouse Gas Intensity (GHGI) of 0 is manually selected from the Pareto front.
2.2. Thermal System Optimization
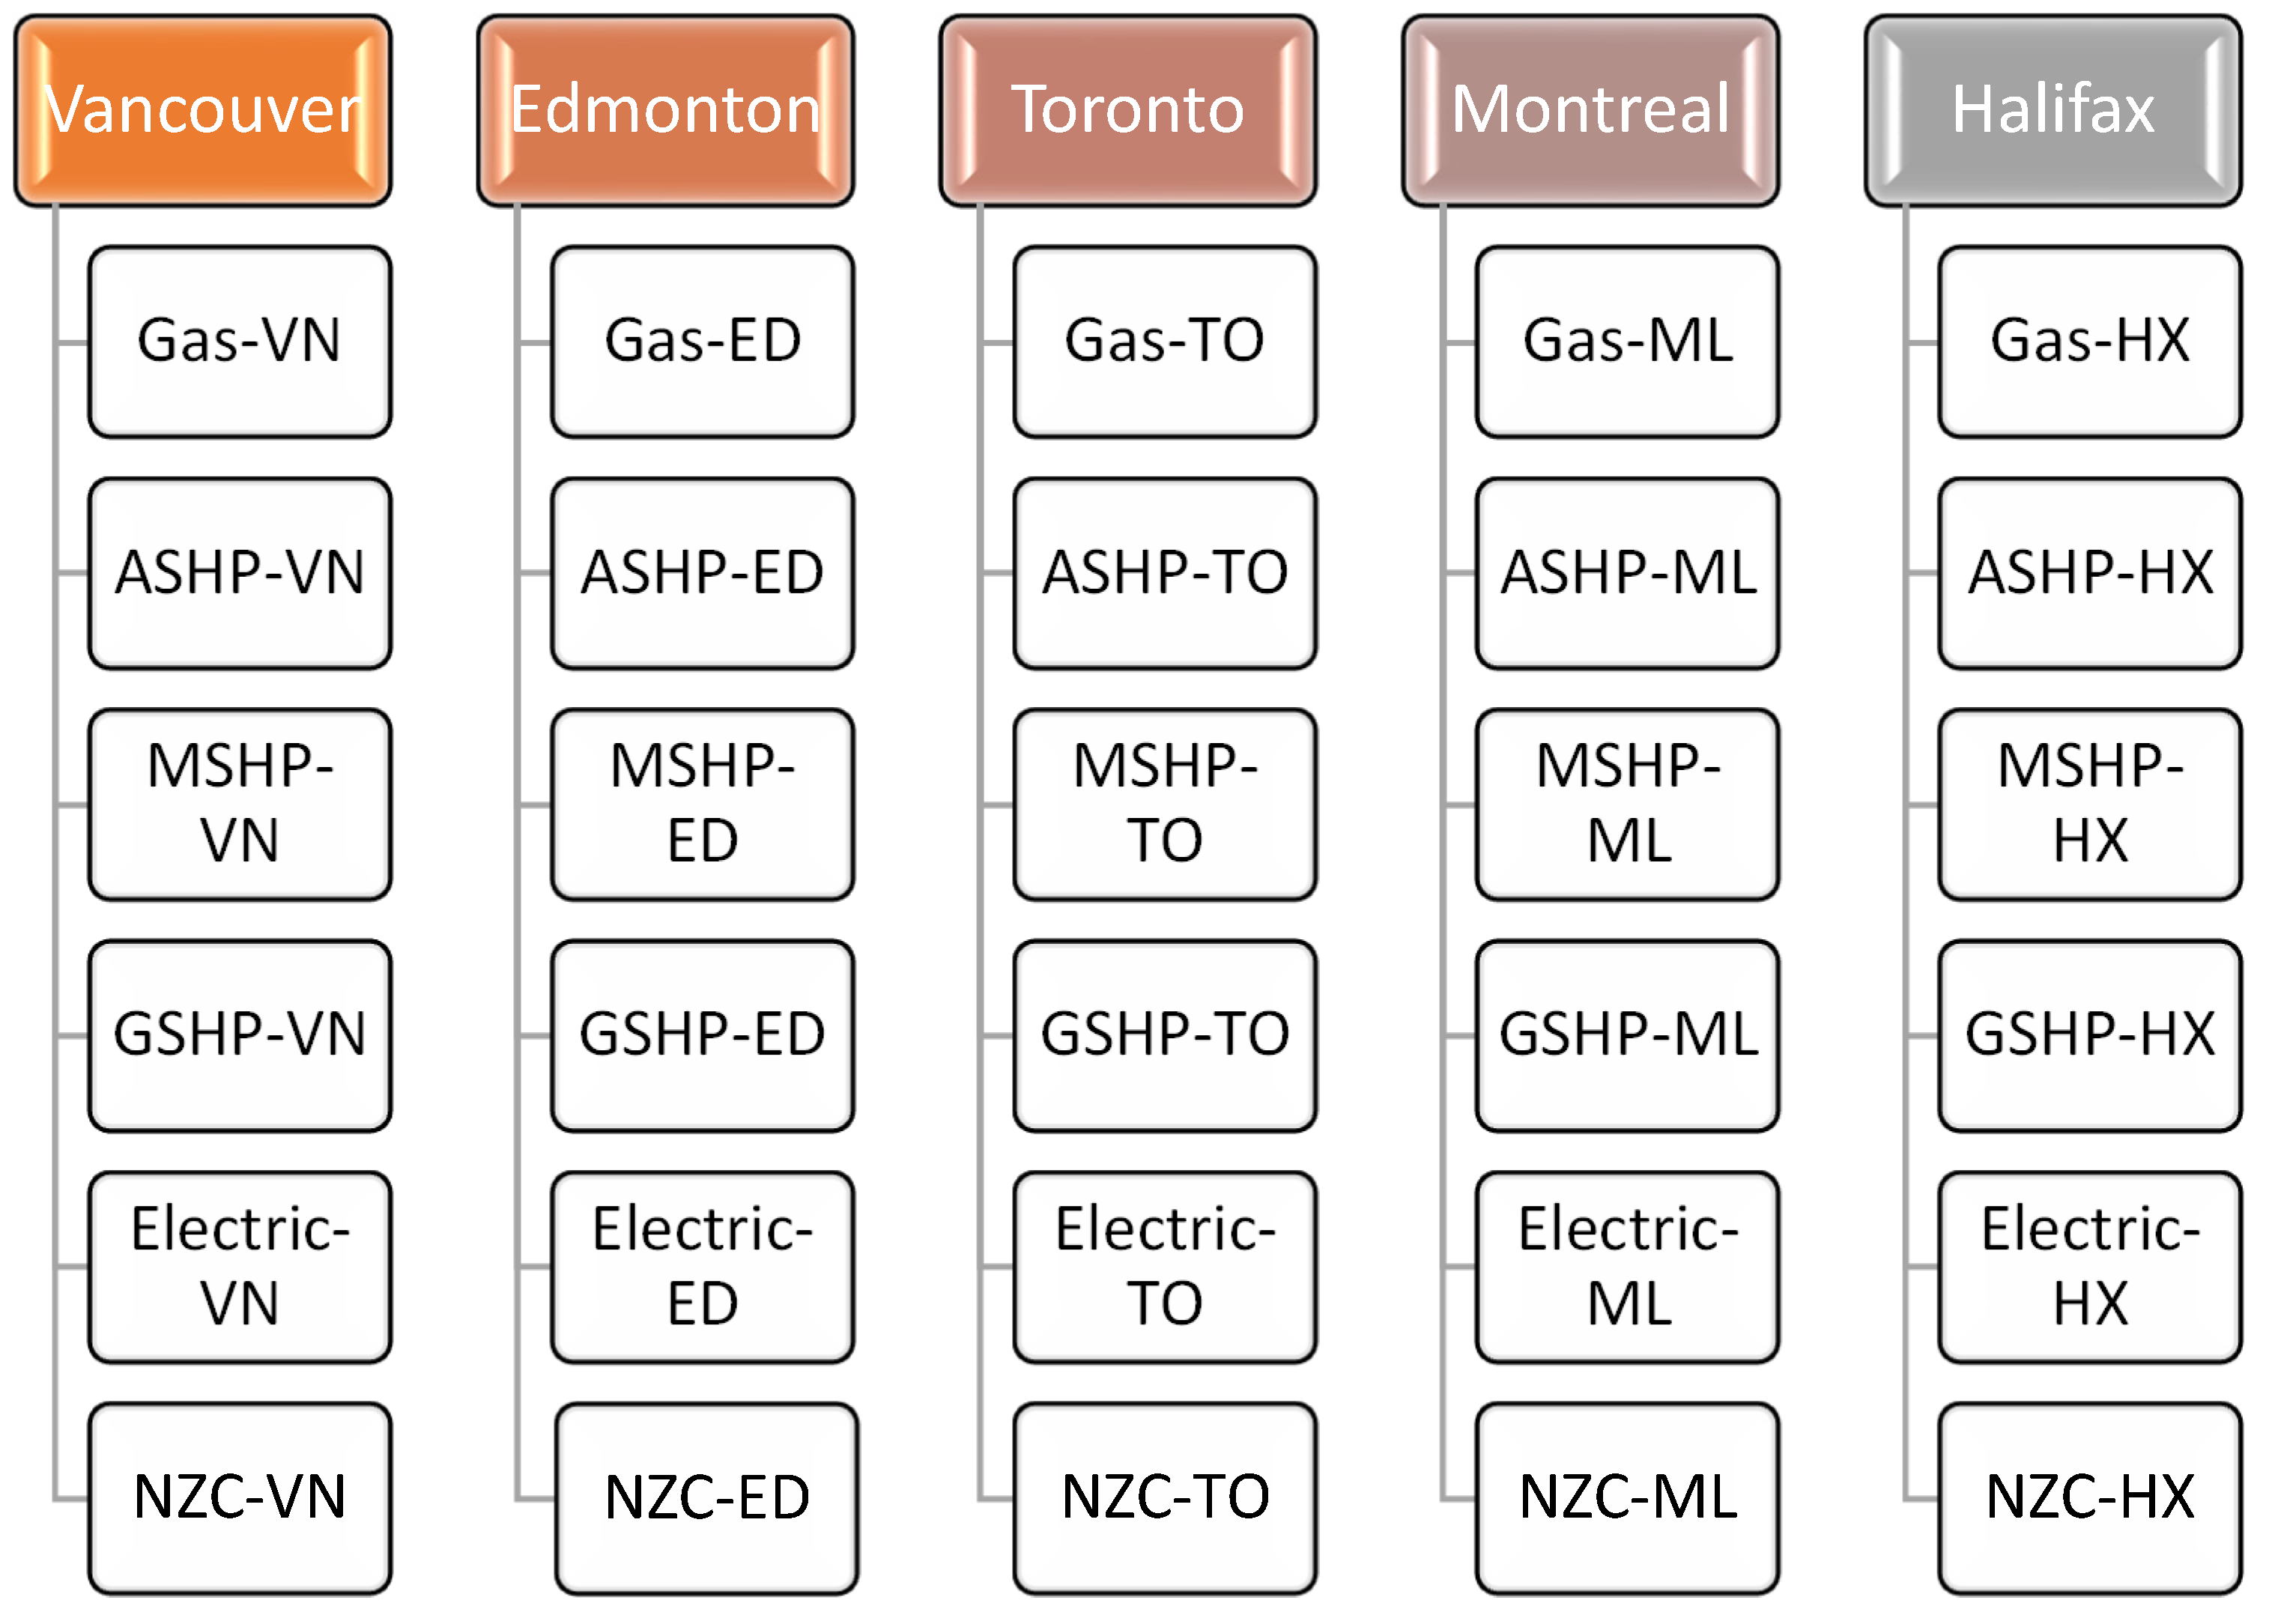
The study focused on optimizing a model house for different locations and types of thermal systems to understand better how heating system type affects thermal envelope design. The study investigated six different thermal system configurations in separate optimizations for each location (Figure 2). The type of heating system selection can affect GHGI, EUI, and operational costs based on the input energy source and system efficiency, which can be energy-source-dependent. For example, only heat pumps (which use electricity) can have a COP greater than 1. Some configurations can also provide significant capital savings, such as those that do not require ducting or those that use a single piece of equipment to provide multiple services.
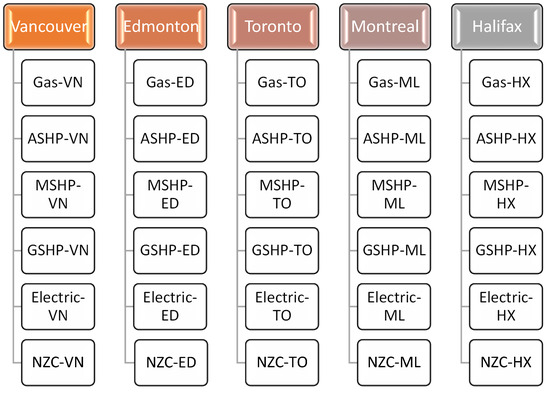
Figure 2.
Optimization schedule by location and thermal system type; NZC (net-zero carbon) is the overall least LCC all-electric design + PV. In this figure, VN stands for Vancouver, ED for Edmonton, TO for Toronto, ML for Montreal, HX for Halifax.
All models have a dedicated outdoor air ventilation system, which allows for the isolation of the thermal system as a set of interacting components, including space heating (both main and supplementary), space cooling, space conditioning delivery (ducting), and DHW production. By isolating this system, it becomes easier to compare it with other systems on a capital, operational, and LCC basis, as well as its effect on optimal enclosure design. The following equations illustrate the relationship between the thermal envelope, the thermal system (heating), and the purchased energy that governs the annual heating cost (operational only) [22].
Thermal Envelope:
Mechanical Heating System:
Passive-Active Relationship:
where
= purchased energy unit (electrical or chemical)
= thermal energy unit
= system thermal efficiency (or COP in the case of heat pumps)
2.3. Building Enclosure Thermal Performance
The aim is to find the best whole-house designs by exploring various options for building enclosure components such as thermal resistance, air leakage, window type, and windows-to-walls ratio. This is done separately for each thermal system type and location. NBC 9.36 sets the lower limit for each component, while increments and upper limit options are chosen based on realistic alternatives and engineering judgment. The range and granularity of component options have been carefully selected to achieve the true Pareto front while keeping computation time to a minimum. Building enclosure option inputs remain the same for each thermal-system-type optimization.
2.4. Electrification of Heating
Only the gas optimization and the reference model utilize natural gas, while all other models are fully electric. Given the uncertainties surrounding the GHG accounting of renewable energy generation offsets, this study prioritizes direct, onsite GHG reduction that can be accurately calculated. Indirect, offsite GHG reduction is given less priority. In other words, renewable generation capacity to achieve NZC is added only to all-electric designs. This approach is motivated by the low electricity EFs in the most Canadian provinces. The relative merit of prioritizing full electrification is assessed based on location, where electricity price and EFs play a crucial role.
2.5. Onsite Renewable Energy Generation
The energy generated through renewable sources, solar photovoltaic (PV) panels mounted on rooftops, is distributed. However, there are limitations with the electricity input EFs in BEopt, which means that a separate marginal EF for PV generation cannot be inputted. As a result, the NZC optimizations are performed by comparing the LCC versus the site energy generation. The optimal design is chosen from the Pareto front based on the PV generation versus gross consumption ratio necessary to achieve NZC for the electric grid.
3. Building Energy Model
3.1. Model House Description
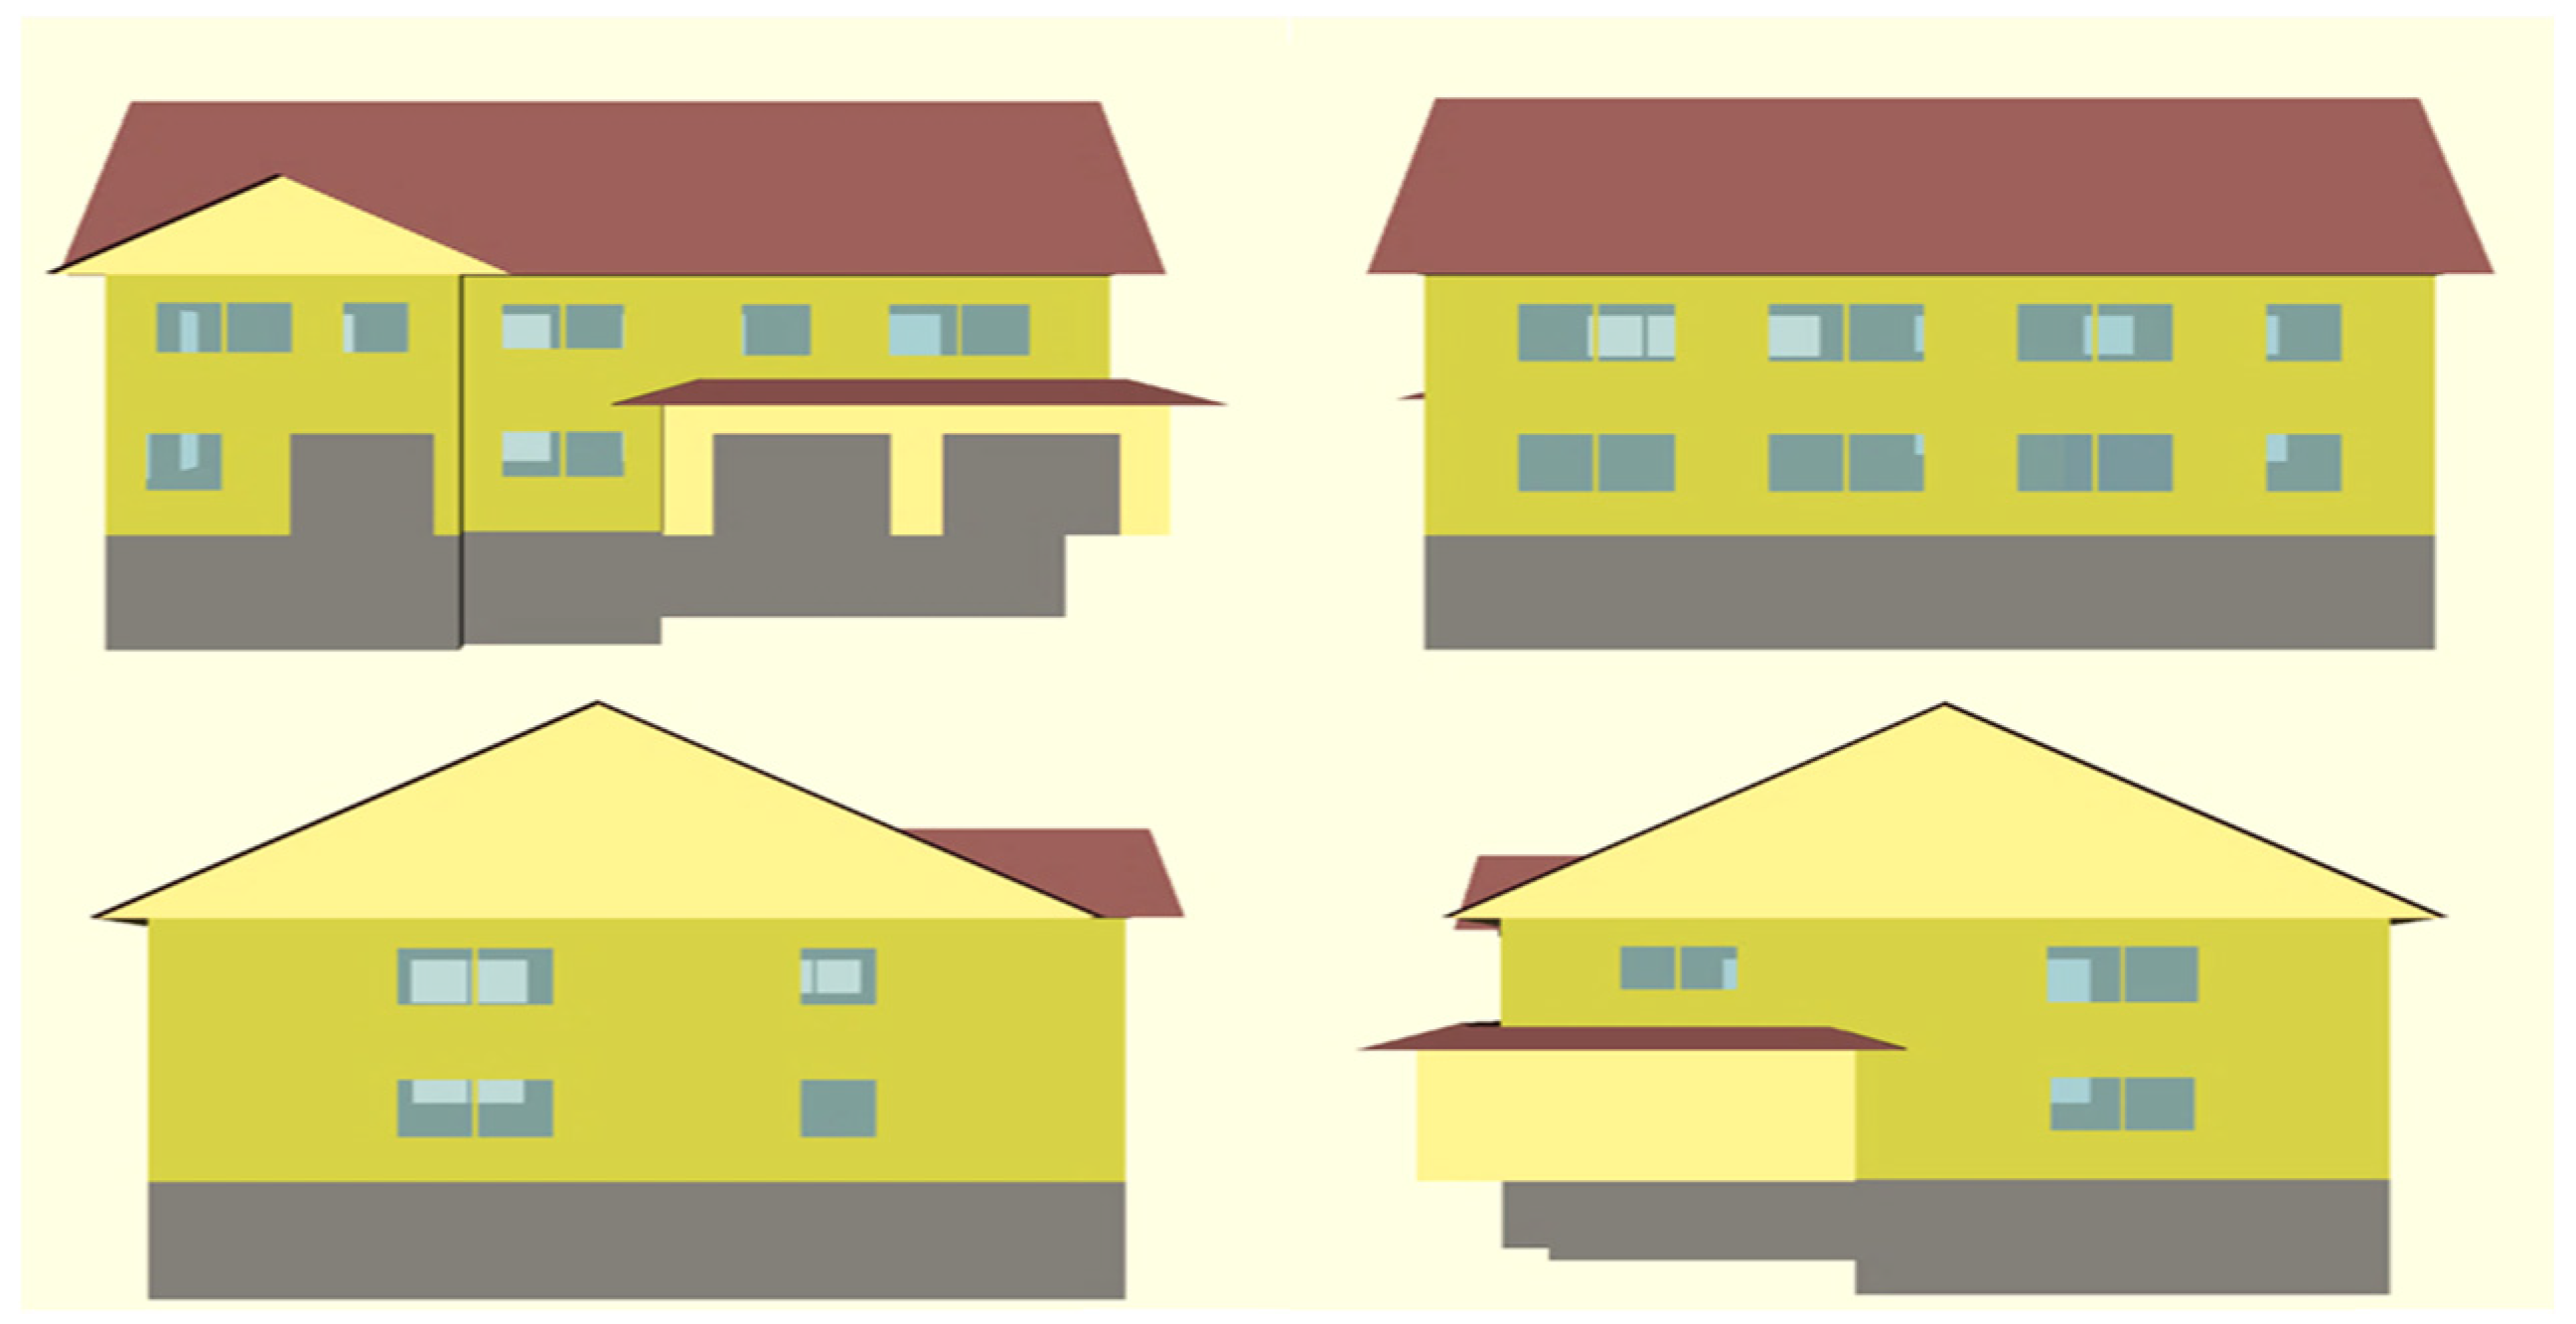
A single-detached, single-family house was modelled. The house represents an archetypal new suburban house in Canada, based on Ottawa’s NRC CCHT twin test houses [23]. The complex geometry includes a slab-on-grade garage, with a simplified gable style roof to allow for rooftop PV if needed (Figure 3). The reference model complies with NBC 9.36. The modelling software considers the number of floors and house size for modeling and the cost of ducts, DHW piping, and ventilation. The occupancy is determined using the Building America House Simulation Protocol [12]. The house includes an unfinished basement within the thermal envelope and air control layer, but it is not directly conditioned or ventilated due to software limitations. Whole-slab insulation for basements is not required by NBC 9.36. The house’s back has more glazing than the front due to a south-facing sliding glass patio door. This unique orientation allows better winter passive solar heating and optimal rooftop PV generation. The author chose this setup to explore the feasibility of increasing the south glazing area for passive solar heat gain. The dimensions of the model house are as follows: Footprint Area—142.1 m2; Finished Floor Area—244.5 m2; Floors—2; Floor Height—2.74 m; Conditioned Volume—670.8 m3; Bedrooms—4; Bathrooms—2.5; Unfinished Attic and Basement. (Please check Appendix A and Appendix B for reference model inputs and sources).
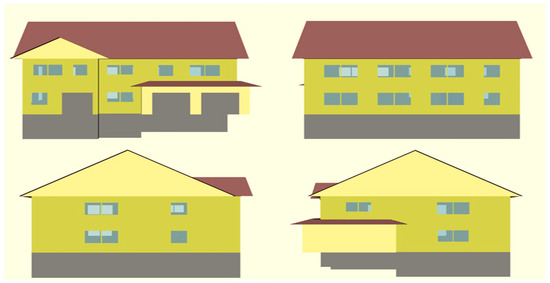
Figure 3.
Model geometry-clockwise from top left: north, south, west, east (green = conditioned volume).
3.2. Thermal System Models
Each thermal-system-specific energy model is labelled by the space heating method (Figure 2). Each model contains a suite of space heating (main and supplementary) and cooling production and delivery, DHW production and delivery, and, in the case of the NZC model, solar PV generation. Each model is intended to provide a comparable level of service, including space cooling and backup electric resistance heating for all air-source heat pumps for reliability during very low temperatures. Four all-electric models, one gas-heated model, and one NZC model were developed at each location.
In most cases, the DHW production system is the same as the one used for space heating. For instance, the gas model uses gas-heated DHW and the heat pump models are equipped with an HPWH, while the electric model has a resistive heating electric hot water tank. HPWH results in space cooling during the cooling season, which is beneficial, but it can be detrimental during the heating season.
3.2.1. Modelled Thermal Systems Summary
As previously stated, the gas optimization uses the same system type as the reference model, but with more efficient options. All the models undergo a whole-building optimization except for the reference model. Table 1 provides a summary of the five thermal systems described in this section, as well as the reference system. A water heater’s efficiency is determined by its energy factor which is based on the amount of hot water produced per unit of fuel consumed. A higher energy factor means a more efficient water heater.

Table 1.
Thermal system model inputs summary. “NA” means “Not Applicable”.
3.2.2. Thermal Envelope Performance (SHDI)
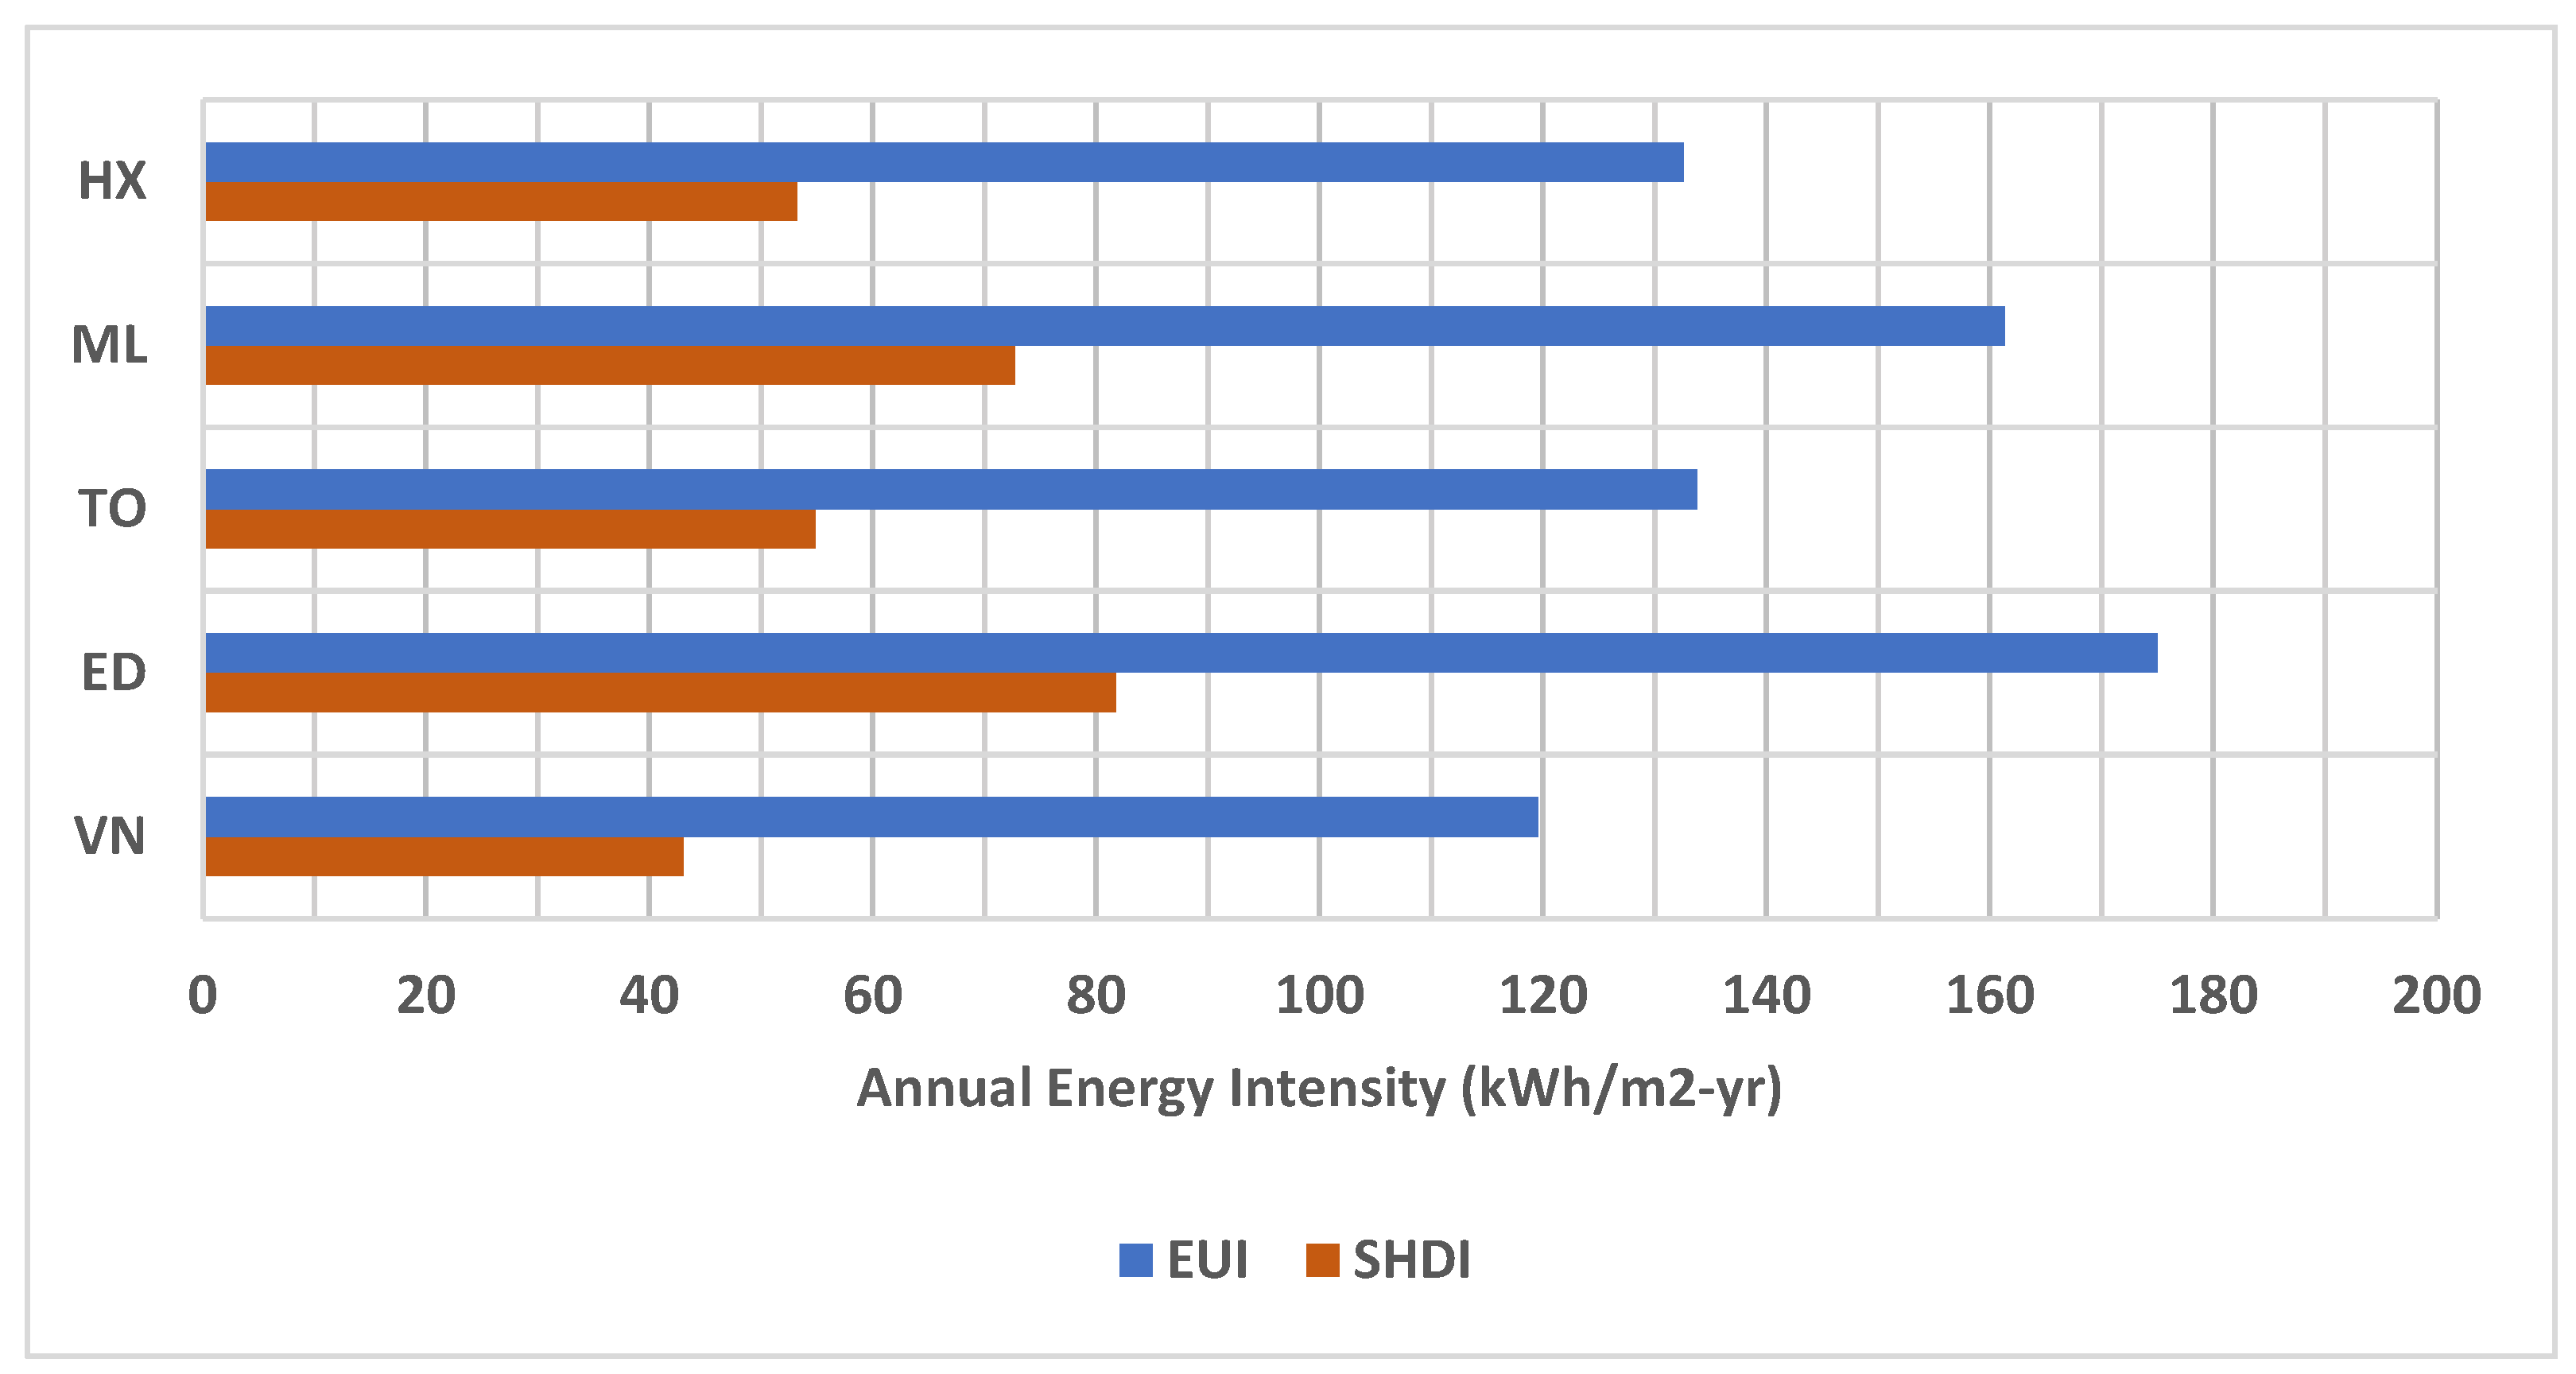
Thermal envelope performance refers to a building’s overall thermal performance. SHDI value expresses it, taking into account thermal resistance, air leakage, solar gain, and internal heat gains. It varies by location due to climate and differences in the NBC 9.36 reference enclosure design. SHDI value is not much affected by different thermal system types, except for minor variations in internal heat gain and interactions with HPWH. Figure 4 shows SHDI and EUI values for the reference model for all locations.
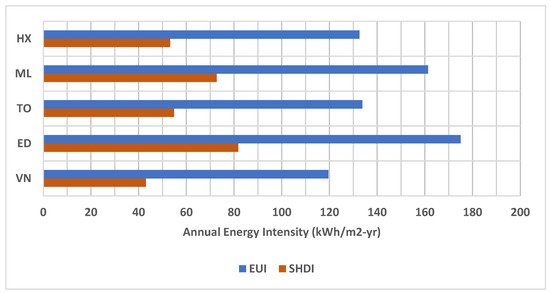
Figure 4.
Reference model SHDI and EUI values.
3.2.3. Purchased Energy Consumption (EUI)
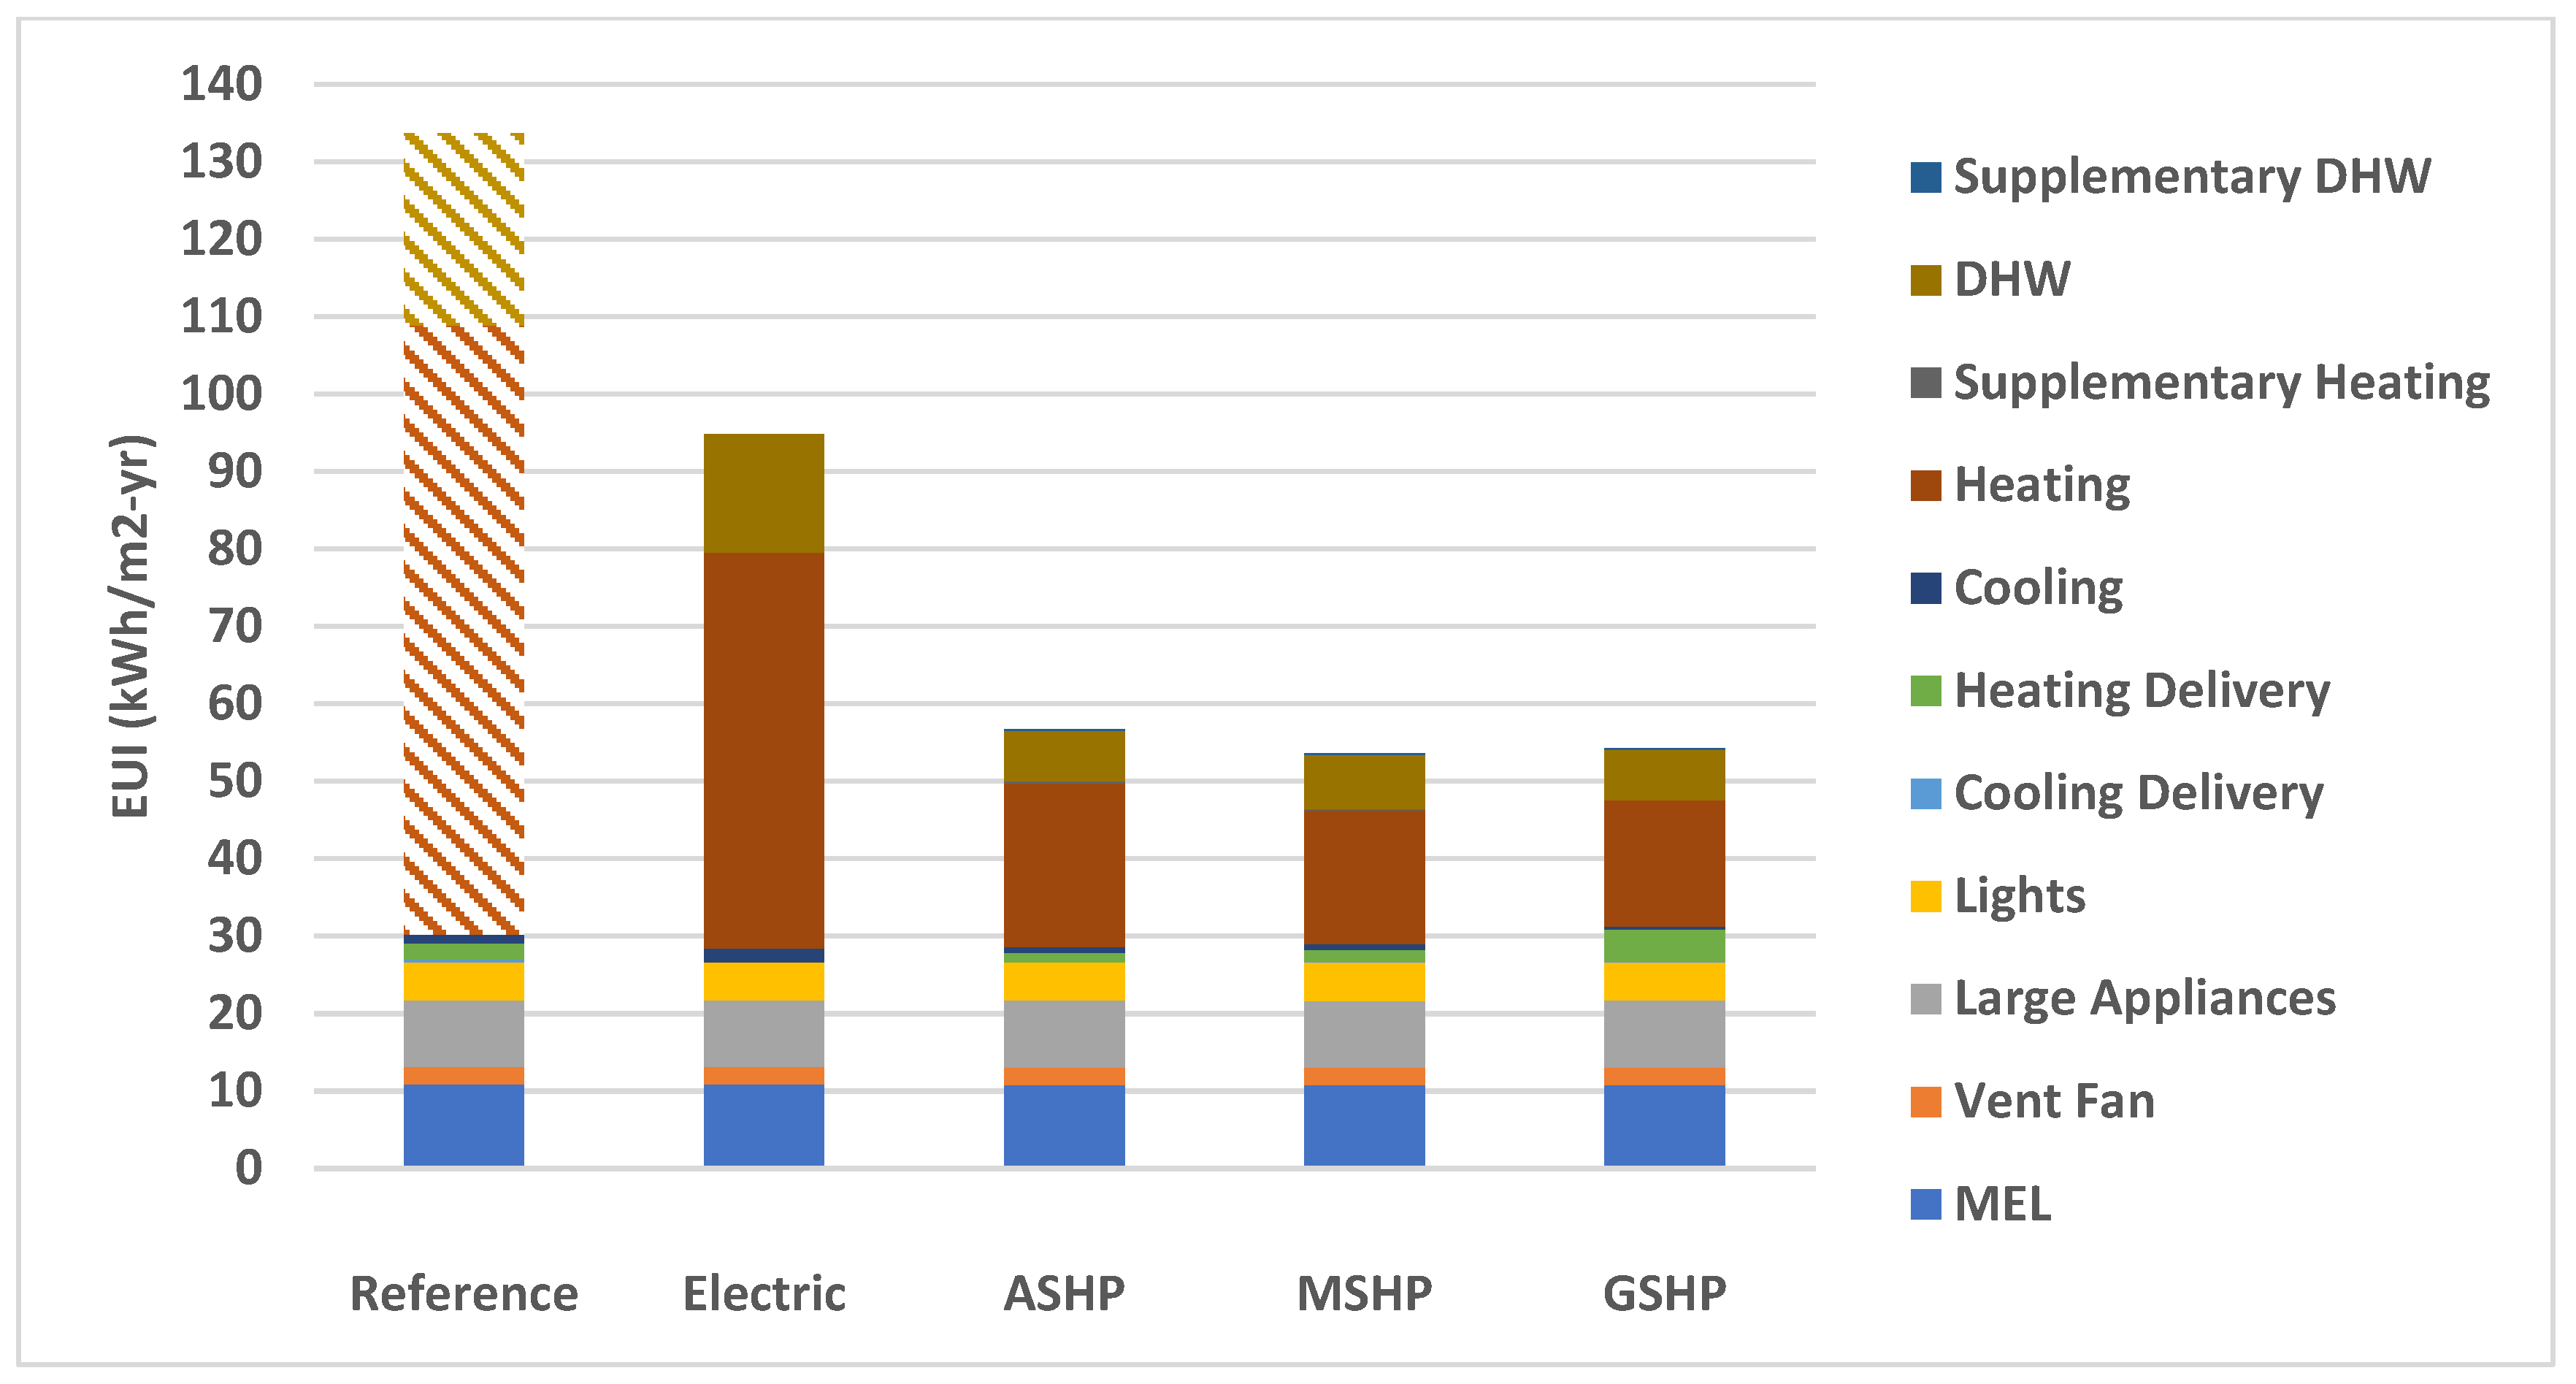
Figure 5 provides some insight into the energy end-use breakdown for the reference model in Toronto, and how each of the all-electric thermal systems perform in the same building enclosure and location. The natural gas furnace and water heater in the reference model are low–medium efficiency. Furthermore, the fact that there are two types of purchased energy included in the chart makes it impossible to conclude anything about the operational cost or GHG emissions of the reference building relative to the other buildings.

Figure 5.
Reference model EUI Breakdown by end-use for thermal-system-specific Toronto baseline models (hatching = natural gas, solid = electricity).
4. LCC Optimization
4.1. Location, Climate, and Emissions Factors
This study includes Canadian cities that are heating-dominated. Vancouver is the warmest city among the selected cities, while Edmonton is the coldest. Latitude determines solar PV potential, with Edmonton being the northernmost, and Toronto the southernmost. Seasonal electricity generation fluctuation is not critical to a customer with a grid-tied net metering contract. However, it helps to determine the aggregate value/burden of distributed solar generation to the electric grid. Table 2 summarizes location data. The average and marginal emission factors (EFs) for electricity for the chosen cities are also shown in Table 2. The EF of onsite natural gas combustion is constant for all locations at 179.1 g CO2e/kWh [24].
Table 2.
Climate, location data, electric grid annual average, and marginal EFs.
4.2. City Cost Index (CCI)
The material and labour costs for all BEopt components are from National Residential Efficiency Measures Database (NREMDB) and represent the U.S. national average in USD. Costs for rapidly developing technologies, such as LED lighting and solar PVs, are updated frequently. To adjust these costs for each city, the RSMeans “City Cost Index” (CCI) has been applied. For Canadian cities, the CCI simultaneously adjusts for local construction costs and currency conversion from USD to CAD [25,26]. By using the 2017 base CCI values for Canadian cities and fuel price inputs in CAD, all cost outputs from BEopt are in CAD (the 2017 average currency conversion was 0.77 CAD/USD). There is a separate CCI for materials and labour. The BEopt cost multiplier input corresponds to the CCI/100. See Table 3 for the CCI values used in the BEopt models.
Table 3.
RSMeans (2017) CCI [25,26].
4.3. Purchased Energy Prices
The purchased energy investigated in this study are electricity and natural gas. The term “purchased energy” is necessary because electricity is not considered a fuel, and it is precisely that energy with a cost that a homeowner seeks to minimize for reducing the building’s operational cost. Such a statement may appear obvious; however, it is useful to emphasize, since building enclosure designers and energy modelers sometimes prioritize a reduction in the thermal energy demand. This approach neglects the thermal conversion efficiency of the mechanical system and the unit price of the input purchased energy, which can vary greatly by location. SHDI may provide little useful information about the operational space heating cost of a building if the heating system efficiency and type are not known. A potential reason for such an economically suboptimal design approach is an ongoing disconnect between the civil/architectural disciplines and the mechanical discipline. Table 4 summarizes the purchased energy input prices and the sources from which they were retrieved or derived.
Table 4.
Electricity and natural gas prices used in the modelling [27,28].
4.4. Financial Model
4.4.1. Capital Costs
The initial cost of a building covers energy-related components and equipment, excluding items such as concrete foundation, interior finishing, and miscellaneous electrical appliances. The NREMDB [29] includes additional parameter options, with material and labor costs determined using linear extrapolation. For the cost of the air barrier, a default equation in BEopt is used. Equation (5) defines this function and is based on empirical data from the national average.
where
FFA = building’s finished floor area in (ft2)
ACH50 = building’s airtightness in air changes per hour at 50 Pascal depressurization
Space conditioning systems have a fixed cost and a capacity cost that correlates to the design peak heating load of the building. Table 5 lists these costs for each thermal system (and excludes DHW cost).
Table 5.
Space conditioning system input capital costs.
4.4.2. Mortgage
In total, 79% of Canadians choose high-ratio mortgages with a maximum 25-year loan repayment period, but some prefer conventional mortgages for the longer 30-year repayment period and no need for CMHC mortgage default insurance [30]. With a conventional mortgage, you need a 20% down payment and monthly payments are fixed over the 30-year repayment period.
where
P = Principal amount on loan after down payment
n = Number of mortgage payments (i.e., 12 × 30 = 360)
m = Monthly interest rate (i.e., 0.039/12 = 0.00325)
4.4.3. Economic Parameters
This information comes from the U.S. Department of Energy’s EERE Building Technologies Program report titled “Methodology for Evaluating Cost-Effectiveness of Residential Energy Code Changes” [31]. The report justifies this method by explaining that it is a reliable way to calculate the real discount rate.
The real discount rate is thus calculated as follows:
where
Rreal = real discount rate
Rnominal = nominal discount rate
i = inflation rate
A summary of the mortgage and financial project inputs for BEopt model is presented in Table 6. Real fuel escalation rates have been kept at zero—that is, electricity and natural gas prices rise with inflation.
Table 6.
Mortgage and financial project inputs.
4.4.4. Cash Flows and LCC
Cash flows for the financial project include mortgage down payment in year zero, annual mortgage payments, annual utility charges (purchased energy use), annual PV generation payments (if applicable), equipment replacement costs, and the building residual value credit at year thirty. The residual value of all building components is calculated based on linear asset value depreciation over time. This is determined based on the material input data for each component, which includes both cost and lifetime.
All cash flows except mortgage payments (principal and interest) are inflated according to the year they occur. Annual energy use is based on the annual simulation and does not change over the project’s life. Inflated future costs are calculated using Equation (7).
where
i = inflation rate
Costinitial = Cost of component/payment in year k = 0
k = the year the costs occur
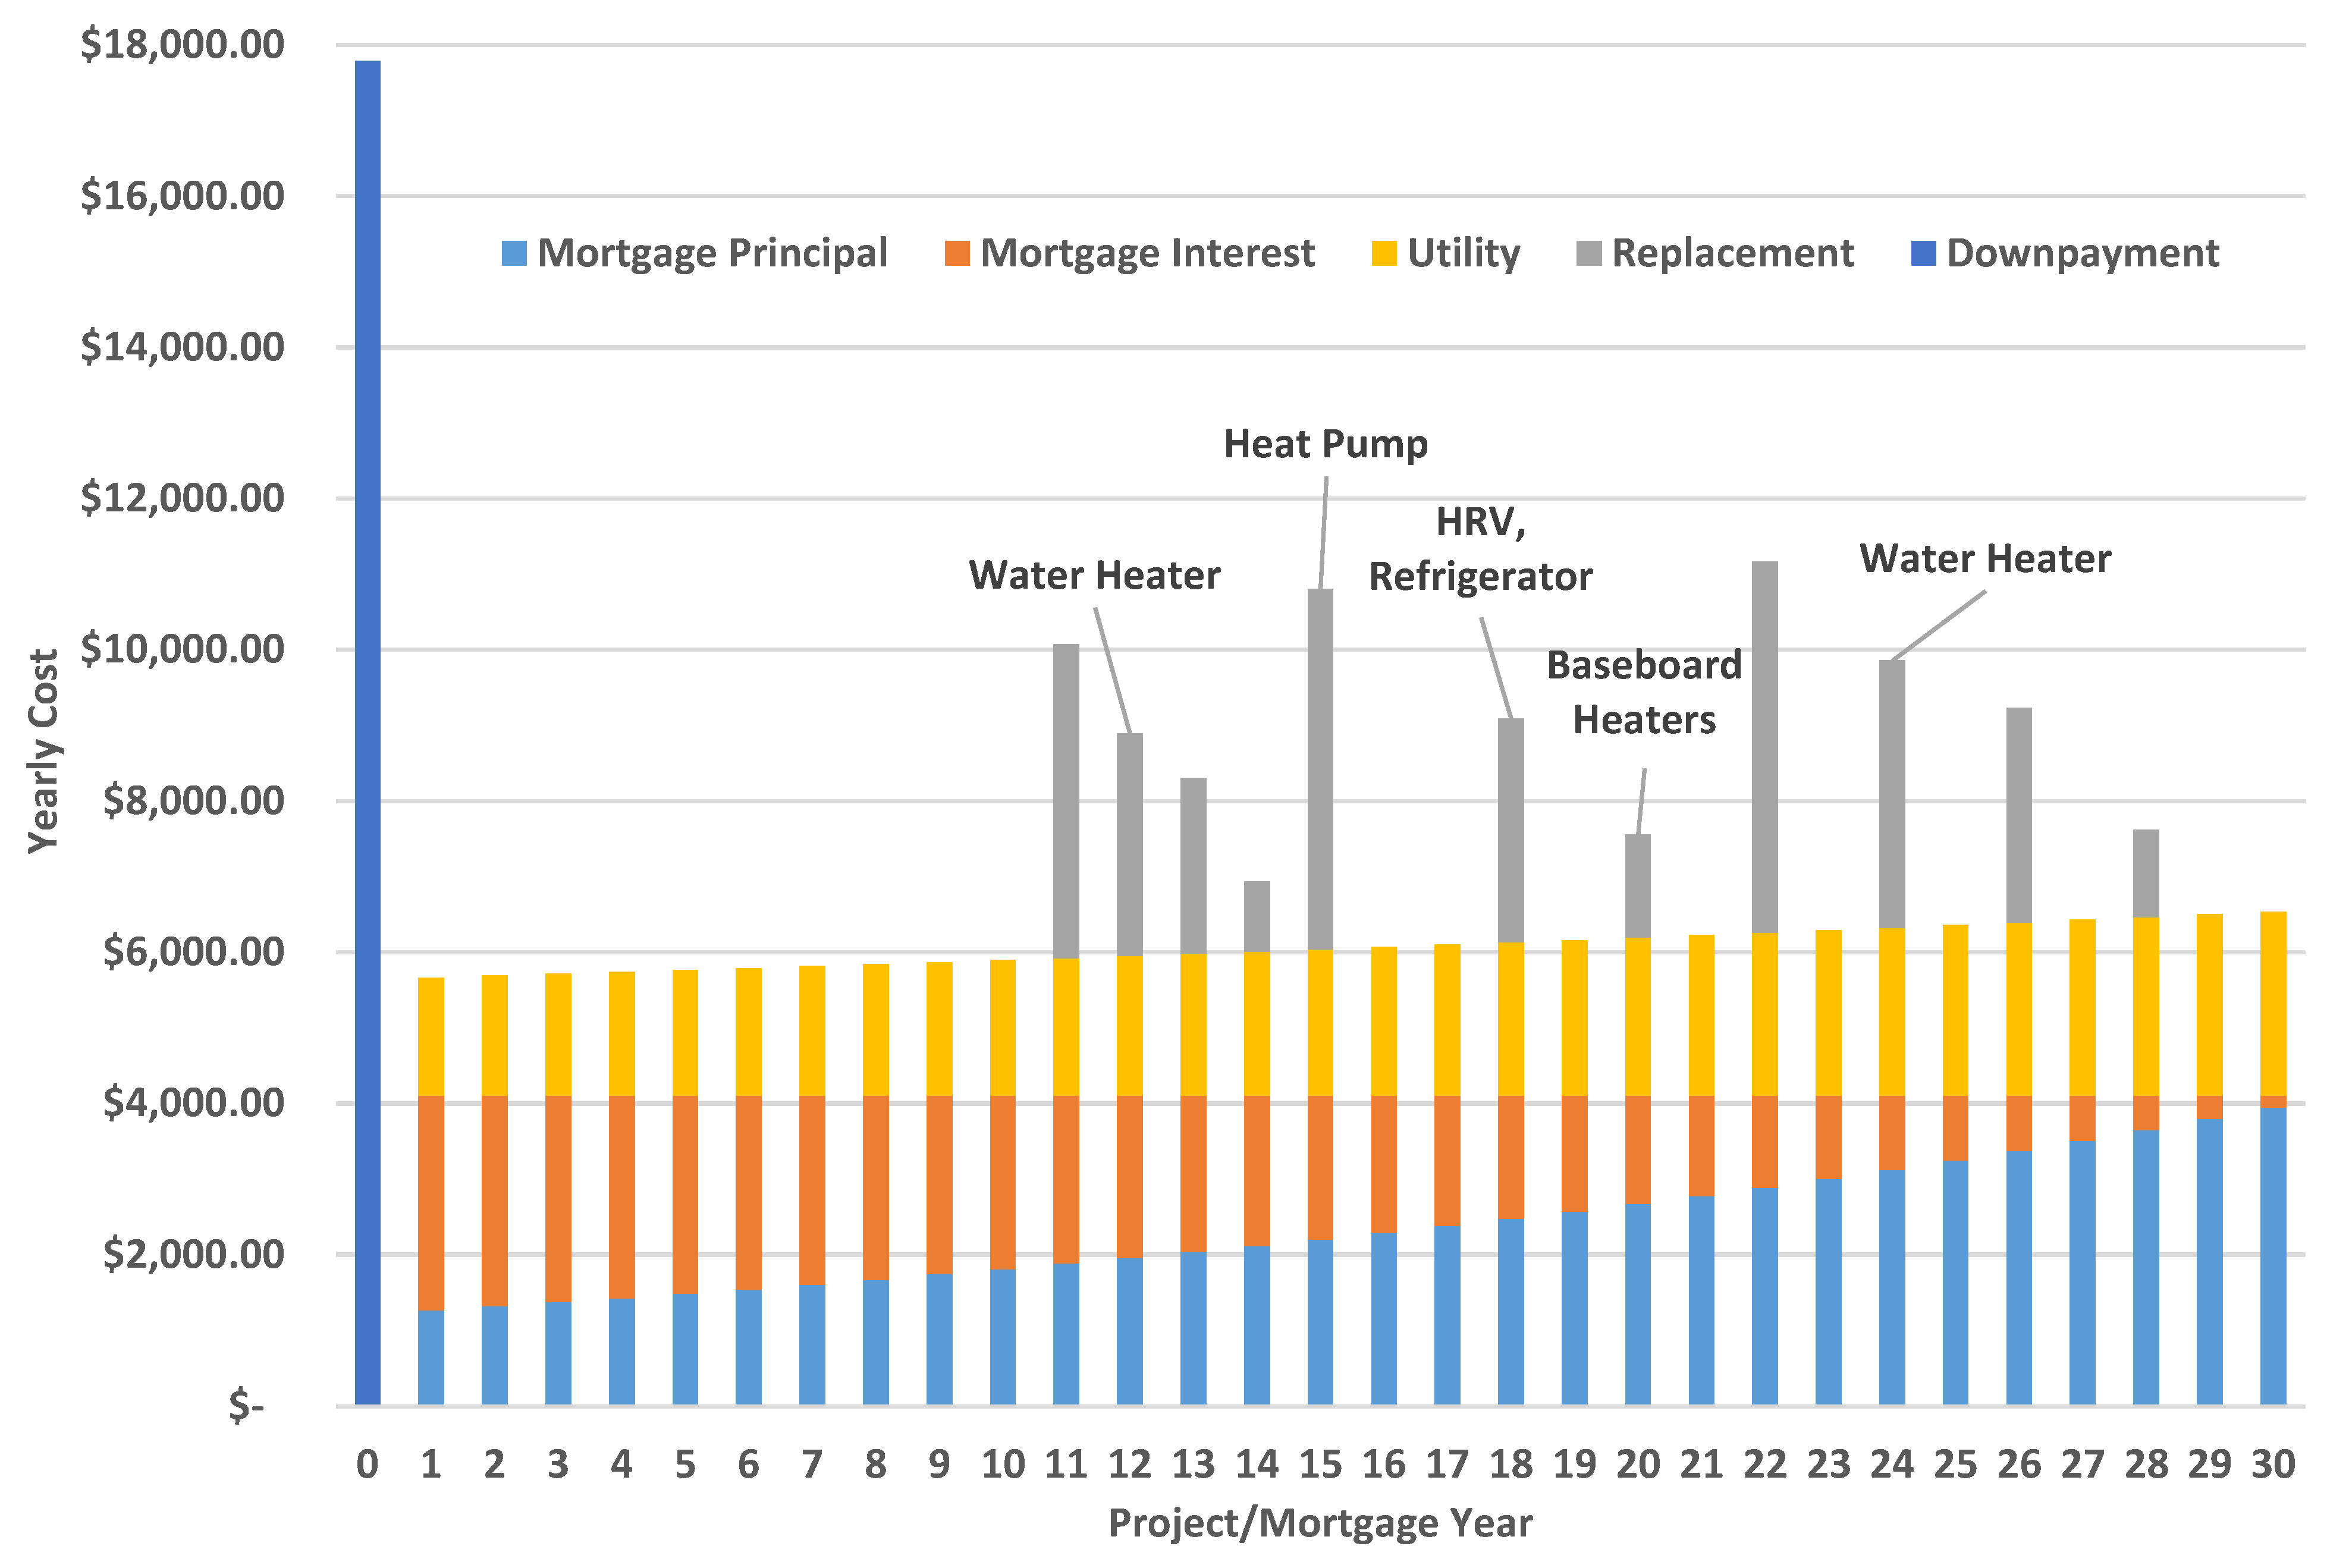
To understand LCC for a given model, it helps to visualize an annual cash flow diagram. Output from BEopt for the optimal TO-MSHP model results in the cash flow shown in Figure 6. Only replacement events for HVAC and DHW equipment are labelled. Other events include ceiling fans and major appliances and do not change for all models in this study.
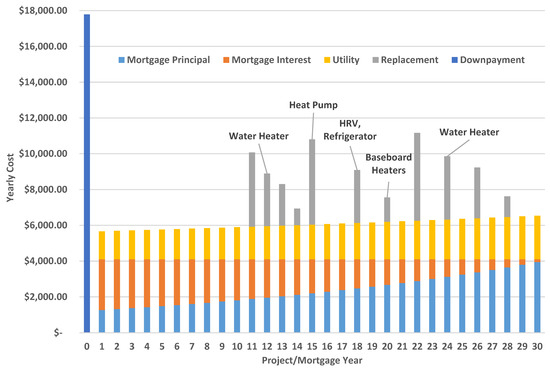
Figure 6.
Toronto MSHP design cash flows (chart excludes residual value: $79,938 in year 30, i.e., a negative cost).
All cash flows for a given year are then summed to obtain a net total cost (TC) for each project year. These future costs are then converted into present costs using the nominal discount rate and summed to obtain the LCC Equation (8).
= total costs in year = k
= the nominal discount rate
4.5. Design Input Options
This section refers to design input categories for which there is more than one parameter option selected for the optimization run. Note that some of the fixed parameters have been reset from the reference model (Table 7). This has been done for the categories of “interzonal wall” and “interzonal floor”. These are the envelope components separating the building living space from the garage, and they constitute a small portion of the total enclosure area. To reduce computational intensiveness, these components were not separately optimized. However, to ensure that they did not “pull down” the resultant optimal R-value of the rest of the enclosure, the interzonal floor and walls were reset to an effective R-value of 36.6 and 38.6, respectively.
Table 7.
Optimization design input options—gas model only.
The gas thermal system model was the only one for which multiple heating, cooling, and DHW system efficiency options were explored. The water heater options that use a storage tank have a 40-gallon tank. However, multiple DHW and space conditioning delivery system efficiencies were explored for all applicable models.
To create an option for a Drain Water Heat Recovery (DWHR) in BEopt, a custom option for the “hot water fixtures” category was created that has a shower DHW use reduced by 53% (the efficiency of the unit), resulting in a total DHW use reduction of 25%. The standard 3” diameter, 60” long unit selected has a cost of $622 + $80 (material and labour in USD), and a lifetime of 40 years.
Since the reference model varies for some parameters by location (wall, ceiling, and foundation R-values, and window U-value), the lower limit of the option range varies for these categories, though intermediate options and the upper limit do not. Only design options were explored that do not comply with NBC 9.36 for the location in question (i.e., all options explored meet or exceed the reference model parameter for that category by location). The only exception to this rule is the possibility to downgrade from a U-0.27 window to a U-0.29 window for Edmonton, Montreal, and Halifax. Table 8 shows a complete list of design input options used for all models.
Table 8.
Optimization design input options for all models.
5. Optimization Results and Discussion
5.1. Gas Model Optimization
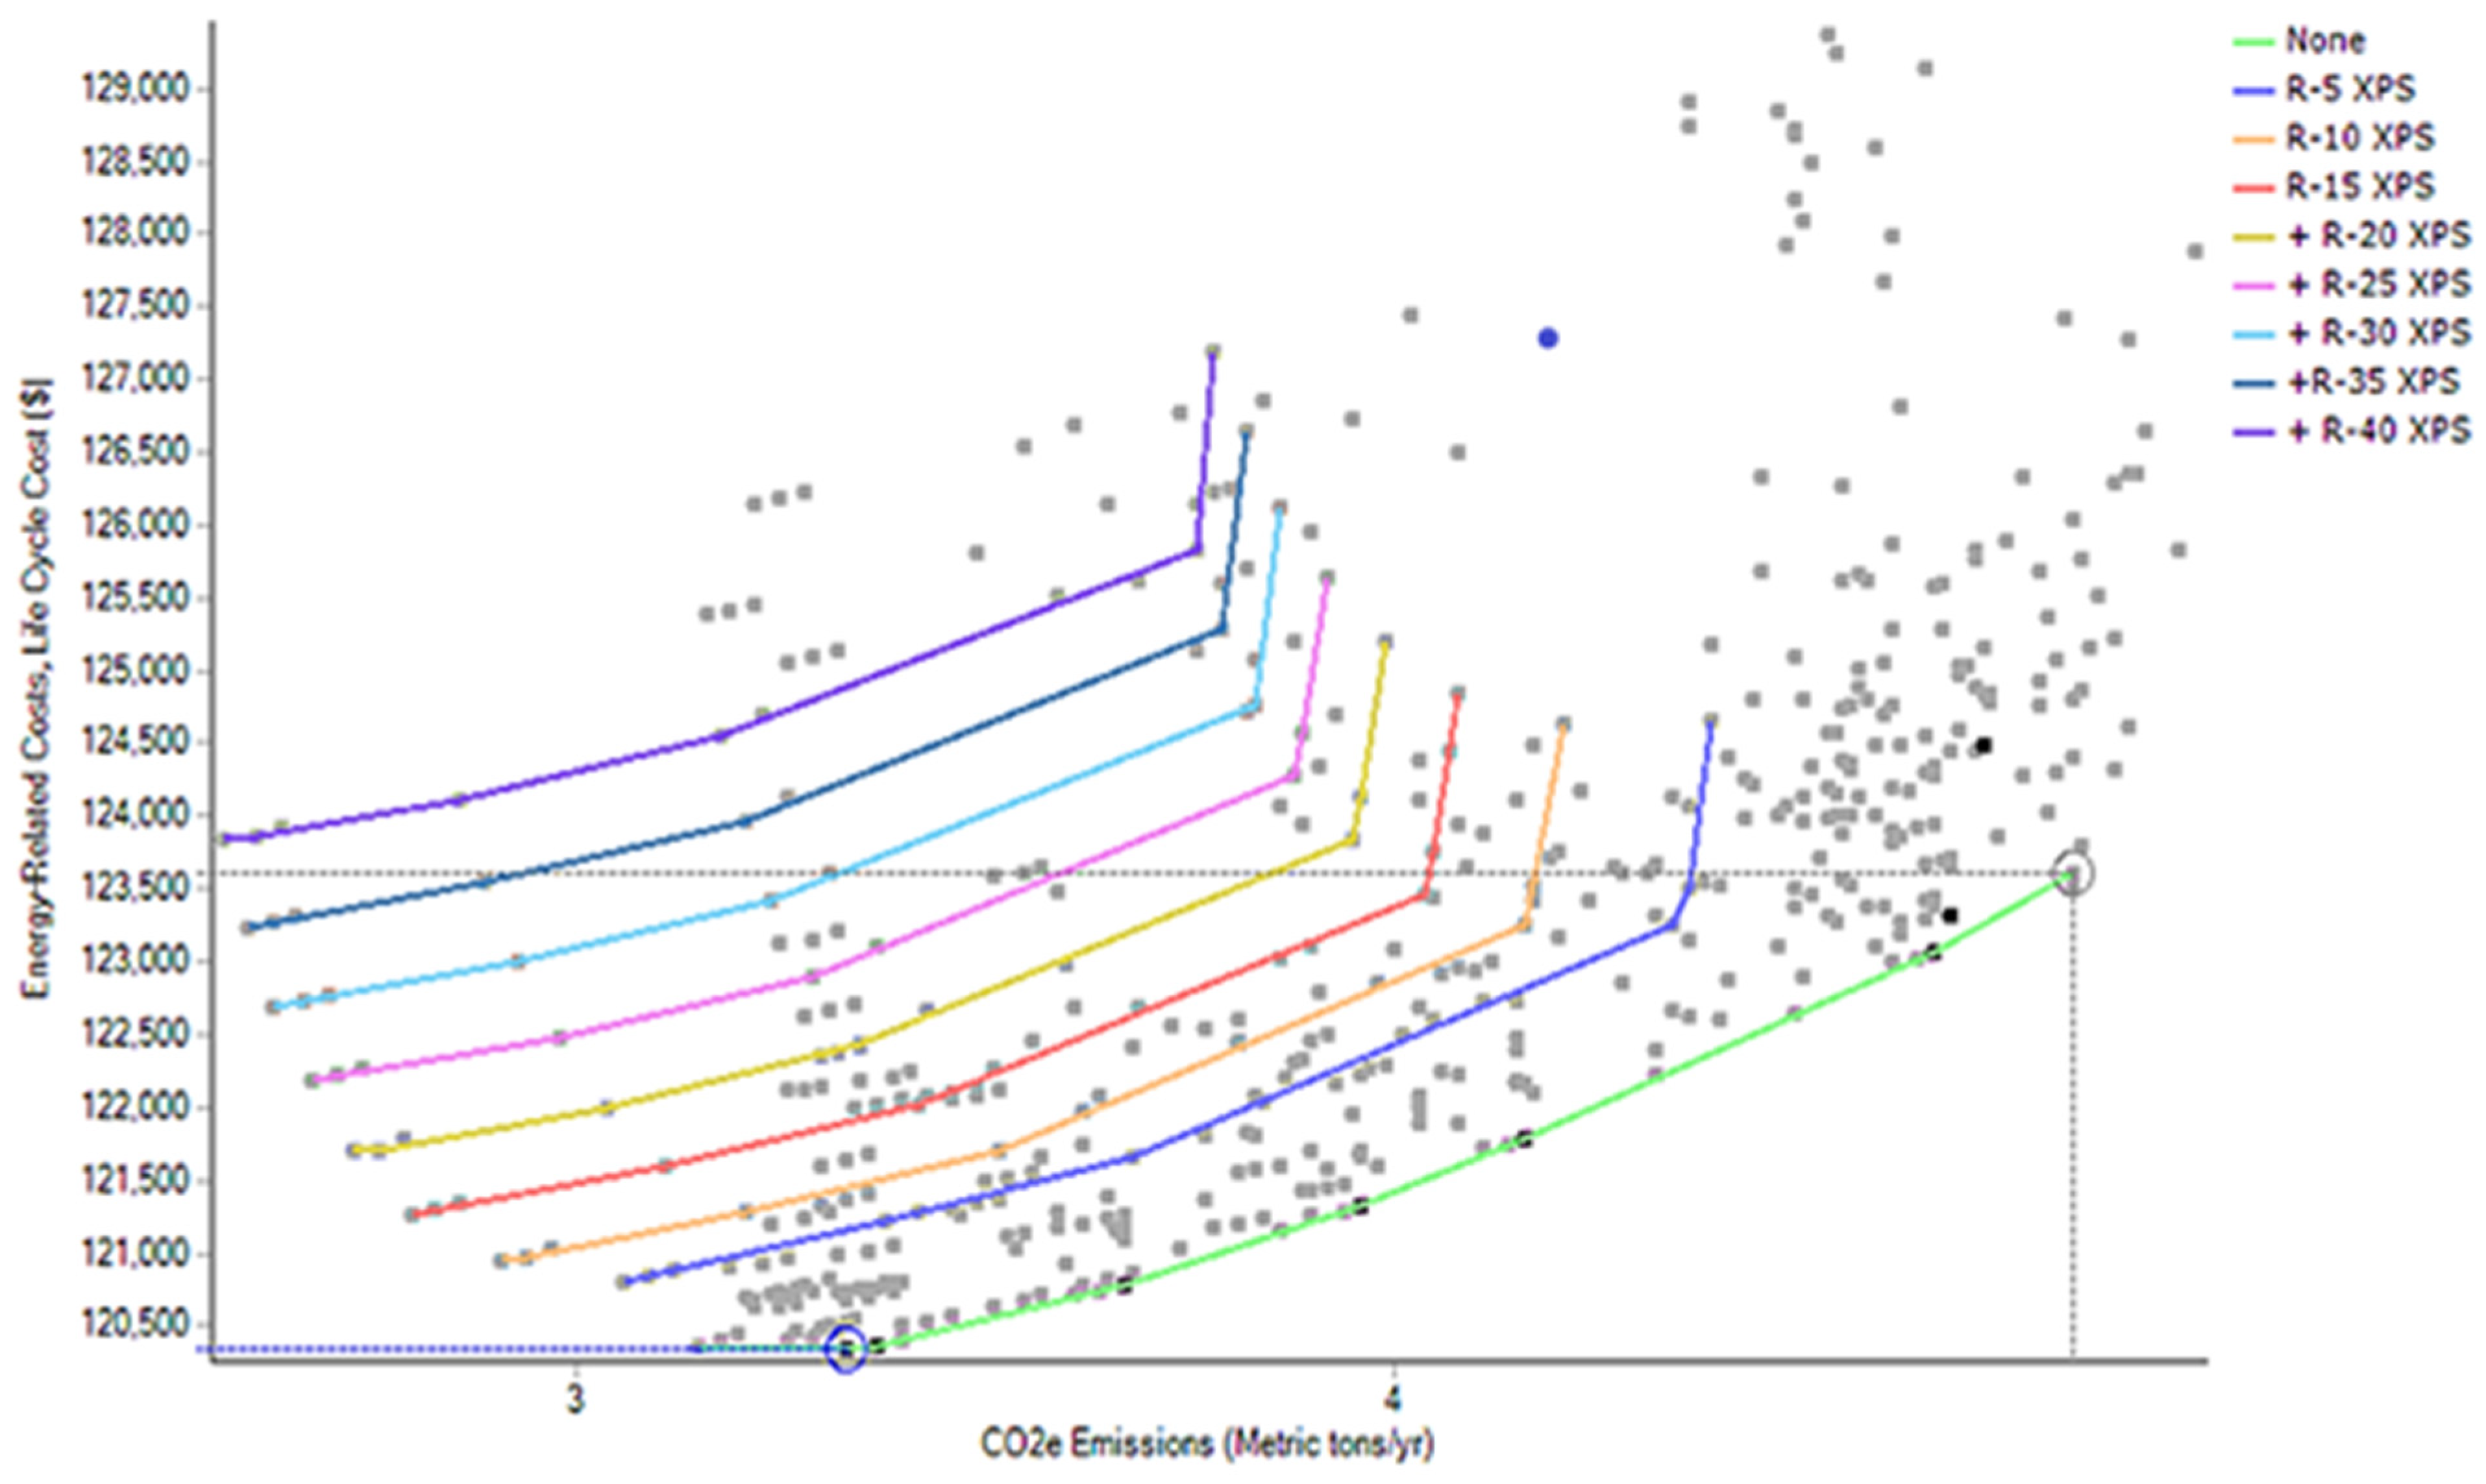
This section showcases the optimization results for the gas model, which represents a whole-building optimization using the same thermal system type as the reference model. It can be used as a benchmark design to compare the economic feasibility of all-electric and NZC design alternatives. The optimal LCC gas design reduces GHG emissions and energy-related building LCCs compared to the reference model. Figure 7 illustrates the Toronto (Gas-TO) optimization results, and Table 9 summarizes the lowest LCC gas design options for each location. Increasing insulation can improve energy/emissions performance, but the capital costs do not outweigh the energy cost savings. Mechanical system upgrades were generally more economically desirable than thermal envelope upgrades.
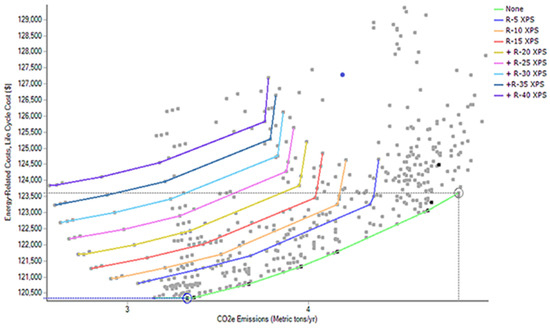
Figure 7.
Gas-TO optimization plot with exterior wall insulation sensitivity frontiers.
Table 9.
Resultant lowest LCC gas designs by location. In this Table, VN stands for Vancouver, ED for Edmonton, TO for Toronto, ML for Montreal, and HX for Halifax.
5.2. LCCs versus GHG Optimization Results
5.2.1. Results Summary
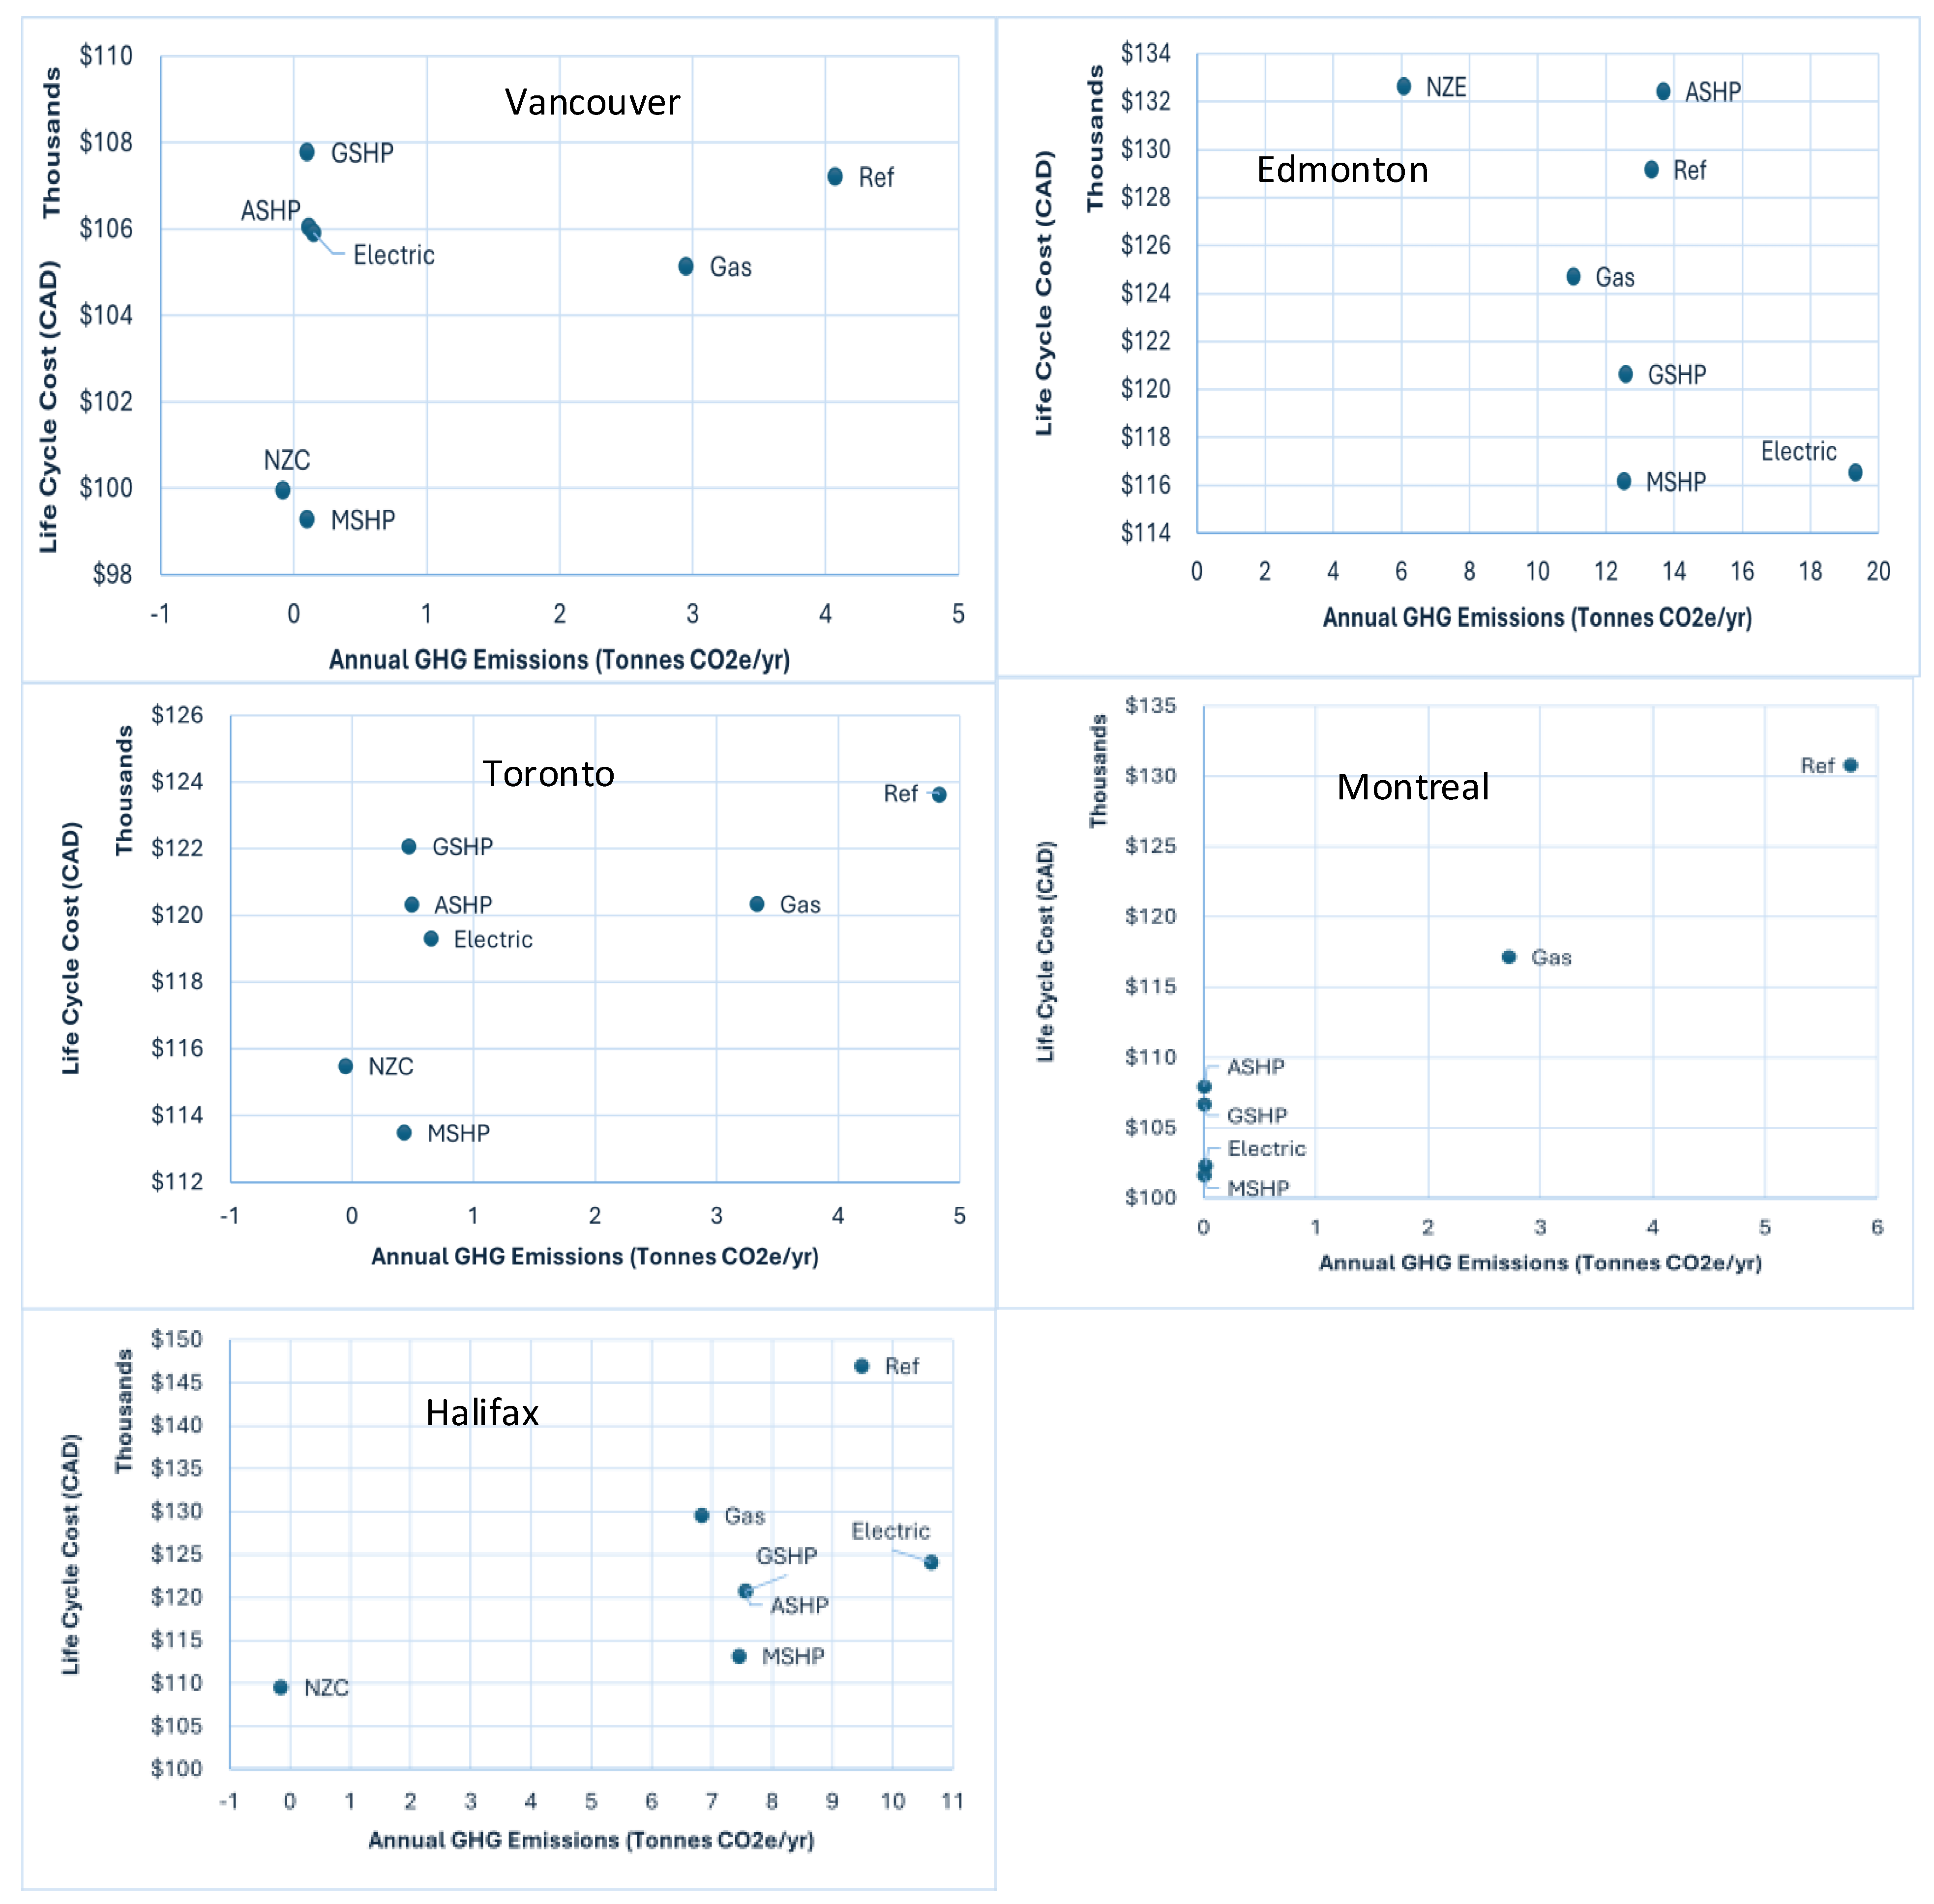
The following plots (Figure 8) show the reference design plus the lowest-LCC design from each optimization for the chosen cities. For comparison, all y-axis minor gridlines are shown in $1000 CAD increments.
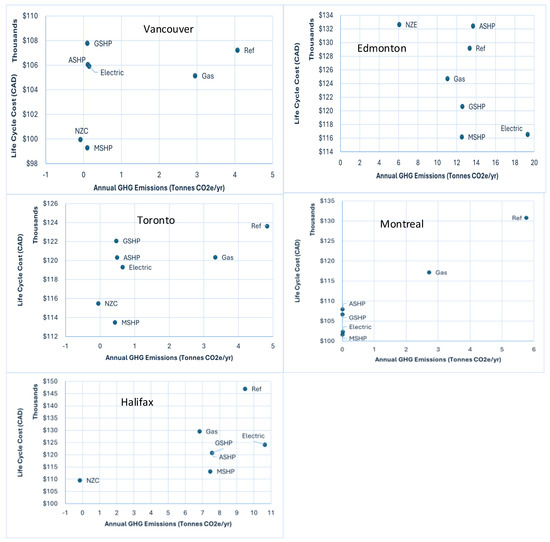
Figure 8.
The optimal design arranged from left to right and top to bottom, starting with Vancouver, followed by Edmonton, Toronto, Montreal, and finally, Halifax.
Some electric models have a lower LCC than the gas model. MSHP has the lowest overall cost of design in every location except Halifax. The high EF of the Alberta (Edmonton) and Nova Scotia (Halifax) electric grids results in gas being the lowest-emitting design without PVs. In locations with high-EF electricity, PVs substantially impact emission reductions more than thermal envelope and system efficiency improvements combined. PVs are the most affordable in Halifax. The electrification of heating is the most advantageous economical measure in reducing emissions in locations with low-EF electricity.
5.2.2. NZC Models
This subsection explains in more detail how the NZC/NZE optimizations were conducted that yielded the results shown in Figure 9. This method has been used to determine the amount of renewable generation required as a proportion of total energy consumption to achieve NZC status. The NZC model applies PV to the resultant lowest-cost all-electric optimization model, which for every location was the MSHP model. However, rather than add PV to the resultant design, the model is re-optimized with all of the original options with PV included. Figure 9 is an example of using the Edmonton case for a lowest-LCC NZE design. Being the only location where the average EF exceeds the marginal EF (Table 2), it would require a net-positive energy building to achieve NZC status. However, since net-metering programs do not reward annual generation in excess of annual usage, this design was optimized for site-specific NZE rather than NZC. A preliminary optimization iteration was conducted to determine the appropriate cost-optimal range of the PV system size. The resultant design uses 12.6 MWh of electricity, requiring 10 kW of PV for this site.
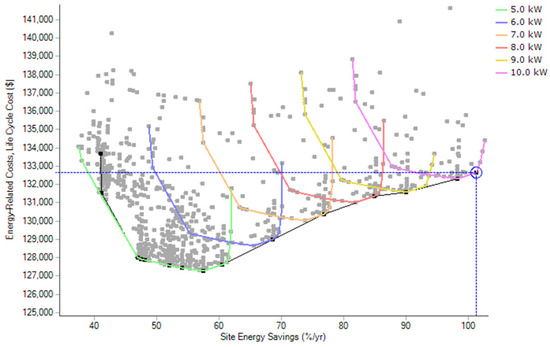
Figure 9.
Edmonton NZE optimization results with PV systems.
While it is an interesting exercise to conduct a whole-building optimization that includes only the required quantity of PV to achieve NZC, the question of rooftop PV economic feasibility can be answered in isolation. If it is profitable, the rational decision would be to install the maximum amount allowed, which would be the lesser of what can fit on the roof and what will attain NZE levels of generation. In such a case, conducting a whole-building LCC vs. site energy optimization would still be beneficial in determining the optimal overall design. Depending on the profitability of PV, this can yield a less efficient building design that enables more PV. Though this could benefit the homebuyer, it would result in the electrically heated building having a higher peak winter electricity demand (when PV is not generating), negatively impacting the utility (and ultimately all ratepayers).
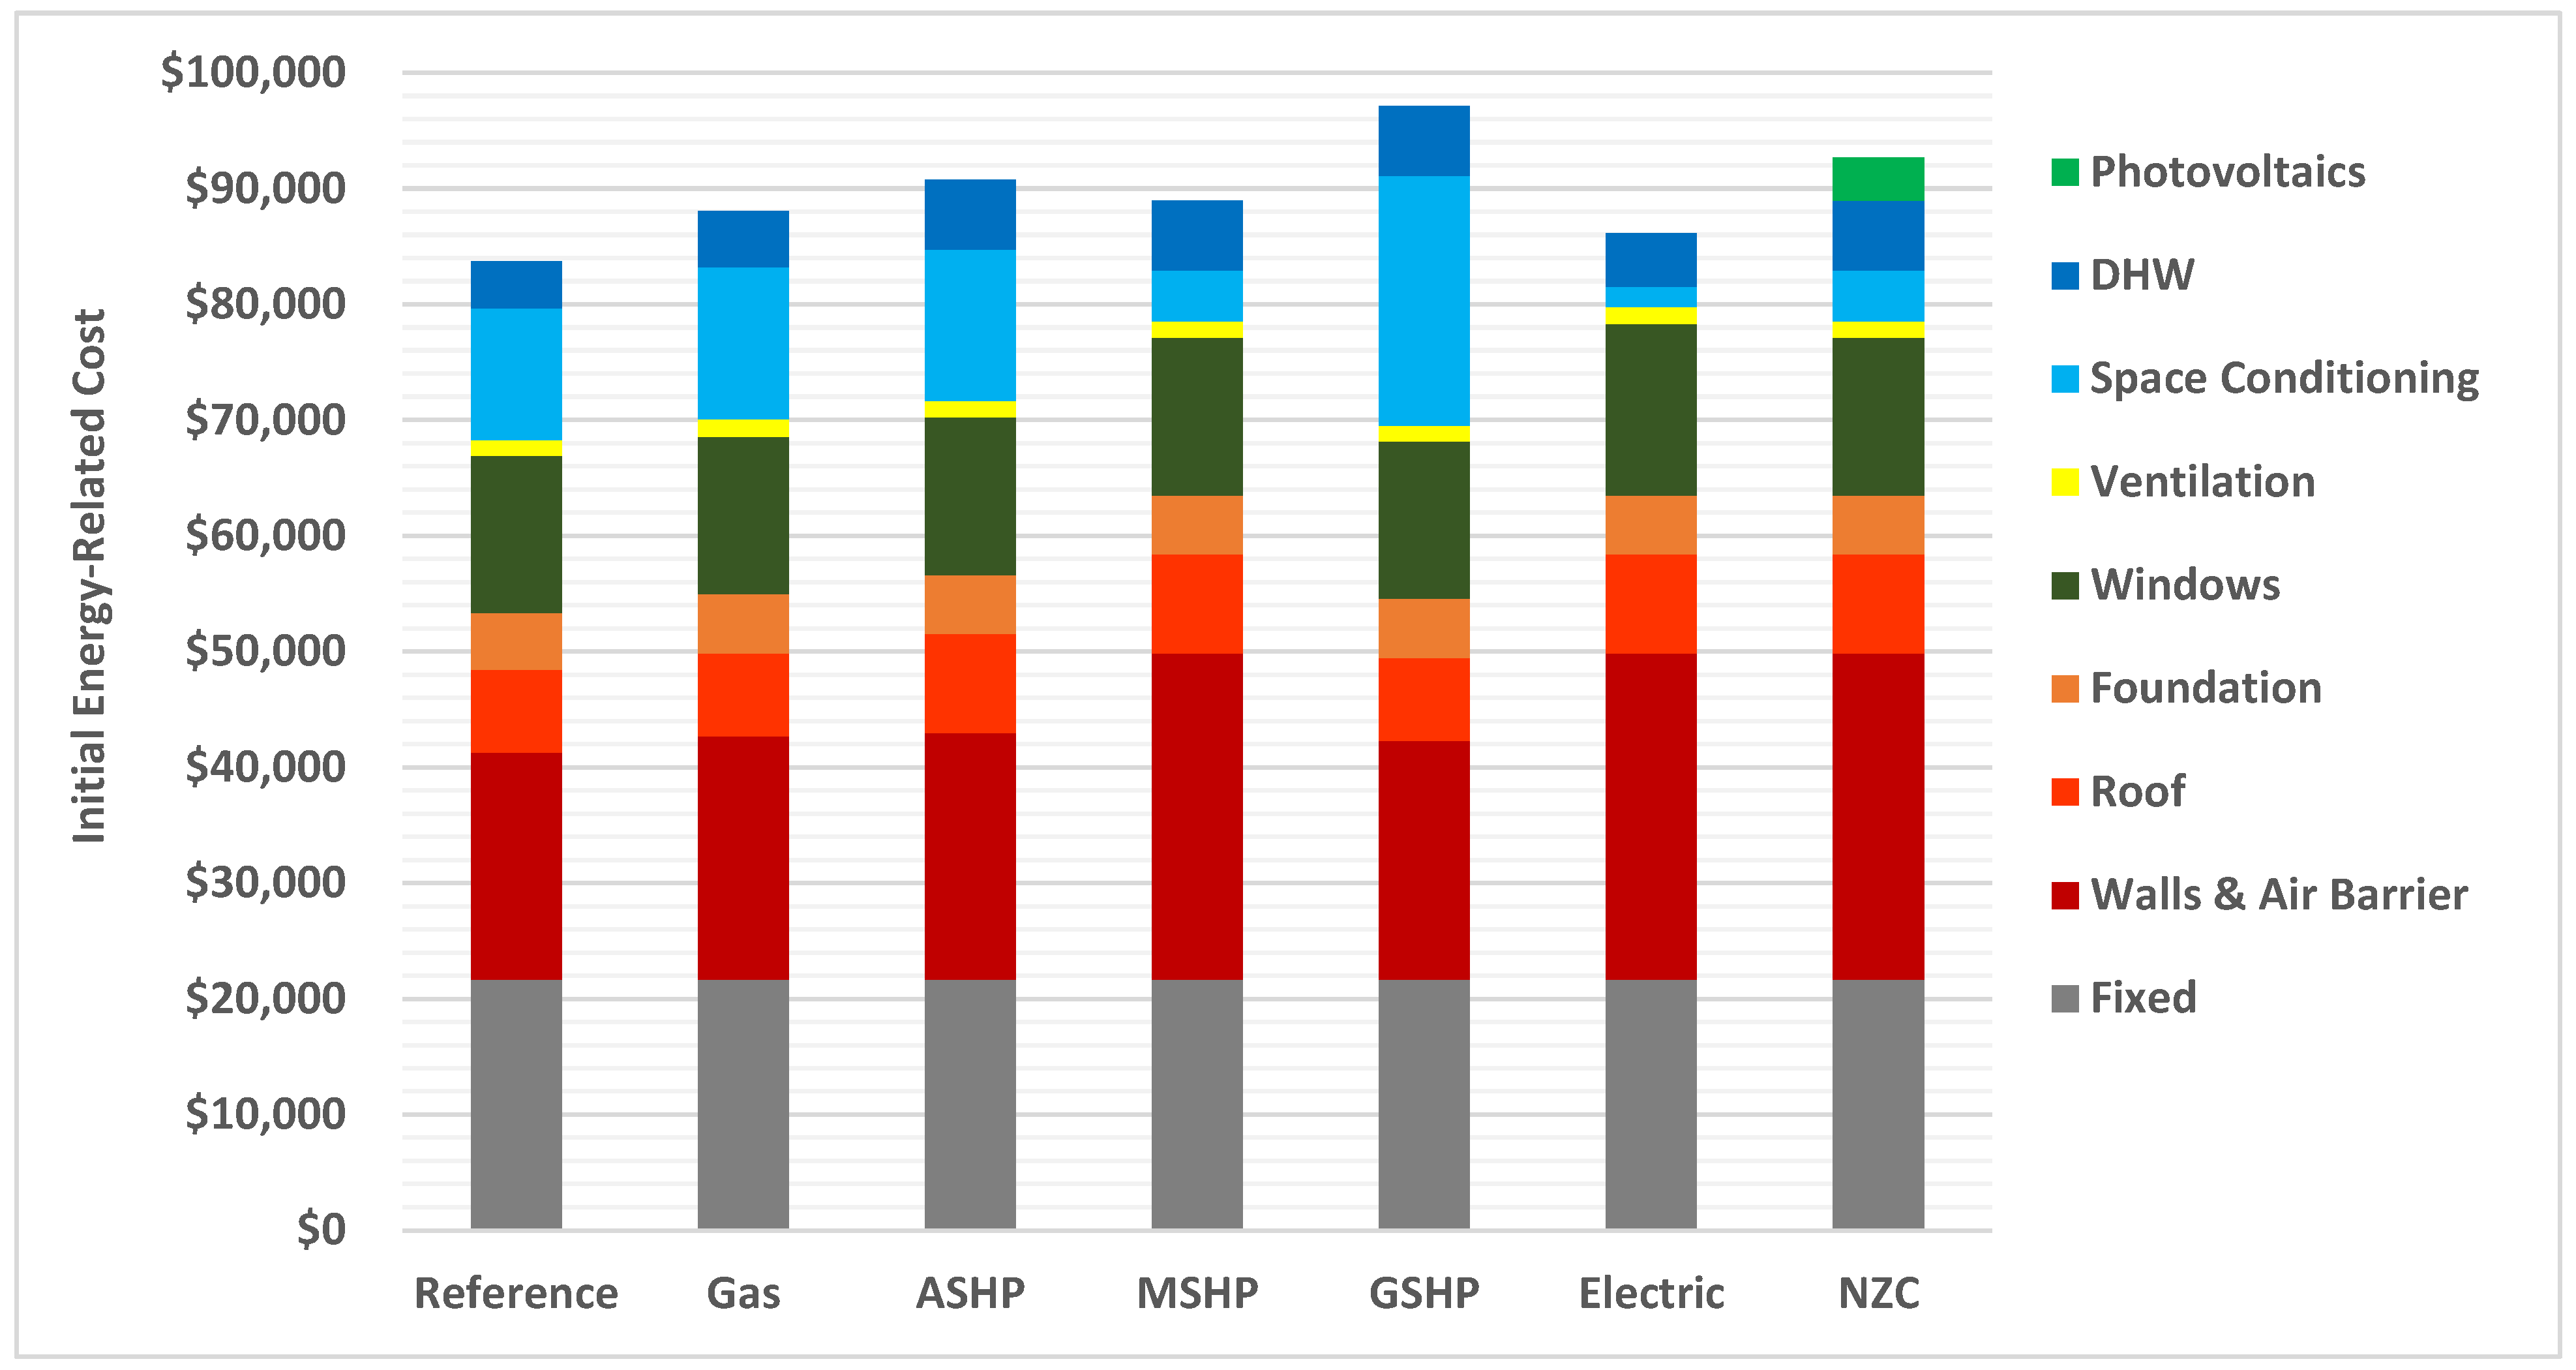
5.3. Initial Cost and Design
The initial cost of each of the optimal designs for Toronto displayed in Figure 10 is broken down by building component category. In each case, 20% of the total cost is paid as the down payment, with the remaining 80% constituting the mortgage principal, which is paid over the 30-year mortgage period. Note that the building components with the greatest cost variation are the walls/air-barrier and the space conditioning system. Also note that, while the reference design has the lowest initial cost, it has the highest LCC in the charts above (Figure 10). The MSHP design is initially 1.0% costlier than the optimal gas design, whereas the electric design is 2.2% cheaper.

Figure 10.
Initial cost optimal designs—Toronto (“fixed” includes lighting, appliances, ceiling fans, doors, eaves, and thermal mass).
The resultant optimal designs for each of the Toronto models are listed in Table 10.
Table 10.
Resultant lowest-LCC designs for all thermal system types—Toronto (TO).
The analysis found that in Toronto, all models had improvements in airtightness and DHW piping insulation. Electric optimization resulted in the most significant thermal envelope upgrades. The NZC design is the same as the MSHP design, with 1 kW of PV added. In Edmonton and Halifax, higher quantities of PV had a more significant impact on cost and emissions results, influencing building designs.
5.4. Operational Energy, Cost, and Emissions
5.4.1. Purchased Energy Use
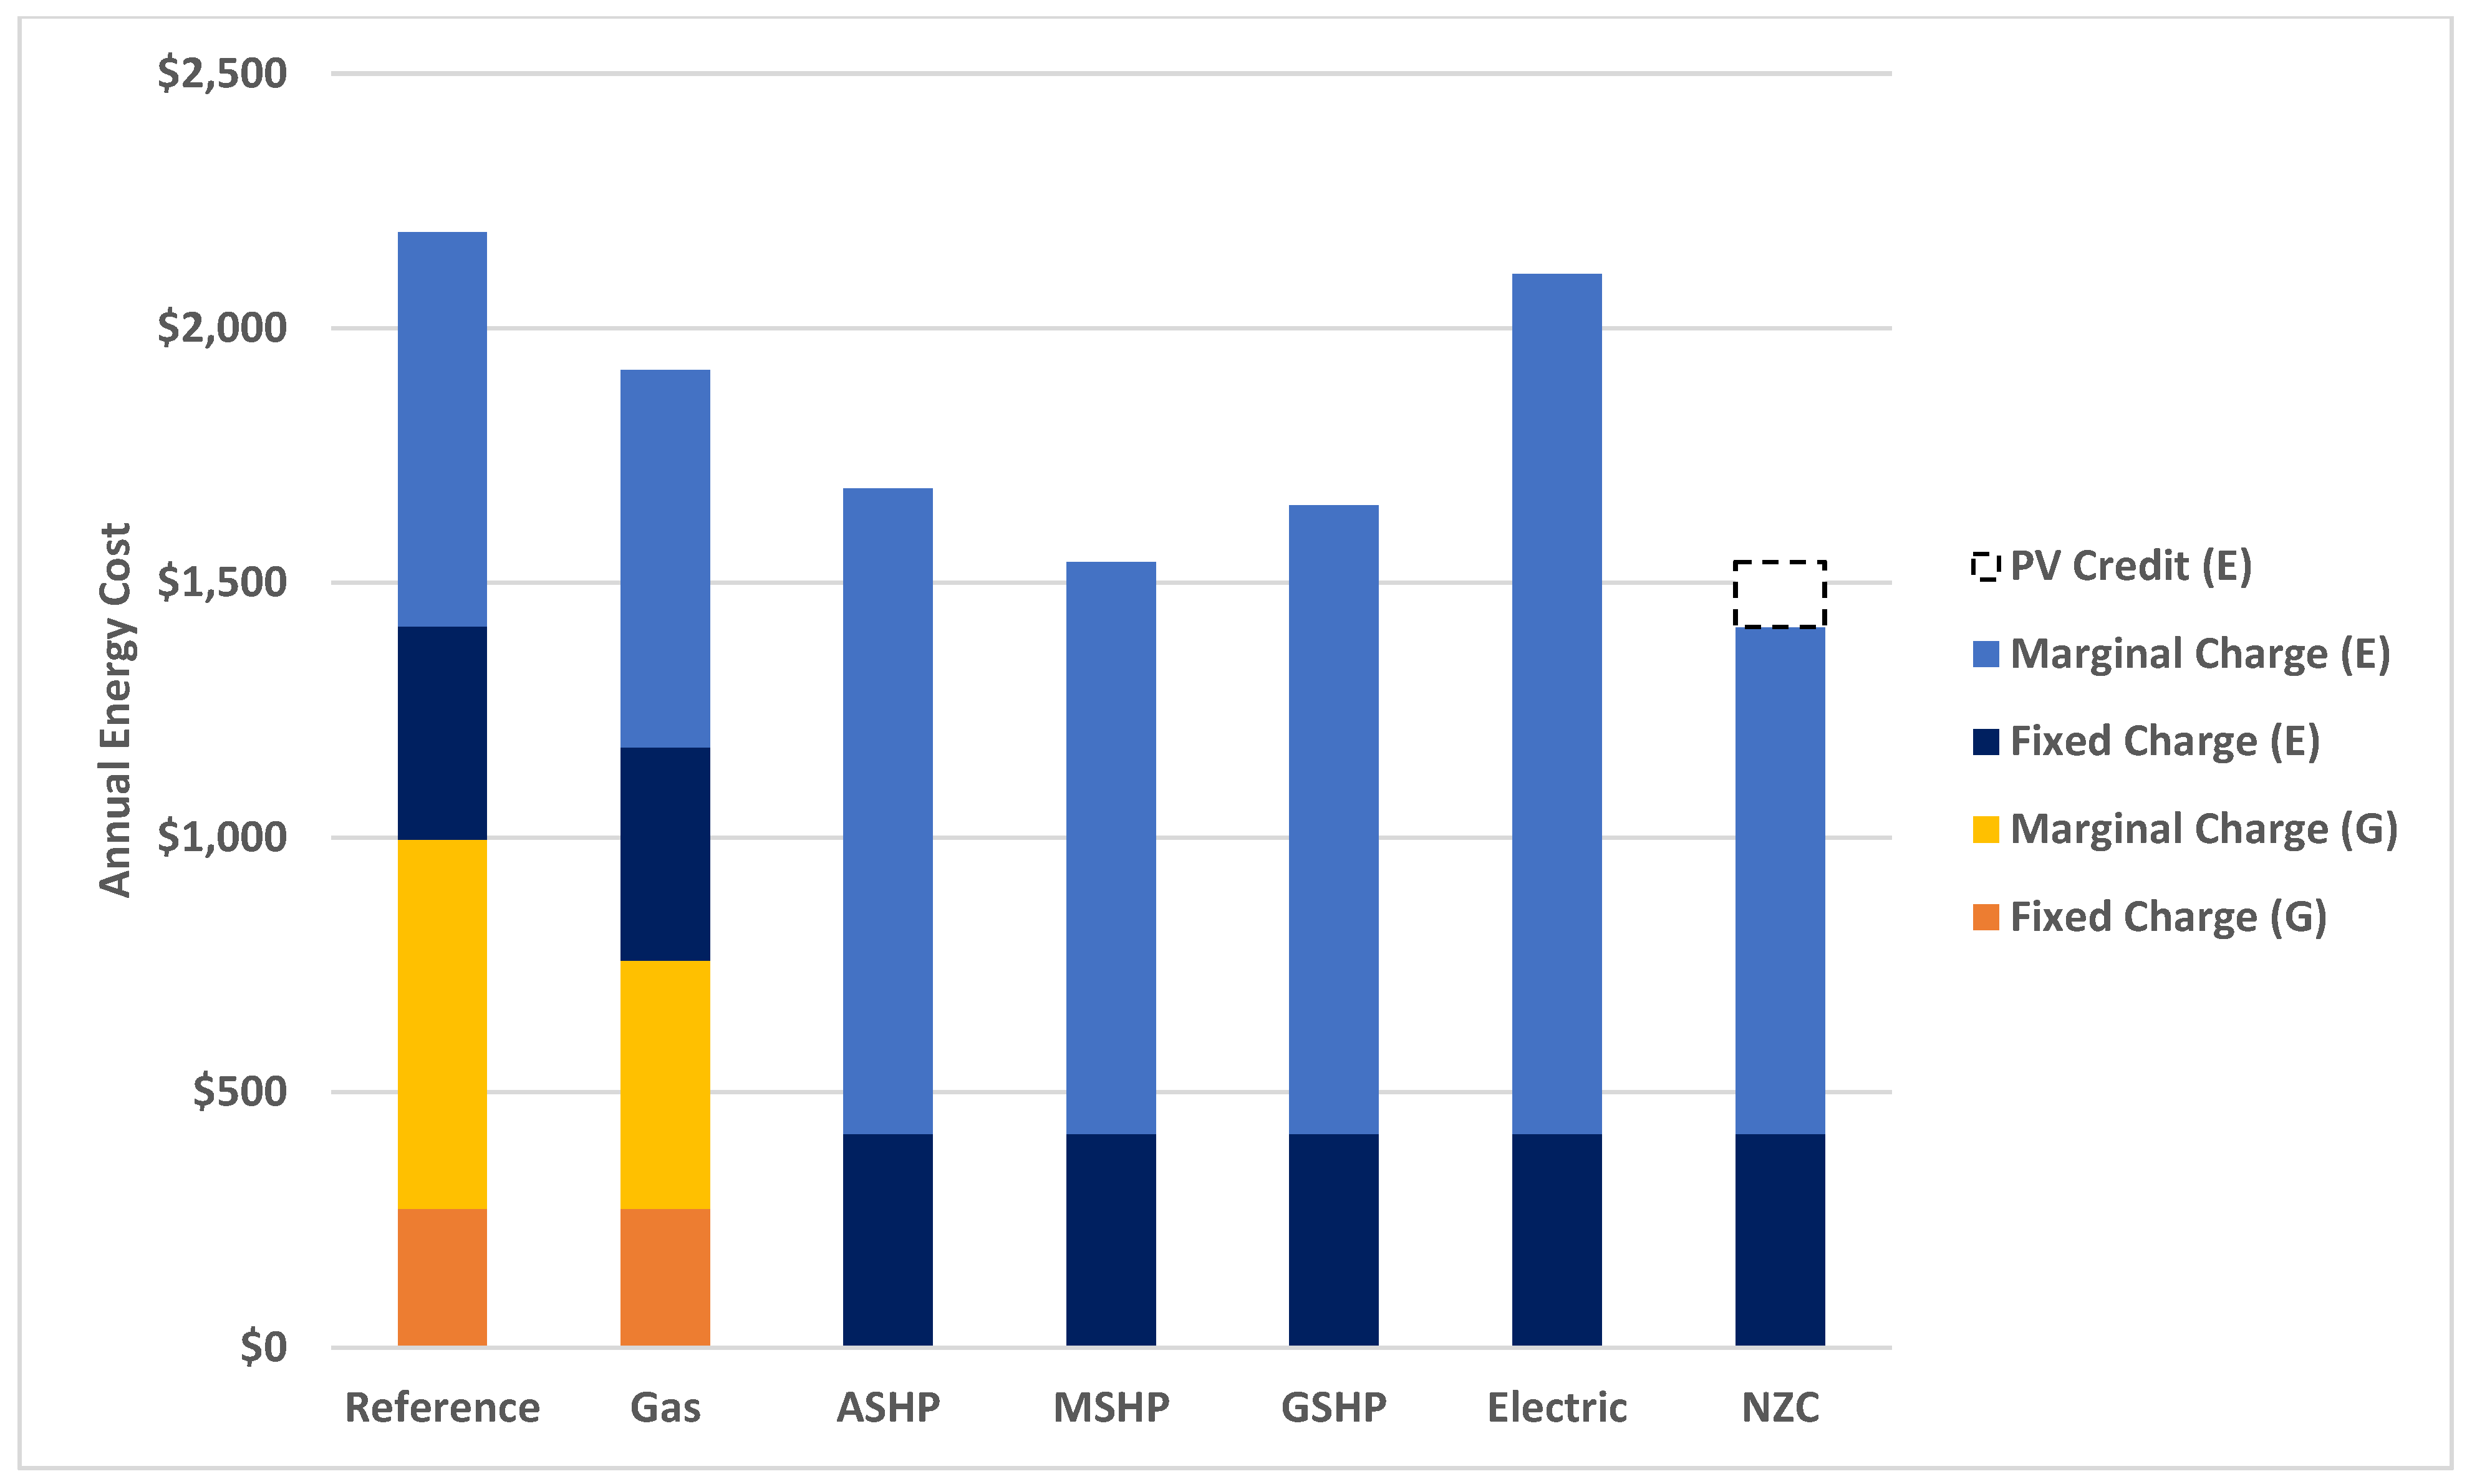
Energy end-use for each of the Toronto designs is shown in Figure 11 and utility costs by fuel type for the same designs can be seen in Figure 12. The comparisons in Figure 13 are analogous to the EUI, since the building geometry is unchanged for all designs. Figure 13 provides a breakdown of GHG emissions by fuel type for the same designs.
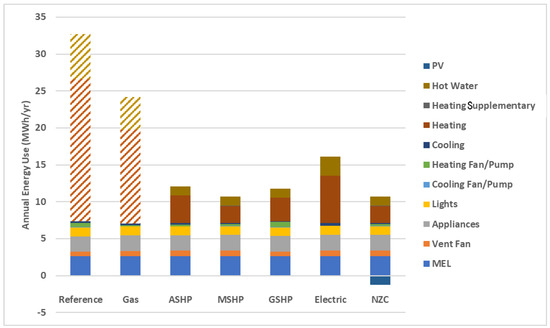
Figure 11.
Annual energy use by end-use—Toronto (hatched = natural gas, solid = electricity).

Figure 12.
Annual energy costs of optimal models—Toronto (E = electricity, G = natural gas).
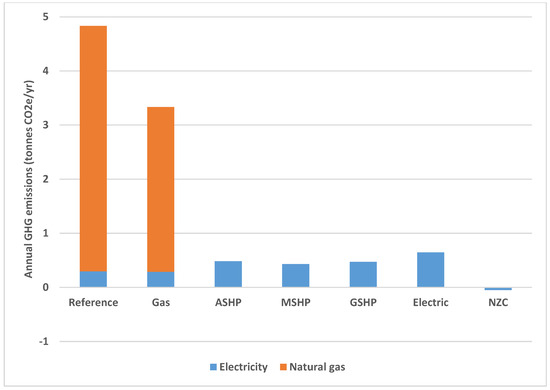
Figure 13.
Annual GHG emissions by fuel type—Toronto.
The models that utilize heat pumps to provide space heating and DHW have the lowest energy consumption. However, somewhat surprisingly, they also have a lower operational cost than the gas design. The electric design consumes less energy, but the energy cost is higher. Taken together, these three charts illustrate how total energy use does not necessarily provide any useful information regarding either energy cost or energy-related emissions, especially when comparing buildings with different heating system types. For the gas-heated designs, the natural gas proportion of the total cost is much lower than it is for total energy, but it accounts for almost all of the GHG emissions. Furthermore, these interrelationships can vary greatly by location, as the electricity/gas price ratio changes, as well as the electricity EF.
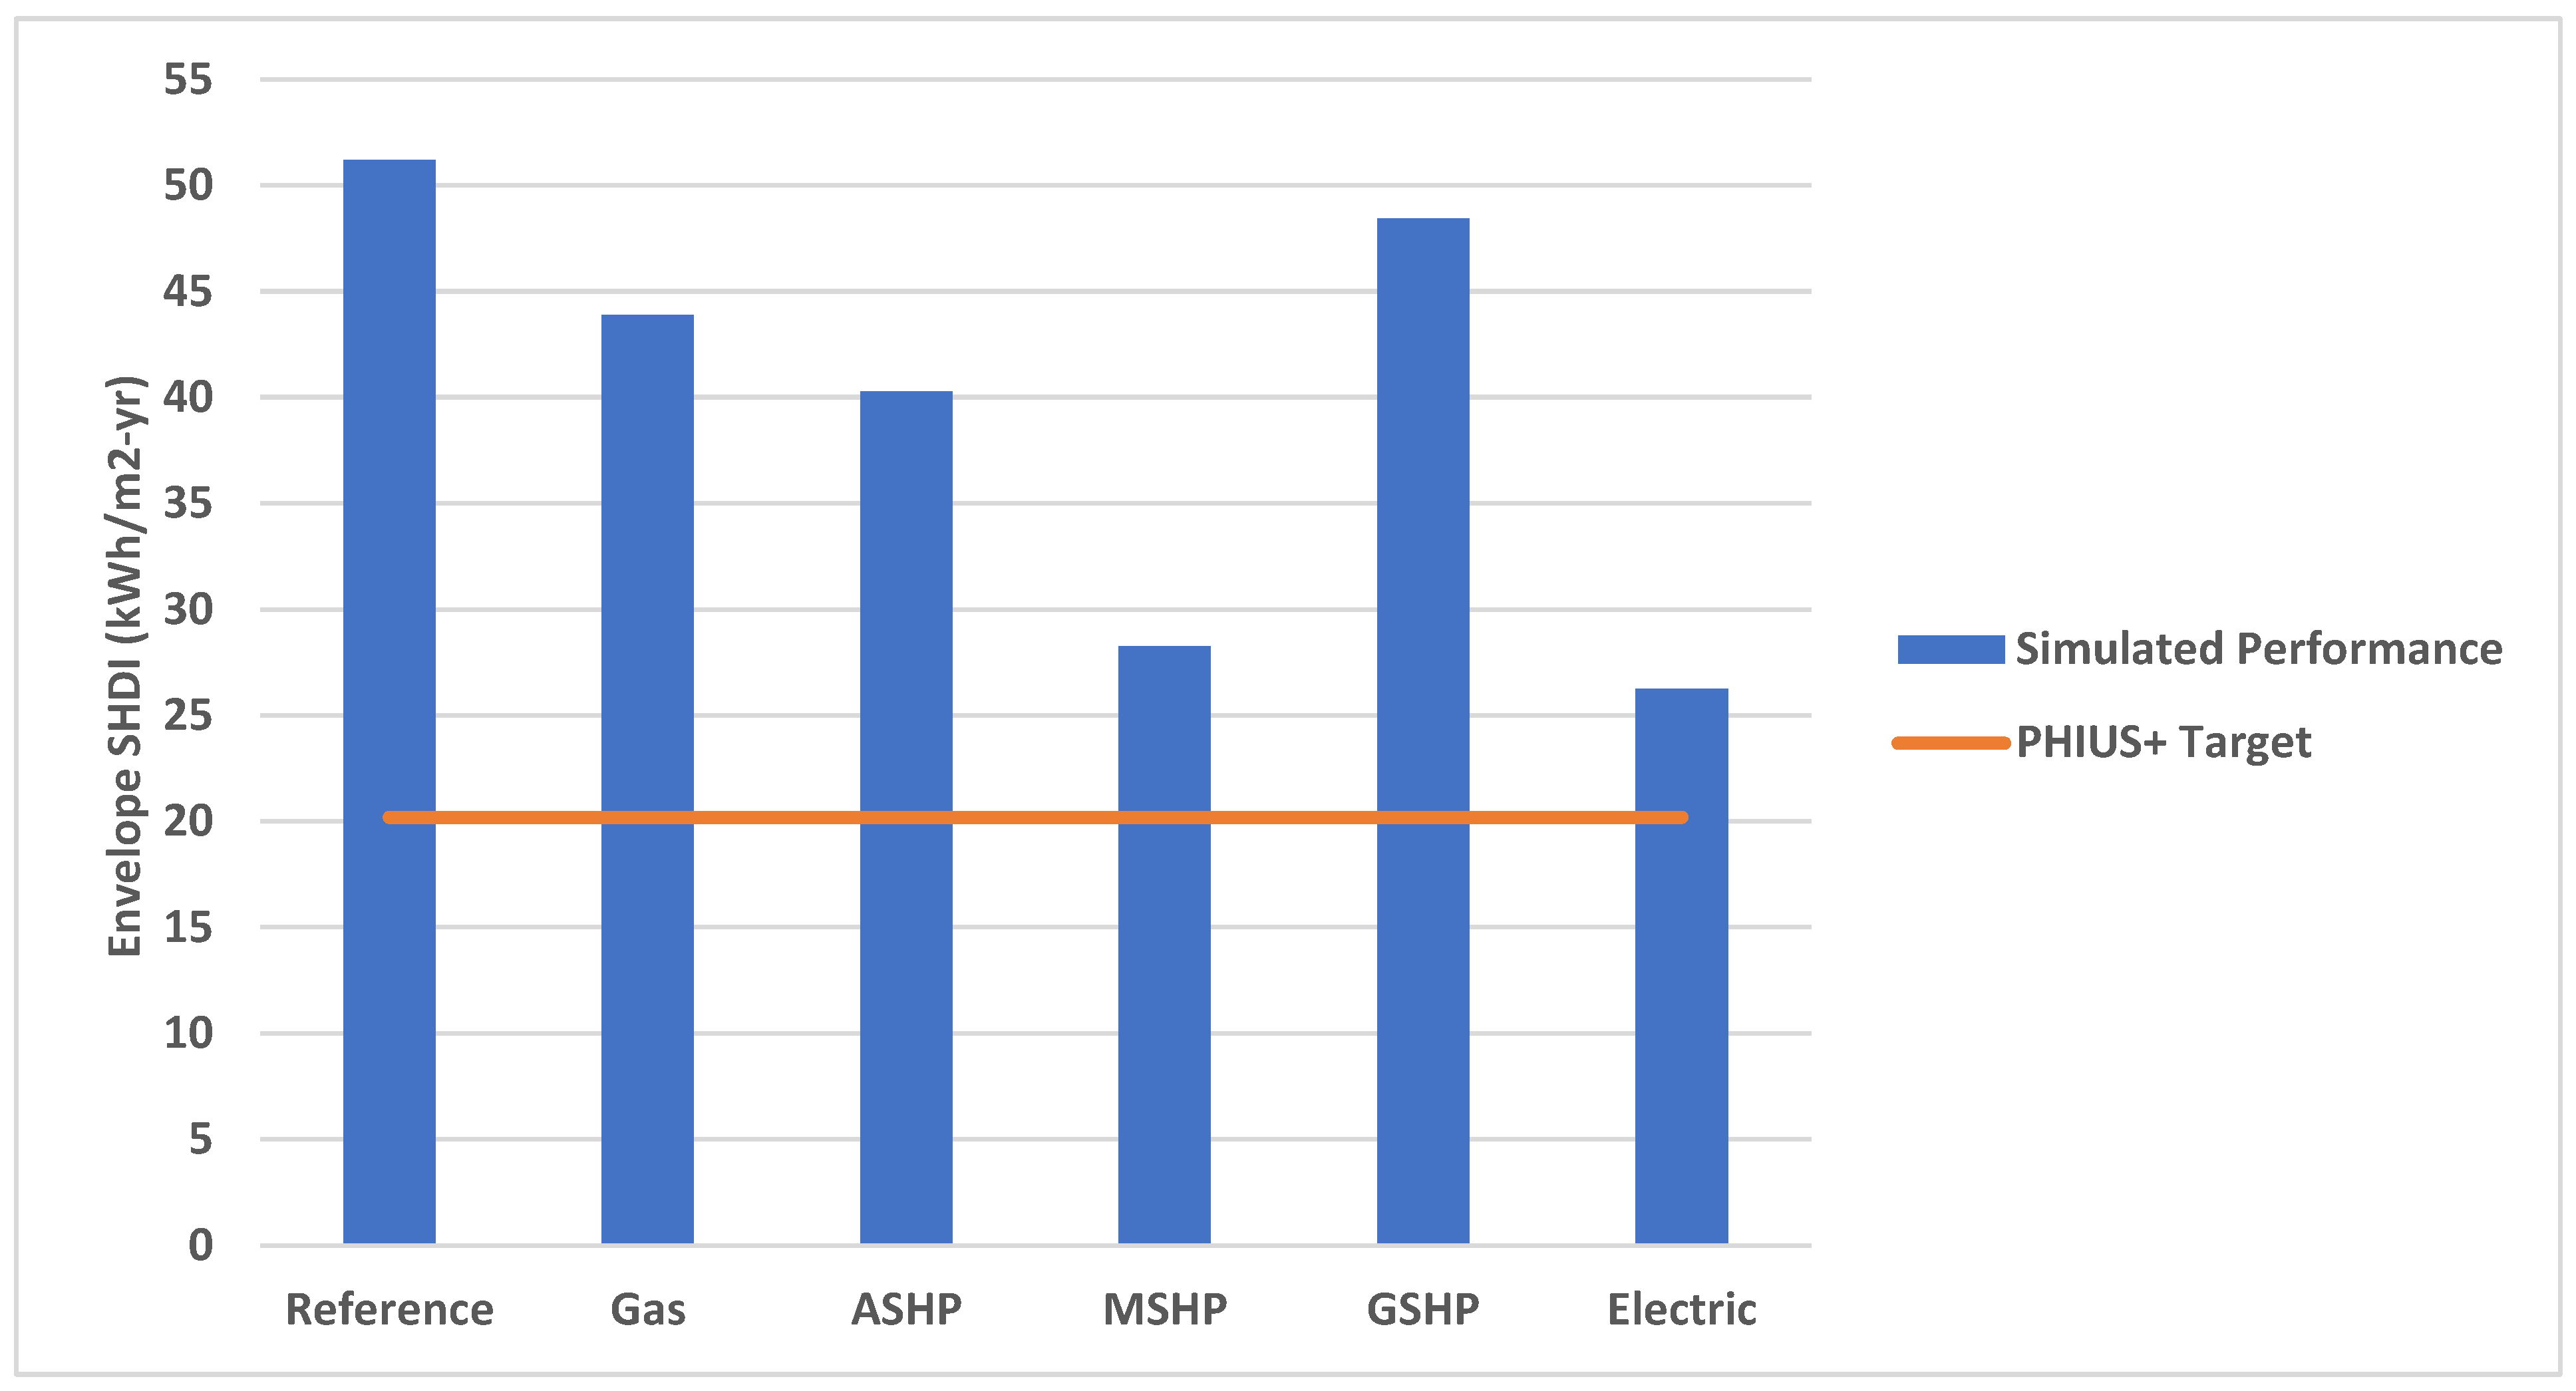
5.4.2. Enclosure Thermal Performance
The SHDI metric is intended here as a means of characterizing the thermal performance of the building enclosure, including heat recovered by the HRV/ERV. In addition to representing the enclosure performance, it indicates how much heat is required to be provided by any given mechanical space heating system. However, for models containing an HPWH, the space heating and space cooling demands are “distorted” by the cooling effect it provides. To understand the magnitude of this effect, the optimal MSHP design has been run separately, with and without the HPWH. When the building includes an HPWH, the space heat demand, or SHDI, for the building increases by 3.3 kWh/m2, or 12%. Additionally, the space cooling demand intensity decreases by 0.7 kWh/m2, or 15%. For the ASHP and GSHP models, the SHDI increases by 3.5 and 3.6 kWh/m2, respectively, when the HPWH is included. To achieve a fair comparison of enclosure thermal performance, the SHDI values illustrated in Figure 14 have been determined without the distorting effect of the HPWH. To understand how much heat is delivered by the heating system for the heat pump models, add approximately 3.5 to the value shown below for those models.
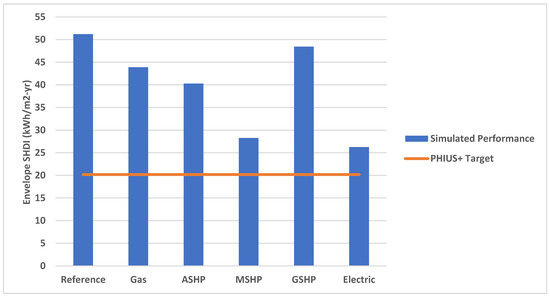
Figure 14.
The SHDI of optimal Toronto design enclosures; the orange line represents the climate-specific North American Passive House Standard Target [32].
Whether thermal system type has a substantial impact on optimal thermal envelope design is inconclusive based on these data alone. There are many factors, including both the capital and operational price of heat. Ideally, one would attempt to correlate an enclosure’s SHDI and the life-cycle price of heat ($/J). However, since the capital investment in the heating source is interlinked with the equipment for cooling and DHW, and in different ways for different thermal system types, it is difficult to isolate.
However, at least for the electric heating sources, there appears to be an inverse correlation with the operational price of heat. From the simulated heating COP values, we can see that the price of heat from the GSHP is the lowest, followed by the ASHP, the MSHP, and finally, the electric baseboard. It is therefore logical that as a heat source becomes more expensive, it is optimal to invest more in a higher-performing thermal envelope to reduce the SHDI. This is a fact that is not recognized by NBC 9.36, or either of the Passive House standards, and only very simply by OBC SB-12. Furthermore, when multiple heating system types are considered, as is the case here, a lower SHDI guarantees neither reduced GHG emissions nor a lower-LCC building, as can be seen by the lack of correlation with LCCs in Figure 8.
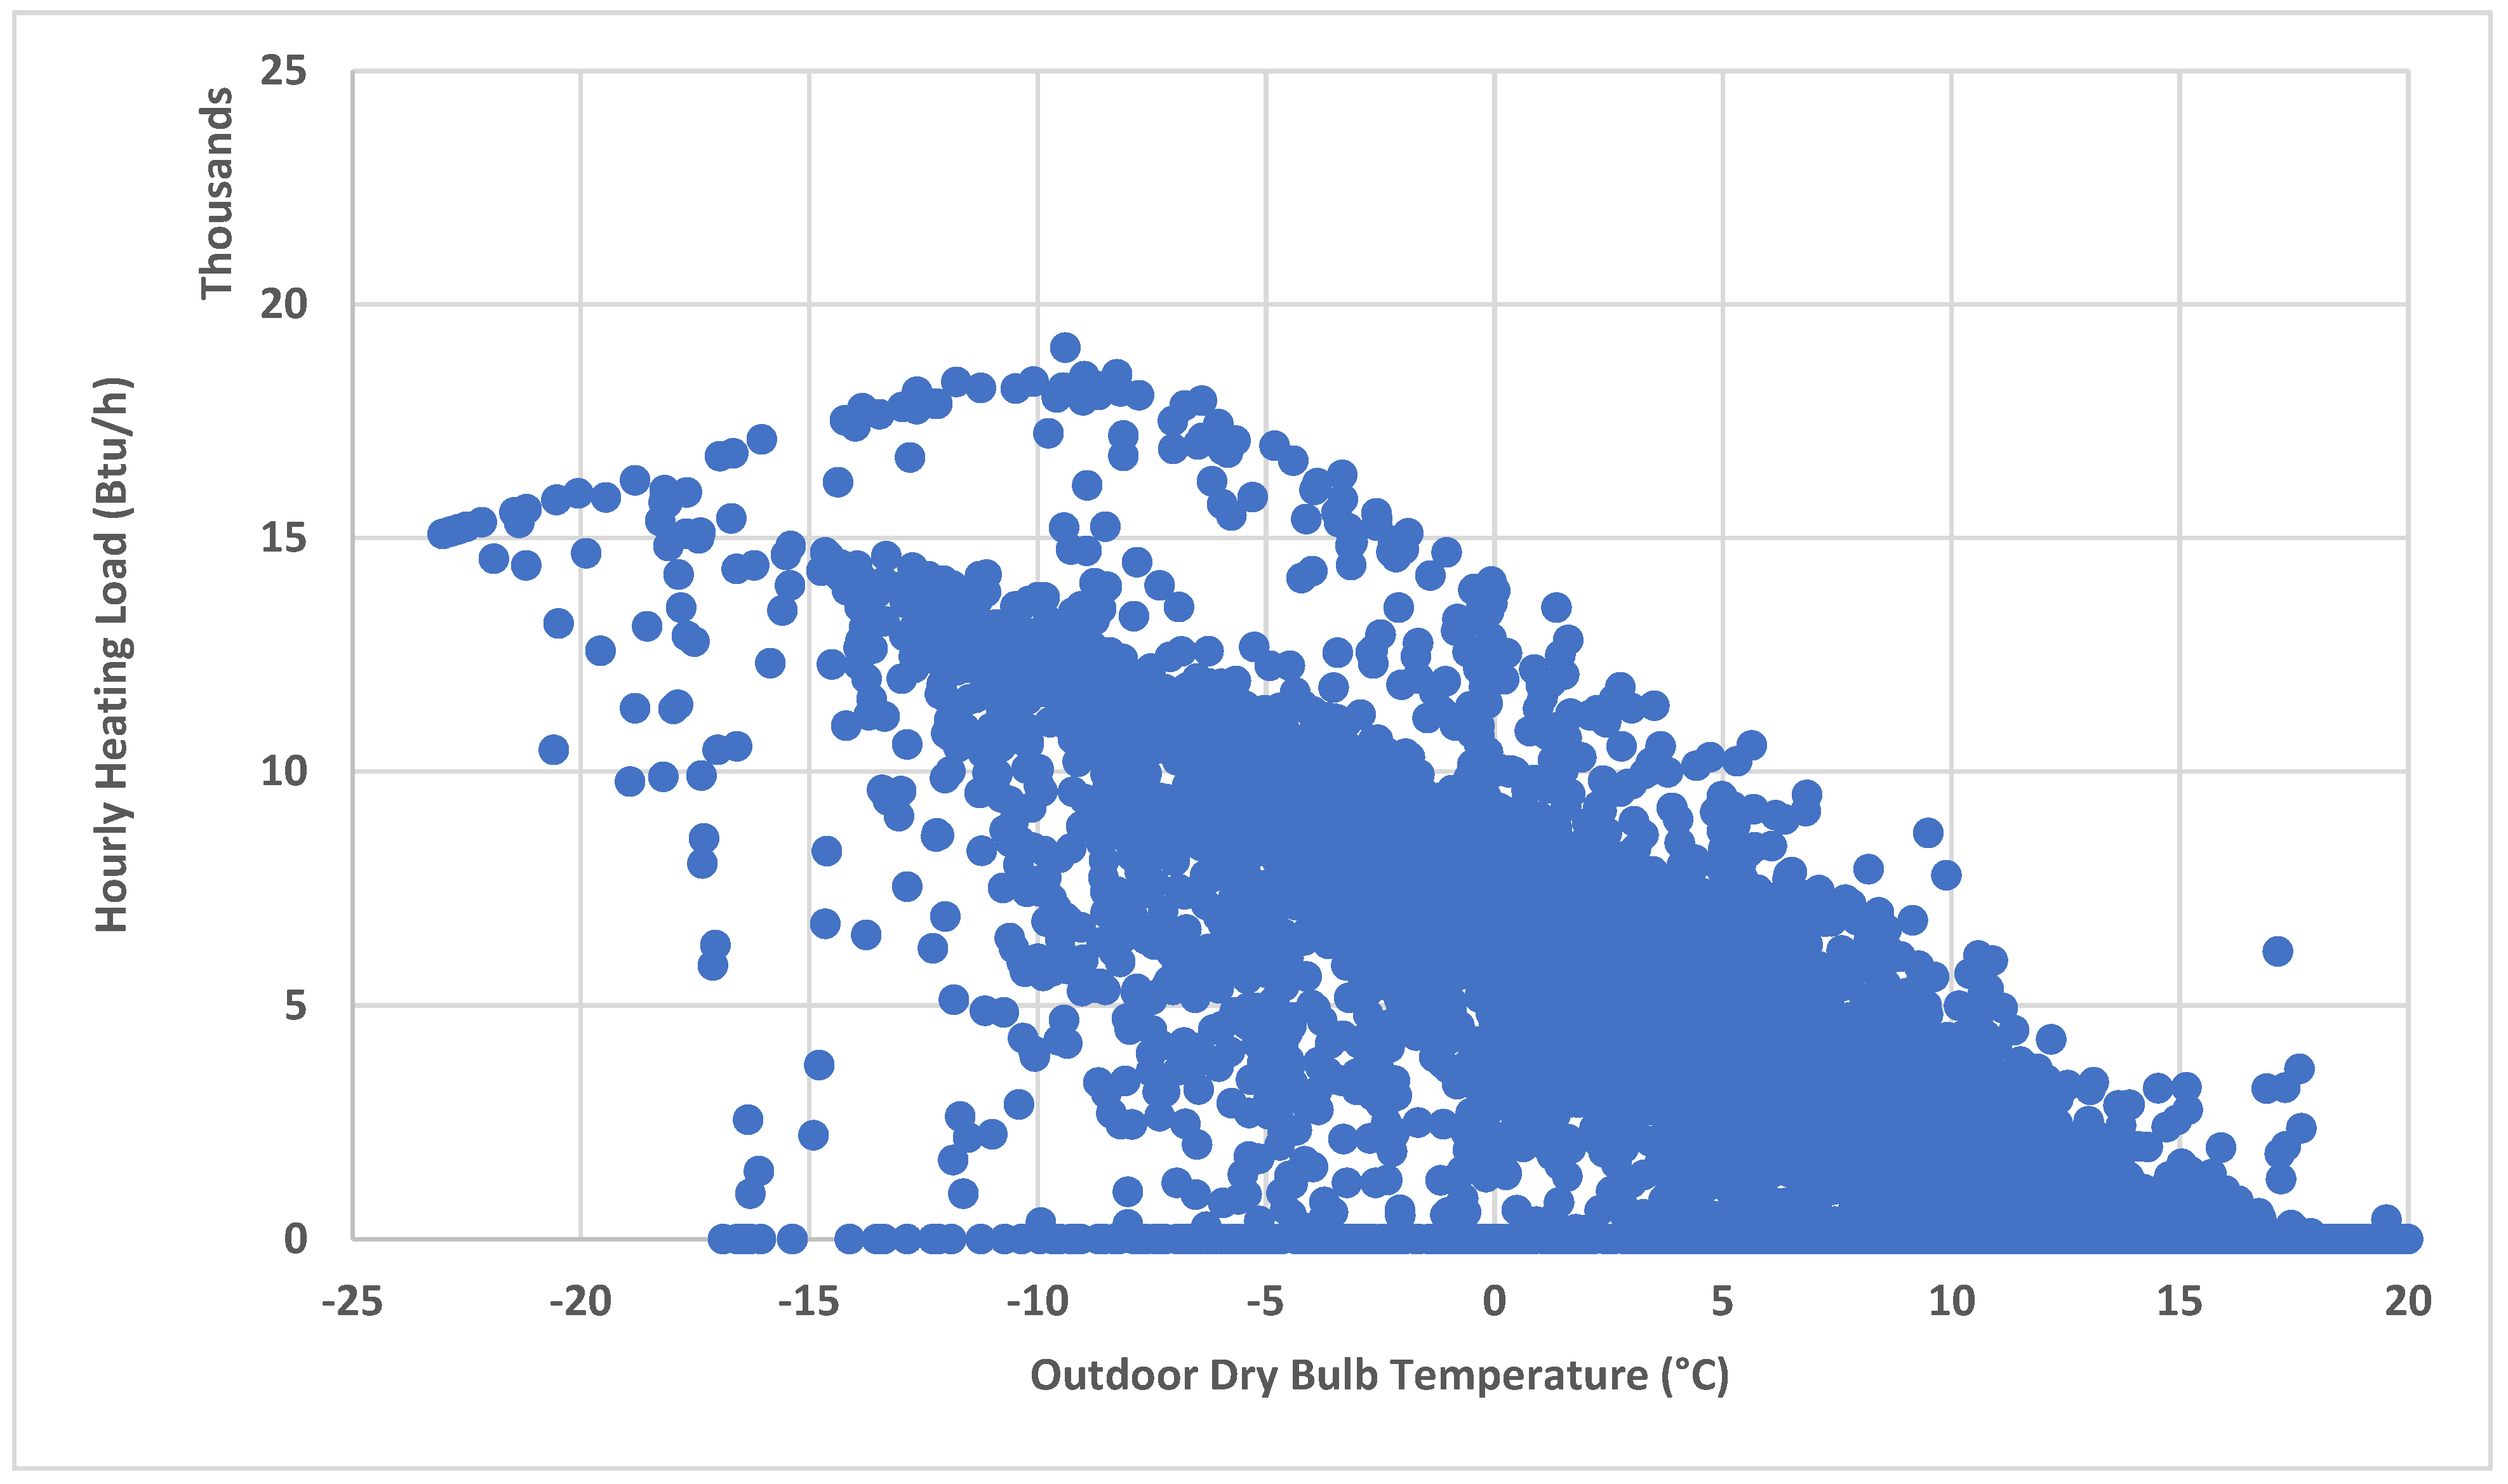
5.4.3. Mechanical Heating
Simulated hourly heat delivered by the MSHP to the building for the MSHP-TO optimal design is illustrated in Figure 15. The maximum capacity limit of the heat pump, which falls with the outdoor temperature, can be seen at the top left of the scatter. Beyond this point, supplementary electric baseboard heating meets the hourly load. However, supplementary heating only accounts for 0.7% of the annual delivered heat.
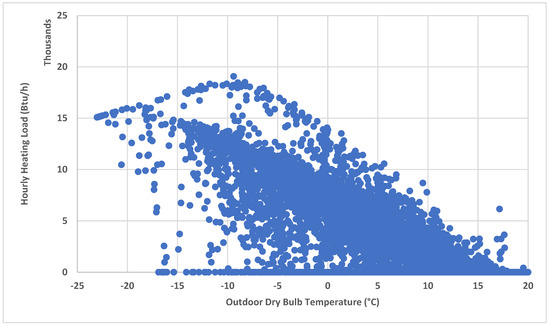
Figure 15.
Hourly heating delivered by the MSHP—Toronto.
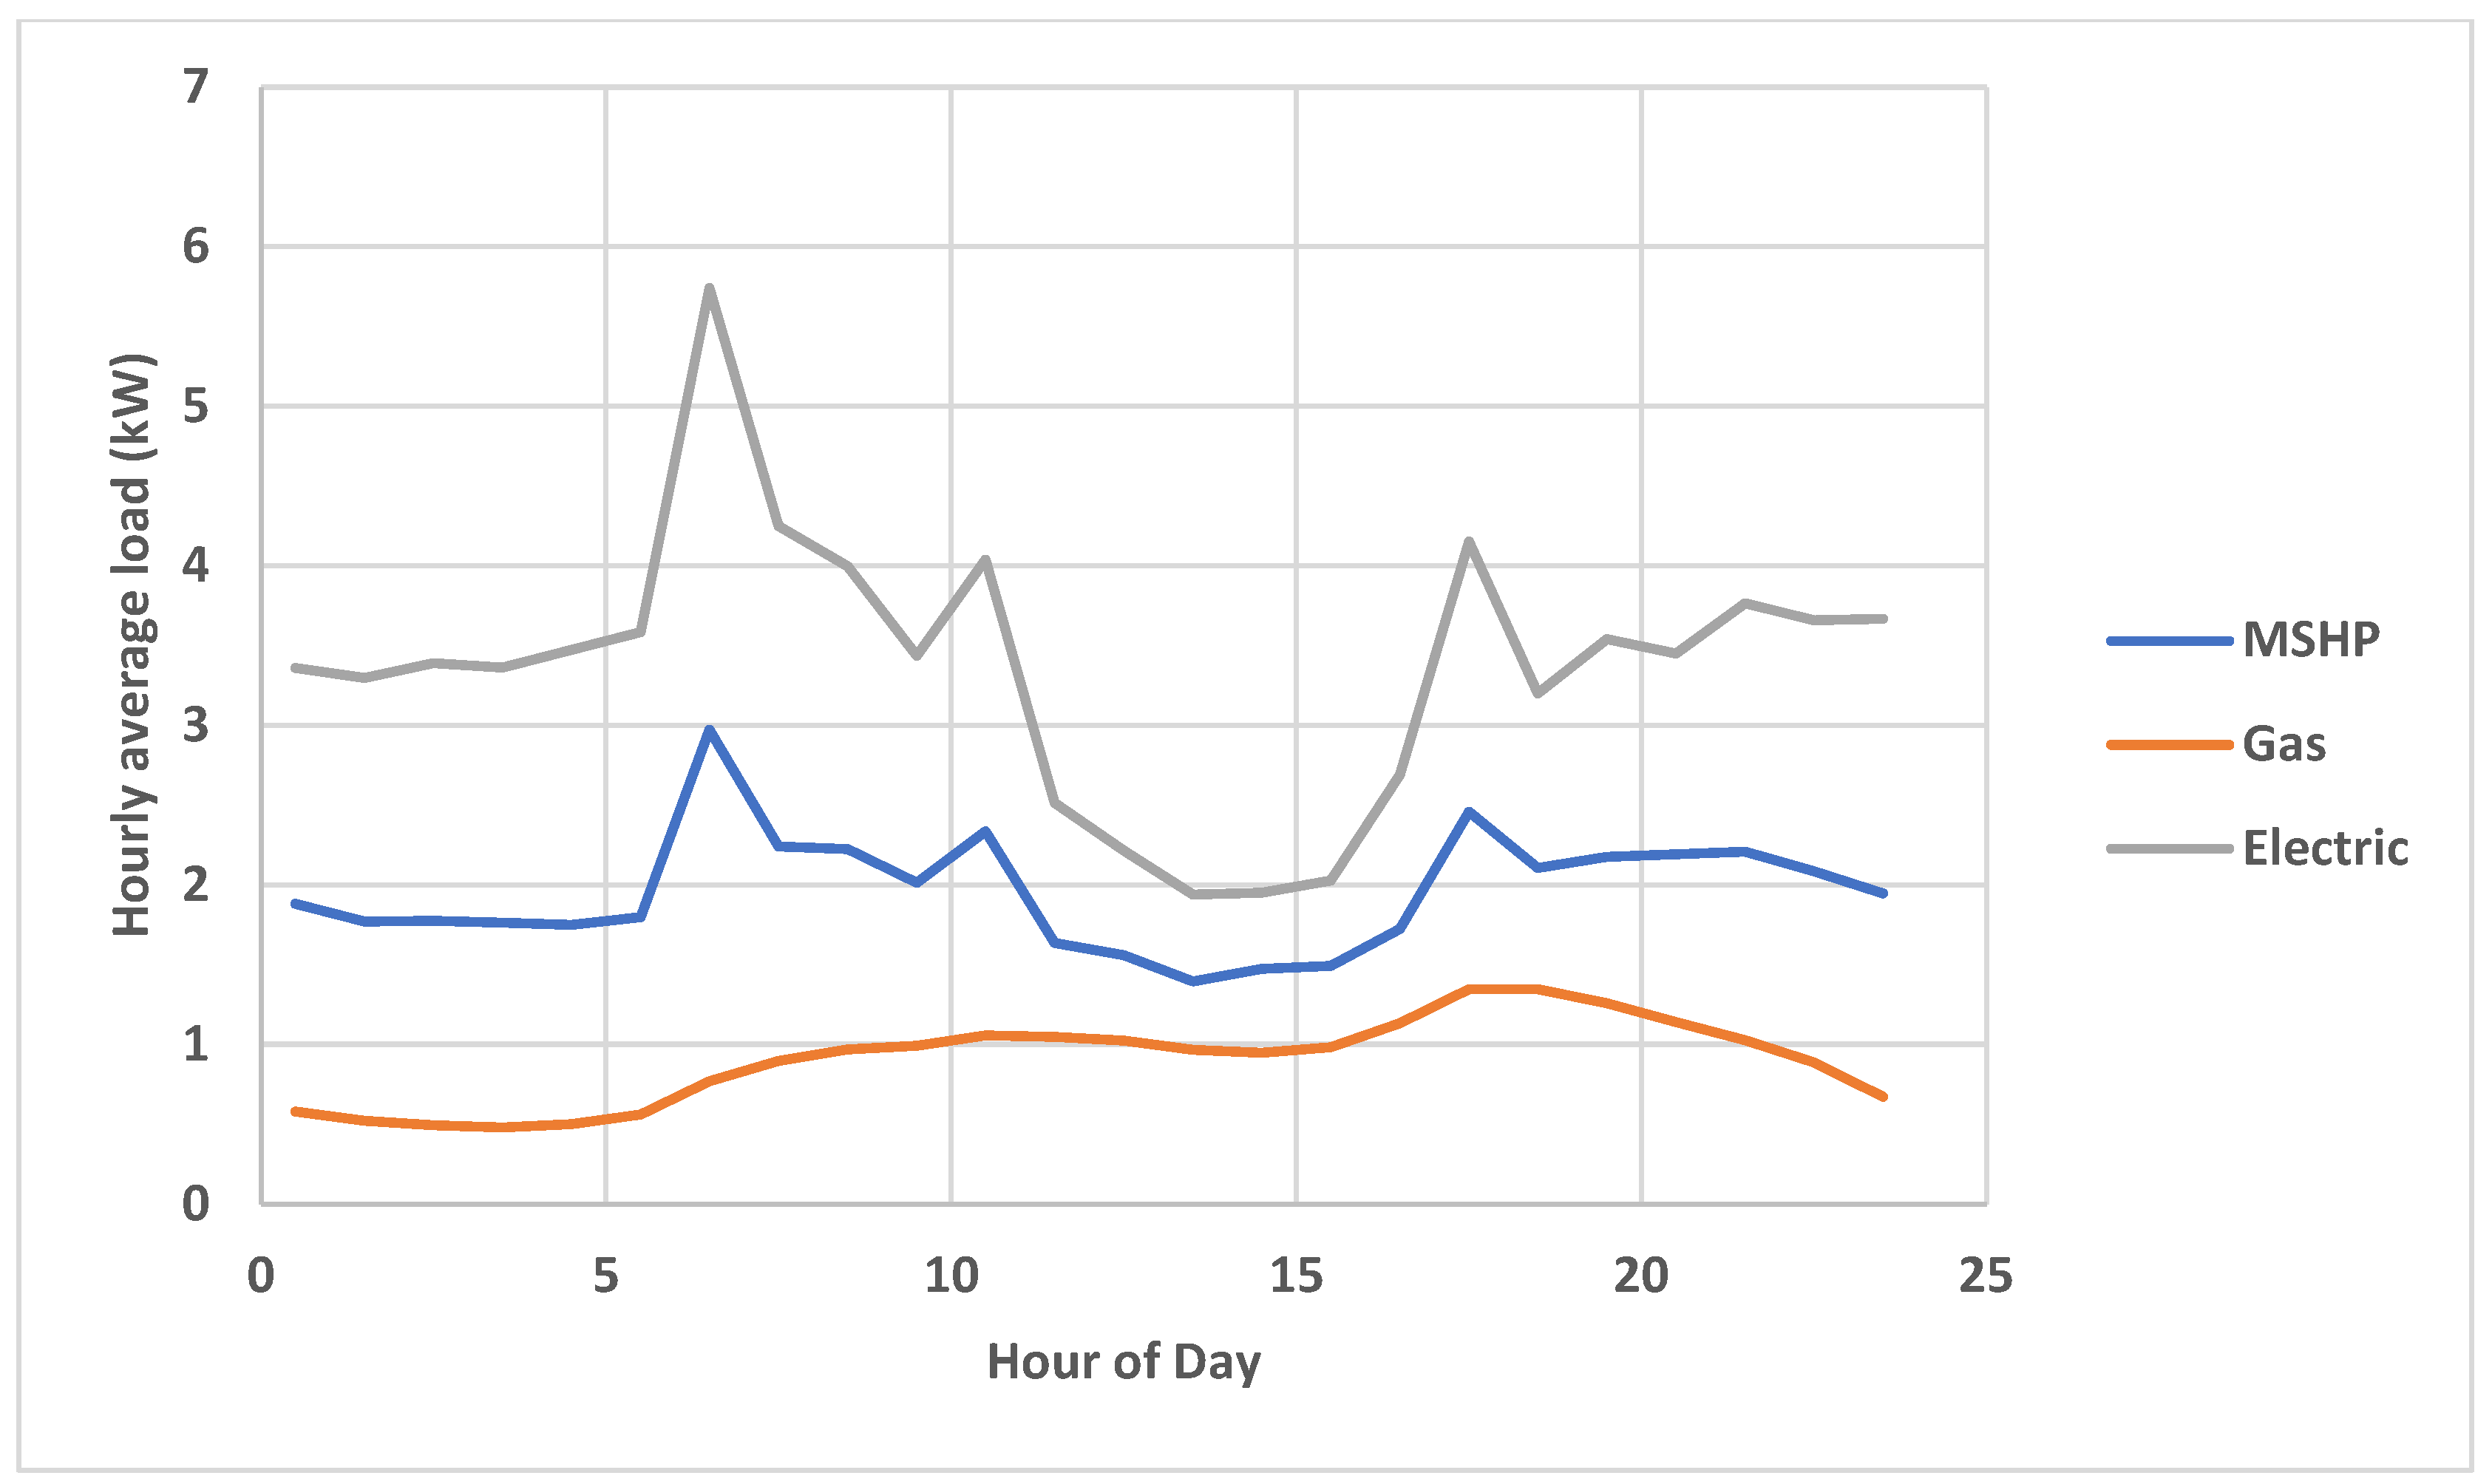
If large numbers of buildings begin switching to electric sources of heating, it will be important to mitigate peak electric demand on the grid. Part of the way this can be done is through higher performance enclosures to minimize the peak heating load. The largest spikes in demand are due to the electric supplementary heating, which, for the MSHP-TO design, can result in a whole building’s electric demand of up to 7 kW. However, as illustrated in Figure 16, the building electric demand rarely exceeds 4 kW, and the heat pump never exceeds 2.3 kW. On the other hand, heating with a heat pump can reduce peak electric demand if the alternative is baseboard electric heating (see Figure 17).
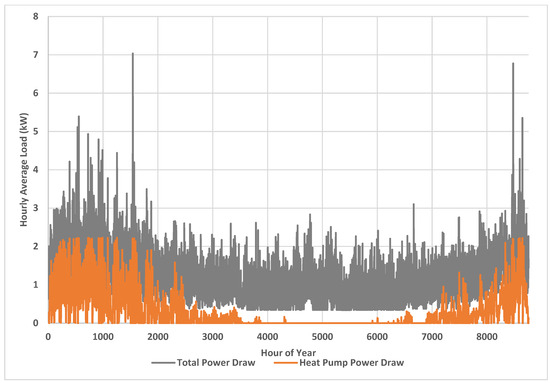
Figure 16.
Annual hourly electric load profile of heat pump and whole building for MSHP—Toronto design.
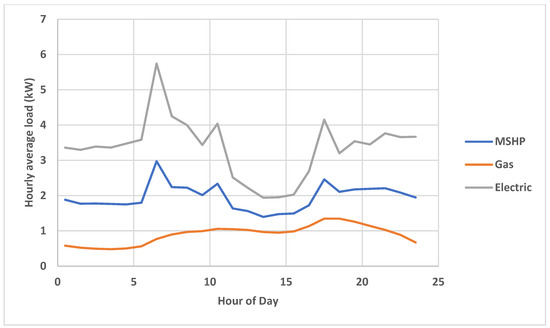
Figure 17.
January day electric load profile—Toronto.
5.4.4. EUI versus GHGI Relationship
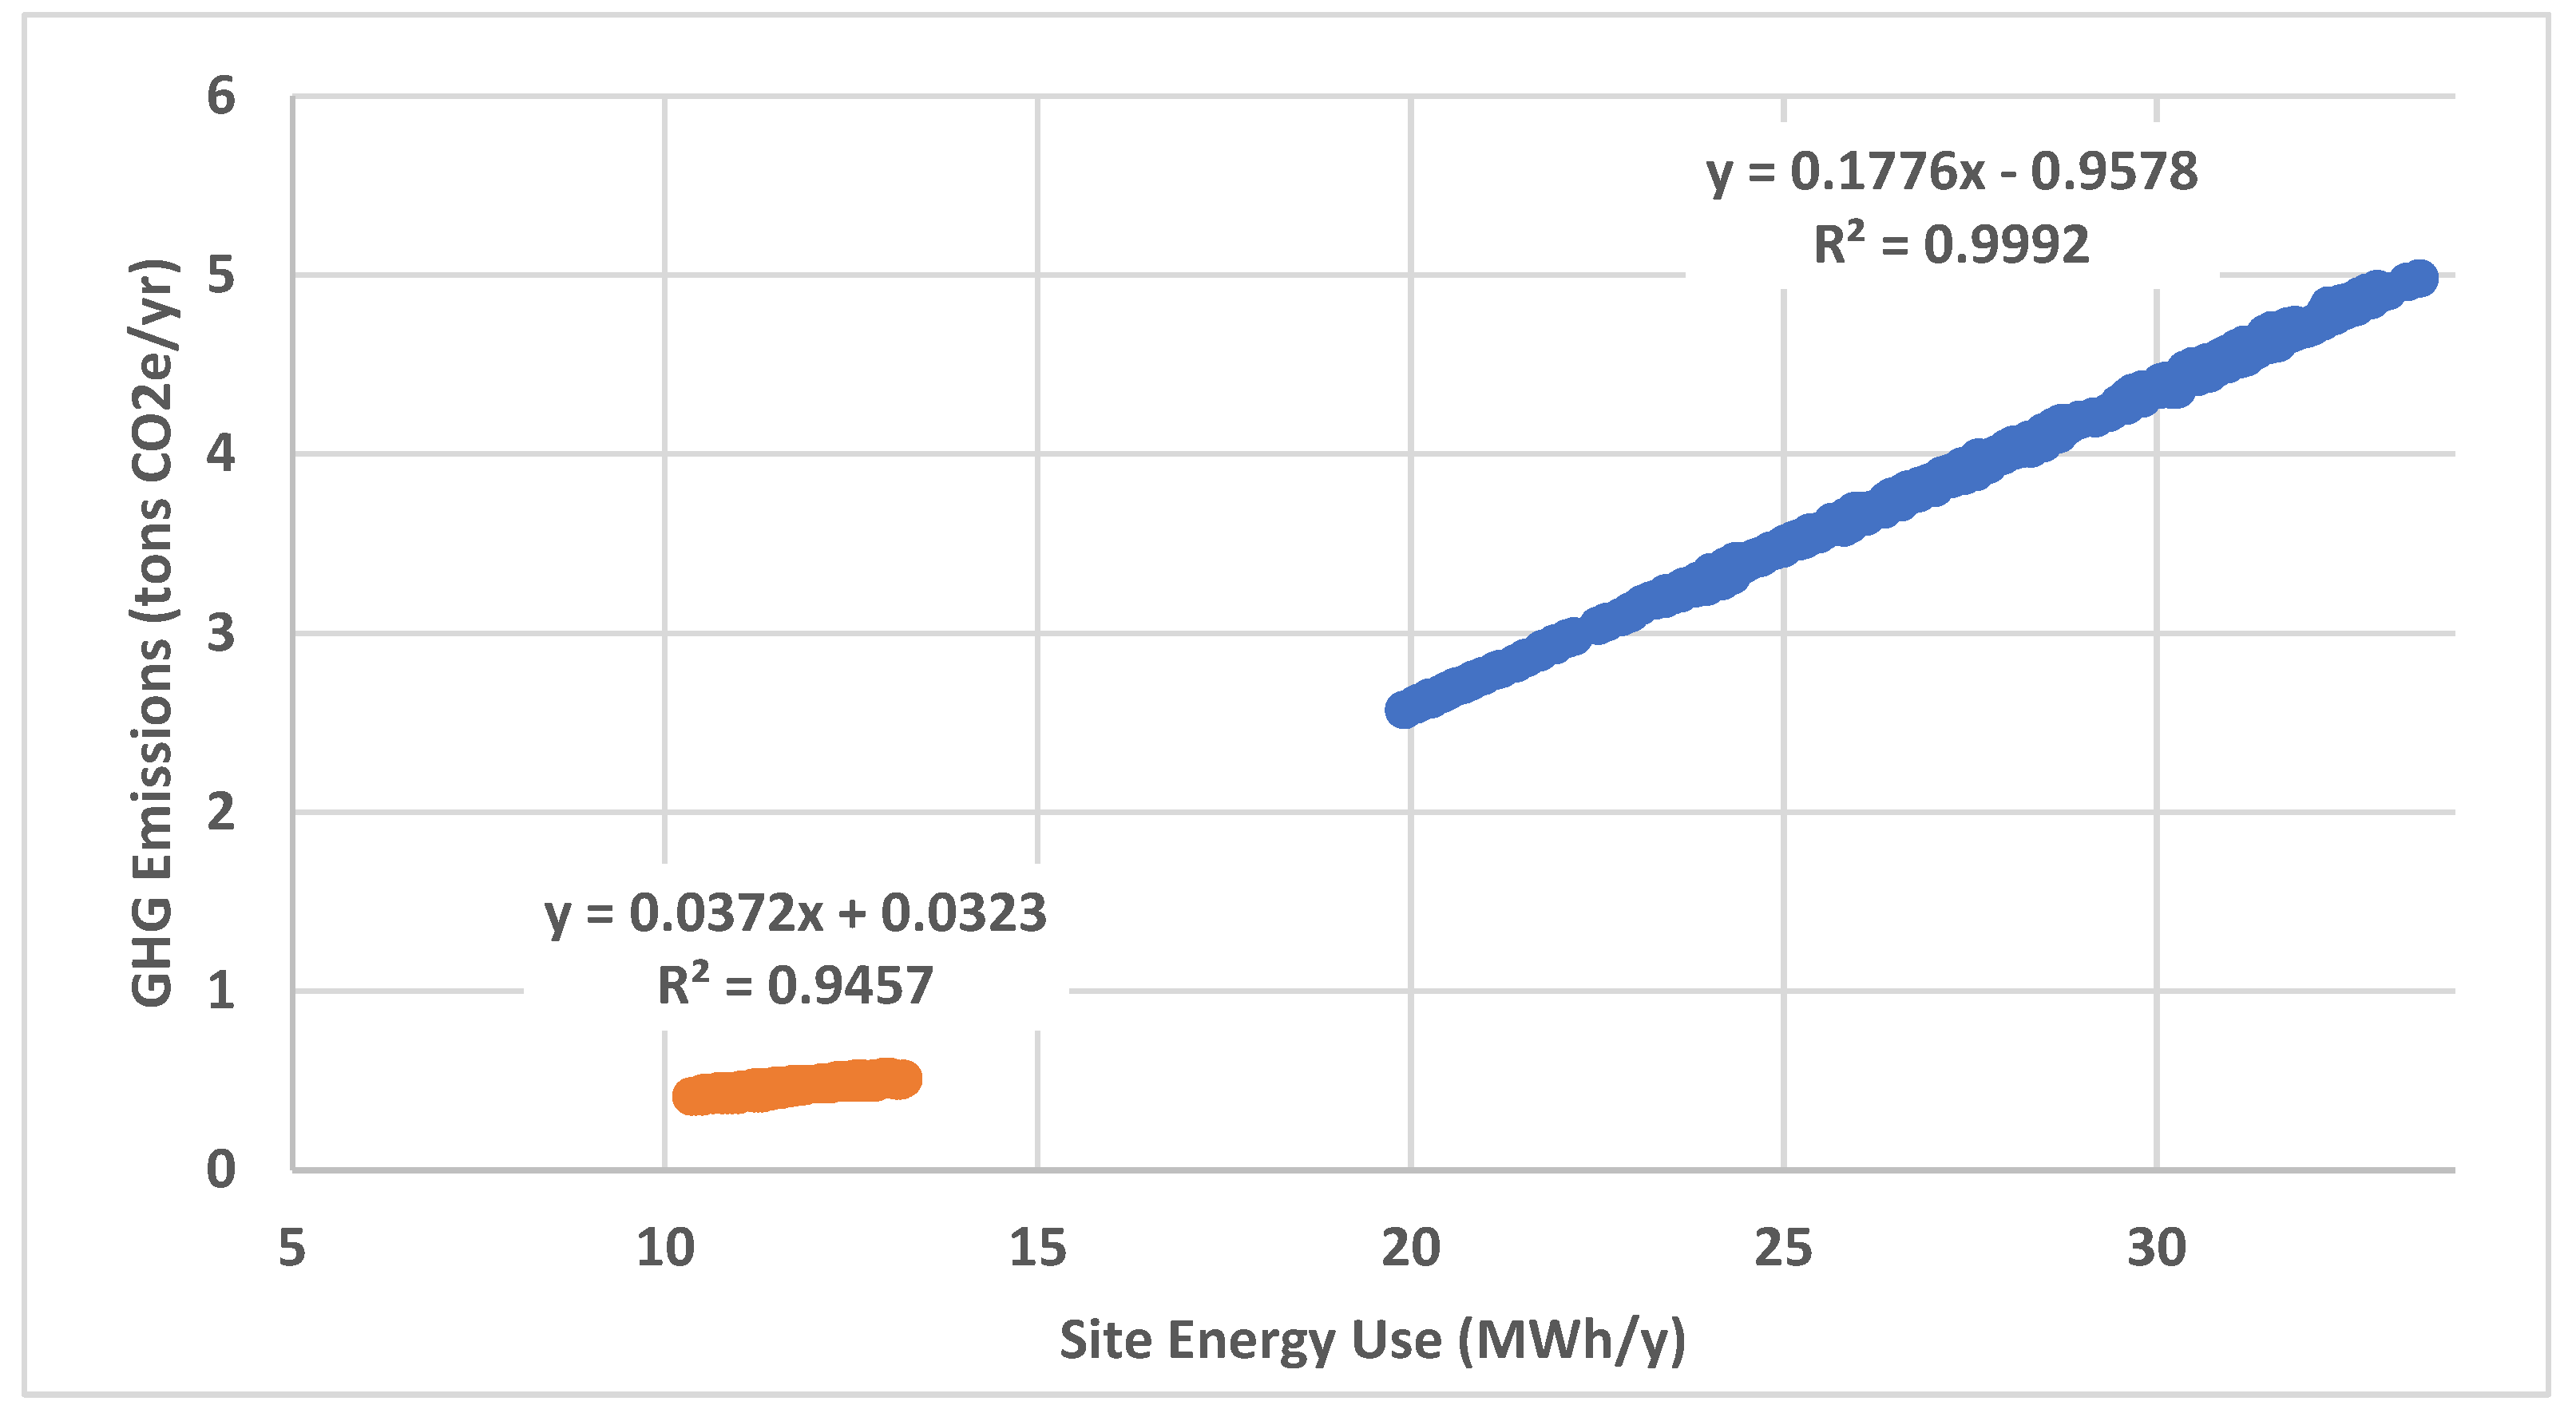
The EUI does not necessarily correlate to energy cost or LCC. Figure 18 plots site energy use against GHG emissions for all building variants simulated by the Gas-TO and MSHP-TO (Toronto) optimizations. In each case, there is very good positive correlation. In the case of the gas model, this is likely due to a combination of the fact that the vast majority of emissions are from natural gas consumption and because for the gas models, electricity consumption varies little for all design variants. In the case of the MSHP, there should be perfect correlation, since there is only one purchased energy type, with a fixed carbon intensity. The imperfect correlation here is simply caused by rounding errors, which are due to BEopt’s insufficiently small GHG-accounting increments for very low-emitting buildings. However, when building designs across thermal system types are compared, the correlation is less clear. To illustrate this, the procedure was repeated for Edmonton, but this time considering all points as a single data series (Figure 19).
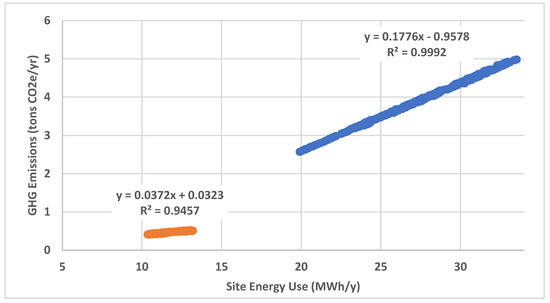
Figure 18.
Energy use versus GHG emissions—Toronto (orange = MSHP design variants, blue = gas design variants).
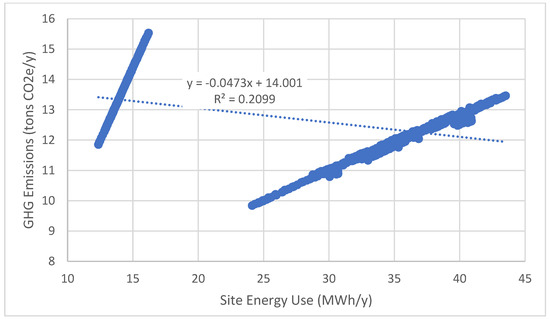
Figure 19.
Energy use versus GHG emissions—Edmonton.
In Figure 19, the left cluster is the MSHP variants and the right is the gas variants. Here, again, there is good correlation within a thermal system type, but very poor correlation across system types. In this location, for these two system types, there is a slightly negative correlation between EUI and GHGI.
6. Conclusions and Recommendations
Optimization studies were conducted to find the best designs for five types of thermal systems plus a NZC model for five major Canadian cities. Based on optimized designs of all-electric thermal systems, the ones that contain MSHP are the most affordable option in every location. In Halifax and Montreal, the optimal design of all-electric types is cheaper than the optimal gas design. In Toronto, ASHP and electric models are also cheaper than gas, and in Edmonton, the GSHP and electric models are more cost-effective. In every location, except Edmonton, the NZC design is cheaper than the gas design. Electric heating systems emit substantially less GHG than gas systems in Vancouver, Toronto, and Montreal. In Edmonton, the gas system is the least-emitting thermal option. Passive and active energy conservation measures, along with rooftop PV, can reduce emissions.
Building energy standards use total building EUI and SHDI as the most common performance metrics to control the use of purchased energy and minimize heating demand. The intent is to reduce costs and emissions, as well as provide consumer and environmental protection. This study found that EUI is strongly correlated to energy cost when only one type of purchased energy is used (e.g., all-electric), but there is reduced correlation for buildings that use two types of purchased energy with different prices. Additionally, when comparing buildings with different thermal system types, such as all-electric and gas-heated buildings, the EUI is no longer a reliable metric. Optimal SHDI is related to the initial cost of the heating system, and further research could be informative. While GHGI is tightly correlated to EUI for buildings that use one or two types of purchased energy, there is no longer a correlation when comparing emissions from buildings with different thermal system types. Building energy standards should mandate heating system type, not just minimum efficiency levels. This will benefit both consumers and the environment. Economic analysis of the impact of heating electrification on the electricity grid are needed.
Author Contributions
A.S.F.: responsible for conceptualizing research ideas, supervising the research project, providing research resources (including funding), and approving the final content draft of the paper; B.W.: responsible for conducting the literature survey, developing the methodology, modelling on BEopt, analyzing data, drawing conclusions, and preparing the preliminary draft of the paper; and R.K.: responsible for analyzing data and the final writing, reviewing, editing, and submitting of the paper. All authors have read and agreed to the published version of the manuscript.
Funding
This research was supported by funding from the Natural Sciences and Engineering Research Council (NSERC) of Canada and the Mitacs Accelerate program of Ontario.
Data Availability Statement
Data are confidential and will be made available upon request.
Acknowledgments
The authors would like to thank the Sustainable Technologies Evaluation Program of the Toronto and Region Conservation Authority for their indirect but valuable support and for sharing their expertise.
Conflicts of Interest
The authors declare that they have no known competing financial interests or personal relationships that could have appeared to influence the work reported in this paper.
Abbreviations
ACH: Air Change per Hour; AFUE: Annual Fuel Utilization Efficiency; ASHP: Air Source Heat Pump; CCI: City Cost Index; COP: Coefficient of Performance; DHW: domestic hot water; DWHR: Drain Water Heat Recovery; EER: Energy Efficiency Ratio; EF: emission factor; EUI: Energy Use Intensity; GSHP: ground source heat pump; GHG: greenhouse gas; GHGI: greenhouse gas intensity; HPWH: Heat Pump Water Heater; HRV: heat recovery ventilator; LCC: life cycle cost; MSHP: mini-split heat pump; NZC: net-zero carbon; NBC: National Building Code; PV: photovoltaic; SEER: Seasonal Energy Efficiency Ratio; SHDI: space heating demand intensity
Appendix A. Reference Model Input Parameters (Toronto)
| Group | Category | Parameter |
| Building | Orientation | North (front of house) |
| Neighbors | Suburban | |
| Walls | Wood Stud * | R-21 fiberglass batt, 2 × 6, 24 in o.c., 1/2” OSB, air gap (R-effective: 17.7) |
| Wall Sheathing | None | |
| Exterior Finish | Vinyl, light coloured | |
| Interzonal Walls | R-21 fiberglass batt, 2 × 6, 24 in o.c. (R-effective: 16.8) | |
| Ceilings/Roofs | Unfinished Attic * | Ceiling R-38 fiberglass, vented (R-effective: 39.6) |
| Roof Material | Asphalt shingles, medium | |
| Radiant Barrier | None | |
| Foundation/Floors | Unfinished Basement * | Whole wall R-18 polyiso (R-effective: 19.3) |
| Interzonal Floor | R-38 fiberglass (R-effective: 28.7) | |
| Carpet | 20% carpet | |
| Thermal Mass | Floor Mass | Wood surface |
| Exterior Wall Mass | 1/2 in. drywall | |
| Partition Wall Mass | 1/2 in. drywall | |
| Ceiling Mass | 1/2 in. drywall | |
| Windows and Doors | Window Areas | Front: 18%, back: 23%, left: 10%, right: 10% |
| Windows * | U-value 0.32, low-e, double, insulated, air, SHGC 0.56 | |
| Interior Shading | Summer = 0.5 unshaded, winter = 0.95 unshaded | |
| Door Area | 3.72 m2 (40 ft2) | |
| Doors | Fiberglass, U-value 0.2 | |
| Eaves | 0.61 m (2′) | |
| Overhangs | None | |
| Airflow | Air Leakage | 2.5 ACH50 |
| Mechanical Ventilation | HRV, SRE 70% | |
| Natural Ventilation | HRV economizer year-round, 24 h, 7 days/wk. | |
| Space Conditioning | Central Air Conditioner | SEER 15, single stage |
| Furnace | Gas, 80% AFUE | |
| Ducts | 7.5% air leakage, uninsulated | |
| Ceiling Fan | Standard efficiency, 50% Coverage | |
| Space Conditioning Schedules | Cooling Set Point | 25 °C (77 °F) |
| Heating Set Point | 21.1 °C (70 °F) | |
| Water Heating | Water Heater | Gas standard, energy factor 0.59 |
| Distribution | Uninsulated, trunk branch, PEX | |
| Lighting | Lighting | 100% LED |
| Appliances and Fixtures | Refrigerator | Top freezer, energy factor = 17.6 |
| Cooking Range | Electric | |
| Dishwasher | 318 Rated kWh | |
| Clothes Washer | EnergyStar | |
| Clothes Dryer | Electric | |
| Hot Water Fixtures | Standard | |
| Miscellaneous | Plug Loads | Standard |
| (grey = optimization options, green = value is reset for optimization); * may vary by location. | ||
Appendix B. Reference Model Parameter Sources
| Design Parameter | Reference Design Source | Notes |
| Geometry | Custom | Detached |
| Basement | Custom | Unfinished |
| Orientation | Custom | South facing |
| Nearby obstructions | Custom | Suburban |
| * Envelope thermal resistance | NBC 9.36 | |
| Exterior finish | BA B10 | |
| Roof material | BA B10 | |
| Window/door area distribution | NBC 9.36 | |
| * Windows | NBC 9.36 | |
| Doors | BA B10 | |
| Thermal mass | BA B10 | |
| Airtightness | NBC 9.36 | |
| HRV/ERV | Custom | SRE 70% |
| Central AC | NBC 9.36 | All locations |
| Furnace | NBC 9.36 | |
| Ducts | Custom | Uninsulated, tight |
| Ceiling fan | Custom | Standard efficiency |
| Water heater | NBC 9.36 | |
| DHW distribution | NBC 9.36 | No insulation |
| DHW consumption (equipment) | BA B10 | |
| Lighting | Custom/BA Protocol | 100% LED |
| Large appliances | BA B10 * | Washer—ENERGY STAR |
| MEL | BA B10 | |
| Control | ||
| Interior shading | Custom | High-latitude, cold climate |
| Natural ventilation | Custom | HRV Economizer |
| Mechanical ventilation | ASHRAE 62.2 | 2013 |
| Conditioning setpoints | NBC 9.36 | |
| DHW setpoint | BA Protocol | |
| DHW consumption (behaviour) | BA B10 | |
| Schedules | BA Protocol | |
| * Reference design varies by location. | ||
References
- Canada Mortgage and Housing Corporation. Housing Information Monthly. Publications and Reports 2018. Available online: https://www.cmhc-schl.gc.ca/professionals/housing-markets-data-and-research/market-reports/housing-market (accessed on 11 July 2016).
- Canada Mortgage and Housing Corporation. CMHC. New Housing Construction Activity. January 2018. Available online: https://www03.cmhc-schl.gc.ca/hmip-pimh/en#Profile/1/1/Canada (accessed on 11 July 2016).
- Greenhouse Gas Sources and Sinks in Canada. National Inventory Report 1990–2016: Environment and Climate Change Canada. Available online: https://www.canada.ca/en/environment-climate-change/services/climate-change/greenhouse-gas-emissions/sources-sinks-executive-summary-2023.html (accessed on 29 April 2024).
- Dembo, A.; Fung, A.S. Review and economic feasibility study of the currently practiced new housing constructions in Ontario. ASHRAE Trans. 2012, 118, 409–426. [Google Scholar]
- Dembo, A.; Khaddad, F.; Fung, A. Least-cost upgrade solutions to achieve improved energy efficiency standards for residential new housing in Canada. ASHRAE Trans. 2013, 119, 1–17. Available online: https://www.ashrae.org/file%20library/technical%20resources/ashrae%20transactions%20and%20conferences%20programs/2013-dallas-transactions-toc.pdf (accessed on 11 July 2016).
- Omrany, H.; Chang, R.; Soebarto, V.; Zhang, Y.; Ghaffarianhoseini, A.; Zuo, J. A bibliometric review of net zero energy building research 1995–2022. Energy Build. 2022, 262, 111996. [Google Scholar] [CrossRef]
- Kilkis, B. Net-zero buildings, what are they and what they should be? Energy 2022, 256, 124442. [Google Scholar] [CrossRef]
- Architecture 2030. New Buildings Institute, Rocky Mountain Institute. Zero Net Carbon (ZNC): A Definition. Available online: https://www.architecture2030.org/wp-content/uploads/2018/10/ZNC_Building_Definition.pdf (accessed on 11 July 2016).
- ASHRAE. Ventilation and Acceptable Indoor Air Quality in Low-Rise Residential Buildings 2013. American Society of Heating, Refrigeration, and Air-Conditioning Engineers. Available online: https://www.ashrae.org/technical-resources/standards-and-guidelines/read-only-versions-of-ashrae-standards (accessed on 11 July 2016).
- Athienitis, A.K.; O’Brien, W. Modeling, Design, and Optimization of Net-Zero Energy Buildings; Wilhelm Ernst and Sohn, Wiley: Berlin, Germany, 2015; Available online: https://www.ernst-und-sohn.de/en/modeling-design-and-optimization-of-net-zero-energy-buildings (accessed on 11 July 2016).
- Cold Climate Air Source Heat Pump. Northeast Energy Efficiency Partnerships. 2018. Available online: https://neep.org/initiatives/high-efficiency-products/emerging-technologies/ashp/cold-climate-air-source-heat-pump (accessed on 1 January 2018).
- National Renewable Energy Laboratory. 2014 Building America House Simulation Protocols. U.S. Department of Energy, Office of Energy Efficiency & Renewable Energy, National Renewable Energy Laboratory, 2014. Available online: https://www.nrel.gov/docs/fy14osti/60988.pdf (accessed on 11 February 2016).
- National Renewable Energy Laboratory. BEopt 2016. Available online: https://beopt.nrel.gov/home (accessed on 11 February 2016).
- O’Brien, W.; Kesik, T.; Athienitis, A. Solar Design Days: A Tool for Passive Solar House Design. ASHRAE Trans. 2014, 120, 101. Available online: https://carleton.ca/hbilab/wp-content/uploads/Solar-Design-Days.pdf (accessed on 11 February 2016).
- O’Brien, W.; Athienitis, A.; Kesik, T. Parametric Analysis to support the integrated design and performance modeling of net-zero energy houses. ASHRAE Trans. 2011, 117, 1–12. Available online: https://academic.daniels.utoronto.ca/pbs/wp-content/uploads/sites/13/2023/04/Parametric-analysis-to-support-the-integrated-design-and-performance-modeling-of-net-zero-energy-houses.pdf (accessed on 11 February 2016).
- Bucking, S.; Zmeureanu, R.; Athienitis, A. A methodology for identifying the influence of design variations on building energy performance. J. Build. Perform. Simul. 2013, 7, 411–426. [Google Scholar] [CrossRef]
- Bucking, S.; Athienitis, A.; Zmeureanu, Z. Multi-Objective Optimal Design of a Near Net Zero Energy Solar House. ASHRAE Trans. 2014, 120, 224–235. Available online: https://www.researchgate.net/publication/285964004_Multi-objective_optimal_design_of_a_near_net_zero_energy_solar_house (accessed on 11 February 2016).
- Safa, A.A.; Fung, A.S.; Kumar, R. Comparative thermal performances of a ground source heat pump and a variable capacity air source heat pump system for sustainable houses. Appl. Therm. Eng. 2015, 81, 279–287. [Google Scholar] [CrossRef]
- Melo, F.C.; da Graça, G.C.; Panão, M.J.N.O. A review of annual, monthly, and hourly electricity use in buildings. Energy Build. 2023, 293, 113201. [Google Scholar] [CrossRef]
- National Building Code of Canada, Volume I. Canadian Commission on Building and Fire Codes. National Research Council, 2015. Available online: https://nrc.canada.ca/en/certifications-evaluations-standards/codes-canada/codes-canada-publications/national-building-code-canada-2015 (accessed on 11 July 2019).
- National Building Code of Canada, Volume II, Part 9. Canadian Commission on Building and Fire Codes. National Research Council, 2015. Available online: https://nrc.canada.ca/en/certifications-evaluations-standards/codes-canada/codes-canada-publications/national-building-code-canada-2015 (accessed on 11 July 2019).
- Wilbur, B. Thermal System-Specific and Net-Zero Carbon Least-Cost Design of New Houses in Canadian Cold Climates. Master’s Thesis, Ryerson University, Toronto, ON, Canada, 2018. Available online: https://rshare.library.torontomu.ca/articles/thesis/Thermal_system-specific_and_net-zero_carbon_least-cost_design_of_new_houses_in_Canadian_cold_climates/14657844 (accessed on 29 April 2024).
- National Research Council, Twin Houses. Canadian Centre for Housing Technology. Available online: http://www.ccht-cctr.gc.ca/eng/facilities/twin_houses.html (accessed on 11 February 2016).
- Portfolio Manager Greenhouse Gas Emissions Technical Reference 2017. Energy Star. Available online: https://www.energystar.gov/buildings/tools-and-resources/portfolio-manager-technical-reference-greenhouse-gas-emissions (accessed on 29 April 2024).
- Gordian. City Cost Indexes-How to Use the City Cost Indexes. Available online: www.rsmeans.com/media/wysiwyg/product_pdf/2024-BCCD-TOCs.pdf (accessed on 11 February 2016).
- Gordian. MasterFormat City Cost Index-Year 2017 Base. Available online: https://www.rsmeans.com/products/online (accessed on 10 September 2024).
- Hydro Quebec. Comparison of Electricity Prices in Major North American Cities 2017. Hydro Quebec. Available online: www.hydroquebec.com/data/documents-donnees/pdf/comparison-electricity-prices-2017.pdf (accessed on 22 November 2017).
- Ontario Energy Board. Historical Natural Gas Rates. Available online: https://www.oeb.ca/rates-and-your-bill/natural-gas-rates/historical-natural-gas-rates (accessed on 22 November 2017).
- Available online: https://remdb.nrel.gov/ (accessed on 29 April 2024).
- Canada. How Much You Need for a Downpayment. Government of Canada. Available online: https://www.canada.ca/en/financial-consumer-agency/services/mortgages/down-payment.html (accessed on 22 November 2017).
- EERE. Methodology for Evaluating Cost-Effectiveness of Residential Energy Code Changes. Office of Energy Efficiency and Renewable Energy, Building Technologies Program. U.S. Department of Energy. Available online: www.energycodes.gov/sites/default/files/2021-07/residential_methodology_2015.pdf (accessed on 22 November 2017).
- PHIUS. PHIUS+ Project Certification. 2015. Retrieved April 2016. Available online: https://www.phius.org/certifications (accessed on 10 September 2024).


Disclaimer/Publisher’s Note: The statements, opinions and data contained in all publications are solely those of the individual author(s) and contributor(s) and not of MDPI and/or the editor(s). MDPI and/or the editor(s) disclaim responsibility for any injury to people or property resulting from any ideas, methods, instructions or products referred to in the content. |
© 2024 by the authors. Licensee MDPI, Basel, Switzerland. This article is an open access article distributed under the terms and conditions of the Creative Commons Attribution (CC BY) license (https://creativecommons.org/licenses/by/4.0/).