Article

Sensitivity Analysis on Influential Factors of Strain Rockburst in Deep Tunnel

1
School of Civil Engineering, Henan Polytechnic University, Jiaozuo 454003, China
2
Key Laboratory of Ministry of Education on Safe Mining of Deep Metal Mines, Northeastern University, Shenyang 110819, China
*
Author to whom correspondence should be addressed.
Buildings 2024, 14(9), 2886; https://doi.org/10.3390/buildings14092886
Submission received: 25 August 2024 / Revised: 10 September 2024 / Accepted: 11 September 2024 / Published: 12 September 2024

Abstract

:
Strain rockburst is a severe failure phenomenon caused by the release of elastic strain energy in intact rocks under high-stress conditions. They frequently occur in deep tunnels, causing significant economic losses, casualties, and construction delays. Understanding the factors influencing this disaster is of significance for tunnel construction. This paper first proposes a novel three-dimensional (3D) discrete element numerical analysis method for rockburst numerical analysis considering the full stress state energy based on the bonded block model and the mechanics, brittleness, integrity, and energy storage of the surrounding rock. This numerical method is first validated via laboratory tests and engineering-scale applications and then is applied to study the effects of compressive and tensile strengths of rock mass, tunnel depth, and lateral pressure coefficient on strain rockburst. Meanwhile, sensitivity analyses of these influencing factors are conducted using numerical results and systematic analysis methods, and the influence degree of each factor on the rockburst tendency is explored and ranked. The results reveal that laboratory tests and actual engineering conditions are consistent with numerical simulation results, which validates the rationality and applicability of the novel rockburst analysis method proposed in this paper. With the increase in compressive strength, the stress concentration degree, energy accumulation level, maximum stress difference, and maximum elastic strain energy within the rock mass all increase, leading to a stronger rockburst tendency. Tunnel depth and the lateral stress coefficient are positively correlated with rockburst tendency. As the lateral pressure coefficient and tunnel depth increase, rockburst tendency exponentially increases, while the maximum stress difference and maximum elastic strain energy within the rock mass also increase. The influence degree of each factor is ranked from highest to lowest as follows: tensile strength, lateral pressure coefficient, compressive strength, and tunnel depth. The research results provide theoretical support and technical guidance for the effective prediction, prevention, and control of rock burst disasters in deep tunnels.

1. Introduction

With the sustained and rapid development of China’s national economy, the demand for transportation infrastructure, water conservancy and hydropower engineering construction, and urban underground space development has sharply increased. The focus of major infrastructure construction has clearly shifted to areas with extremely complex terrain and geological conditions [1]. As an important component of the above-mentioned projects, the construction of tens of thousands of kilometers of transportation tunnels is currently underway or is about to begin, while also continuously developing towards the direction of long tunnel lines, large burial depths, and high stress. The risk of geological disasters has also increased accordingly. Among them, rockburst disaster is a common and dangerous geological hazard phenomenon in tunnel construction, especially in complex geological conditions such as high-stress zones and soft–hard rock boundary zones, where the probability of rockburst occurrence is significantly increased [2]. Once a rockburst disaster occurs, it can cause serious economic losses, casualties, and project delays [3,4,5]. A very strong rockburst in the drainage tunnel of Jinping II Hydropower Station caused a serious accident in which seven people were killed and one person was injured, resulting in the burial of TBM equipment [6]. China’s longest dual-line railway tunnel under construction in the Sichuan–Tibet Railway, the Sedera Mountain Tunnel, has a strong rockburst section of 3.715 km and a moderate rockburst section of 11.770 km, accounting for 31.00% of the whole tunnel, and a slight rockburst section of 4.855 km [7]. Pakistan Neelum-Jhelum Hydropower Station’s deep buried tunnel burst resulted in a very strong rock explosion, causing serious damage to the TBM, which led to a delay of nearly 6 months in the tunnel’s schedule [8]. By deeply analyzing the influencing factors, surrounding rock response characteristics, and energy release laws of rockburst, it is possible to better predict the occurrence of rockburst and develop effective prevention and response strategies. This not only helps to reduce the occurrence of rockburst disasters but also provides a scientific basis for tunnel construction under complex geological conditions, which is of great significance for ensuring construction safety and project progress.
Early research on the occurrence mechanisms of rockburst began with engineering phenomena, where numerous field works have been performed utilizing methods such as microseismic monitoring, acoustic emission monitoring, microgravity methods, acoustic wave detection, and infrared thermography [9,10,11,12]. These findings provide significant assistance in early rockburst research. However, field conditions do not allow for repeated experiments and pose considerable danger. As the understanding of rockburst continuously deepens, experimental methods and instruments have continuously updated and developed. Many scholars have explored the formation mechanisms and influencing factors of rockburst via laboratory experiments [13,14,15]. Laboratory experiments are difficult and time-consuming to operate, do not allow variable-condition experiments to be carried out in as large a volume as desired, and do not allow access to full-field multivariate information. Currently, with the maturity of the numerical simulation method, more and more scholars adopt it to simulate the occurrence of rockburst. Numerical simulation is divided into the finite element method and discrete element method, of which the discrete element method is particularly suitable for dealing with large deformation discontinuity problems of jointed rock bodies and models, and can effectively simulate discontinuous phenomena such as cracking and separation of the medium, which is usually adopted by scholars to simulate the ejection characteristics of rockburst [16,17,18,19]. Sun et al. [20] studied the whole process and energy evolution characteristics of rockburst under true triaxial single-sided unloading conditions based on 3D discrete element theory and polycrystalline modeling technology and divided the evolution process of the elastic strain energy into four stages. Xue et al. [21] used FLAC to study the rockburst mechanism of coal pillars and proposed an energy density evaluation standard for rockburst risk assessment. Hu et al. [22] studied the characteristics and mechanisms of rockburst induced by tangential weak dynamic disturbances based on 3D discrete element simulation and concluded that tangential weak dynamic disturbances significantly increased the cracking and damage degree of rocks and their dissipative energy. Yang et al. [23] provided a new numerical simulation method that considers the high-stress hard rock mechanical model, rockburst discrimination index, excavation method, and new boundary conditions during rockburst for the rockburst process and verified the method’s rationality. Kong et al. [24] proposed a dynamic calculation method for fault slip under mining action based on FLAC 3D numerical simulation. They compared the energy release modes of fault slip through hanging wall fault mining and footwall fault mining and revealed the dynamic response characteristics of coal–rock bodies under dynamic load disturbances caused by fault slip. Ma et al. [25] developed a two-dimensional numerical simulation method combining dynamic and static forces to simulate the whole process of rockburst, analyzed in detail the effect of faults on rockburst during tunnel excavation, and classified the state of the surrounding rock after rockburst occurs. The above research results based on numerical simulation methods reveal the evolution of the surrounding rock fissure field, stress field, energy field, and rockburst inclination indicators in the process of rockburst incubation, which has greatly improved the understanding of the formation conditions and factors affecting rockburst. However, previous numerical simulation studies of rockburst did not fully analyze the factors affecting rockburst and their sensitivity, and the rockburst inclination criterion cannot cover all the stress states of the surrounding rock, resulting in a certain degree of bias in the numerical simulation results of rockburst inclination.
In view of this, this paper firstly proposes a new BBM-3DEC coupled rock explosion numerical analysis method considering the full stress state energy of surrounding rock based on the multi-parameter rockburst energy propensity index, bonded block model, and 3D discrete element platform and verifies the reliability and applicability of this rock explosion numerical analysis method from the laboratory test and field engineering via two scales. Then, the new rockburst numerical analysis method proposed in this paper was used, as well as a systematic study of different peripheral rock compressive strength, tensile strength, tunnel depth, lateral pressure coefficient on the tunnel peripheral stress, energy and rockburst propensity indicators, and other multivariate information; and finally, with the help of grey correlation analysis, the sensitivity of the factors affecting the strain rockburst of deep-buried tunnels from the point of view of the rockburst propensity indicators was analyzed to detect the influence of various factors on the rockburst propensity and give the corresponding ranking. The results of the study can provide a basis for deep tunnel strain rock explosion prediction, warning, prevention, and control.

2. A Numerical Analysis Method for Rockburst Considering the Full Stress State Energy

2.1. BBM-3DEC Coupled Numerical Simulation Method for Rockburst Based on Energy Principle

Strain rockburst are dynamic destabilization phenomena induced by the explosive energy release of high-energy rock masses due to excavation unloading. The strain rockburst inoculation process involves the evolution of energy within the rock mass, where the input, accumulation, transformation, and release of energy are necessary conditions for rockburst occurrence. Energy theory helps to better understand the occurrence mechanism of strain rockburst. Initially, the rock mass is under triaxial compression due to in situ geostress. As tunnel excavation progresses, the stress state of the rock mass may change from triaxial compression to biaxial compression or uniaxial tension. Based on the overall failure criterion proposed [26], the ratio of the releasable strain energy Ue accumulated within the rock to the critical surface energy U0 required for rock failure under tensile and compressive stress states can be obtained. The expression is as follows [27]:
{ U e U 0 = ( σ 1 σ 3 ) 2 E 0 U e σ c 3 ( σ 3 0 ) U e U 0 = σ 3 2 E 0 U e σ t 3 ( σ 3 < 0 )  
Considering the effects of mechanics, brittleness, integrity, and energy storage factors on strain rockburst [28], a multi-parameter strain rockburst tendency (REC) suitable for deep underground engineering in different stress states is proposed.
R E C = K v ( σ θ σ c σ c σ t ) U e U 0 = { K v ( σ θ σ c σ c σ t ) ( σ 1 σ 3 ) 2 E 0 U e σ c 3 ( σ 3 0 ) K v ( σ θ σ c σ c σ t ) σ 3 2 E 0 U e σ t 3 ( σ 3 < 0 )
where Kv, σθ/σc, σc/σt, and Ue/U0 are the integrity factor index, mechanics factor index, brittleness factor index, and energy storage factor index of the rock mass, respectively.
Based on the rockburst criterion boundary value division principle provided in the literature [29], and considering the low probability that integrity, mechanics, brittleness, and energy storage factor indices simultaneously reach the maximum values, substituting into Equation (2), the bounding indicators for the REC values of the strain rockburst criterion were obtained and taken as 0.28, 0.75, and 3.87. Therefore, the strain rockburst criterion and intensity classification are as follows:
R E C = { < 0.28 None   rockburst 0.28 ~ 0.75 Slight   rockburst 0.75 ~ 3.87 Moderate   rockburst > 3.87 Intense   rockburst
On the basis of the above criteria, to accurately describe fracture information and strain rockburst hazard characteristics, the numerical simulation platform Rhino-Griddle-3DEC is used. The REC is coded using the built-in FISH language in 3DEC, and a numerical analysis method for strain rockburst that integrates the BBM method and REC is proposed, as illustrated in Figure 1. A rock mass block model is first established in 3DEC; then, the model is imported into Rhino 6.0 software. The Gsurf command of the Griddle plug-in automatically generates the interactive meshes. The selected surface meshes can be re-divided into required block sizes and types and filled with tetrahedral blocks to generate a file format suitable for 3DEC. Using the “Rhino-Griddle-3DEC” numerical modeling method, the complete BBM-3DEC model file is output and directly imported into the 3DEC.
The BBM-3DEC coupled numerical simulation method overcomes the shortcomings of traditional direct modeling or FISH modeling. This method can simulate the interaction between the initiation and propagation of fractures and the blocks. Under external forces, discrete element blocks can displace, rotate, and even completely separate, as well as accurately identify new contacts generated in numerical simulations. The block mechanical movement characteristics of each element can better simulate rock failure characteristics and more realistically reflect the mechanical response of discrete media under dynamic and static loads during a rockburst. The rock elements imported into 3DEC are rigid blocks. Considering that rock materials in actual engineering are mostly deformable blocks (elastic–plastic–brittle), the generate edge command in the numerical platform is used to further divide the imported blocks into elements, so as to meet the deformation characteristics of rock materials under loading and unloading mechanical environments as well as before and after tunnel excavation. This achieves visual analysis of the multi-dimensional information response of rock mass as well as rockburst intensity and its occurrence range under a 3D stress state.

2.2. Application and Validation of the Proposed Numerical Simulation Method

2.2.1. Application and Validation at Test Scale

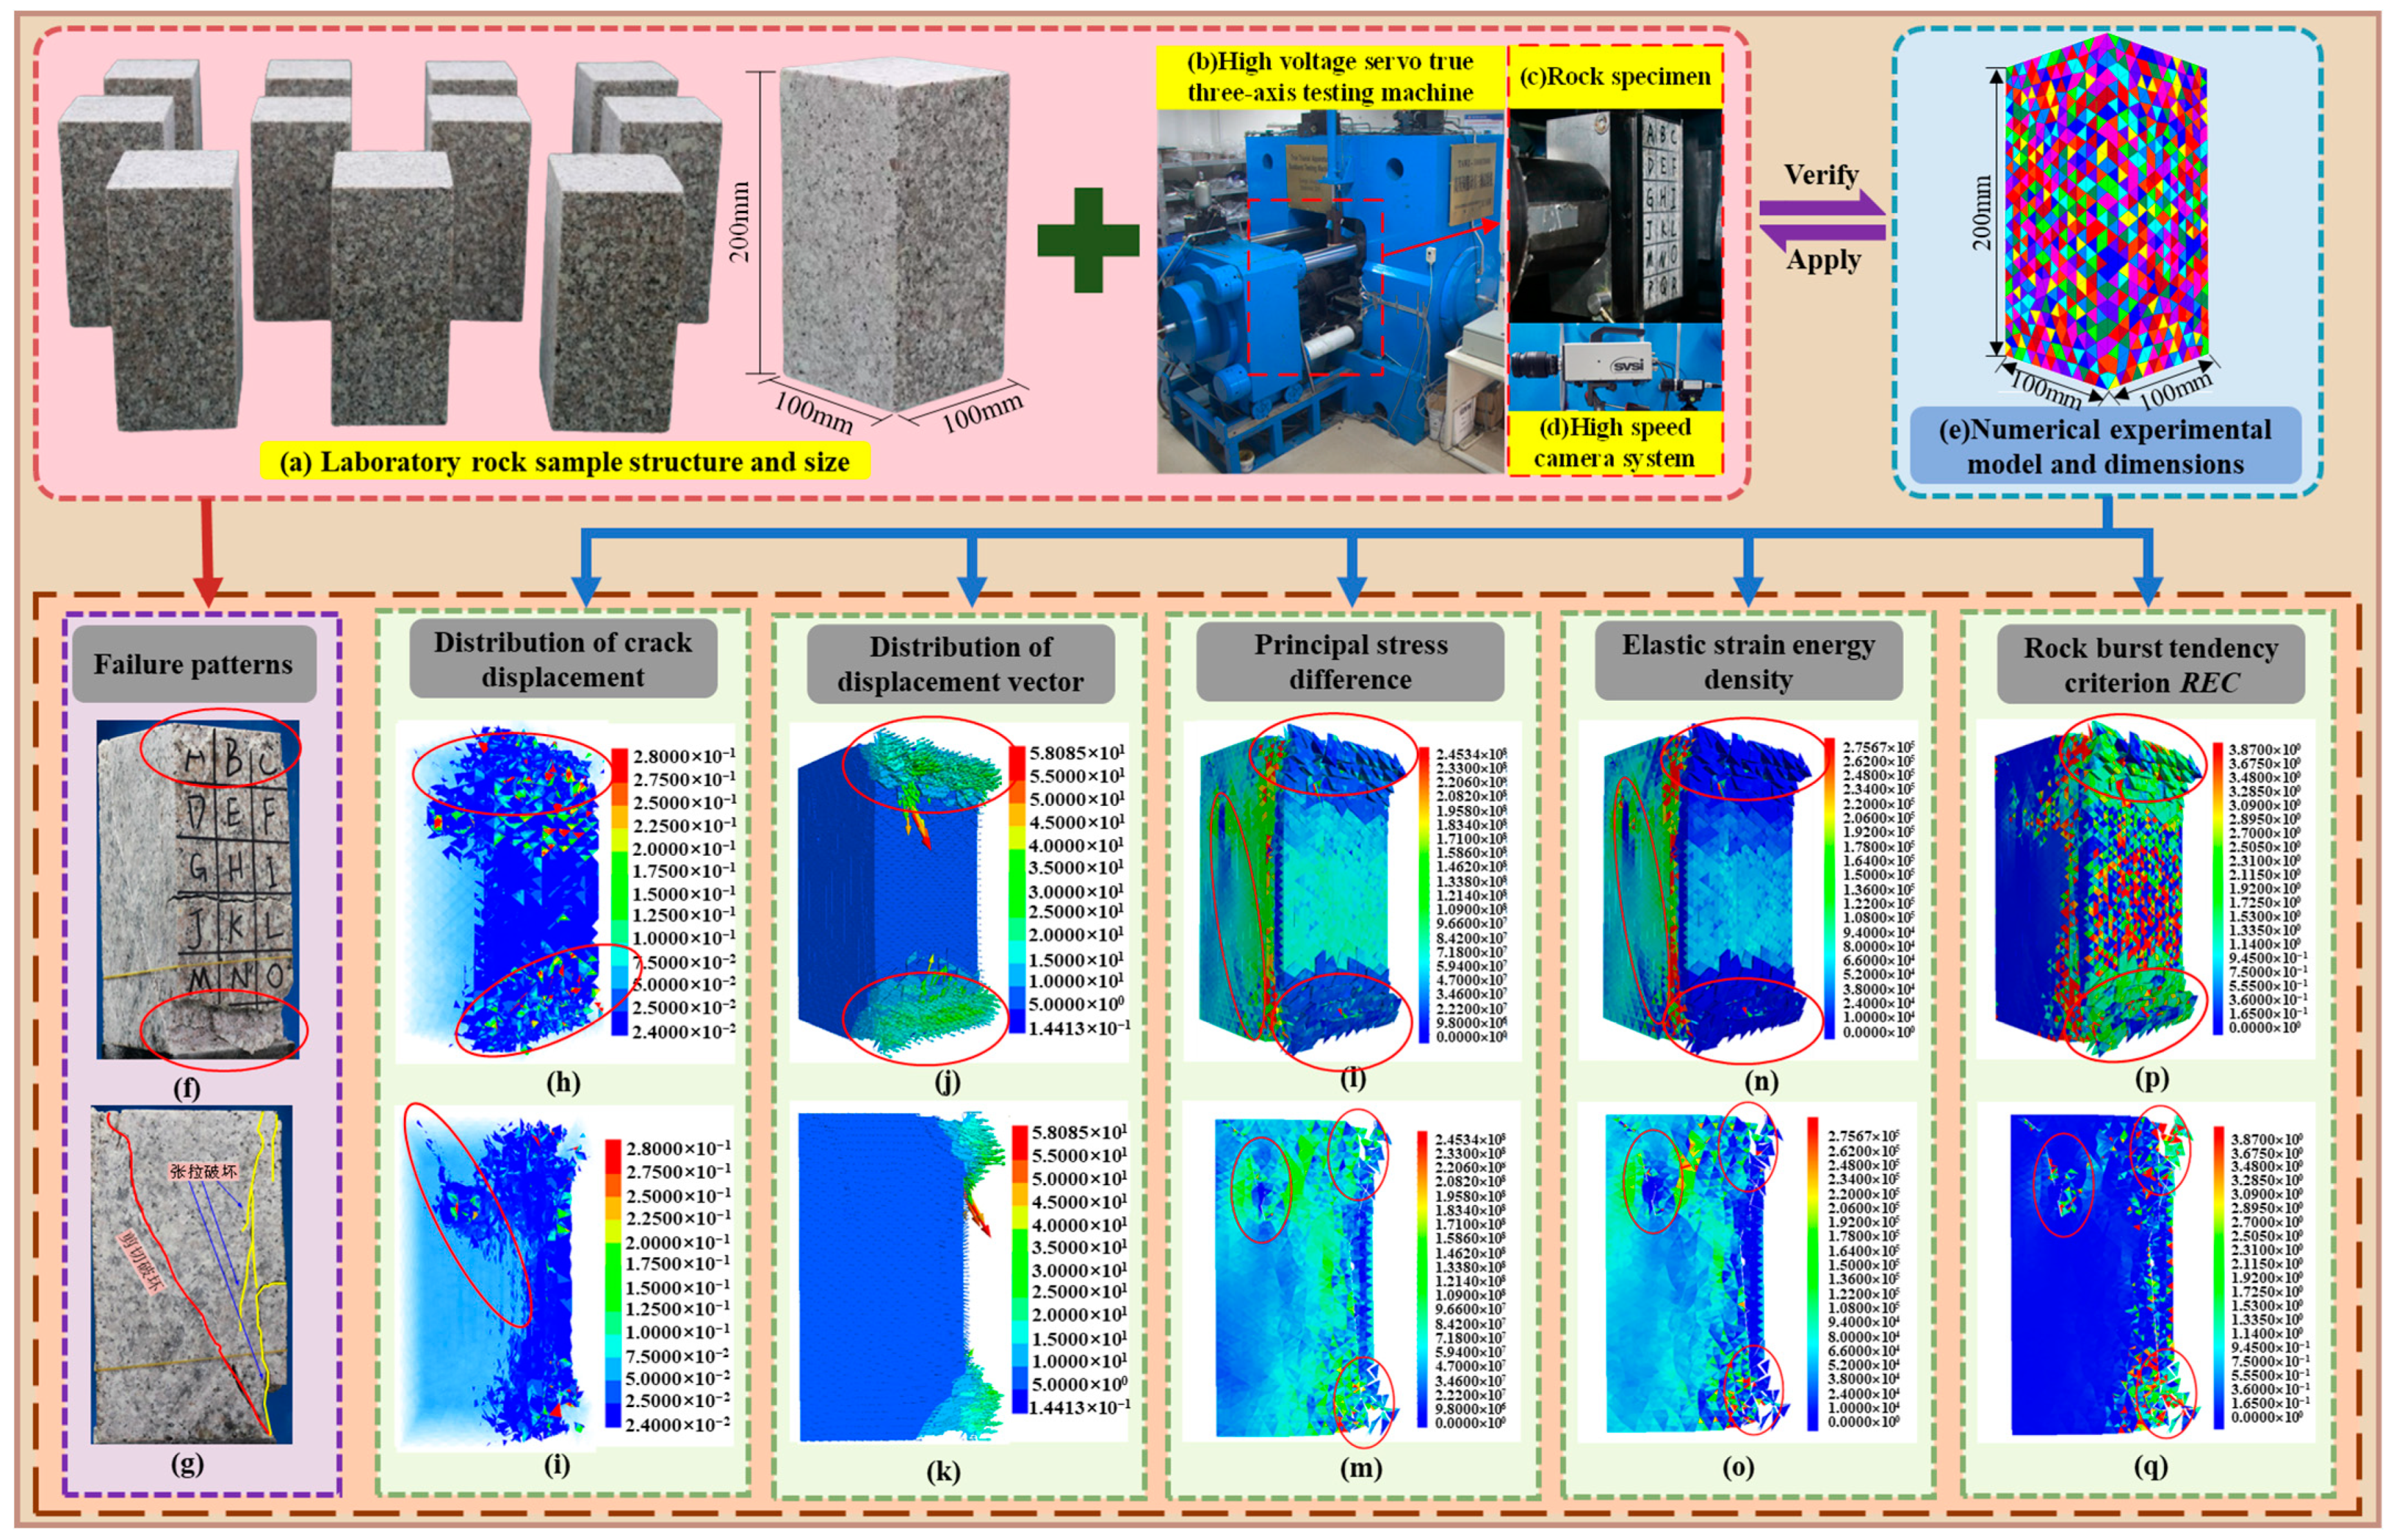
Granite specimens were used in this test, and the rock samples were taken from Wenshang County, Jining City, Shandong Province. In order to reduce the non-homogeneity and discrete nature of the material on the test results, all the specimens were taken from the same rock. We prepared rectangular prismatic specimens with a size of 100 mm × 100 mm × 200 mm. The rock samples and the experimental equipment are shown in Figure 2a,b. The test loading path is divided into three stages: the stress loading stage, the initial stress stage, and the stress perturbation stage. The stress loading stage applies the stress values of 75 MPa, 55 MPa, and 40 MPa to the rock samples in each principal stress direction, namely σ1, σ2, and σ3 in turn, and the initial stress field is formed at this time by keeping the current stress state stable for about 6–8 min; then, the stress perturbation stage is entered in which the excavation is simulated by unloading and reducing σ3(b) on one face of the rock sample to a fixed value of 0 MPa/s to simulate excavation unloading by reducing σ3(a) on the opposite face of the unloading to the fixed value at the same time. The unloading counterpart σ3(a) is reduced to reach a fixed value to simulate the stress reduction after the excavation unloading and continues to increase σ1 continuously with 0.5 MPa/s until the rock sample is damaged.
The numerical method establishes a numerical model for granite, as depicted in Figure 2e. Assuming that the sample material is homogeneous, a cube sample with dimensions of 100 mm × 100 mm × 200 mm is formed by stacking tetrahedrons of varying sizes. The mechanical parameters of the rock sample and contact surfaces are calibrated through laboratory test results. Stress is applied to the model boundaries according to the loading path of the laboratory test, and the equilibrium computation is conducted after the initial stress state is applied. Then, the BOUNDARY FREE command is used to achieve single-sided unloading on the model boundary, and BOUNDARY XVEL (YVEL, ZVEL) = 0 is adopted to keep other boundary displacements unchanged. Finally, the stress at the right boundary of the model is removed, and vertical stress is gradually increased until the sample fails.
Figure 2f–q compare the numerical simulation results and the experimental results of the rock sample failure modes under true triaxial single-sided unloading. Observations in Figure 2f,g show that the splitting cracks governed by tensile failure are generated near the unloading surface, while the penetrating cracks dominated by shear failure are found far away from the unloading surface. A notable synergistic effect is observed at the upper and lower ends (A–C and P–R) of the unloading surface, where the interaction between tensile splitting and shear cracking leads to significant damage with deep failure zones. This synergy intensifies the damage, as the tensile cracks propagate and trigger secondary shear failure, particularly in the middle region (J–L) of the unloading surface, where noticeable plate cracking occurs due to the extension and penetration of these tensile cracks. Conversely, antagonistic effects are observed where tensile failure helps dissipate stress, limiting the growth of shear cracks in certain areas. This is especially evident in the crack distribution and displacement characteristics from the numerical simulation results in Figure 2h–k, which reveal that most cracks are concentrated on the unloading surface, with the most significant crack extension at the upper and lower ends. Noticeable oblique shear cracks appear within the rock mass, and rock block ejection occurs at the upper and lower ends of the unloading surface, accompanied by significant displacement. The interaction between the tensile and shear failure modes in these regions highlights how tensile failure can sometimes inhibit the full development of shear cracks, mitigating the overall extent of damage. The numerical simulations closely replicate the experimental failure characteristics, accurately reflecting the zonal failure patterns associated with rockburst. Oblique shear cracks generated by shear action inside the rock mass, combined with splitting cracks induced by tensile action at the upper and lower ends of the unloading surface, demonstrate the complex interplay of these mechanisms. This numerical method effectively captures both the synergistic enhancement of failure at critical points and the antagonistic reduction in damage in other areas, providing a comprehensive reflection of the microcrack extension and penetration processes.
Further secondary development of the numerical program using the FISH language yields nephograms of the principal stress difference, elastic strain energy, and REC distribution during the rock failure process under true triaxial single-sided unloading stress path, as presented in Figure 2l–q. Figure 2l,m demonstrate that significant rock block ejection occurs at the upper and lower ends of the unloading surface and that stress concentrations on the rock surface reduce and are distributed inside the rock mass. The peak principal stress difference reaches 245 MPa, while the stress difference in the middle of the unloading surface ranges from 71.8 to 84.2 MPa. The peak elastic strain energy density reaches 0.27 MJ/m3, indicating that the rock mass on the unloading surface fails, with a sudden release of surface energy. The higher energy values are mainly accumulated between internal shear and tensile cracks, and the elastic energy can drive further crack extension. As revealed in Figure 2p,q, according to the distribution of REC boundary values, significant rockburst phenomena happen on the rock sample surface after single-sided unloading, the highest rockburst intensity occurs at the upper and lower ends of the unloading surface, and damages are prone to occur near shear cracks within the rock mass. The simulation results of the corresponding central section of the rock sample reveal that the rock mass elements at the ends of the unloading surface fail, and tensile cracks appear nearly parallel to the unloading surface. At this moment, no significant stress concentration or energy accumulation is observed near the cracks. However, significant energy accumulation near oblique cracks within the rock mass drives further crack extension, thus leading to shear failure. The stress and energy distribution characteristics are consistent with the experimental results.

2.2.2. Application and Validation at Engineering Scale

The Sangzhuling Tunnel is a key control tunnel of the Lalin section of the Sichuan-Tibet Railway. It has a maximum depth of approximately 1347 m and is a typical deep, long tunnel with large sections. In the D1K173+650-DK190+105 section, the tunnel depth ranges from about 300 to 1500 m, and both the maximum and minimum depths are located within this section. The geological environment is complex and variable. The longitudinal profile of the tunnel is depicted in Figure 3a. During excavation, large-scale, multi-point minor to moderate rockburst occurred, with severe rockburst in some areas. A typical strain rockburst at a depth of 1218 m in this section is selected for study. Considering the geological conditions of the rock mass at the Sangzhuling Tunnel site and to eliminate boundary effects from the simulation, a numerical model of 50 m × 10 m × 50 m centered on the tunnel axis is established. To meet the requirements of block size and improve the calculation accuracy and efficiency, from the tunnel to the boundary, the mesh division gradually becomes larger, and the block size is set between 0.1 m and 1 m. The horizontal x-direction displacements on the model’s left and right sides, the y-direction displacement on the front and back boundaries, and the vertical z-direction displacement on the bottom boundary are fixed. Vertical stress equivalent to the overburden weight is applied on the upper boundary. The constitutive relationship in the model employs the Mohr–Coulomb yield criterion. According to the on-site geological survey and a geological sketch of the tunnel face, the surrounding rock of the deep buried section of Sangzhuling Tunnel is mainly composed of Class II and Class III hard and brittle rocks, with a blocky structure and good rock integrity. According to the Engineering Rock Mass Grading Standard (GB50218-2014) [30], standard cylindrical granite and diorite specimens with a height-to-diameter ratio of 2:1 were selected from rock samples near the tunnel face during tunnel excavation. Rock mechanics parameter tests were conducted on the rock specimens using an RMT-150C electro-hydraulic servo controlled rigid press machine. The rock mechanics parameters for numerical simulation are derived from the test results [31] on the physical and mechanical parameters of the rock mass in the Sangzhuling Tunnel site. The calculation parameters are detailed in Table 1.
According to on-site observations, an arc-shaped cavity was found at the right vault behind the tunnel face, with shell-like fractures and thin flake-like spalling rock fragments. Occasionally, schistosity was observed at the arch foot. Video footage from the construction site recorded crisp cracking or popping sounds during rockburst. Based on the lithology, rock structure, hydrogeological conditions, and video footage, the section was characterized by medium to strong rockburst features. The distribution of the principal stress difference and elastic strain energy in the rock mass after tunnel excavation is depicted in Figure 3f,g. The maximum principal stress difference is primarily concentrated at the tunnel arch, shoulders, and foot, reaching approximately 55.80 MPa. The principal stress difference gradually decreases with increasing distance from the tunnel axis. The elastic strain energy density distribution nephogram reveals varying degrees of energy release at various locations within the rock mass after excavation, and a high-stress concentration in the rock mass leads to an increase in energy accumulation. The release of the elastic strain energy in the rock mass at the vault and arch shoulders on both sides of the tunnel is relatively large, with a maximum elastic strain energy density of 0.05 MJ/m3. The elastic strain energy density also gradually decreases with increasing tunnel axis radius, and the numerical simulation results are consistent with the observed rockburst characteristics.
Figure 3h shows that the maximum REC boundary value in the rock mass of the tunnel can reach 1.656, indicating a strong rockburst tendency. The REC boundary values near the tunnel vault range from 0.80 to 1.6, indicating a moderate rockburst tendency. The REC boundary values at the sidewalls of the tunnel are mainly between 0 and 0.28, suggesting almost no rockburst occurrence. The REC boundary values at the arch foot on both sides of the tunnel range from 0.246 to 0.495, indicating a potential for a weak rockburst. Observations of the on-site rockburst characteristics, principal stress difference, and elastic strain energy density in the rock mass demonstrate that the REC distribution closely matches the actual rockburst locations. Meanwhile, the distribution of REC thresholds is similar to the distribution of stress and energy fields in the rock mass, which can reflect the stress concentration degree and energy accumulation level to some extent.

3. Numerical Model for Strain Rockburst and Simulation Program

3.1. Numerical Model and Boundary Conditions

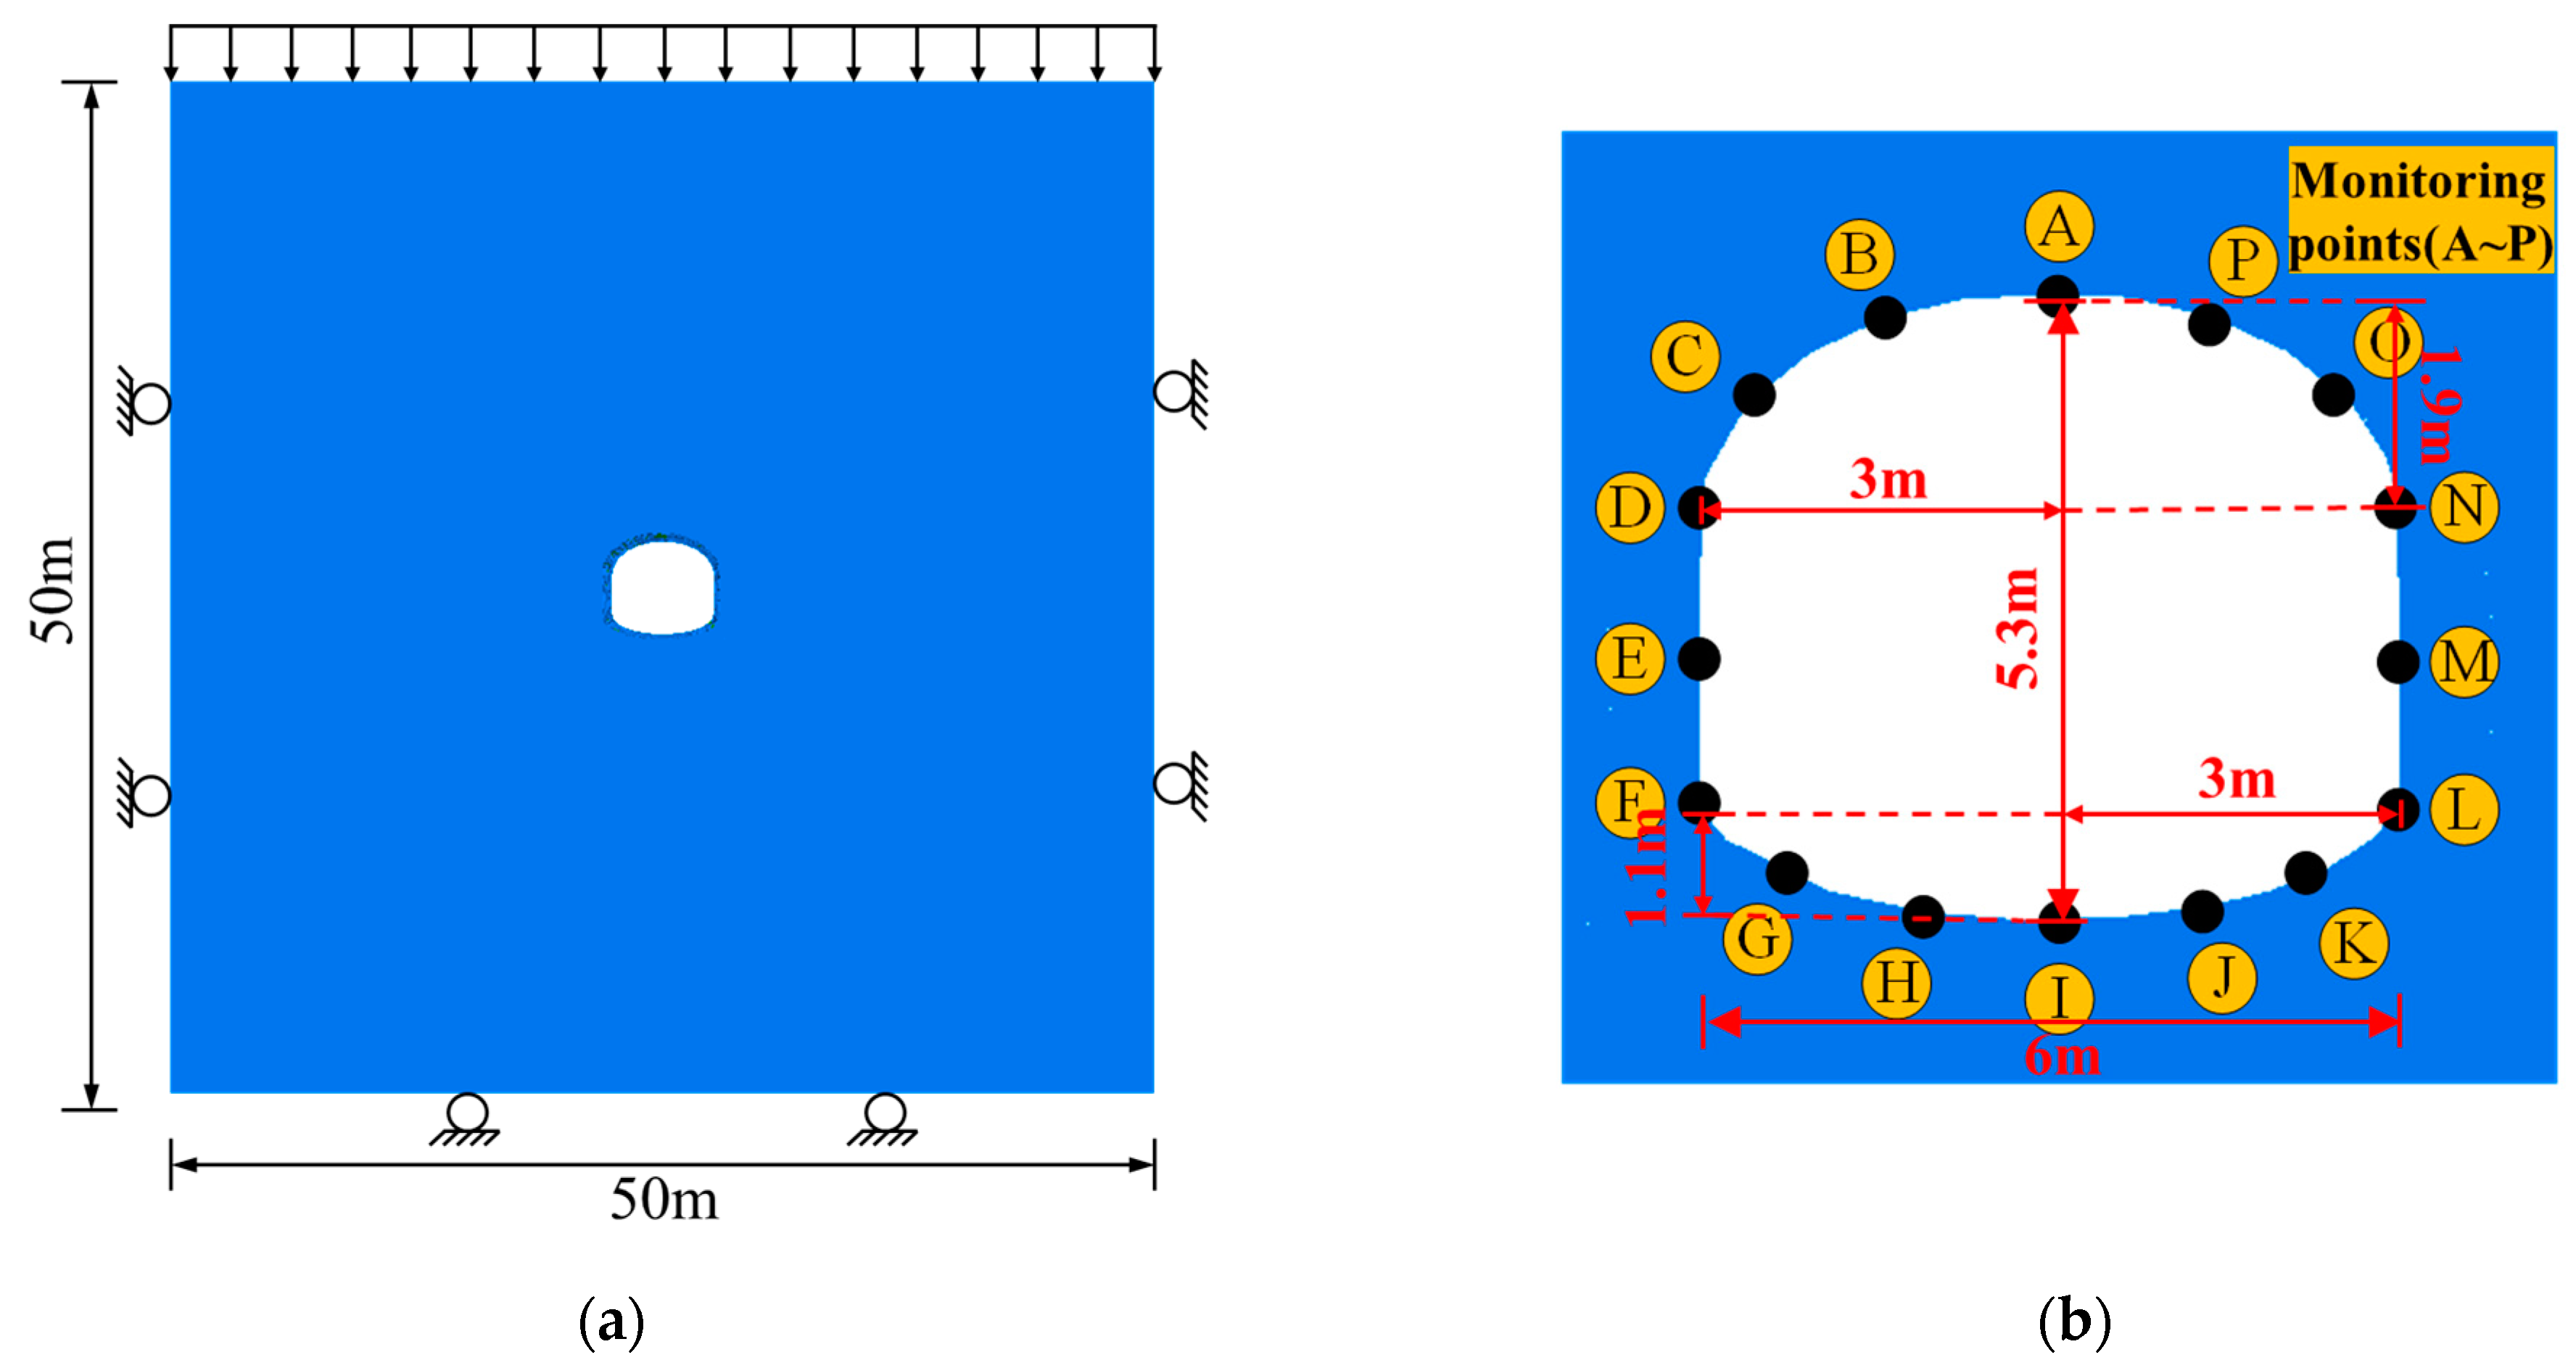
The cross-section of the case tunnel is a straight-wall semicircular arch (slightly with a bottom arch). The tunnel width is 6 m, the total height of the cross-section is 5.3 m, and the vault and inverted arch are both circular arcs with a radius of 3.0 m. The heights of the vault and inverted arch are 1.9 m and 1.1 m, respectively, with a middle straight wall height of 2.3 m. The specific dimensions and boundary conditions of the tunnel model are shown in Figure 4a. Vertical stress is applied to the upper boundary to simulate self-weight stress, the lower boundary is set as a fixed boundary, and the front, rear, and side boundaries are displacement-constrained. Assuming a tunnel depth of 1000 m, the horizontal stresses σH and σh are both 42.72 MPa, and the vertical stress σv is 28.48 MPa; the initial stress field is applied according to σH/σv = 1.5 and σh/σv = 1.5. The constitutive model adopts a 3D failure criterion that can accurately describe the mechanical behavior of hard rocks and comprehensively consider the tensile and shear failure modes of rocks, i.e., the Mohr–Coulomb constitutive model (change Cons 2), and the virtual joints adopt the Coulomb Slip model (change Jcons 1).

3.2. Mechanical Parameters of the Model

The rock mass mechanical parameters are directly obtained from rock mechanics test results. Without considering the heterogeneity of rock mass properties, the rock mass is considered to be isotropic and uniform. After averaging the data from conventional mechanical tests, the mechanical parameters are listed in Table 2, and the virtual joint parameters are presented in Table 3. These parameters are used to calibrate the rock blocks and joints.
The inoculation mechanism of rockburst is very complex, and there are many random factors that affect the occurrence of rockburst. The selection of these factors requires comprehensive consideration. Based on the energy analysis in Section 2.1, and with consideration of the internal (physical properties of the rock mass itself) and external (external loading) causes of rockburst, as well as the lithological, stress, and energy of rock explosions and avoidance of subjective qualitative factors, influencing factors of rockburst are selected from three dimensions: rock properties, rock mass environment, and stress conditions. Yang et al. [33] summarized several rockburst cases and found that the larger the uniaxial compressive strength, the greater the likelihood of rockburst. Rock slab buckling is a prerequisite for strain rockburst, and increasing the rock tensile strength can effectively prolong the buckling deformation process on the rock surface before final failure. The prolonged buckling process causes more energy to be consumed by crack propagation and plastic deformation within the rock mass, thus reducing the kinetic energy available for rockburst [34]. Si [35] found a linear relationship between rockburst frequency and depth, i.e., the greater the depth, the higher the frequency of rockburst. Increased tunnel depth also affects energy release during rockburst, with more thorough energy release leading to higher rockburst intensity. The lateral pressure coefficient (λ) directly affects the stress state and the stability of rock mass. When λ is large, i.e., the σH dominates, the rock mass is prone to horizontal squeezing deformation. An increase in σH makes the energy accumulation in the rock mass increase, and once it exceeds the rock’s limit, a rockburst occurs. Therefore, this study selects compressive strength (σc), tensile strength (σt), tunnel depth (D), and the lateral pressure coefficient (λ) as influencing factors for rockburst to conduct analysis.
A control variable method is used to explore the effects of the selected factors on the response characteristics of the rock mass. Each of these four factors is configured with three different conditions in numerical simulations. This study focuses on the variation of principal stress difference, elastic strain energy density, and REC during strain rockburst under different conditions. Therefore, excavation methods and support conditions are not considered. The excavation methods are full section for all cases, none of which are supported after excavation. The simulation scheme is presented in Table 4.

4. Influencing Controlling Factors of Strain Rockburst in Deep Tunnel

4.1. Influence of Compressive Strength

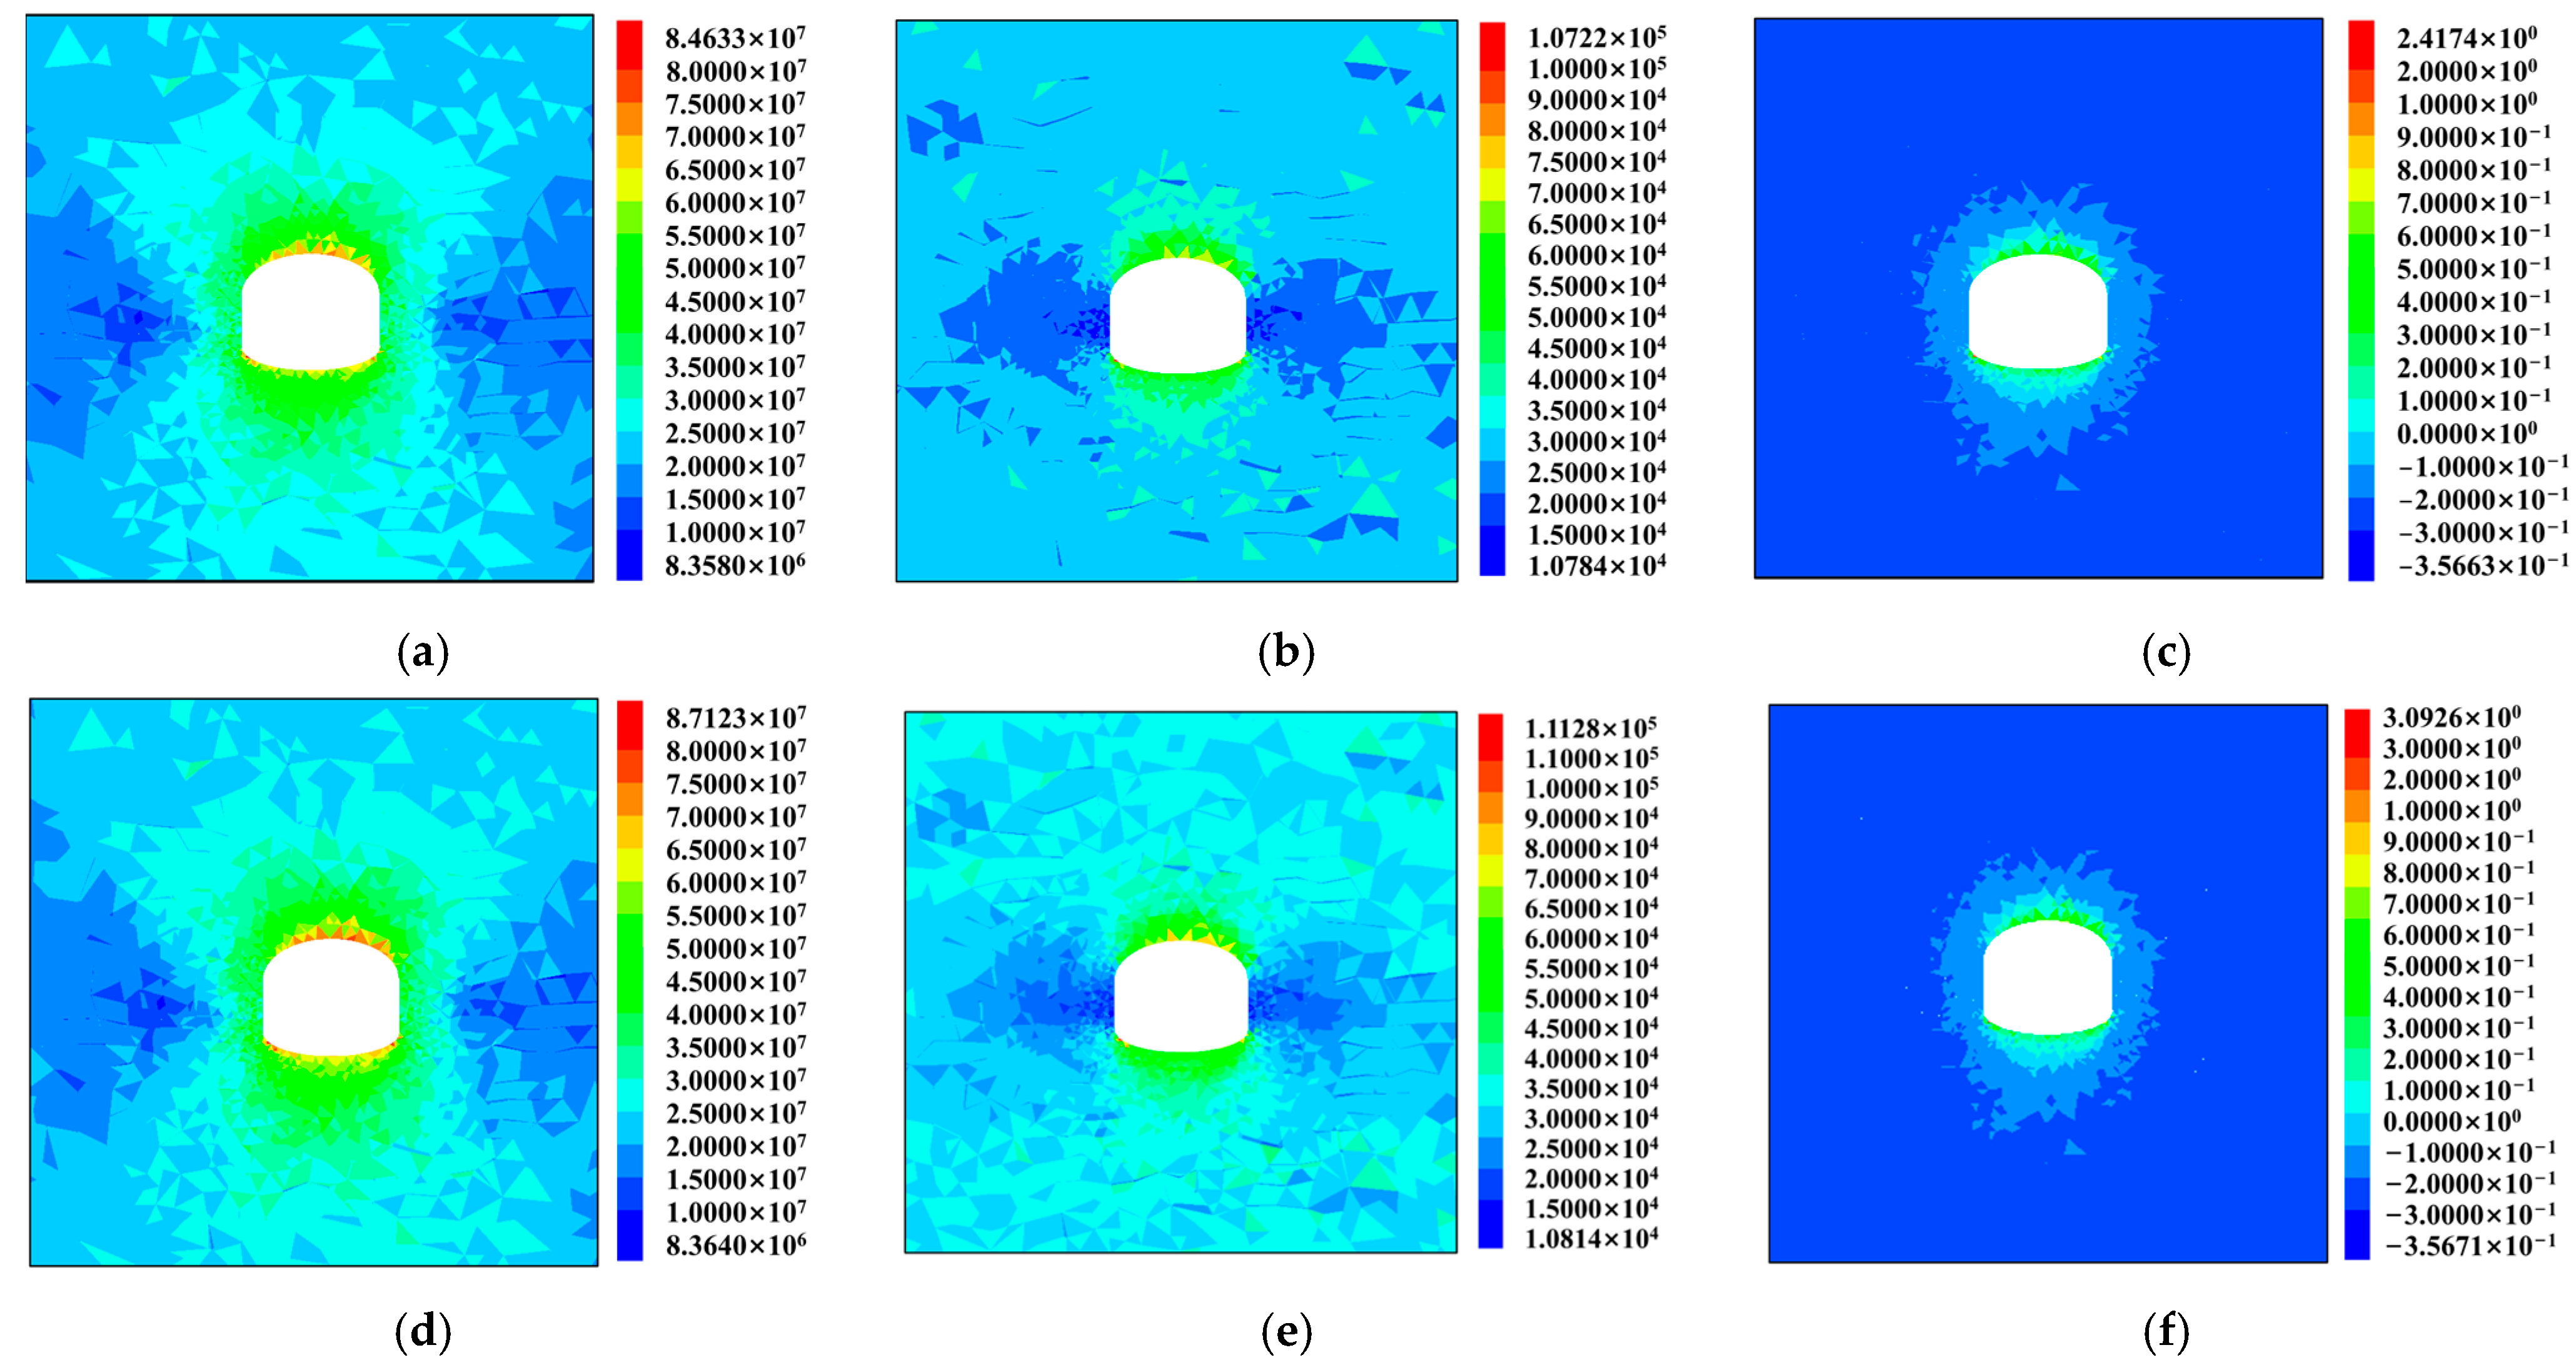
For numerical simulations of tunnel excavation unloading, the tensile strength, tunnel depth, and lateral pressure coefficient are set to 7.45 MPa, 1000 m, and 1.5, respectively. Five different conditions are designed with compressive strengths of 60 MPa, 70 MPa, 80 MPa, 90 MPa, and 100 MPa. The internal friction angle of the rock mass is kept constant at 52.51°, and the corresponding cohesion values are calculated using the formula σc = 2ccosφ/(1 − sinφ) to achieve different compressive strengths. Due to space limitations, only the multi-dimensional response and rockburst tendency of rock mass for compressive strengths of 60 MPa, 80 MPa, and 100 MPa are discussed, as shown in Figure 5.
As depicted in Figure 5, within the range of 60–100 MPa, the peak principal stress difference increases by approximately 30 MPa, and the peak elastic strain energy density increases by about 0.1 MJ/m3. With the increase in compressive strength, the stress concentration degree and energy accumulation level near the tunnel rock mass increase. The stress difference and elastic energy values within the rock mass present a clear positive correlation with compressive strength. The REC increases linearly with compressive strength. The REC value is 2.4 at 60 MPa and approximately 3.2 at 100 MPa. As the compressive strength of the rock mass increases, the rockburst intensity level also increases.

4.2. Influence of Tensile Strength

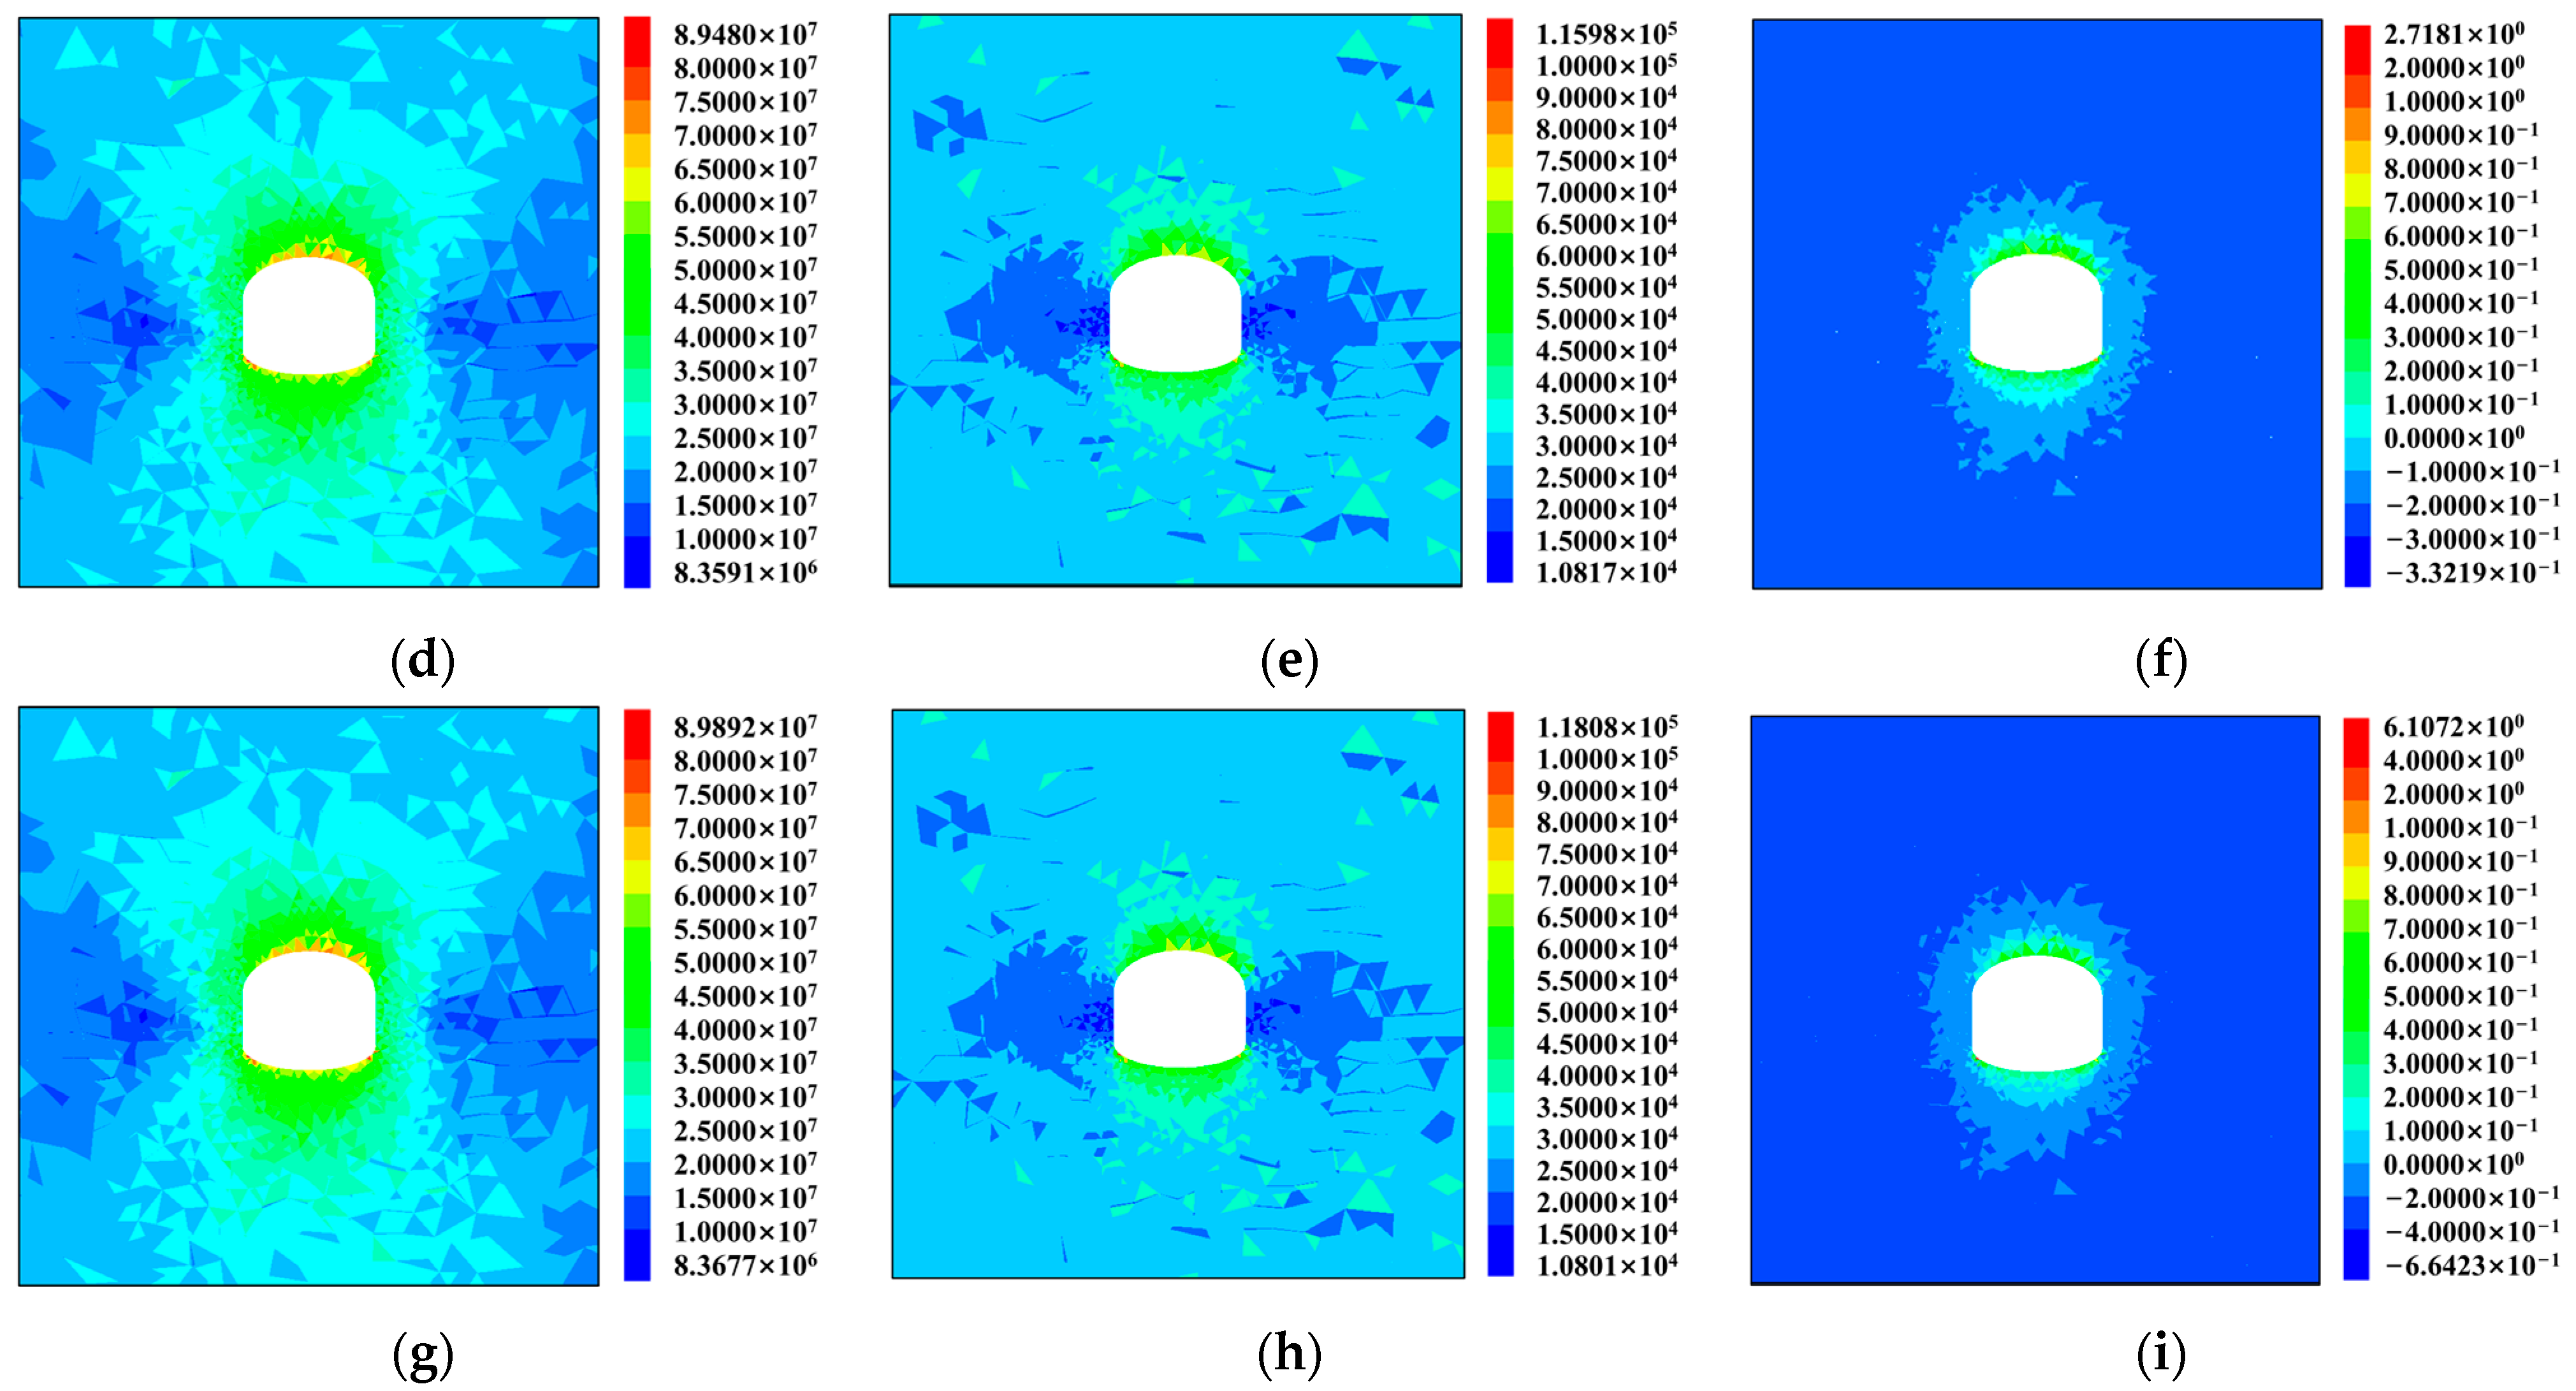
Five different conditions are designed with tensile strengths of 4 MPa, 6 MPa, 8 MPa, 10 MPa, and 12 MPa, while the compressive strength, tunnel depth, and lateral pressure coefficient are set to 120 MPa, 1000 m, and 1.5, respectively. Numerical simulations of tunnel excavation unloading are conducted to obtain multi-dimensional information and REC distribution nephograms of rock mass under different tensile strengths. Due to space limitations, only the multi-dimensional response and rockburst tendency of rock mass for tensile strengths of 4 MPa, 8 MPa, and 12 MPa are discussed, as illustrated in Figure 6.
As revealed in Figure 6, with the increase in tensile strength, there is almost no significant change in the stress concentration degree and energy accumulation level near the tunnel rock mass. The stress difference and elastic energy values within the rock mass exhibit a slight negative correlation with tensile strength. Within the range of 4–12 MPa, the peak principal stress difference decreases by approximately 0.4 MPa, and the peak elastic strain energy density decreases by about 0.002 MJ/m3. The REC decreases nearly exponentially with increasing tensile strength. The REC value is approximately 6.0 at 4 MPa and about 2.0 at 12 MPa. This indicates that as the tensile strength of the rock mass increases, the rockburst tendency decreases, and the rockburst intensity level gradually decreases. Increasing tensile strength helps to suppress rockburst occurrence.

4.3. Influence of Tunnel Depth

Five different conditions are designed with tunnel depths of 500 m, 1000 m, 1500 m, 2000 m, and 2500 m, while the compressive strength, tensile strength, and lateral pressure coefficient are set to 100 MPa, 8 MPa, and 1.5, respectively. Numerical simulations of tunnel excavation unloading are conducted to obtain multi-dimensional information distribution nephograms of rock mass under different depths. Figure 7 shows the multi-dimensional information distribution nephograms of rock mass for tunnel depths ranging from 500 m to 2500 m. Due to space limitations, only the multi-dimensional response and rockburst tendency of rock mass for tunnel depths of 500 m, 1500 m, and 2500 m are discussed, as presented in Figure 7.
As demonstrated in Figure 7, with the increase in tunnel depth, the stress concentration degree and energy accumulation level near the tunnel rock mass significantly increase. The stress difference and elastic energy values within the rock mass demonstrate a clear positive exponential correlation with tunnel depth. Within the range of 500–2500 m, the peak principal stress difference decreases by approximately 0.4 MPa, and the peak elastic strain energy density decreases by about 2 KJ/m3. The rockburst tendency criterion REC is utilized to further investigate the influences of various tunnel depths on the rockburst tendency of rock mass, and the maximum REC values are extracted. At a tunnel depth of 500 m, the REC value is 0.05, indicating no rockburst. At 1000 m, the REC value is 0.639, indicating a slight rockburst. At 1500 m, the REC value is approximately 2.611, indicating a moderate rockburst. At depths of 2000–2500 m, the REC values range from 8.253 to 18.982, indicating a strong rockburst.

4.4. Influence of Lateral Pressure Coefficient

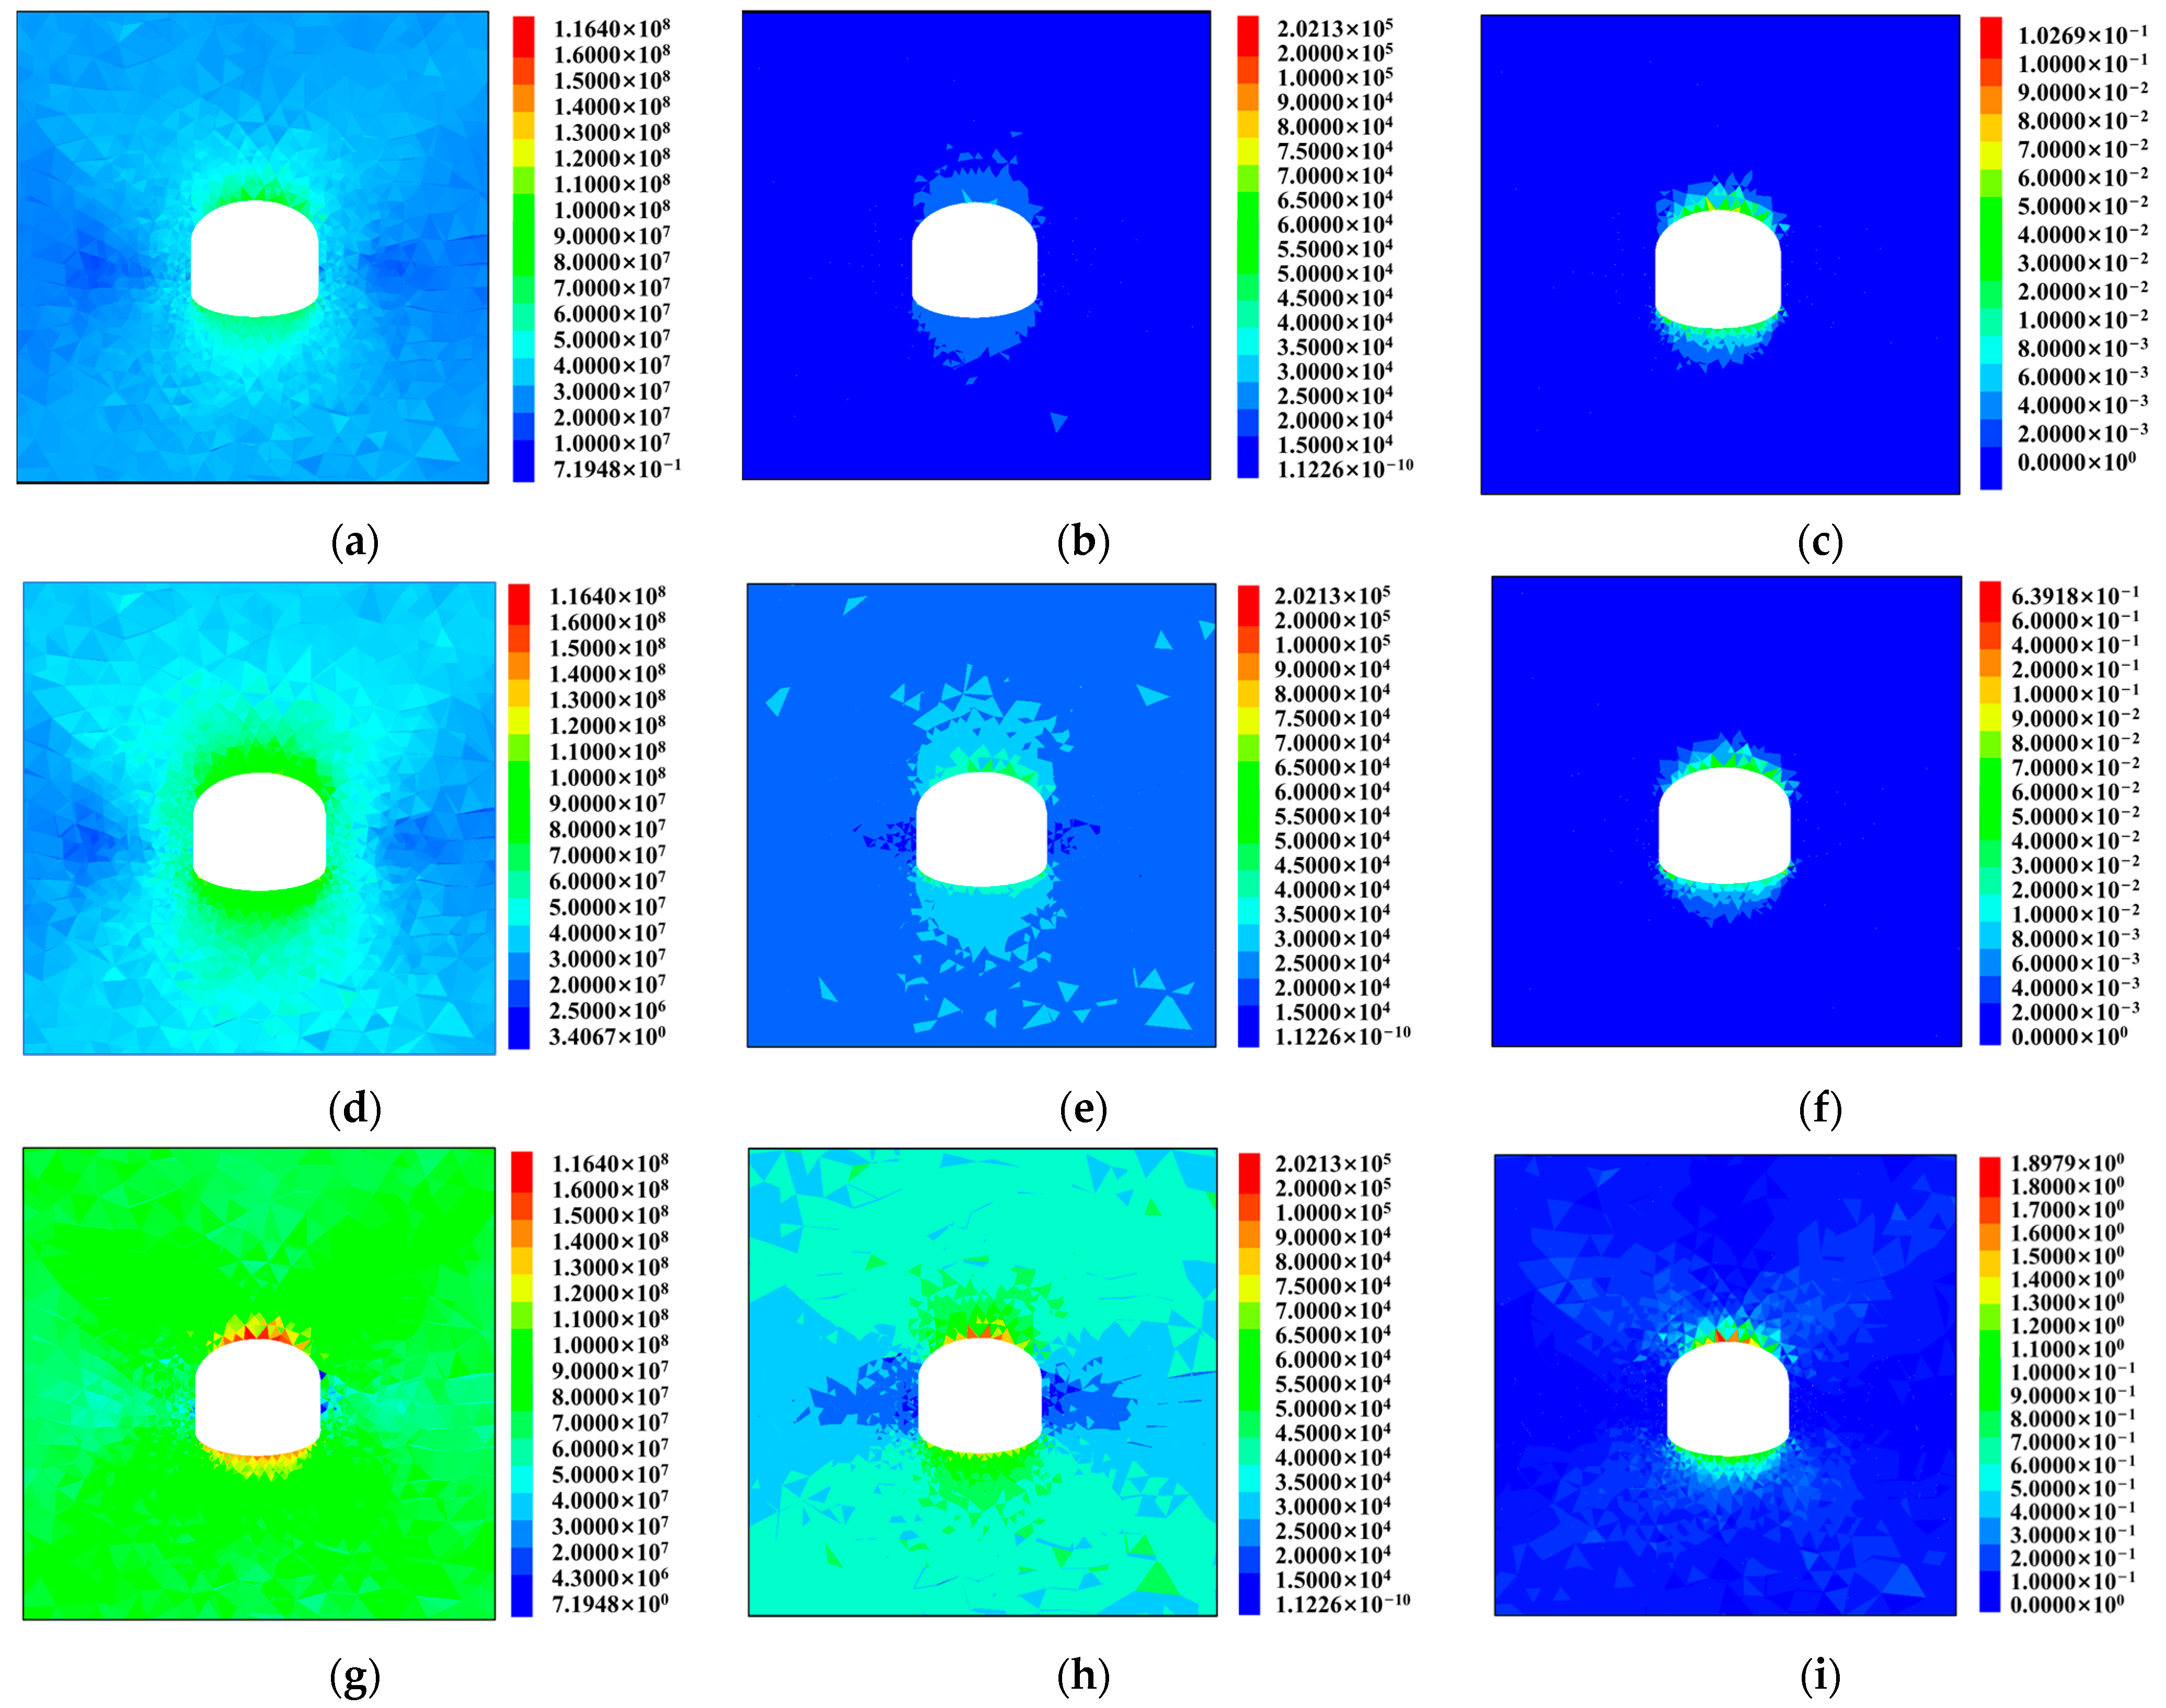
Five different conditions are designed with lateral pressure coefficients of 0.9, 1.2, 1.5, 1.8, and 2, while the compressive strength, tensile strength, and tunnel depth are set to 100 MPa, 8 MPa, and 1000 m, respectively. Numerical simulations are conducted to calculate the multi-dimensional information and rockburst tendency distribution nephograms of rock mass under different lateral pressure coefficients. Due to space limitations, only the multi-dimensional information response and rockburst tendency of rock mass for lateral pressure coefficients of 0.9, 1.2, and 2.1 are discussed, as depicted in Figure 8.
As shown in Figure 8, with the increase in the lateral pressure coefficient, the stress concentration degree and energy accumulation level near the tunnel rock mass significantly increase. The stress difference and elastic energy values within the rock mass demonstrate a clear positive correlation with the lateral pressure coefficient. Within the range of lateral pressure coefficients from 0.9 to 2.1, the peak principal stress difference decreases by approximately 0.4 MPa, and the peak elastic strain energy density decreases by about 2 kJ/m3. The rockburst tendency criterion REC is utilized to further assess the effects of varying lateral pressure coefficients on stress concentration degree and energy accumulation level within the rock mass. At a lateral pressure coefficient of 0.9, the REC value is 0.07982, indicating no rockburst. At a coefficient of 2.1, the REC value is 1.8979, indicating a moderate rockburst.

5. Sensitivity Analysis of Controlling Factors for Strain Rockburst in Deep Tunnel

Under the premise of considering the impact of high-stress conditions and hard brittle surrounding rock on deep underground tunnels, according to the simulation results of the change in the parameters of the strain rockburst influencing factors on the propensity to rockburst and the stability of the surrounding rock, the rockburst propensity criterion REC is selected as a reference index, and uniaxial compressive strength, tensile strength, engineering depth, and lateral pressure coefficient are selected as the evaluation indexes. Combined with the grey correlation analysis model, sensitivity analysis of the evaluation factors, the main control factors affecting the occurrence of strain rockbursts in deep underground engineering for the importance of ranking.

5.1. Rockburst Tendency under Different Influential Factors

To more intuitively analyze the impact of different compressive strengths on the rockburst tendency of deep tunnel rock mass, the maximum REC values under different influencing factors are extracted from the simulation results. The fitted curves of REC under different influencing factors are shown in Figure 9.
Figure 9a–d reveal that the rockburst tendency REC increases approximately linearly with the increase in rock mass compressive strength, decreases nearly exponentially with the increase in tensile strength, exponentially increases with increasing tunnel depth, and exhibits a good quadratic nonlinear relationship with lateral pressure coefficient λ as the lateral pressure coefficient (λ) increases. Therefore, in order to prevent the occurrence of rock explosion disasters during tunnel construction, the tensile strength of the surrounding rock should be improved as much as possible, the lateral pressure coefficient of surrounding rock should be reduced, and appropriate preventive measures should be established according to the depth of the tunnel.

5.2. Sensitivity Analysis of Influential Factors Based on Rockburst Tendency

The grey relational analysis method is a systematic approach that calculates the relational degree between evaluation and reference factors using a grey relational analysis model. It then ranks the sensitivity of each evaluation factor to quantitatively describe the relational degree between reference and evaluation factors. Although statistical analysis methods such as regression and correlation can provide some answers to the relationship between things or factors, they often require a large amount of data and clear distribution characteristics. Moreover, for phenomena with atypical distribution characteristics of multiple factors, regression correlation analysis is often difficult. Relatively speaking, grey relational analysis requires less data, has lower requirements for data, has a simple principle, is easy to understand and master, and overcomes and compensates for the above shortcomings. This method requires only a small amount of sample data without specific requirements to obtain accurate quantitative results that align well with qualitative analysis [36].
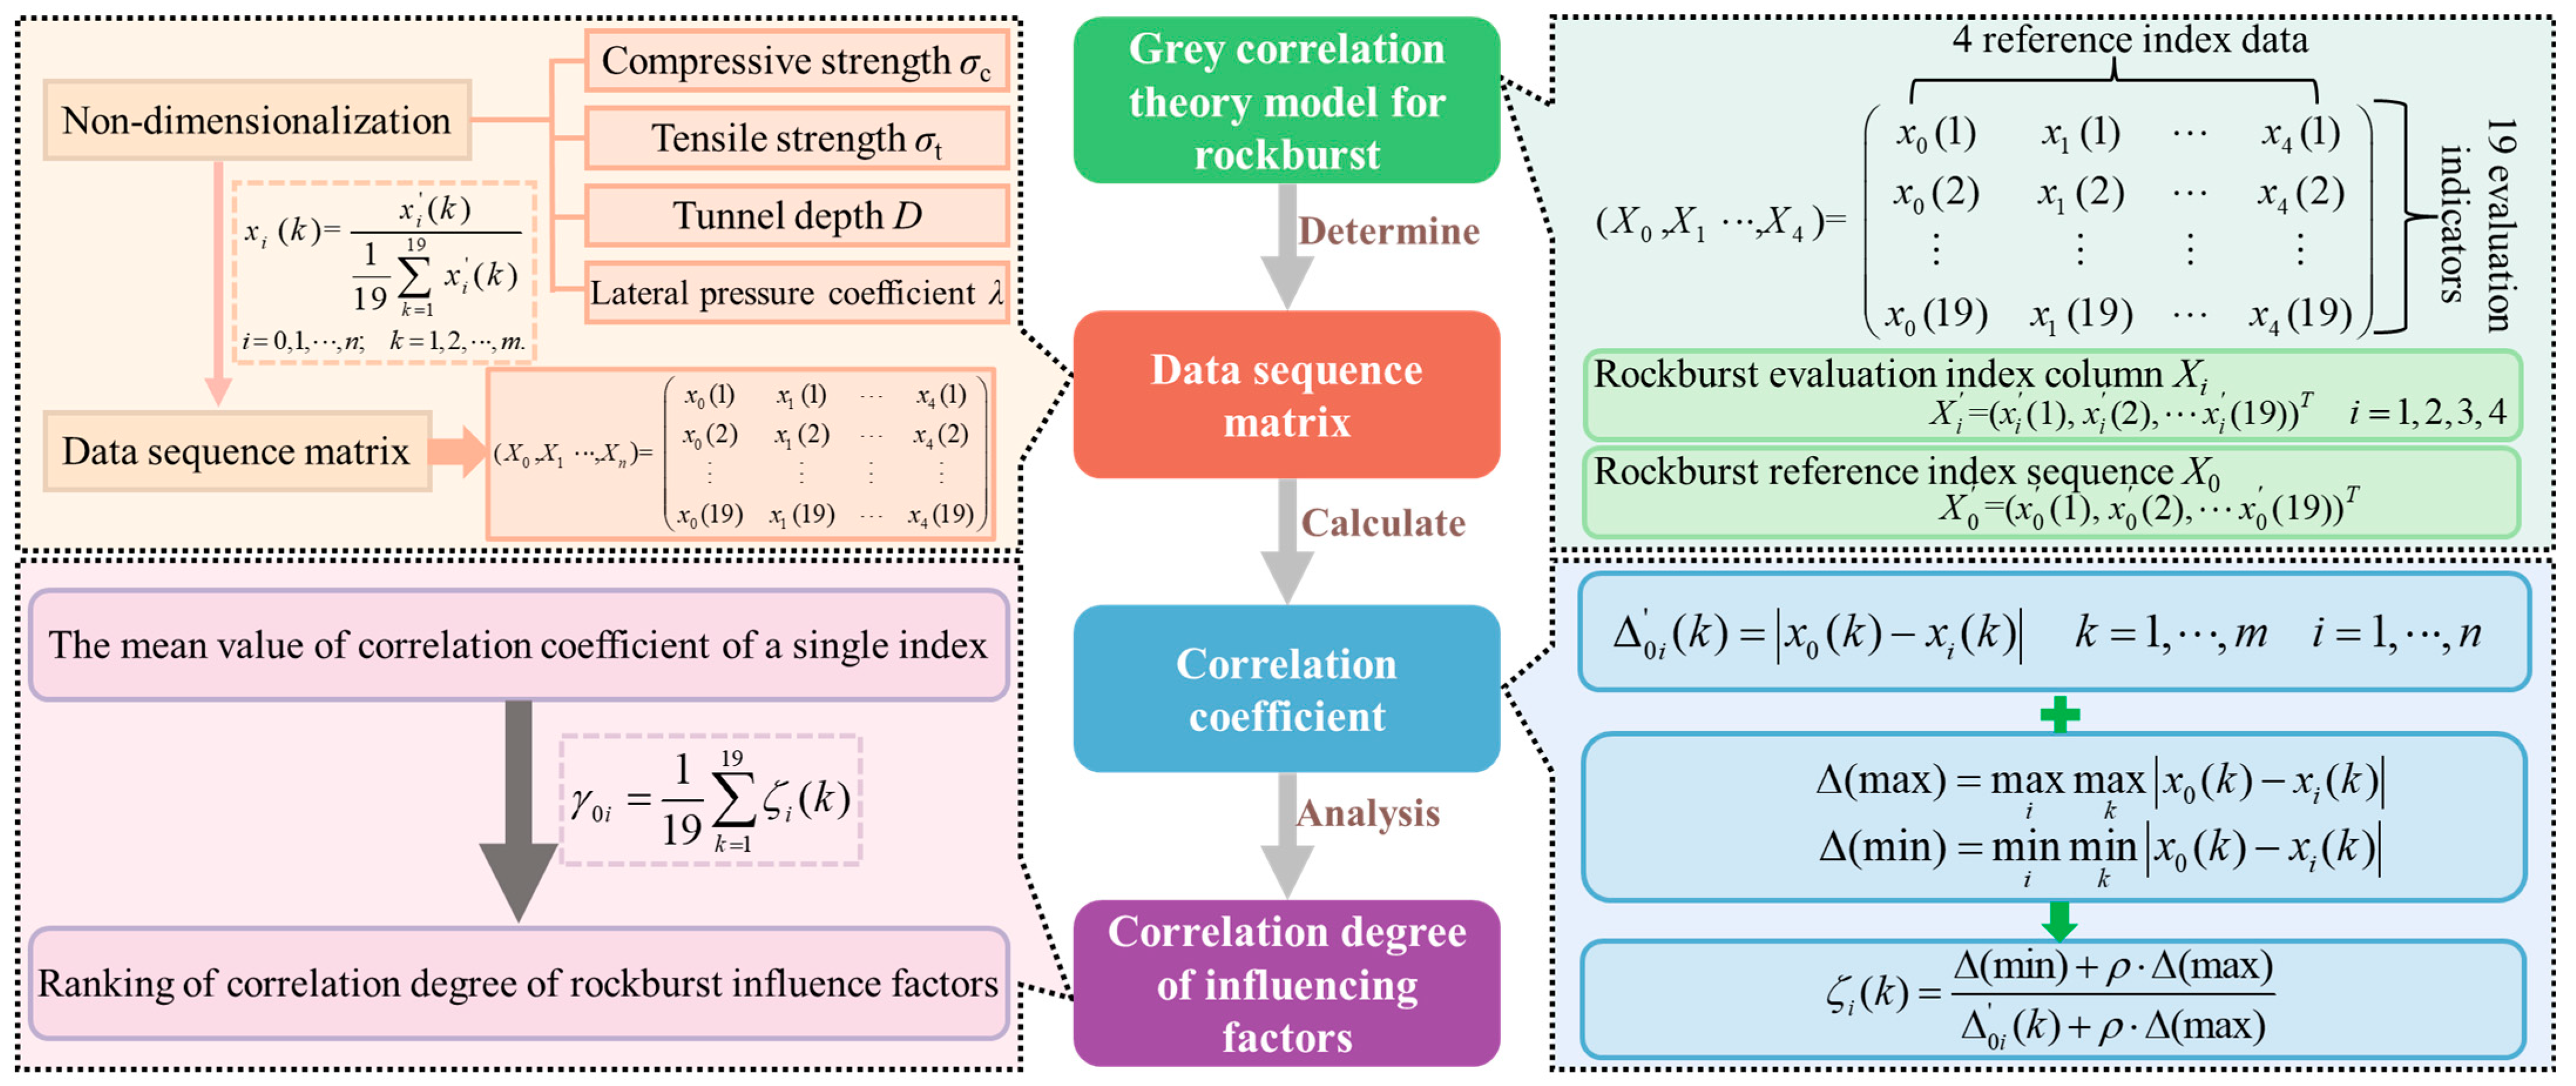
After using this method to establish the grey correlation theory model of rockburst, the physical significance of each influence factor of rockburst is considered to be different. The data outline is also different, so the compressive strength, tensile strength, tunnel depth, and lateral pressure coefficient indicator series, for the dimensionless processing, and then calculate the ith rockburst influencing factors indicators, the kth working conditions of the weight empirical judgment of the value of rockburst propensity of the REC value of the correlation coefficient between ζi(k) and the correlation degree γik. The steps of the grey relational analysis method [37] are illustrated in Figure 10.
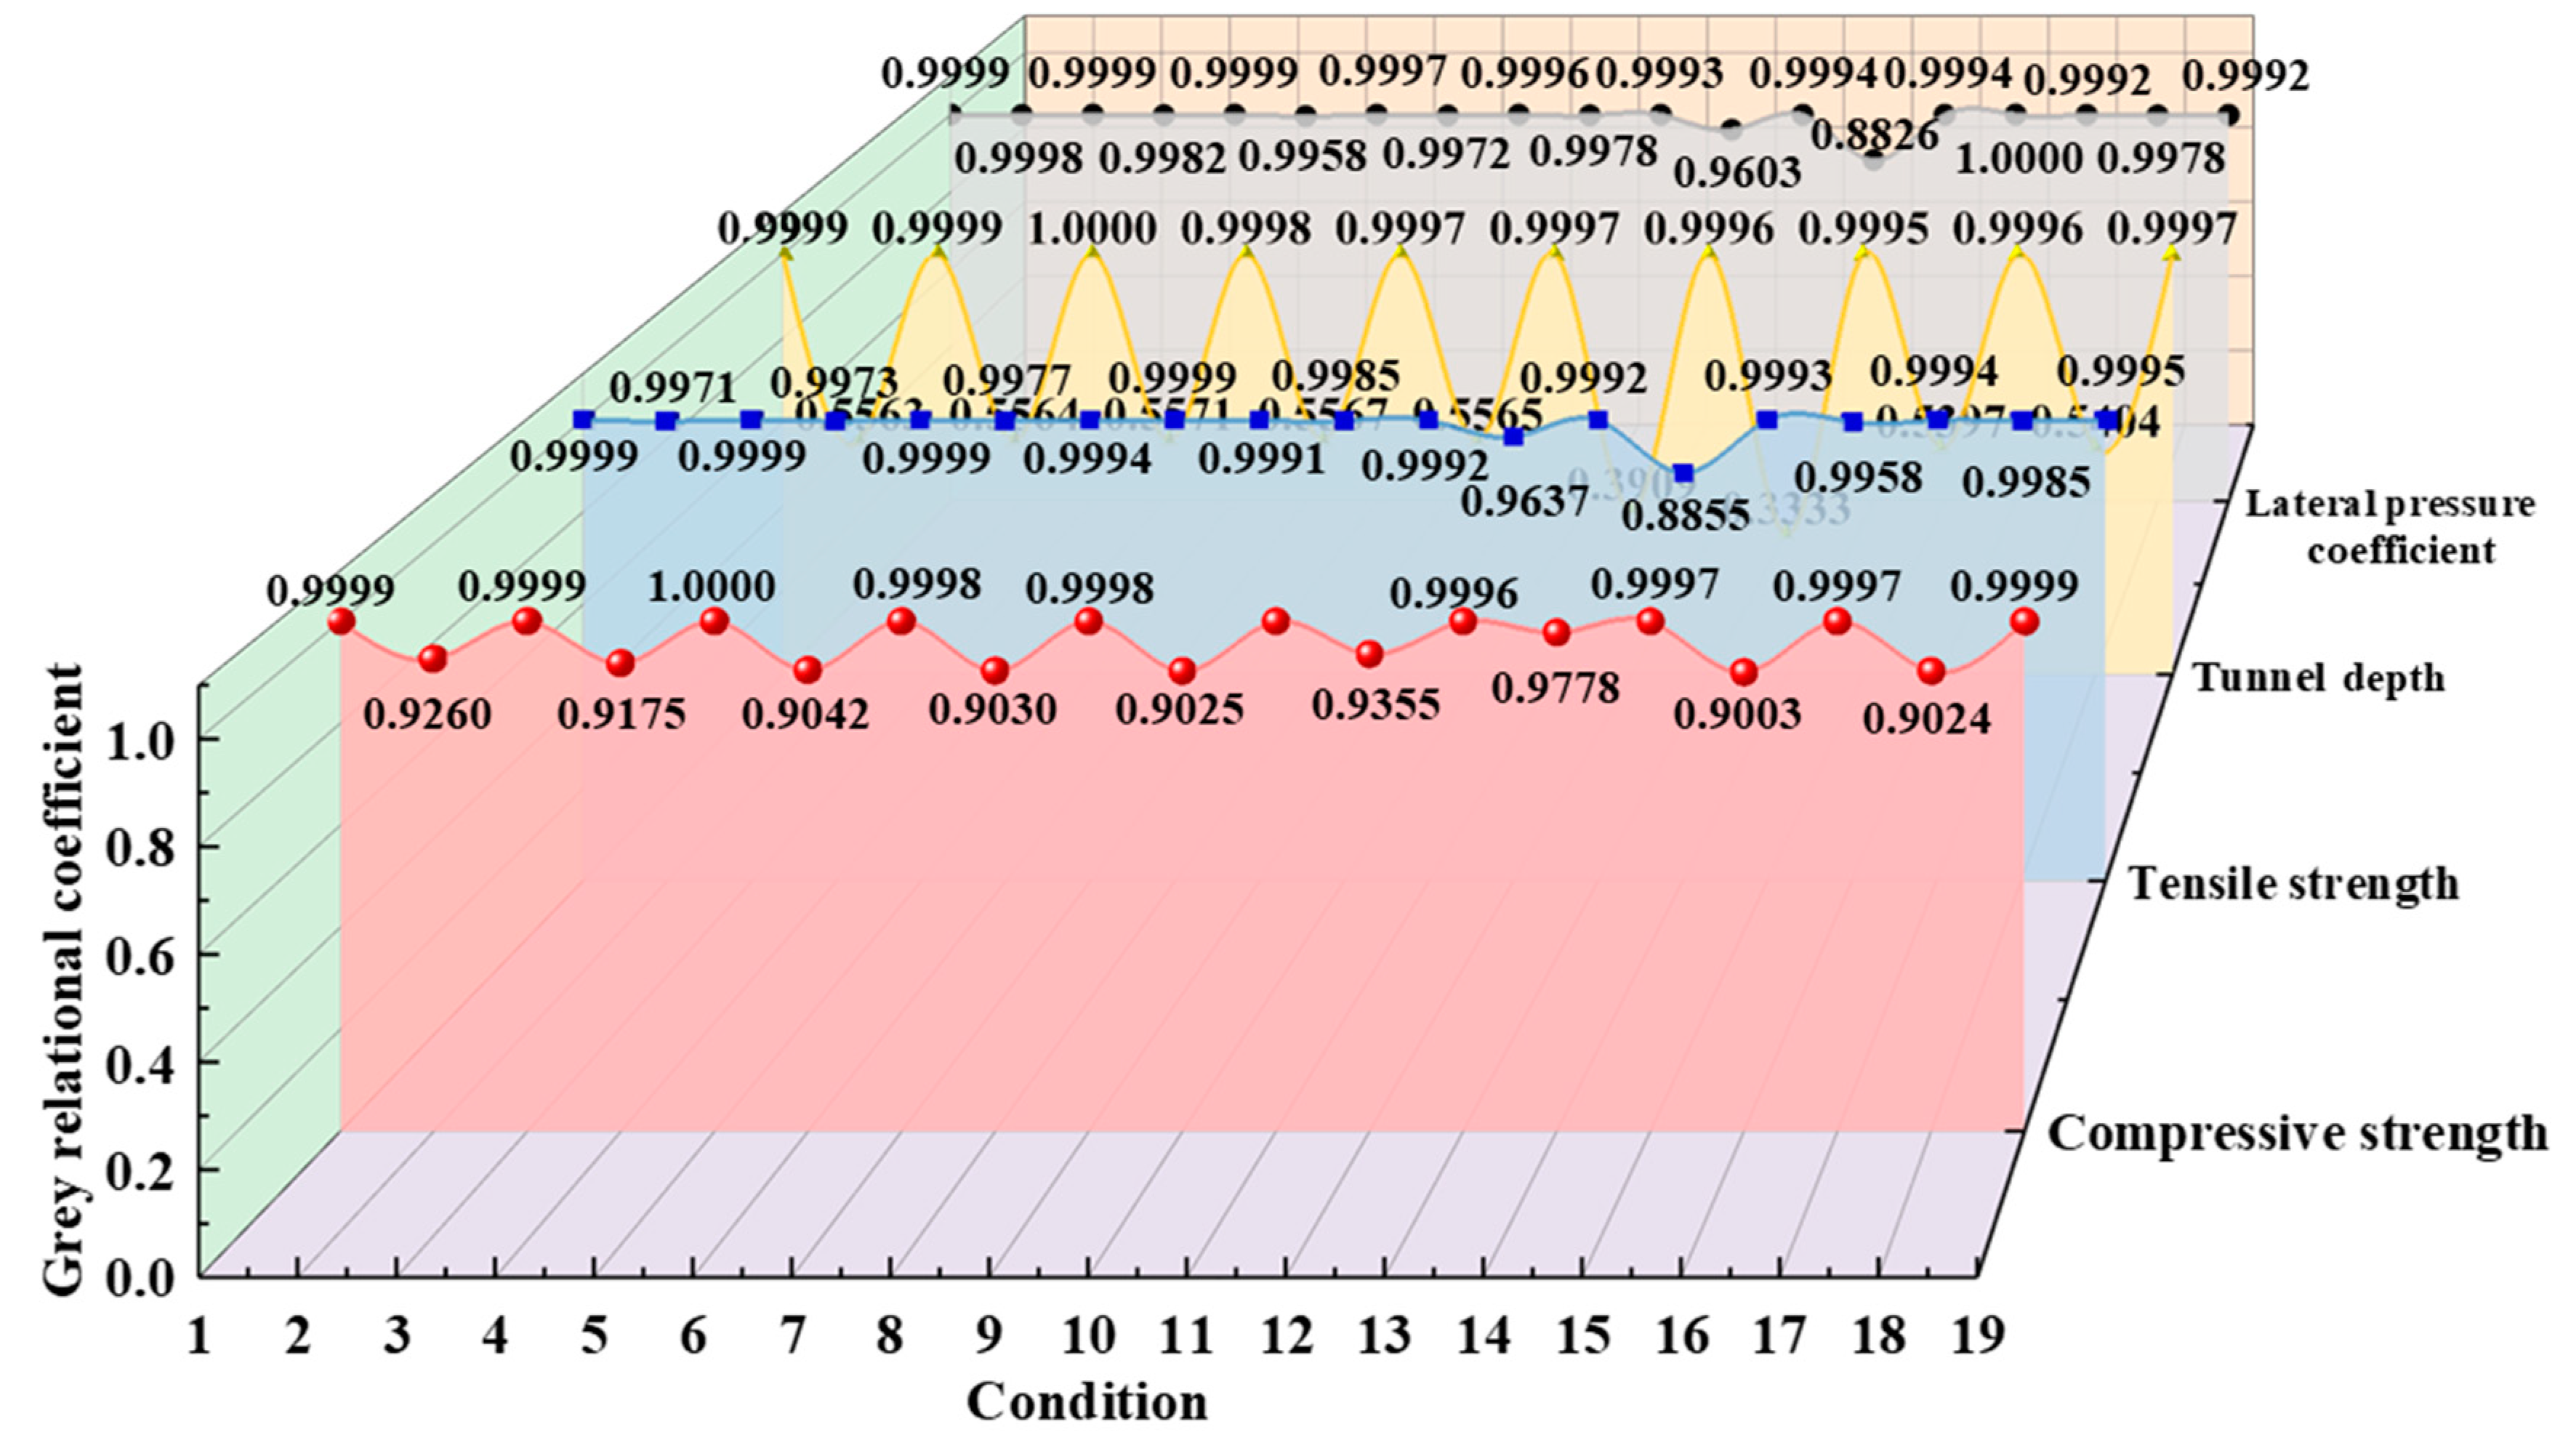
The grey relational degree value reflects the proximity between REC and each influencing factor. It is the weighted sum of the grey relational coefficients. The higher the grey relational degree value, the closer the corresponding rockburst tendency REC is to the expected value. Based on the numerical simulation results, the correlation coefficients between the four influencing factors of strain rockburst with different values and the rockburst tendency REC in deep underground engineering are calculated using the grey relational theory method. The results are presented in Figure 11.
The calculated average relational degree, i.e., sensitivity coefficient, for the four influencing factors of strain rockburst, is shown in Figure 12. It indicates that the influencing degrees in descending order are tensile strength > lateral pressure coefficient > compressive strength > tunnel depth. The relational degrees for tensile strength, lateral pressure coefficient, and compressive strength are all above 0.95, indicating a strong correlation with rockburst tendency. In contrast, tunnel depth has a relatively weaker correlation with rockburst tendency. Buckling is the prior step and the precondition for the occurrence of rockburst [38]. Increasing the tensile strength of rocks can enhance their ductility and deformation capacity, thereby effectively improving the allowable surface buckling deformation of rocks before final failure. Tensile strength, compressive strength, and the lateral pressure coefficient are the strength and stress state of the rock mass and control the rockburst tendency, while the tunnel depth representing the rock mass environment, which belongs to the indirect influencing factors, can only indirectly reflect the geostress environment and contribute less significantly to rockburst tendency.

6. Conclusions

Based on the rockburst energy tendency, bonded block model, and 3D discrete elements, this paper adopts a new BBM-3DEC coupled rockburst numerical analysis method considering the full stress state energy to analyze the impact of deep tunnel excavation unloading on stress, energy, and rockburst tendency of rock mass under different conditions. The main conclusions are as follows:
(1) The rockburst tendency REC proposed based on the principle of energy can reflect the energy evolution process of rock mass unit failure under two stress states of compression and tension of surrounding rock. It not only sorts out the energy conditions required for rock mass to reach failure, but also reflects the influence of rock mechanics, brittleness, integrity, and energy storage factors on rockburst failure. This serves as a multi-parameter rockburst criterion.
(2) Based on the BBM-3DEC coupled numerical simulation method and the rockburst tendency REC, a new 3D discrete element numerical analysis method for rockburst is proposed. The results achieved by the proposed method align well with the results of true triaxial single-side unloading laboratory rockburst tests and the actual rockburst conditions of the Sangzhuling Tunnel. And it can better realize the visualization analysis of multi-dimensional information response of surrounding rock, rock burst intensity, and range under a three-dimensional stress state
(3) As the compressive strength (σc), tunnel depth (D), and lateral pressure coefficient (λ) increase, the stress concentration degree and energy accumulation level of the rock mass after tunnel excavation unloading increase. The maximum stress difference and maximum elastic energy within the rock mass increase, leading to an enhanced rockburst tendency. As the tensile strength (σt) increases, the stress concentration degree and energy accumulation level of the rock mass after tunnel excavation unloading decrease, and the maximum stress difference and maximum elastic energy within the rock mass decrease, thereby reducing the rockburst tendency.
(4) The rockburst tendency REC increases approximately linearly with the increase in rock mass compressive strength, decreases nearly exponentially with the increase in tensile strength, exponentially increases with increasing tunnel depth, and exhibits a good quadratic nonlinear relationship with lateral pressure coefficient as the lateral pressure coefficient increases. The influencing factors on rockburst tendency are ranked as follows: tensile strength > lateral pressure coefficient > compressive strength > tunnel depth.

Author Contributions

Conceptualization, J.G. (Jiheng Gu) and J.G. (Jiaqi Guo); methodology, J.G. (Jiaqi Guo); software, Z.Z.; validation, J.G. (Jiheng Gu), F.S. and H.Z.; formal analysis, J.G. (Jiaqi Guo); investigation, B.H.; resources, J.G. (Jiaqi Guo); data curation, J.G. (Jiaqi Guo); writing—original draft preparation, J.G. (Jiheng Gu); writing—review and editing, J.G. (Jiaqi Guo); visualization, Z.Z.; supervision, F.S.; project administration, J.G. (Jiaqi Guo); funding acquisition, J.G. (Jiaqi Guo) All authors have read and agreed to the published version of the manuscript.

Funding

This research was funded by the Enterprises Research Project, grant number JG-013, Postdoctoral Research Funding Project in Henan Province, grant number HN2023026, and the National Natural Science Foundation of China, grant number 42307259.

Data Availability Statement

Data are contained within the article.

Acknowledgments

The authors greatly appreciate the financial support from funding bodies and are grateful to the reviewers for their valuable comments and suggestions to improve the quality of the paper.

Conflicts of Interest

The authors declare no conflicts of interest.

References

  1. Cui, J.; Broere, W.; Lin, D. Underground space utilisation for urban renewal. Tunn. Undergr. Space Technol. 2021, 108, 103726. [Google Scholar] [CrossRef]
  2. Liu, X.; Wang, G.; Song, L.; Han, G.; Chen, W.; Chen, H. A new rockburst criterion of stress–strength ratio considering stress distribution of surrounding rock. Bull. Eng. Geol. Environ. 2023, 82, 29. [Google Scholar] [CrossRef]
  3. Niu, W.; Feng, X.; Yao, Z.; Bi, X.; Yang, C.; Hu, L.; Zhang, W. Types and occurrence time of rockbursts in tunnel affected by geological conditions and drilling & blasting procedures. Eng. Geol. 2022, 303, 106671. [Google Scholar]
  4. Li, P.; Zhao, J.; Bu, W.; Niu, W.; Liu, P.; Sun, M. Optimization of Rockburst Risk Control Measures for Deeply Buried TBM Tunnels: A Case Study. Buildings 2023, 13, 1440. [Google Scholar] [CrossRef]
  5. Zhang, Q.; Zhang, X.; Liu, Q.; Qiu, J.; Wu, J. Rockburst prediction and prevention in a deep-buried tunnel excavated by drilling and blasting: A case study. Eng. Geol. 2024, 330, 107404. [Google Scholar] [CrossRef]
  6. Guo, J.; Zhu, Z.; Zhang, H.; Sun, F.; He, B. Study on Catastrophe Information Characteristics of Strain-Structural Plane Slip Rockburst in Deep Tunnels. Appl. Sci. 2023, 13, 12396. [Google Scholar] [CrossRef]
  7. Zhang, D.; Sun, Z.; Fang, Q. Scientific problems and research proposals for Sichuan-Tibet railway tunnel construction. Undergr. Space 2022, 7, 419–439. [Google Scholar] [CrossRef]
  8. Feng, G.; Ma, J.; Chen, B.; Xiao, Y.; Jiang, Q.; Li, P.; Lin, M. Microseismic energy and intensity criterion of rockburst in deep TBM tunnels: A case study of the Neelum-Jhelum hydropower project. J. Cent. South Univ. 2023, 30, 1695–1709. [Google Scholar] [CrossRef]
  9. Zhang, S.; Ma, T.; Tang, C.; Jia, P.; Wang, Y. Microseismic Monitoring and Experimental Study on Mechanism of Delayed Rockburst in Deep-Buried Tunnels. Rock Mech. Rock Eng. 2020, 53, 2771–2788. [Google Scholar] [CrossRef]
  10. Liu, X.; Zhang, S.; Wang, E.; Zhang, Z.; Wang, Y.; Yang, S. Multi-Index Geophysical Monitoring and Early Warning for Rockburst in Coalmine: A Case Study. Int. J. Environ. Res. Public Health 2023, 20, 392. [Google Scholar] [CrossRef]
  11. Eremenko, A.A.; Mulev, S.N.; Shtirts, V.A. Microseismic Monitoring of Geodynamic Phenomena in Rockburst-Hazardous Mining Conditions. J. Min. Sci. 2022, 58, 10–19. [Google Scholar] [CrossRef]
  12. Zhang, C.; Feng, X.; Zhou, H.; Qiu, S.; Wu, W. Case Histories of Four Extremely Intense Rockbursts in Deep Tunnels. Rock Mech. Rock Eng. 2012, 45, 275–288. [Google Scholar] [CrossRef]
  13. Su, G.; Shi, Y.; Feng, X.; Jiang, K.; Zhang, J.; Jiang, Q. True-Triaxial Experimental Study of the Evolutionary Features of the Acoustic Emissions and Sounds of Rockburst Processes. Rock Mech. Rock Eng. 2018, 51, 375–389. [Google Scholar] [CrossRef]
  14. Su, G.; Jiang, J.; Feng, X.; Jiang, Q.; Chen, Z.; Mo, J. Influence of loading rate on strainburst: An experimental study. Bull. Eng. Geol. Environ. 2019, 78, 3559–3573. [Google Scholar] [CrossRef]
  15. He, M.; Ren, F.; Liu, D.; Zhang, S. Experimental Study on Strain Burst Characteristics of Sandstone Under True Triaxial Loading and Double Faces Unloading in One Direction. Rock Mech. Rock Eng. 2021, 54, 149–171. [Google Scholar] [CrossRef]
  16. Zhou, J.; Zhang, Y.; Li, C.; He, H.; Li, X. Rockburst prediction and prevention in underground space excavation. Undergr. Space 2024, 14, 70–98. [Google Scholar] [CrossRef]
  17. Luo, C.; Zhang, S.; Tang, B.; Chen, J.; Yin, C.; Li, H. Research on Stress Characteristics of Rockburst in Over-Length Deep-Buried Tunnel. Buildings 2024, 14, 2298. [Google Scholar] [CrossRef]
  18. He, M.; Cheng, T.; Qiao, Y.; Li, H. A review of rockburst: Experiments, theories, and simulations. J. Rock Mech. Geotech. 2023, 15, 1312–1353. [Google Scholar] [CrossRef]
  19. Liu, G.; Meng, H.; Song, G.; Bo, W.; Zhao, P.; Ning, B.; Xu, X. Numerical simulation of wedge failure of rock slopes using three-dimensional discontinuous deformation analysis. Environ. Earth Sci. 2024, 83, 310. [Google Scholar] [CrossRef]
  20. Sun, F.; Guo, J.; Liu, X.; Zhang, H. Strain rockburst evolution process under true triaxial condition with single face unloading due to tunnel excavation. Comput. Geotech. 2023, 159, 105465. [Google Scholar] [CrossRef]
  21. Xue, Y.; Cao, Z.; Li, Z. Destabilization mechanism and energy evolution of coal pillar in rockburst disaster. Arab. J. Geosci. 2020, 13, 557. [Google Scholar] [CrossRef]
  22. Hu, L.; Ma, K.; Liang, X.; Tang, C.; Wang, Z.; Yan, L. Experimental and numerical study on rockburst triggered by tangential weak cyclic dynamic disturbance under true triaxial conditions. Tunn. Undergr. Space Technol. 2018, 81, 602–618. [Google Scholar] [CrossRef]
  23. Yang, F.; Hui, Z.; Xiao, H.; Azhar, M.U.; Yong, Z.; Chi, F. Numerical simulation method for the process of rockburst. Eng. Geol. 2022, 306, 106760. [Google Scholar]
  24. Kong, P.; Wang, C.; Xing, L.; Liang, M.; He, J. Study on the fault slip rule and the rockburst mechanism induced by mining the panel through fault. Geomech. Geophys. Geo-Energy Geo-Resour. 2023, 9, 163. [Google Scholar] [CrossRef]
  25. Ma, K.; Peng, Y.; Liao, Z.; Wang, Z. Dynamic responses and failure characteristics of the tunnel caused by rockburst: An entire process modelling from incubation to occurrence phases. Comput. Geotech. 2024, 171, 106340. [Google Scholar] [CrossRef]
  26. Gao, H.; Xie, H.; Zhang, Z.; Lu, J.; Zhang, D.; Zhang, R.; Wu, M. True triaxial energy evolution characteristics and failure mechanism of deep rock subjected to mining-induced stress. Int. J. Rock Mech. Min. 2024, 176, 105724. [Google Scholar] [CrossRef]
  27. Zhu, B.; Fan, J.; Shi, X.; Liu, P.; Guo, J. Study on Rockburst Proneness of Deep Tunnel Under Different Geo-Stress Conditions Based on DEM. Geotech. Geol. Eng. 2022, 40, 1373–1386. [Google Scholar] [CrossRef]
  28. Chen, W.; Lv, S.; Guo, X.; Qiao, C. Research on unloading confining pressure tests and rockburst criterion based on energy theory. Chin. J. Rock Mech. Eng. 2009, 28, 1530–1540. [Google Scholar] [CrossRef]
  29. Jiang, B.Y.; Wang, L.G.; Gu, S.T.; Zhang, X.D.; Li, W.S. Study on rockburst mechanism of TBM excavation for deep tunnel based on energy principle. J. Min. Saf. Eng. 2017, 34, 1103–1109+1115. [Google Scholar] [CrossRef]
  30. GB50218-2014; Standard for Engineering Classification of Rock Mass. The Standardization Administration of the People’s Republic of China: Beijing, China, 2014.
  31. Wang, Q.; Ju, N.; Du, L.; Huang, J.; Jiang, J. Inverse Analysis of Geostress Field in Bayu Deep-buried Tunnel on Lhasa–Linzhi Railway. Rail. Eng. 2016, 10, 59–62. [Google Scholar] [CrossRef]
  32. Zhu, Z.; Sun, F.; Guo, J. Study on rockburst tendency of deep underground engineering based on multi-factor influence. Electron. J. Struct. Eng. 2023, 23, 1–12. [Google Scholar] [CrossRef]
  33. Yang, B.; He, M.; Zhang, Z.; Zhu, J.; Chen, Y. A New Criterion of Strain Rockburst in Consideration of the Plastic Zone of Tunnel Surrounding Rock. Rock Mech. Rock Eng. 2023, 159, 105465. [Google Scholar] [CrossRef]
  34. Yang, J.; Yang, X.; Zhou, J.; Liu, Y.; Dong, B.; Li, H. Comparative Study of the Excavation Damage and Rockburst of the Deeply Buried Jinping II Diversion Tunnels Using a TBM and the Drilling-Blasting Method. Adv. Civ. Eng. 2020, 2020, 8876214. [Google Scholar] [CrossRef]
  35. Si, X.; Peng, K.; Luo, S. Experimental Investigation on the Influence of Depth on Rockburst Characteristics in Circular Tunnels. Sensors 2022, 22, 3679. [Google Scholar] [CrossRef] [PubMed]
  36. Tosun, N. Determination of optimum parameters for multi-performance characteristics in drilling by using grey relational analysis. Int. J. Adv. Manuf. Technol. 2006, 28, 450–455. [Google Scholar] [CrossRef]
  37. Xie, H.; Yu, T.; Lin, P.; Wang, Z.; Xu, Z. Effect of petrographic characteristics on uniaxial compressive strength of granitic rocks from Xinjiang, China. J. Cent. South Univ. 2023, 30, 2340–2359. [Google Scholar] [CrossRef]
  38. Hu, X.; Su, G.; Li, Z.; Xu, C.; Yan, X.; Liu, Y.; Yan, L. Suppressing rockburst by increasing the tensile strength of rock surface: An experimental study. Tunn. Undergr. Space Technol. 2021, 107, 103645. [Google Scholar] [CrossRef]
Figure 1. Process of BBM-3DEC coupled numerical simulation method for strain rockburst.
Buildings 14 02886 g001
Figure 2. Comparison of laboratory tests and numerical simulation results on rockburst failure of rock samples. (a) laboratory rock sample structure and size; (b) high voltage servo true three-axis testing machine; (c) rock specimen; (d) high-speed camera system; (e) numerical experimental model (f) failure situation of laboratory test rock samples; (g) lateral failure situation of laboratory test rock samples (“张拉破坏” means tensile failure; “剪切破坏” means shear failure); (h) distribution of crack displacement (Unit: m); (i) lateral distribution of crack displacement (Unit: m); (j) distribution of displacement vector; (k) lateral distribution of displacement vector; (l) principal stress difference (Pa); (m) lateral principal stress difference (Pa); (n) elastic strain energy density (J/m3); (o) lateral elastic strain energy density (J/m3); (p) rockburst tendency REC; (q) lateral rockburst tendency REC.
Buildings 14 02886 g002
Figure 3. Comparison between engineering rockburst situation and numerical simulation results.
Buildings 14 02886 g003
Figure 4. Three-dimensional discrete element numerical model for strain-type rockburst: (a) model size and boundary conditions; (b) tunnel size and monitoring points.
Buildings 14 02886 g004
Figure 5. Multivariate information response and rockburst tendency of surrounding rock under different tunnel depths: (a) σc = 60 MPa, principal stress difference (Pa); (b) σc = 60 MPa, elastic strain energy (J/m3); (c) σc = 60 MPa, REC; (d) σc = 80 MPa, principal stress difference (Pa); (e) σc = 80 MPa, elastic strain energy (J/m3); (f) σc = 80 MPa, REC; (g) σc = 100 MPa, principal stress difference (Pa); (h) σc = 100 MPa, elastic strain energy (J/m3); (i) σc = 100 MPa, REC.
Buildings 14 02886 g005aBuildings 14 02886 g005b
Figure 6. Multivariate information response and rockburst tendency of surrounding rock under different tunnel depths: (a) σt = 4 MPa, principal stress difference (Pa); (b) σt = 4 MPa, elastic strain energy (J/m3); (c) σt = 4 MPa, REC; (d) σt = 8 MPa, principal stress difference (Pa); (e) σt = 8 MPa, elastic strain energy (J/m3); (f) σt = 8 MPa, REC; (g) σt = 12 MPa, principal stress difference (Pa); (h) σt = 12 MPa, elastic strain energy (J/m3); (i) σt = 12 MPa, REC.
Buildings 14 02886 g006aBuildings 14 02886 g006b
Figure 7. Multivariate information response and rockburst tendency of surrounding rock under different tunnel depth: (a) D = 500 m, principal stress difference (Pa); (b) D = 500 m, elastic strain energy (J/m3); (c) D = 500 m, REC; (d) D = 1500 m, principal stress difference (Pa); (e) D = 1500 m, elastic strain energy (J/m3); (f) D = 1500 m, REC; (g) D = 2500 m, principal stress difference (Pa); (h) D = 2500 m, elastic strain energy (J/m3); (i) D = 2500 m, REC.
Buildings 14 02886 g007
Figure 8. Multivariate information response and rockburst tendency of surrounding rock under different lateral pressure coefficient: (a) λ = 0.9, principal stress difference (Pa); (b) λ = 0.9, elastic strain energy (J/m3); (c) λ = 0.9, REC; (d) λ = 1.5, principal stress difference (Pa); (e) λ = 1.5, elastic strain energy (J/m3); (f) λ = 1.5, REC; (g) λ = 2.1, principal stress difference (Pa); (h) λ = 2.1, elastic strain energy (J/m3); (i) λ = 2.1, REC.
Buildings 14 02886 g008
Figure 9. Fitting curves of REC changes under different influencing factors: (a) compressive strength; (b) tensile strength; (c) tunnel depth; (d) coefficient of lateral pressure.
Buildings 14 02886 g009
Figure 10. Steps of grey relational analysis method.
Buildings 14 02886 g010
Figure 11. Correlation coefficient of rockburst influencing factors.
Buildings 14 02886 g011
Figure 12. Average correlation degree of influencing factors of strain rockburst.
Buildings 14 02886 g012
Table 1. Physical and mechanical parameters of surrounding rock (modified from Zhu et al. [32]).
Rock TypeElastic Modulus (GPa)Poisson’s RatioDensity (kg/m3)Cohesive Force (MPa)Internal Friction Angle (°)Compressive Strength (MPa)Tensile Strength (MPa)
Diorite360.2026002.345143.787.04
Table 2. Mechanical parameters of surrounding rock.
Volumetric Weight (kN/m3)Elastic Modulus (GPa)Bulk Modulus (GPa)Shear Modulus (GPa)Internal Friction Angle (°)Cohesion Force (MPa)Tensile Strength (MPa)
28.4833.6020.7413.6652.5123.757.45
Table 3. Virtual joint parameters (modified from Guo et al. [6]).
ParameterNormal Stiffness (GPa/m)Shear Stiffness (GPa/m)Internal Friction Angle (°)Cohesion Force
(MPa)
Virtual joint70.4552.2053.5126.67
Table 4. Numerical simulation scheme.
ConditionCompressive Strength σc (MPa)Tensile Strength σt (MPa)Tunnel Depth D (m)Lateral Pressure
Coefficient λ
1607.4510001.5
2707.4510001.5
3807.4510001.5
4907.4510001.5
51007.4510001.5
6120410001.5
7120610001.5
8120810001.5
91201010001.5
101201210001.5
1110085001.5
12100810001.5
13100815001.5
14100820001.5
15100825001.5
16100810000.9
17100810001.2
18100810001.8
19100810002.1
Disclaimer/Publisher’s Note: The statements, opinions and data contained in all publications are solely those of the individual author(s) and contributor(s) and not of MDPI and/or the editor(s). MDPI and/or the editor(s) disclaim responsibility for any injury to people or property resulting from any ideas, methods, instructions or products referred to in the content.