Article

Prediction of the Temperature Field in a Tunnel during Construction Based on Airflow–Surrounding Rock Heat Transfer

1
Guizhou Road and Bridge Group Co., Ltd., Guiyang 550001, China
2
Guizhou Road and Bridge Group Co., Ltd. 1 ST Branch, Guiyang 550001, China
3
Key Laboratory of Transportation Tunnel Engineering, Ministry of Education, Southwest Jiaotong University, Chengdu 610031, China
*
Author to whom correspondence should be addressed.
Buildings 2024, 14(9), 2908; https://doi.org/10.3390/buildings14092908 (registering DOI)
Submission received: 27 June 2024 / Revised: 10 September 2024 / Accepted: 11 September 2024 / Published: 14 September 2024

Abstract

:
It is important to determine the ventilation required in the construction of deep and long tunnels and the variation law of tunnel temperature fields to reduce the numbers of high-temperature disasters and serious accidents. Based on a tunnel project with a high ground temperature, with the help of convection heat transfer theory and the theoretical analysis and calculation method, this paper clarifies the contribution of various heat sources to the air demand during tunnel construction, and reveals the important environmental parameters that determine the ventilation value by changing the construction conditions. The results show that increasing the fresh air temperature greatly increases the required air volume, and the closer the supply air temperature is to 28 °C, the more the air volume needs to be increased. The air temperature away from the palm face is not significantly affected by changes in the supply air temperature. Adjusting the wall temperature greatly accelerates the rate of temperature growth. The supply air temperature rose from 15 to 25 °C, while the tunnel temperature at 800 m only increased by 1.5 °C. Over a 50 m range, the wall temperature rose from 35 to 60 degrees Celsius at a rate of 0.0842 to 0.219 degrees Celsius per meter. The total air volume rises and the surface heat transfer coefficient decreases as the tunnel’s cross-section increases. For every 10 m increase in the tunnel diameter, the temperature at 800 m from the tunnel face drops by about 0.5 °C. Changing the distance between the air duct and the tunnel face has little influence on the temperature distribution law. The general trend is that the farther the air duct outlet is from the tunnel face, the higher the temperature is, and the maximum difference is within the range of 50 m~250 m from the tunnel face. The maximum difference between the air temperatures at 12 m and 27 m is 0.79 °C. The geological structure and geothermal background have the greatest influence on the temperature prediction of high geothermal tunnels. The prediction results are of great significance for guiding tunnel construction, formulating cooling measures, and ensuring construction safety.

1. Introduction

The demand for survival and development of human beings and the exploration of unknown areas [1,2,3] have promoted the continuous expansion of underground activity space. Therefore, tunnel construction is gradually developing towards more complex environments and longer and deeper tunnels [4,5,6]. These longer, deeper tunnels with complex environments are more likely to cause high-temperature disasters and serious accidents. In the high-temperature working environment, the harsh construction conditions pose a threat to the safety and health of on-site construction personnel, easily lead to heat stress reactions such as heatstroke and heat exhaustion, and seriously affect health and work efficiency [7,8,9]. High geothermal tunnel conditions not only endanger the health of construction workers and the service life of mechanical equipment, but also reduce the stability and durability of tunnel structures [10,11,12]. Due to the harsh construction conditions of high geothermal tunnels, various cooling measures are needed, which increase the complexity and cost of construction and prolong the construction period. High-temperature environments also seriously affect the safe and efficient operation of mechanical equipment and reduce construction efficiency. High temperature also has a great influence on engineering quality [13,14,15]. For example, concrete construction requires heat insulation measures, and wind power facilities in tunnels are prone to aging and damage at high temperatures, which requires real-time detection and timely replacement. In addition, high-temperature environments also bring challenges to tunnel excavation and blasting [16,17]. Under the condition of high temperature, the nonel tube may soften and become blocked, the detonator is unstable, and there is a risk of self-explosion, which poses a great safety hazard. Thermal damage has become an important restricting factor in current tunnel construction.
Ventilation and cooling are crucial measures for reducing temperature in tunnels during construction in a high geothermal climate [18]; thus, it is especially necessary to investigate the required air volume. Wang [19] and others analyzed the influence of the emission generation formula, benchmark emission rate, and time factors on ventilation system design through case studies. The differences in air volume calculation caused by various factors were revealed, which provides a reference for tunnel ventilation design in China. Luo et al. [20] put forward a formula to estimate the ventilation required by the working face considering the heat dissipation of the equivalent heat source and the cooling effect of airflow. Subsequently, the formula for calculating the radius of the thermal regulation zone was derived. The theoretical calculation was verified by the finite element analysis model. Wang et al. [21] put forward a calculation method of tunnel ventilation considering the influence of random natural wind. Dong et al. [22] took a highway tunnel in Yunnan as an example, predicted the short-term and long-term traffic volume, calculated the emission of harmful gases during the tunnel operation, and determined the maximum air volume required for diluting harmful gases and ventilation. They established the pressure balance equation for stable airflow in the tunnel, and determined the number and arrangement of jet fans according to the maximum air volume of short-term and long-term schemes, and analyzed the influence of natural wind speed on the setting of jet fans.
The hygienic standard [23,24] in the current code clearly stipulates that the temperature in the tunnel should not be greater than 28 °C during tunnel construction. When the temperature exceeds 28 °C during tunnel construction, this kind of tunnel is generally defined as a high geothermal tunnel [25,26]. Therefore, keeping the temperature in the tunnel below 28 °C has become an essential link in the process of tunnel construction. Wang et al. [27] considered the influence of wind temperature and air volume, combined with the distribution of tunnel ground temperature, established a prediction model of environmental temperature by the finite difference method, and discussed the characteristics of environmental temperature change. Lin [28] and others established a theoretical model of tunnel temperature fields in cold regions based on turbulence, and studied the tunnel temperature field and frost damage in a cold region with negative actual annual average temperature. In order to solve the problem of thermal damage caused by hot air in a deep-buried high-speed railway tunnel to the operators, Lu et al. [29] derived a theoretical model of the front temperature changing with distance when hot air propagates in the tunnel according to the law of conservation of energy, and the air temperature changes along the deep-buried high-speed railway tunnel under different working conditions were simulated with CFD 2022 R1 software. Zhang et al. [30] analyzed the law of heat exchange in the tunnel under the condition of construction ventilation, and established the air temperature prediction model of the tunnel face. Chen et al. [4] combined the finite difference method and finite element software (COMSOL Multiphysics), and considering the initial ground temperature distribution and heat exchange of the tunnel face, established a numerical model that can quickly calculate the longitudinal temperature field of the tunnel construction environment. Xu et al. [31] and Gao et al. [32] studied the tunnel temperature distribution and smoke spread distance through scale model tests, and quantitatively analyzed the variation law of tunnel longitudinal temperature under different fire heat release rates and smoke emissions. According to the basic heat transfer equation of surrounding rock and air, Jiang [33] predicted and analyzed the radial and axial surrounding rock temperatures throughout a tunnel by using the analytical solution of the surrounding rock temperature, and quantitatively analyzed the cooling effect of different insulation layers on the lining. This article is based on a high-temperature tunnel project, using convective heat transfer theory and theoretical analysis calculation methods to clarify the contribution of various heat sources to the required air volume during tunnel construction. At the same time, by changing the construction conditions, important environmental parameters that determine the value of ventilation volume are revealed. This conclusion is used to avoid high-temperature disasters and serious accidents caused by long and deep tunnels in complex environments.

2. Calculation Method for Construction Ventilation Cooling Parameters

2.1. Heat Source

In the design of forced ventilation and tunnel ventilation, the following heat sources are usually considered in the construction of high geothermal tunnels:
(1) The convective heat Q 1 between surrounding rock and the tunnel basin is calculated as follows:
According to Newton’s cooling formula, the following is true:
q = h ( T w T f )
where q is the heat flux (W·m−2); h is the surface heat transfer coefficient (W·m−2·°C−1); T w is the heat transfer wall temperature (°C), taking 40 °C; and T f is the temperature of the heat transfer fluid (°C).
  • (Note: When the fluid is cooled, the above formula changes to q = h ( T f T w ) .)
The calculation formula of Q 1 is
Q 1 = h A 1 ( T w T f )
where Q1 and A1 are the heat flux (W) and convective heat transfer area (m2), respectively.
In this project, the empirical formula of the surface heat transfer coefficient at the proximal end of the plug-shaped cave construction in “Mine Ventilation and Air Conditioning” [34] can be used to calculate the following:
h T = λ ϕ 1.77 R 3 F
Within this equation, the following are true:
ϕ = 1 + 1.77 F
F = a t R 0 2
R 3 = R 0 L + R 0 2
R 0 = 0.564 A 2
where λ is the thermal conductivity of rock (W·m−1·°C−1), taking 2.97 W·m−1·°C−1; a is the thermal conductivity of rock (m2·h−1), taking 2.7 × 10⁻³ m2·h−1; t is the ventilation time (h); R 0 is the calculated radius of the tunnel (m), taking 3.37 m; A 2 is the tunnel section area (m2), which is 35.7 m2; and L is the length of the tunnel cooling section (m), taking 80 m.
(2) The heat dissipation power of the tunnel face Q 2 is calculated as follows:
Q 2 = h T A 2 ( T w T f )
(3) For the mechanical cooling power Q 3 , the main consideration is the release of the remaining heat energy after the effective power of the diesel oil of the construction vehicle is removed. The calculation formula is
Q 3 = ( 1 e ) i = 1 n K i N i H i 60
where e is the ratio of effective power to total power of diesel engine, taking 40%; K i is the effective working time ratio of each diesel vehicle; N i is the number of some diesel vehicles; and H i is the rated power of each diesel vehicle (W).
(4) For the dispersed power Q 4 of new blasting slag, the heat dissipation of high-temperature new slag generated after the blasting of the tunnel face is mainly considered. Under the assumption that the new slag has enough heat dissipation near the tunnel face and does not dissipate heat during transportation, the following is true:
Q 4 = m c s Δ T 4 t 4
where m = A 2 l ρ s ; c s is the specific heat capacity (J·kg−1·°C−1) of the new blasting slag, taking 820 J·kg−1·°C−1; Δ T 4 is the temperature change (°C) before and after the cooling of new blasting slag; l is the excavation footage (m), taking 1.5 m; ρ s is the surrounding rock density (kg·m−3), taking 2610 kg·m−3; and t4 is the cooling time (s).
(5) The personnel cooling power is Q5. This part of the heat is the heat generated by the construction personnel engaged in labor, which can be calculated according to the following formula:
Q 5 = j = 1 n K j N j H j
where K j , N j , and H j are, respectively, the effective working time ratio of the workers, the number of workers in a certain type of work, and the cooling power of the workers in the corresponding type of work (W).
The schematic diagram of each heat source is shown in Figure 1.

2.2. Calculation Method for Required Air Volume

In the absence of other auxiliary cooling measures, the calculation of the required air volume V of the high geothermal tunnel should be as follows:
V = t 1 Q 1 + t 2 Q 2 + t 3 Q 3 + t 4 Q 4 + t 5 Q 5 Δ T ρ f c f t
where t i is the duration (s) of each heat source; Δ T is the temperature difference (°C) between the fresh air temperature and the temperature required by the specification of 28 °C, which is 8 °C; ρ f is the average density of air (kg·m−3), taking 1.29 kg·m−3; c f is the specific heat capacity of air at constant pressure (J·kg−1·°C−1), taking 1013 J·kg−1·°C−1; and t is the ventilation time (s), taking 1.0 h.
In Formula (12), all parameters except t i can be obtained by on-site monitoring or consulting data. According to the division of a single cycle operation process, t i can be valued separately.
It is stipulated that t i / t = μ i is the relative heat dissipation time. Its value is shown in Table 1.
The values in Table 1 consider the actual construction situation: (1) There is basically no locomotive and vehicle operation and personnel operation in the first stage, and the heat sources mainly consider Q1, Q2, and Q4. (2) Assuming that the heat transfer process of new slag in the second stage has ended, the relative heat dissipation time is taken as 0. (3) The third stage also does not consider the new ballast heat dissipation, and the relative heat dissipation time is 0.

2.3. Calculation Parameters

According to the design documents and site conditions of the project supported by this article, the values Ki and Kj refer to the working hours of vehicles and personnel. The H j value is from a reference in the literature [35]. The use of workers and machinery in a single cycle of tunnel excavation is shown in Table 2 and Table 3.

2.4. Calculation Results for Air Demand

According to the calculation formulas and parameters in the last two sections, the heat dissipation and air demand of the heat source in the three stages of a single cycle are shown in Table 4.
It can be seen from the calculation results that the unstable convective heat transfer coefficient hT at the proximal end of the tunnel face is 6.58 (W·m−2·K−1), and the calculation result is small. This is because there is less heat transfer because the surrounding granite rock has a low specific heat capacity and low thermal conductivity. For the ventilation and smoke exhaust stage, 57.58 m3·s−1 of air volume is needed overall. The air volume contributed by Q1 accounts for a large proportion, followed by Q4, and finally Q2. In the drilling construction and slag support stages, Q4 is no longer present, and Q1’s air volume contribution completely dominates. Other heat sources are essentially insignificant.

2.5. Analysis of Influencing Parameters of Air Demand

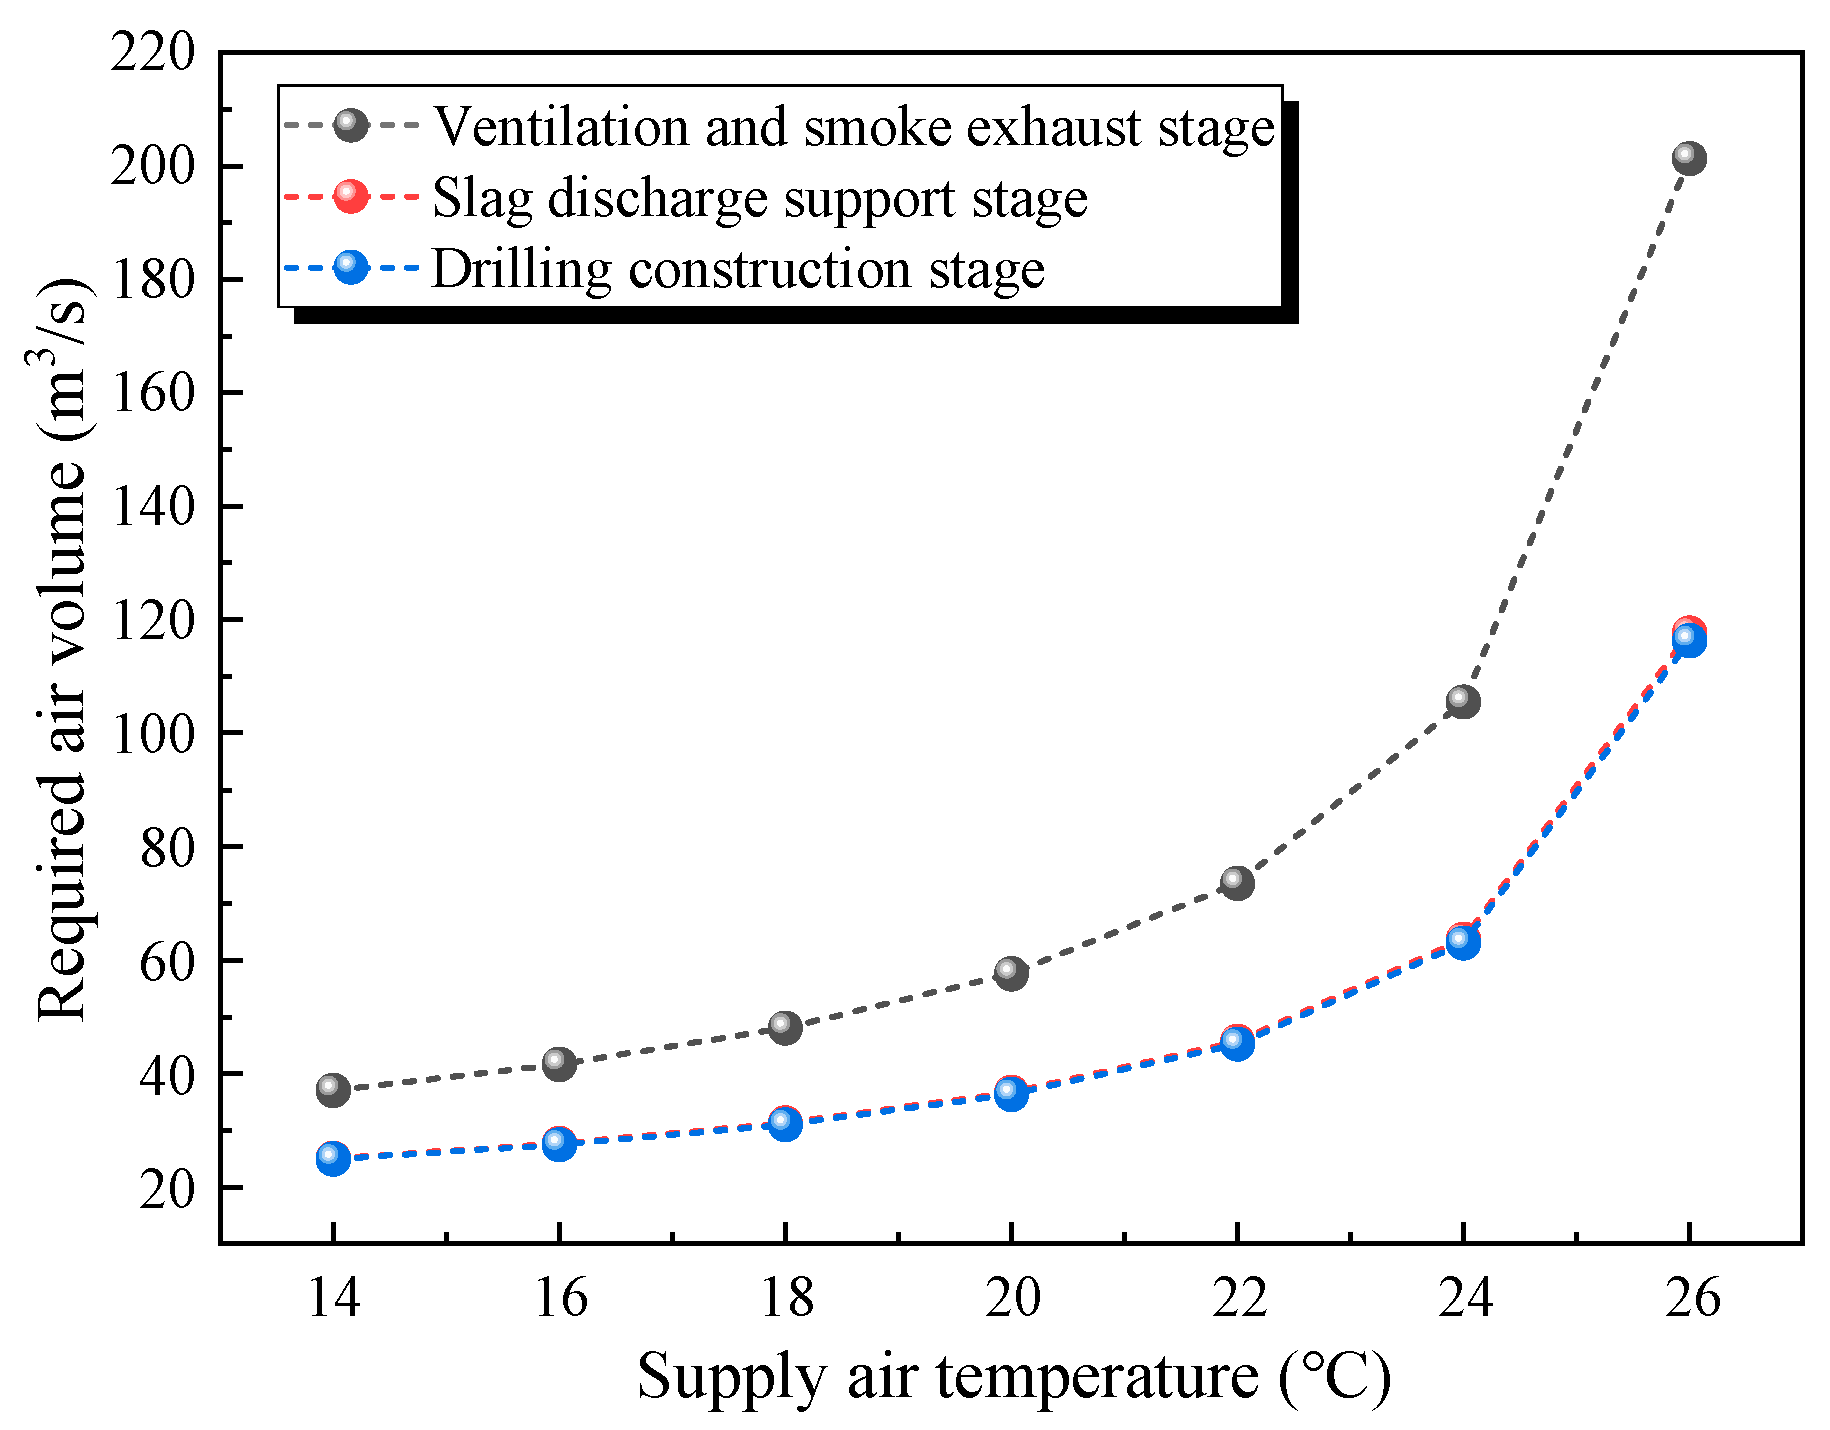
2.5.1. Supply Air Temperature

Seven supply air temperatures of 14 °C, 16 °C, 18 °C, 20 °C, 22 °C, 24 °C, and 26 °C were set up to calculate the required air volume, and the calculation process was the same as that in the previous section, as shown in Figure 2.
Figure 2 shows a similar change curve of air demand in the slag support and drilling construction stages. As the fresh air temperature rises, so does the air demand. The closer the supply air temperature is to 28 °C, the higher the demand. When the supply air temperature is raised from 14 °C to 20 °C, the increase in air demand is small, namely 20.5 m3·s−1 in the ventilation and smoke exhaust stage and 11.4 m3·s−1 in the last two stages. As can be seen from the figure, the difference between the supply air temperature and the wall temperature in the construction ventilation cooling should not be less than 8 °C; otherwise, the ventilation cost and energy consumption will be greatly increased, and the ideal cooling effect cannot be achieved.

2.5.2. Length of Cooling Section

Eight cooling section lengths of 50 m, 60 m, 70 m, 80 m, 90 m, 100 m, 110 m, and 120 m were set up to calculate the required air volume, as shown in Figure 3.
Figure 3 shows that the air volume change curves needed for the drilling construction stage and the slag discharge support stage are comparable, and that the required cooling section length and air volume requirement are essentially linearly increasing. The cooling distance rises to 120 m from 50 m. With an increase rate of 0.22 m3·s−1, the air volume needed in the ventilation and smoke exhaust stage goes from 49.9 m3·s−1 to 65.8 m3·s−1, and in the final two stages, it climbs from 28.9 m3·s−1 to 44.6 m3·s−1. This demonstrates that the wall air temperature has a greater effect on the necessary air volume than does the length of the cooling section.

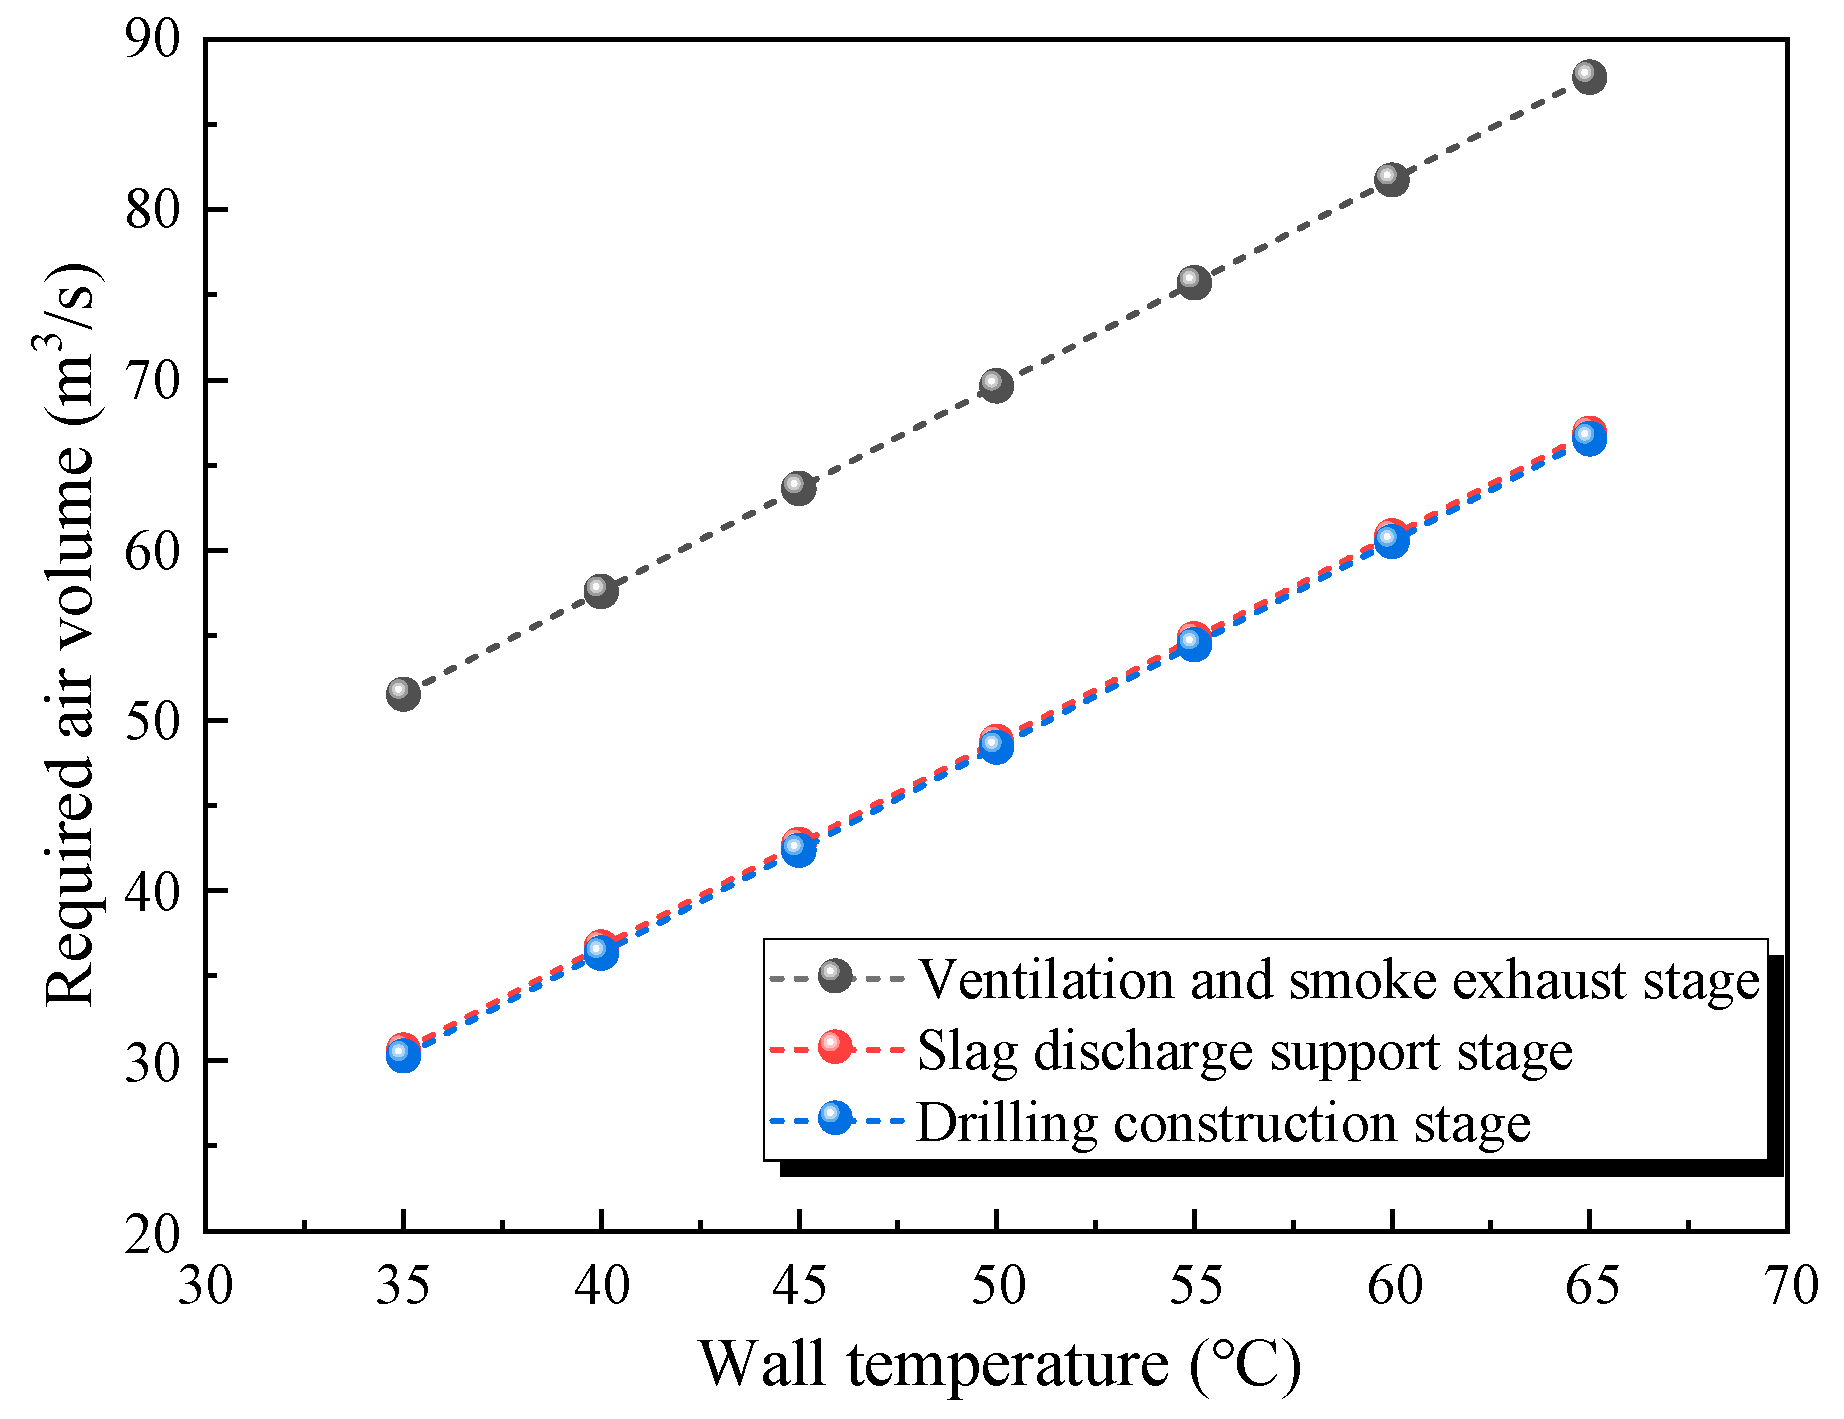
2.5.3. Wall Temperature

Seven wall temperatures of 35 °C, 40 °C, 55 °C, 60 °C, 65 °C, 70 °C, and 75 °C were set to calculate the required air volume, as shown in Figure 4.
The required air volumes in the drilling construction stage and the slag retaining stage change curves are similar, as shown in Figure 4, and the wall temperature increased from 35 to 75 °C. The required air volume in the ventilation and smoke exhaust stage increased from 51.5 to 87.8 m3·s−1, and the required air volume in the final two stages increased from 30.5 to 66.7 m3·s−1. The figure also shows that the curves of the three stages are parallel and coincident, resulting in a growth rate of 1.21 m3·s−1·°C−1, while the cooling length increased from 50 to 120 m. This shows that the wall temperature has a greater influence on the required air volume than different cooling lengths.

3. Temperature Field Prediction Method for High Geothermal Tunnels

3.1. Calculation Principle

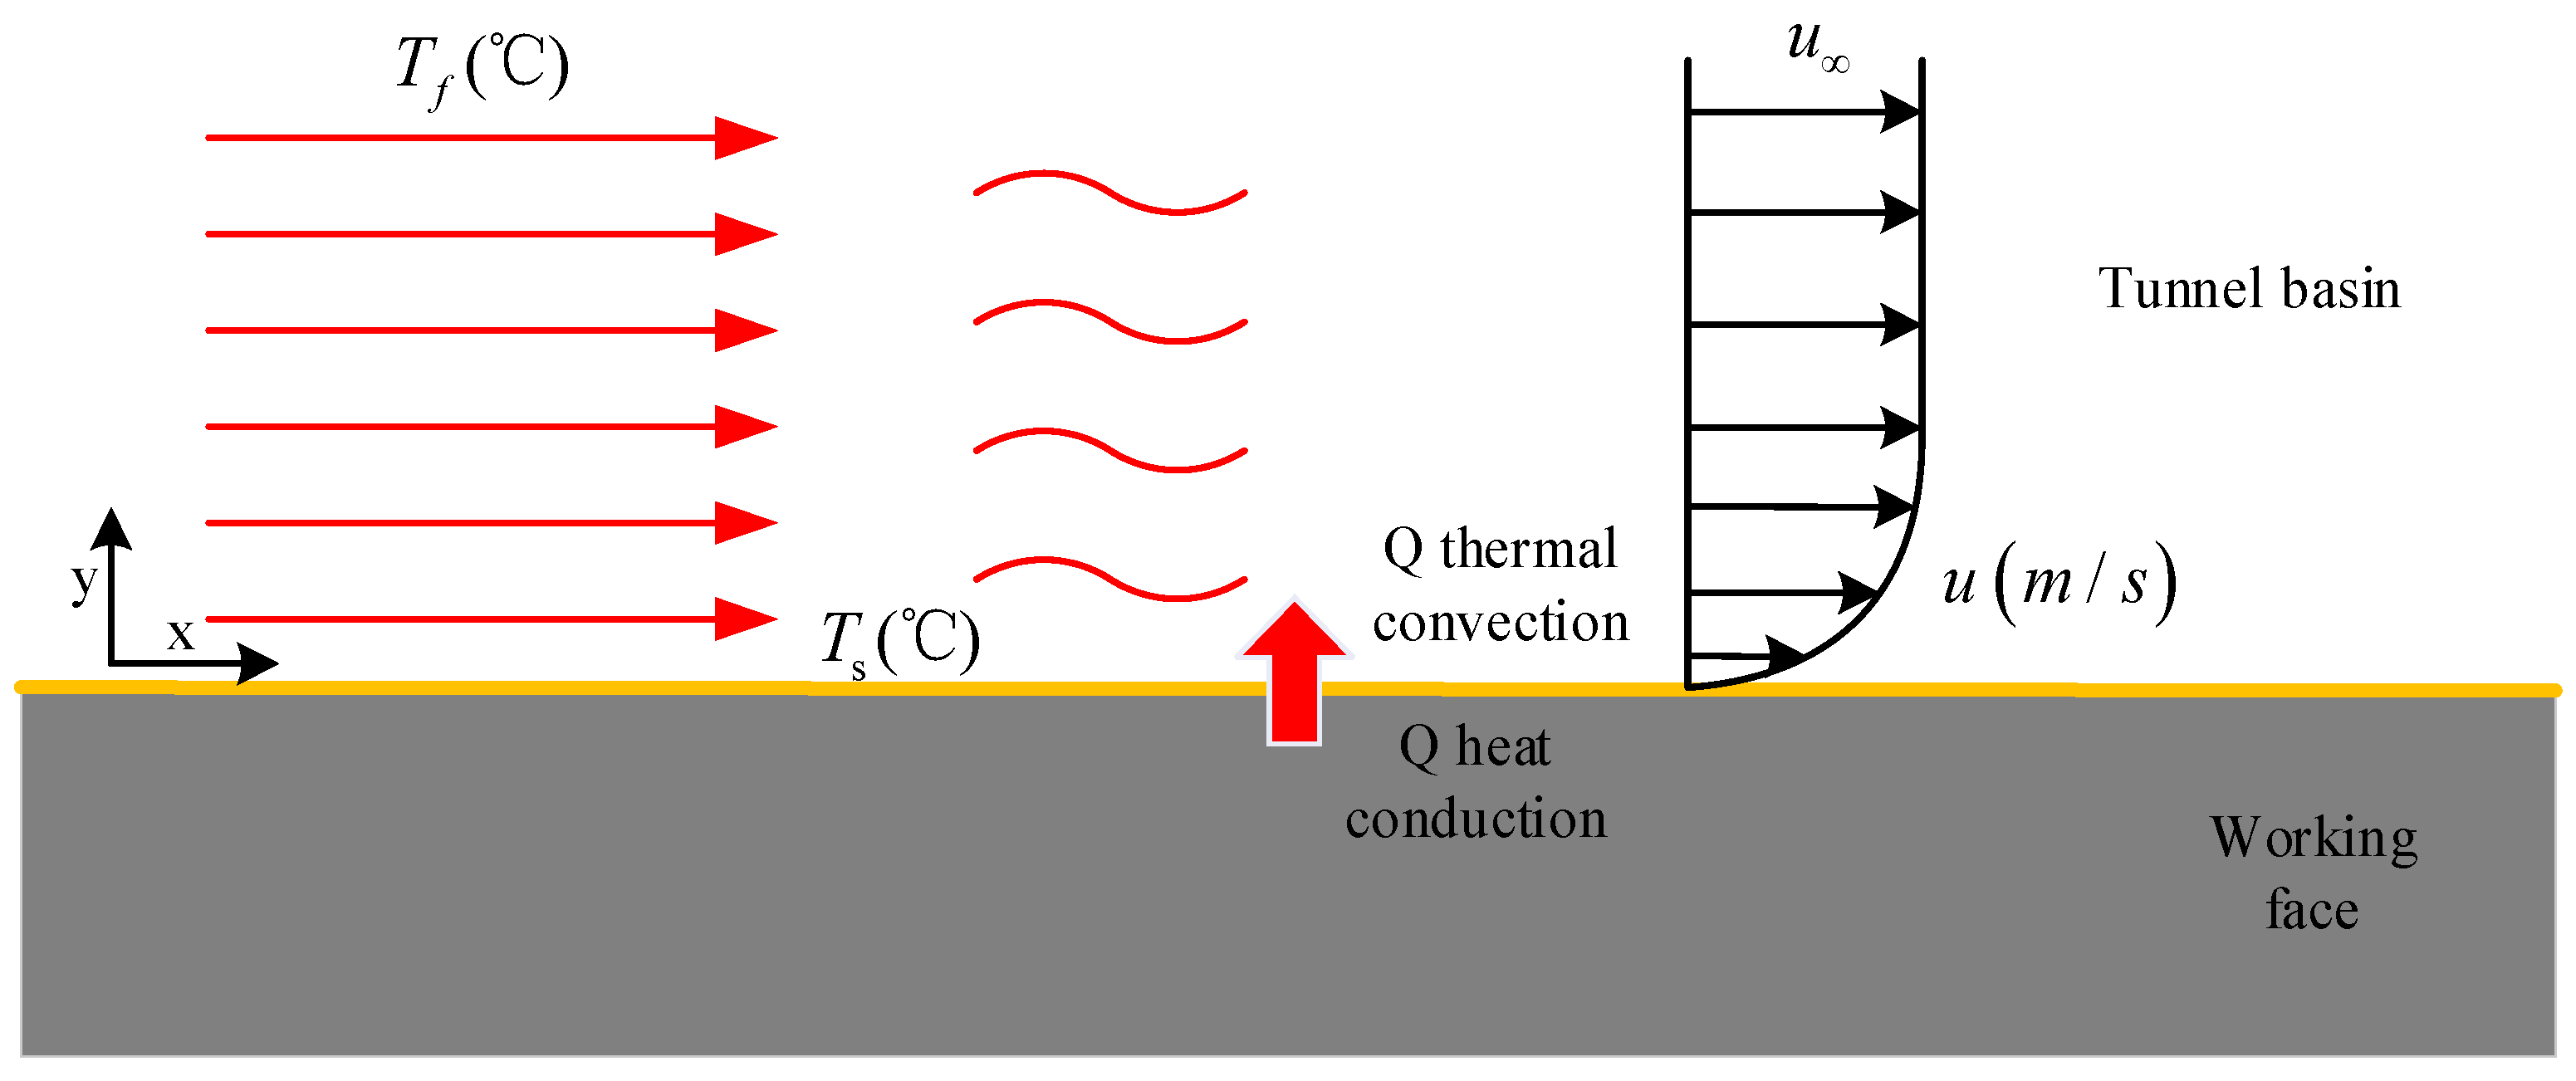
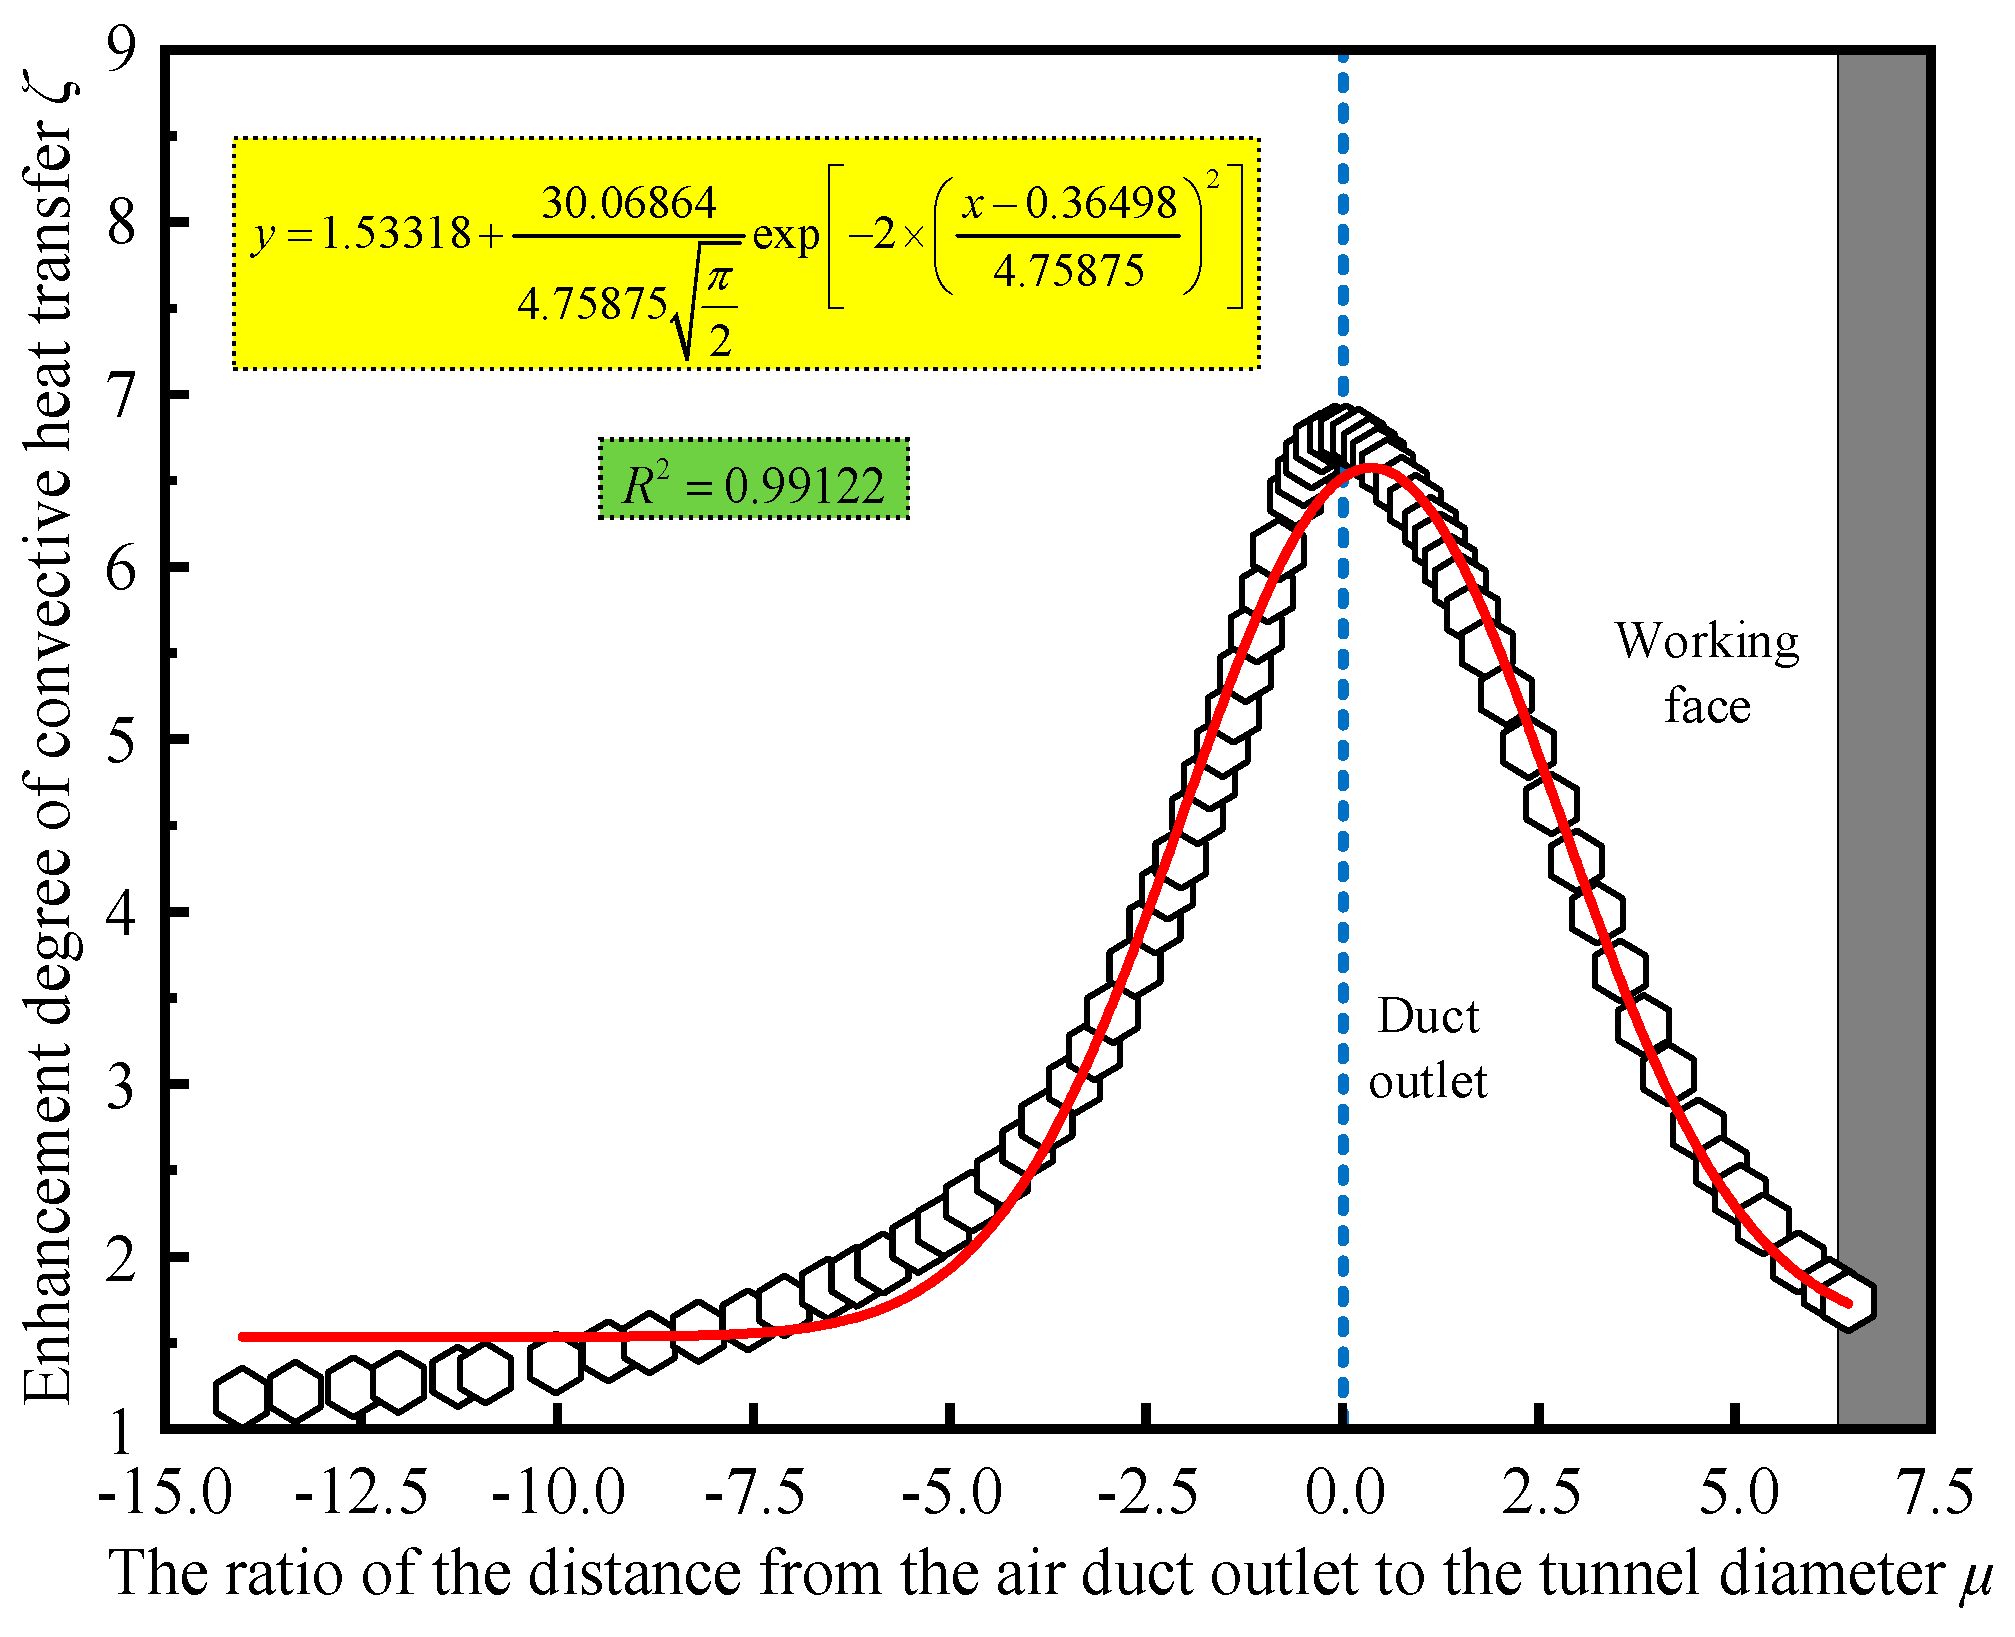
3.1.1. Convective Heat Transfer Theory

Thermal convection refers to the relative displacement between the various parts of a fluid caused by the macroscopic motion of the fluid, and the heat transfer process caused by the mixing of cold and hot fluids [36,37]. Thermal convection only occurs in fluid. At the same time, due to the irregular thermal motion of the molecule, thermal convection is also accompanied by the occurrence of heat conduction. In engineering, when a fluid flows through the surface of an object, the heat transfer process between the fluid and the surface of the object is called convective heat transfer. The basic calculation formula is the Newton cooling formula:
q = h Δ t
where h and ∆t are the surface heat transfer coefficient (W·m−2·°C−1) and the temperature difference between the wall temperature and the fluid temperature (°C), respectively.
The effect of heat transfer can be divided into forced convection heat transfer and natural convection heat transfer according to the cause of flow. The former is generated by external power sources, such as pumps, fans, etc., while the latter is usually caused by the density difference inside the fluid. When a viscous fluid flows on a wall, due to the viscous effect, the flow velocity gradually decreases and the fluid is in a non-slip state at the wall; that is, the fluid does not flow relative to the wall at the wall. This situation is called the non-slip boundary condition, as shown in Figure 5.
The fluid layer at the wall is very thin and does not flow relative to the wall, so heat transfer must occur through this layer of fluid. In this case, the energy can only pass through the non-flowing fluid layer by thermal conduction. Therefore, it can be concluded that the heat of convective heat transfer is equal to the heat conduction of the adherent fluid layer, as follows:
q = λ t y y = 0
where t / y y = 0 and λ respectively represent the fluid temperature change rate (°C·m−1) and the fluid thermal conductivity (W·m−1·°C−1) along the normal direction of the wall surface.
Combined with Newton’s cooling formula (13), the following is true:
h = λ Δ t t y y = 0
The ventilation and cooling process of high geothermal tunnel construction is primarily convective heat transfer between the airflow and the wall; the above formula relates the surface heat transfer coefficient with the temperature field of the fluid, and it is a common formula in most research methods of convective heat transfer. Determining the value of the convective heat transfer coefficient is crucial to accurately predict the distribution law of the tunnel temperature field.

3.1.2. Important Characteristic Numbers of Convective Heat Transfer

(1)
Nusselt number ( N u )
For the convective heat transfer process on a solid wall, the form of Formula (13) is changed and combined with Formula (14):
h ( t w t f ) = λ t y y = 0
Taking ( t w t f ) as the temperature scale and a certain characteristic size l of the heat exchange surface as the length scale, the above formula is dimensionless:
N u = h l λ = ( t w t ) / ( t w t f ) ( y / l ) y = 0
The dimensionless number h l / λ is the Nusselt number N u , which represents the convective heat transfer performance and is linearly related to the convective heat transfer coefficient.
(2)
Reynolds number ( R e )
The formula for calculating the Reynolds number ( R e ) is
R e = ρ v d η
where ρ is the fluid density (kg·m−3); v is the fluid velocity (m·s−1); d is the pipe diameter (m); and η is the dynamic viscosity (N·s·m−2).
The Reynolds number ( R e ) reflects the ratio of inertial force to viscous force in liquid flow. The larger the ratio is, the more significant the influence of inertial force is. The form of fluid motion tends to be a turbulent and vigorous turbulent flow. The smaller the ratio is, the more significant the influence of viscous force is. The form of fluid motion tends to be a laminar flow.
(3)
Prandtl number ( P r )
The Prandtl number ( P r ) is defined as the ratio of the dynamic viscosity of the fluid to the thermal diffusion coefficient, namely
P r = η α
where η and α represent the dynamic viscosity (N·s·m−2) and thermal diffusivity (m2·s−1), respectively.
Prandtl number ( P r ) is used to describe the relative contribution between the fluid’s momentum transfer characteristics and heat transfer characteristics. The greater the fluid’s momentum transfer ability, the weaker the heat transfer ability.

3.1.3. The Connection between the Characteristic Numbers

Although the Newton cooling formula (13) can describe the relationship between some convective heat transfer coefficients and related factors, the factors affecting convective heat transfer are diverse. Different flow forces, flow states, fluid phase transitions, and geometric shapes of heat transfer surfaces constitute various types of convective heat transfer phenomena. Therefore, the surface heat transfer coefficient characterizing the convective heat transfer intensity is a complex function that depends on many factors.
Tunnel construction ventilation is a typical single-phase forced convection heat transfer process, and the surface heat transfer coefficient h can be expressed as
h = f ( μ , l , ρ , η , λ , c p )
where μ is the fluid velocity (m·s−1); l is a characteristic length (m) of the heat exchange surface; ρ is the fluid density (kg·m−3); η is hydrodynamic viscosity (N·s·m−2); λ is the thermal conductivity of fluid (W·m−1·°C−1); and c p is the specific heat capacity of fluid at constant pressure (J·kg−1 °C−1).
According to the dimensional analysis method, Formula (20) consists of seven physical quantities and time dimension T, length dimension L, mass dimension M, and temperature dimension Θ ; that is, n = 7, r = 4. μ , l , λ , and η can be selected as basic physical quantities, and finally they can be combined into three dimensionless quantities.
π 1 = h u a 1 l b 1 λ c 1 η d 1
π 2 = ρ u a 2 l b 2 λ c 2 η d 2
π 3 = c p u a 3 l b 3 λ c 3 η d 3
According to the dimensions of the seven physical quantities ( dim h = M Θ 1 T 3 , dim   l = L , dim   λ = M L Θ 1 T 3 , dim   η = M L 1 T 1 , and dim   u = L T 1 ), the coefficients to be determined are equal, including the following:
π 1 = h u 0 d 1 λ 1 η 0 = h d λ = N u
π 2 = ρ u l η = R e
π 3 = η c p λ = P r
Therefore, Formula (20) can be transformed into
N u = f ( R e , P r )

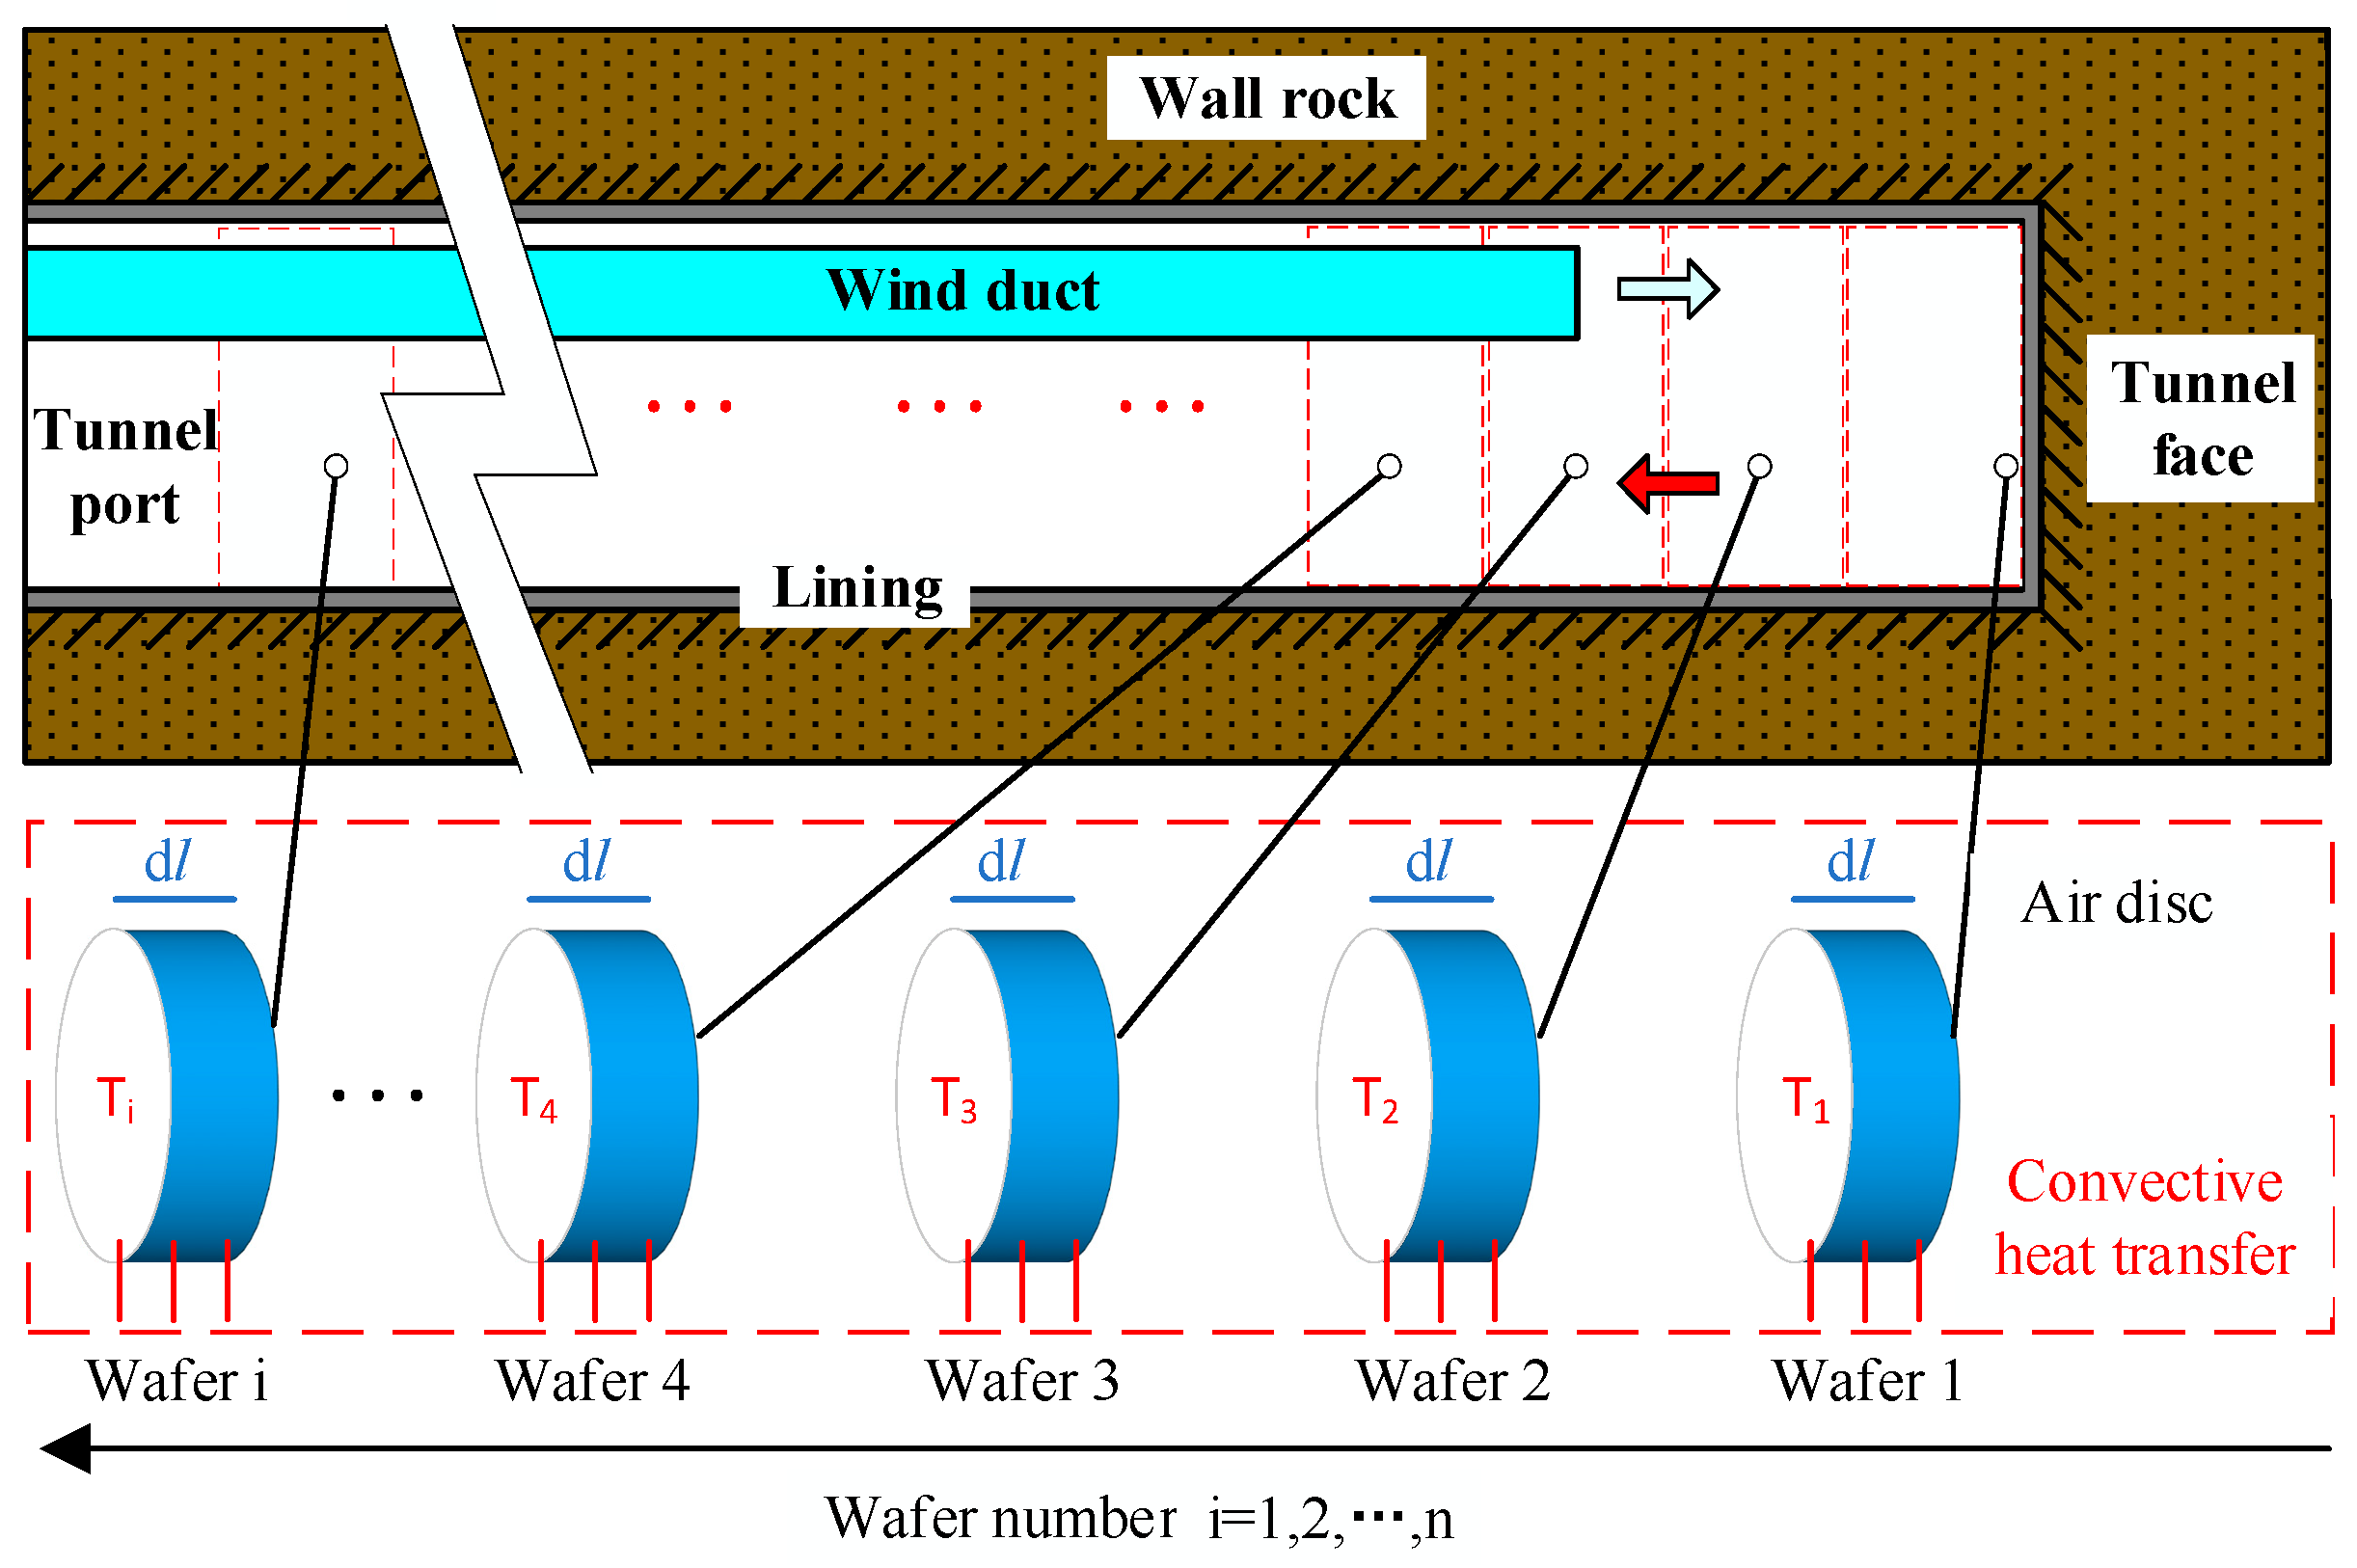
3.2. Calculation Method

3.2.1. Experimental Correlation Formula

From the above analysis, it can be concluded that N u is a function of R e and P r . After a lot of experiments and analysis, researchers usually describe the relationship between the three by constructing a power function considering the applicability and convenience of the formula:
N u = C   R e n   P r m
The parameters, such as C, n, and m, can be obtained by fitting the experimental curve. The most commonly used formula in this form is the Dittus–Boelter equation [38], and its expression is as follows:
N u f = 0.023   R e f 0.8   P r f n
where n = 0.4 when heating the fluid and n = 0.3 when cooling the fluid.
When the convective heat transfer coefficient is solved by Formula (29), the characteristic length is taken as the inner diameter d of the tube. At the same time, it has been verified that the applicable range of this equation is R e f = 104~1.2 × 10⁵, P r f = 0.7~120, l / d ≥ 10. This formula is the most widely used formula for calculating forced convection heat transfer in pipelines, but usually the accuracy of this formula is low and it is suitable for estimation in engineering.
Another commonly used formula for calculating the convective heat transfer coefficient is the Gnielinski [39] formula, which is as follows:
N u = f / 8 R e 1000 P r 1 + 12.7 f / 8 1 / 2 P r 2 / 3 1 1 + d l 2 / 3 c t
f = 1.8   l g R e 1.5 2
c t = T f T w 0.45
where d is the pipe diameter (m); l is the pipe length (m); f is the Darcy resistance coefficient of turbulent flow in the pipe; c t is the temperature difference correction coefficient; and T f is the average temperature of the fluid and T w is the wall temperature, both of which are taken as the thermodynamic temperature unit K.
The scope of application of Formula (30) is R e f = 2300~106, P r f = 0.6~105, and the characteristic length is the inner diameter of the tube d. The Gnielinski formula has an advantage over the Dittus–Boelter equation in that it calculates the convective heat transfer coefficient more precisely by accounting for the aspect ratio and pipeline resistance. Consequently, the Gnielinski formula serves as the foundation for the tunnel temperature forecast method used in this work.

3.2.2. Computational Hypothesis

Tunnel construction ventilation is a typical forced convection heat transfer process. The following presumptions are established in order to determine the distribution law of the tunnel temperature field following ventilation and cooling:
(1)
The prediction method only considers the heat source of surrounding rock;
(2)
The heat transfer form of air and the rock wall in the tunnel is a single-phase forced convection heat transfer process;
(3)
The ventilation time is sufficient, and the convective heat transfer process in the tunnel has been fully carried out;
(4)
After the fresh air reaches the tunnel face and forms the return air, it develops into a stable airflow. The starting point of the prediction formula is the tunnel face.

3.2.3. Calculation Process and Preparation

According to Assumption (3), the convective heat transfer process in the tunnel has been fully carried out; that is, the convective heat transfer heat generated by the return air passing over the surrounding rock has all acted on the tunnel temperature, and the formula in d t time is
Q = A h Δ t d t = ρ S c p Δ T d l
And for the formula d l = u d t , the following is true:
Q = A h Δ t = ρ u S c p Δ T
where Q is the heat generated by convection heat transfer in the tunnel (J); A is the convective heat transfer area (m2); Δ t is the temperature difference between the wall temperature and the air attached to the wall (°C); ρ is the air density (kg·m−3); u is the return air speed (m·s−1); S is the tunnel cross-sectional area (m2); c p is the specific heat capacity of the air at constant pressure (J·kg−1·°C−1); and Δ T is the temperature change in the air (°C).
h is the surface heat transfer coefficient (W·m−2·°C−1), and according to Formulas (17) and (30), the following is true:
h = f / 8 R e 1000 P r 1 + 12.7 f / 8 1 / 2 P r 2 / 3 1 1 + d l 2 / 3 λ c t d
The tunnel return airflow is divided into continuous similar air circle segments, and the convective heat transfer process of each part of the air circle is similar. The difference is that the temperature of each part is different, as shown in Figure 6.
Taking the air temperature T1 near the tunnel face of wafer 1 as the initial temperature, the Δ t 1 in Formula (35) is determined. At the same time, h1 is determined by determining the airflow state in the tunnel, and the convective heat transfer heat in the air disc of d l length is calculated. All the heat is used for the temperature rise of the air disc in this section. Raising air temperature yields T2, which is then used to calculate Ti. Similarly, Δ t 2 is used as the starting condition for the wafer 2 calculation. In this way, the temperature distribution law along the longitudinal direction of the tunnel can be obtained by computational recursion.
Considering the convenience of data processing, the length of a single air disc is 1 m for the purpose of calculation. At the same time, the thermophysical properties of air have a great relationship with temperature. As shown in Table 5, the calculation parameters need to be updated every time the next wafer is calculated.
As can be seen from the above table, the specific heat capacity of air does not change much in the range of −50 °C~100 °C, and 1.005 (kJ·kg−1·°C−1) is taken in the calculation process. The variations in air density ρ , thermal conductivity λ , thermal diffusivity a , and dynamic viscosity η with temperature and their fitting curve functions are shown in Figure 7.
According to reference [40], there is a tunnel–air convective heat transfer enhancement area near the air duct outlet during tunnel ventilation, and the peak point of convective heat transfer enhancement appears at a distance of about 2 times the tunnel diameter before the air duct outlet, as shown in Figure 8.
Based on Figure 8, assuming the outlet of the air duct as the origin and the positive x direction as the tunnel heading direction, the fitting curve and equation of convective heat transfer enhancement near the outlet of the air duct are obtained as shown in Figure 9.
To obtain better prediction results, the convective heat transfer coefficient can be calculated using the fitting equation shown in Figure 9. The recursive form of the tunnel temperature prediction method is shown in Formula (36), in which the variables are the same as those above, and i represents the parameters of the i-th air disc.
h i = f i / 8 R e i 1000 P r i 1 + 12.7 f i / 8 1 / 2 P r i 2 / 3 1 1 + d l 2 / 3 λ i c t i d i ζ i Δ T = A h i Δ t i ρ i u S c p i T i + 1 = T i + Δ T i i = 1 , 2 , 3 , n
where ζ i is the enhancement coefficient of the convection heat transfer coefficient; the other symbols have the same meanings as above.

4. Study on Temperature Field Distribution Law of High Geothermal Tunnels

4.1. Design of Work Conditions

A circular cross-section tunnel was designed as the research object for this prediction method, taking the conditions of a small section tunnel with a high ground temperature as a reference. The high geothermal tunnel has a total length of 13,326 m and a maximum buried depth of 887 m. The section size is about 36 m2. According to the geological survey report, the surrounding rock of the tunnel is broken, the geology is extremely complicated, the long-distance single-head heading face is narrow, the construction environment temperature is high, and the tunnel cooling is difficult. The deep hole ground temperature of the tunnel was measured, and the measured ground temperature was 22.6~26.3 °C. The geothermal gradient was 0.36~1.54 °C/100 m, and the temperature in the tunnel was 28~37.04 °C. The design parameters are shown in Table 6.
The initial parameters of the air temperature calculation are shown in Table 7.

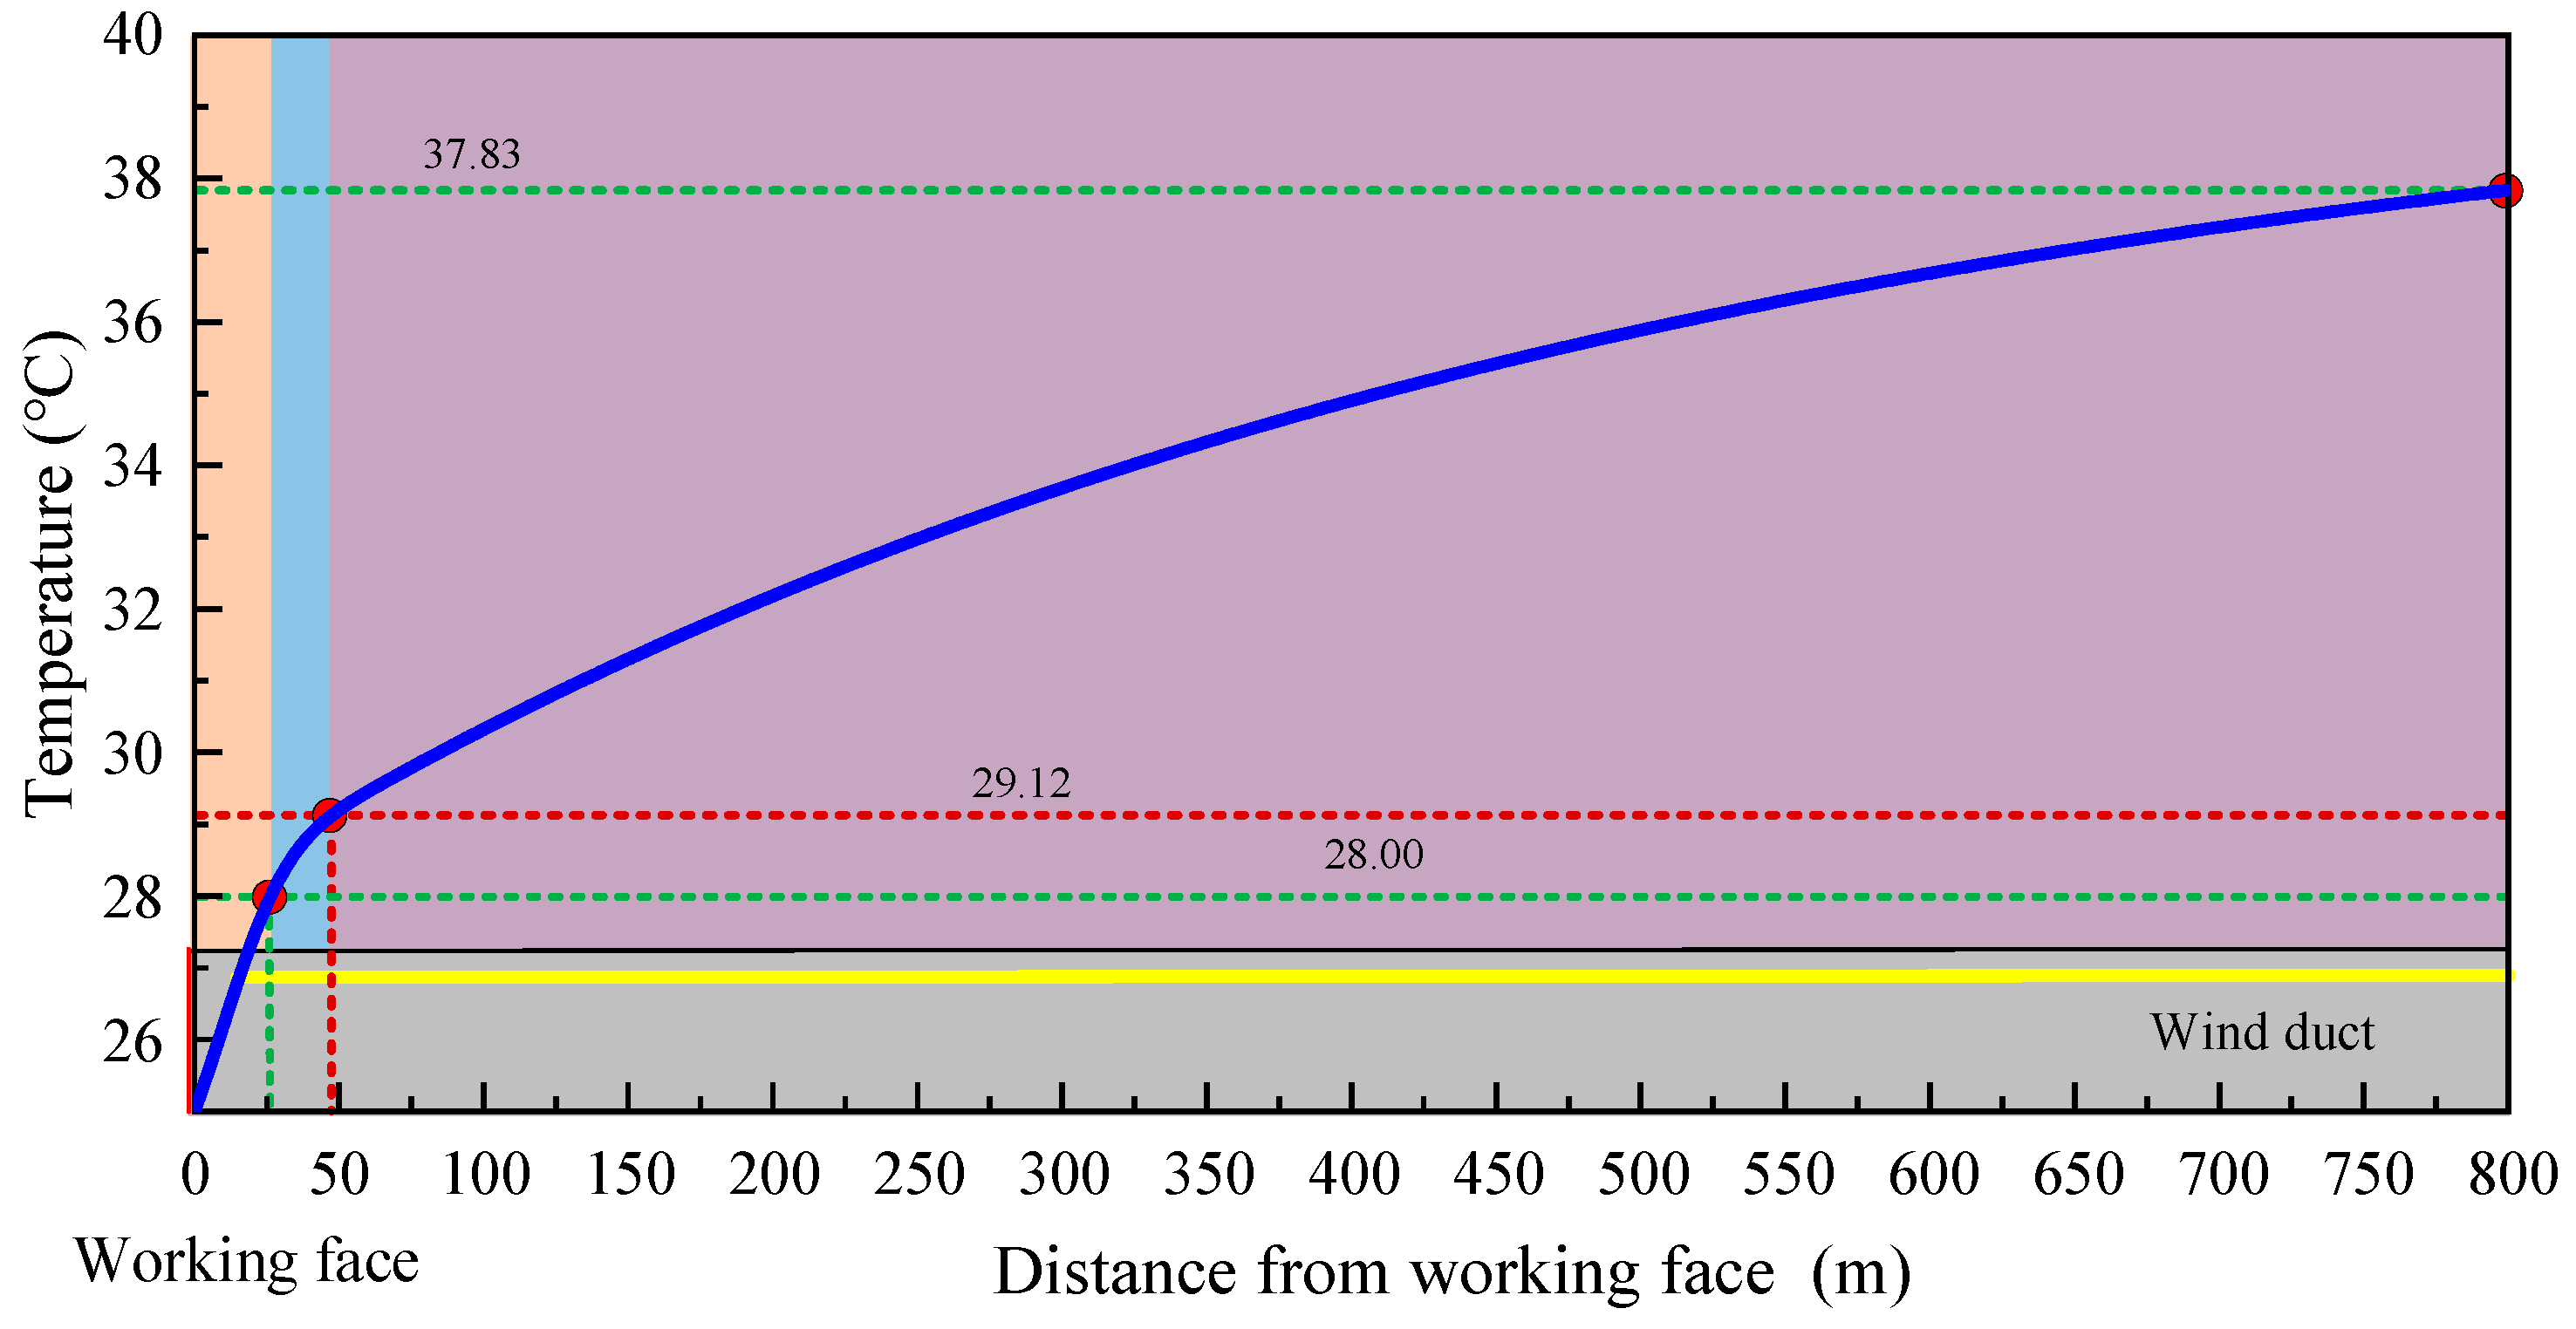
4.2. Analysis and Verification of Prediction Results

Taking Table 7 as the initial calculation condition, it can be marked as the distance from the tunnel face (x = 0 m), and the distribution law of the temperature field within 800 m from the tunnel face can be calculated, as shown in Figure 10.
Figure 10 illustrates how the temperature of the tunnel increases from 25 °C at the tunnel face to 37.83 °C at 800 m. At 26 and 50 m, respectively, the temperature growth rate significantly drops. In the first stage, the temperature rises at a rate of approximately 0.125 °C/m2, in the second stage, 0.0367 °C/m2, and in the third stage, 0.0116 °C/m2. The “Code for Construction of Railway Tunnels” states that the tunnel face temperature cannot be more than 28 °C, and the maximum distance that satisfies the requirements is around 30 m.
A three-dimensional numerical calculation model of the tunnel, including the surrounding rock structure, was built in order to confirm the prediction formula’s accuracy. The calculation grid is shown in Figure 11.
The total length of the three-dimensional model is 830 m, the length of the tunnel basin is 800 m, and the thickness of the surrounding rock is designed to be 11.6 m. The two-dimensional grid size of the tunnel basin is 0.3 m, and the longitudinal tensile length is 1 m. A 12-layer boundary layer grid is set up at the interface between the tunnel basin and the surrounding rock. The thickness of the first layer grid is set to 0.002 m, and the boundary layer growth rate is 1.2.
ANSYS Fluent is used to solve the problem, and the energy equation and k-omega turbulence model are opened during the calculation (this turbulence model can better simulate the heat transfer process of low Reynolds number fluid near the wall). The composition of surrounding rock and the wall temperature are initialized at 40 °C, and the interface between the tunnel basin and surrounding rock is set as a coupling surface, and the wall surface has no slip. The calculation mode based on the pressure solution is selected, and the steady-state calculation iteration is performed 100,000 times. The comparison between the numerical simulation and the prediction results is shown in Figure 12.
As can be seen from Figure 12, the results of the numerical simulation and prediction formula are similar. Through data analysis, it is determined that the maximum difference between the two curves is 1.06 °C, the average value is 0.218 °C, and the standard deviation is 0.132 °C. Through verification, the temperature prediction method is shown to have high accuracy and can be further analyzed for different tunnel working conditions.

5. Temperature Distribution in Tunnels under Different Calculation Conditions

5.1. Supply Air Temperature

Considering that temperatures of 28 °C and above cannot effectively cool down the tunnel construction environment, six working conditions in the range of 15~25 °C were selected for calculation, and the calculation parameter design and tunnel temperature distribution curve are shown in Figure 13.
Figure 13 clearly shows that the change in the supply air temperature does not change the overall trend that the temperature in the tunnel gradually decreases with the increase in distance. The temperature difference gradually decreases with the increase in the distance from the tunnel face, which reflects the diffusion and attenuation process of heat in the tunnel. With the increase in distance, heat is gradually lost to the surrounding environment, and the temperature difference is gradually reduced. At the same time, the curve temperature change rate enters the low-speed range at about 55 m from the working face; although the increase in the supply air temperature leads to an increase in the overall temperature in the tunnel, this effect will gradually weaken in the area far from the tunnel face. At a distance of 800 m, when the supply air temperature increases from 15 °C to 25 °C, the tunnel temperature only increases by about 1.5 °C, indicating that the direct influence of supply air temperature on the temperature is limited in the long-distance transmission process. With the increase in supply air temperature, the working area that meets the temperature range of less than 28 °C is significantly shortened, and the areas that meet the temperature range are 240 m, 200 m, 155 m, 108 m, 56 m, and 27 m, respectively.

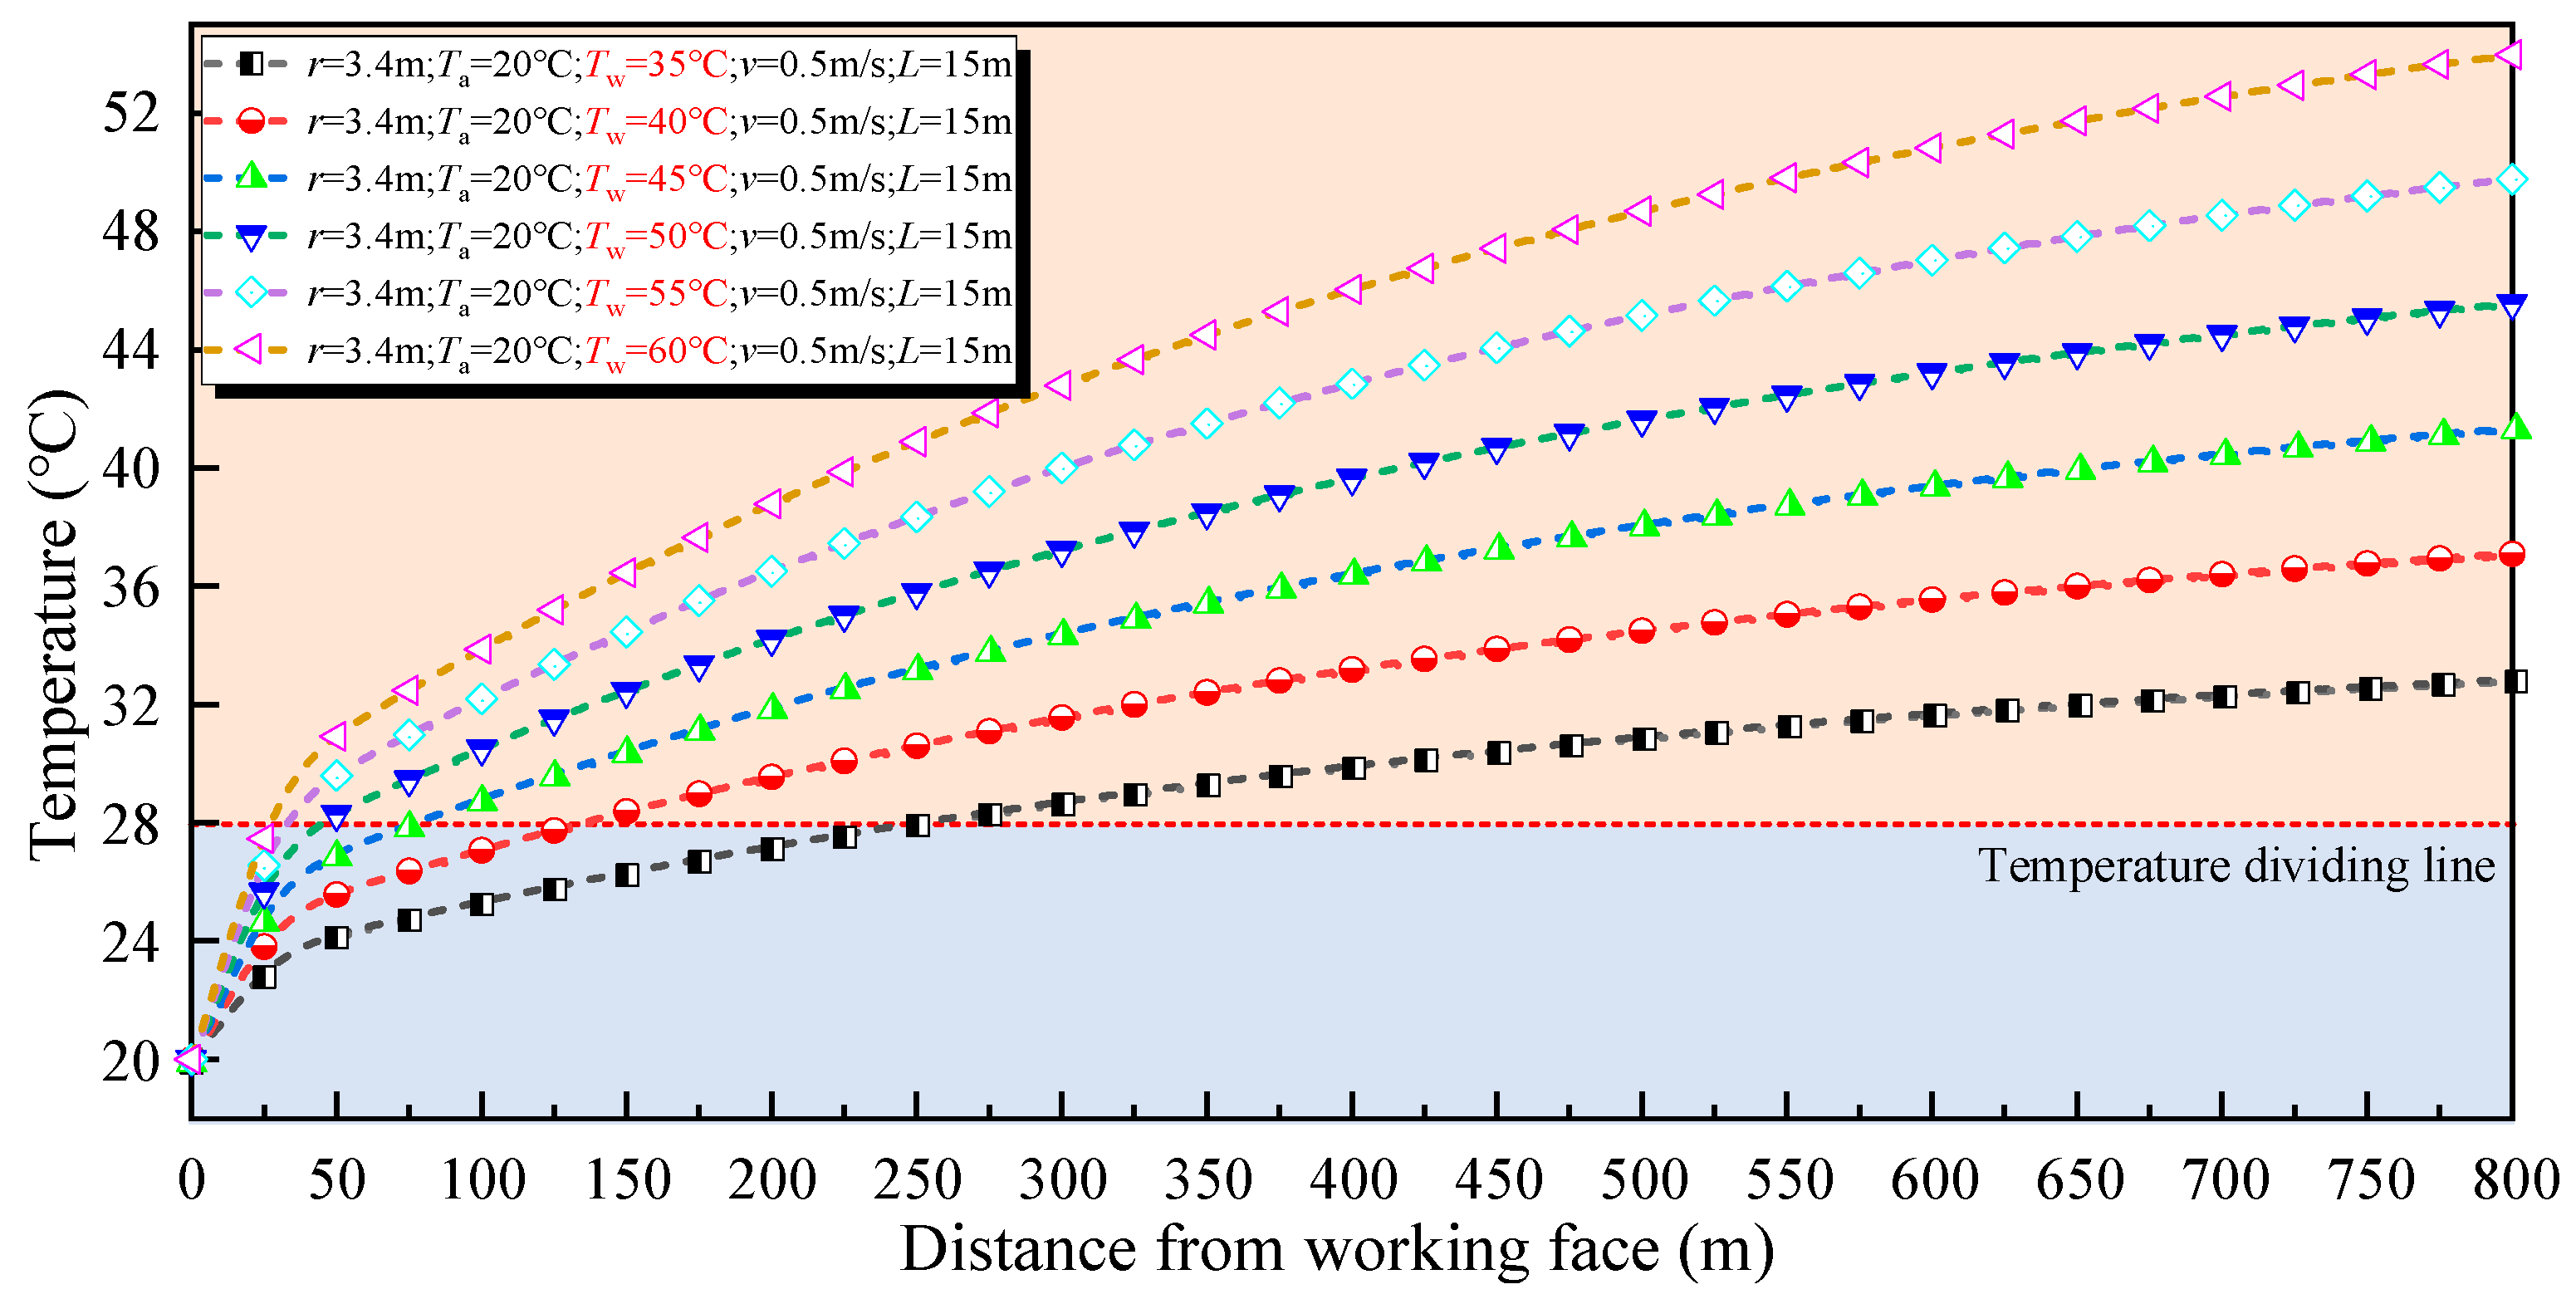
5.2. Rock Wall Temperature

Six different working conditions of the wall temperature are taken to study the temperature distribution law. The design of the working conditions and the temperature distribution curve of the tunnel are shown in Figure 14.
As can be seen from Figure 14, the increase in the wall temperature directly leads to a significant increase in the air temperature inside the tunnel, and this effect is more significant in the area far from the tunnel face. This shows that in addition to direct heat conduction, air convection and radiation heat transfer in the tunnel are also aggravating the temperature rise. The final temperature on the air temperature curve increases linearly or nearly linearly with the increase in the wall temperature, and the growth rates of the air temperature within 50 m from the tunnel face are 0.0842 °C/m, 0.112 °C/m, 0.139 °C/m, 0.166 °C/m, 0.192 °C/m, and 0.219 °C/m, respectively. In the range of 50 m~750 m, the temperature increases at the rates of 0.0115 °C/m, 0.0154 °C/m, 0.0192 °C/m, 0.0230 °C/m, 0.0269 °C/m, and 0.0307 °C/m, respectively. In the area close to the tunnel face (for example, within 50 m), the temperature increases. The increase in the wall temperature leads to a sharp reduction in the area below 28 °C (which is usually regarded as the upper limit of the comfortable or acceptable working environment temperature), and the areas below 28 °C are 250 m, 135 m, 77 m, 45 m, 34 m, and 28 m, respectively. This directly affects the working efficiency and health and safety of tunnel construction personnel, so it is necessary to take corresponding cooling measures to expand the suitable working area.

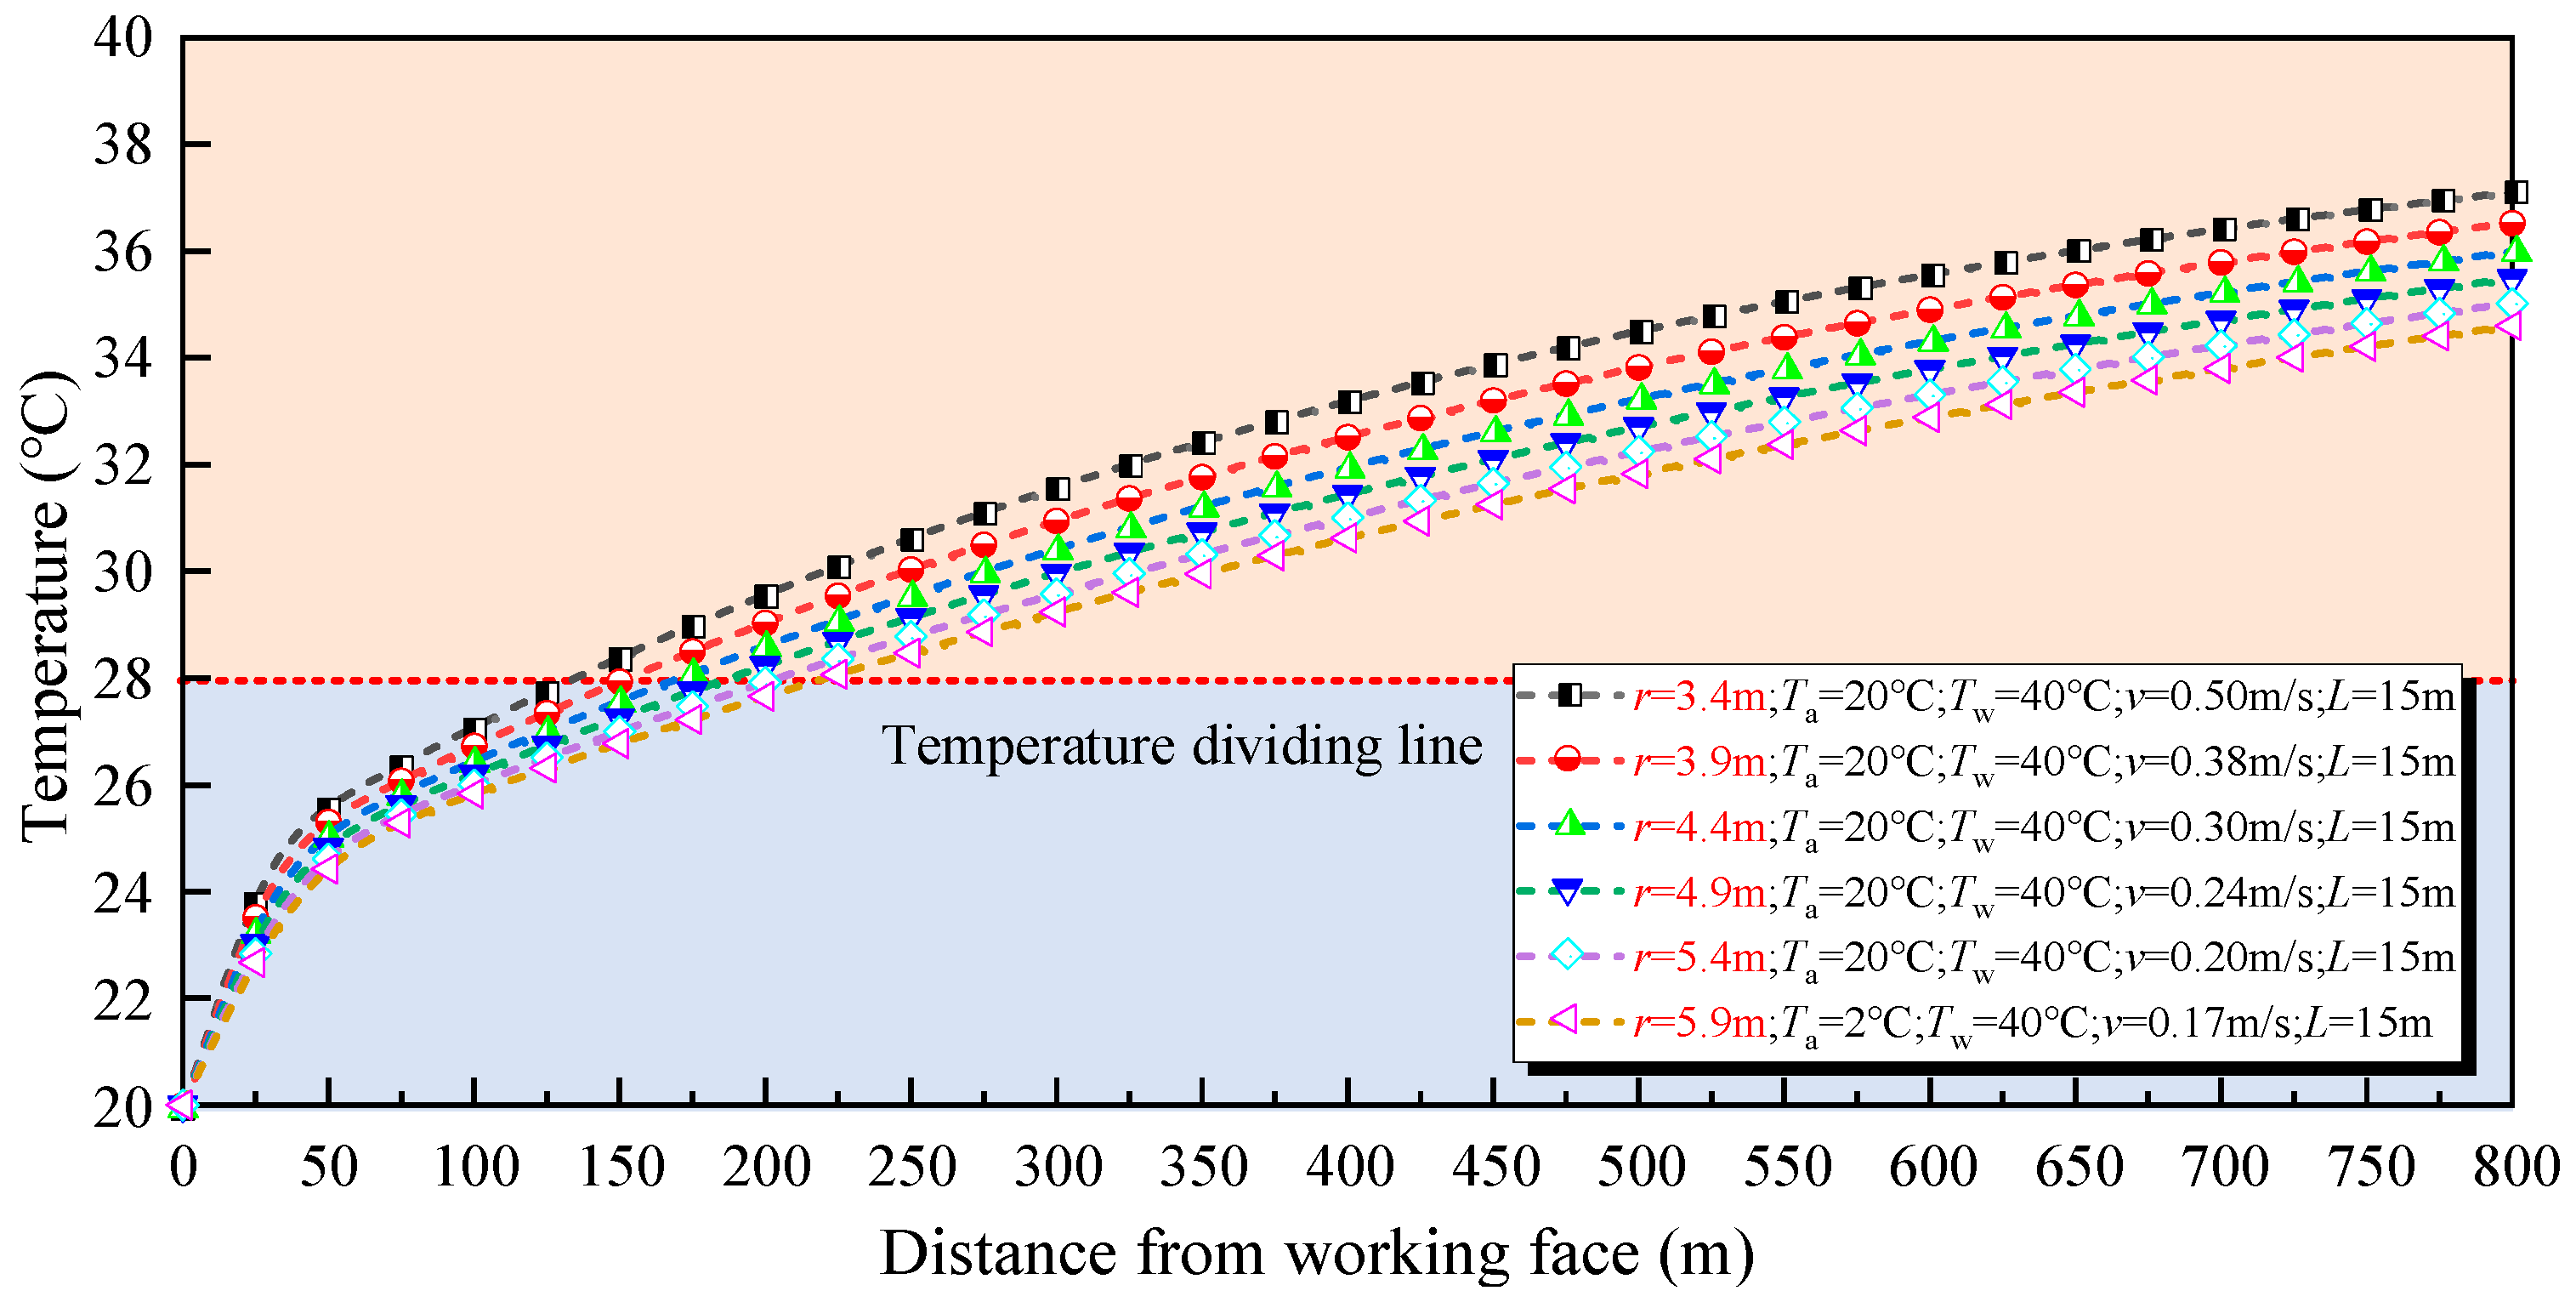
5.3. Tunnel Diameter

The design of the working conditions and the temperature distribution curve of the tunnel are shown in Figure 15. To study the law of temperature change in the tunnel, different working conditions of the tunnel radius are taken. The return air speed in the tunnel is changed accordingly to control the condition of constant ventilation.
As can be seen from Figure 15, when the tunnel cross-section is increased, the area of convective heat transfer is increased, but at the same time the surface heat transfer coefficient is reduced. The decrease in the surface heat transfer coefficient means there is a decrease in heat exchange efficiency per unit area, which offsets the effect of the increasing heat transfer area to some extent. With the increase in the tunnel’s cross-sectional area, the final temperatures of the temperature curve are 37.11 °C, 36.53 °C, 35.99 °C, 35.49 °C, 35.03 °C, and 34.60 °C, respectively; that is, with the increase in the tunnel diameter by 154 m, the temperature at the distance of 800 m from the tunnel face will drop by about 0.5 °C, and with the increase in the tunnel radius, the areas meeting the temperature range of less than 28 °C will be 135 m. On the other hand, the increase in the tunnel section also increases the overall air quality in the tunnel, which further affects the heat capacity and airflow characteristics in the tunnel. With the increase in heat capacity, the air in the tunnel can absorb more heat without a significant temperature rise, while the change in airflow characteristics may affect the distribution and transfer efficiency of heat. Larger sections may require stronger ventilation capacity to maintain air circulation and temperature control. If the ventilation system cannot be adjusted in time to adapt to the change in section size, the temperature distribution in the tunnel may be significantly affected. Therefore, one of the important measures to ensure construction safety is to reduce the air temperature in the tunnel by reasonably designing the tunnel section size and ventilation system.

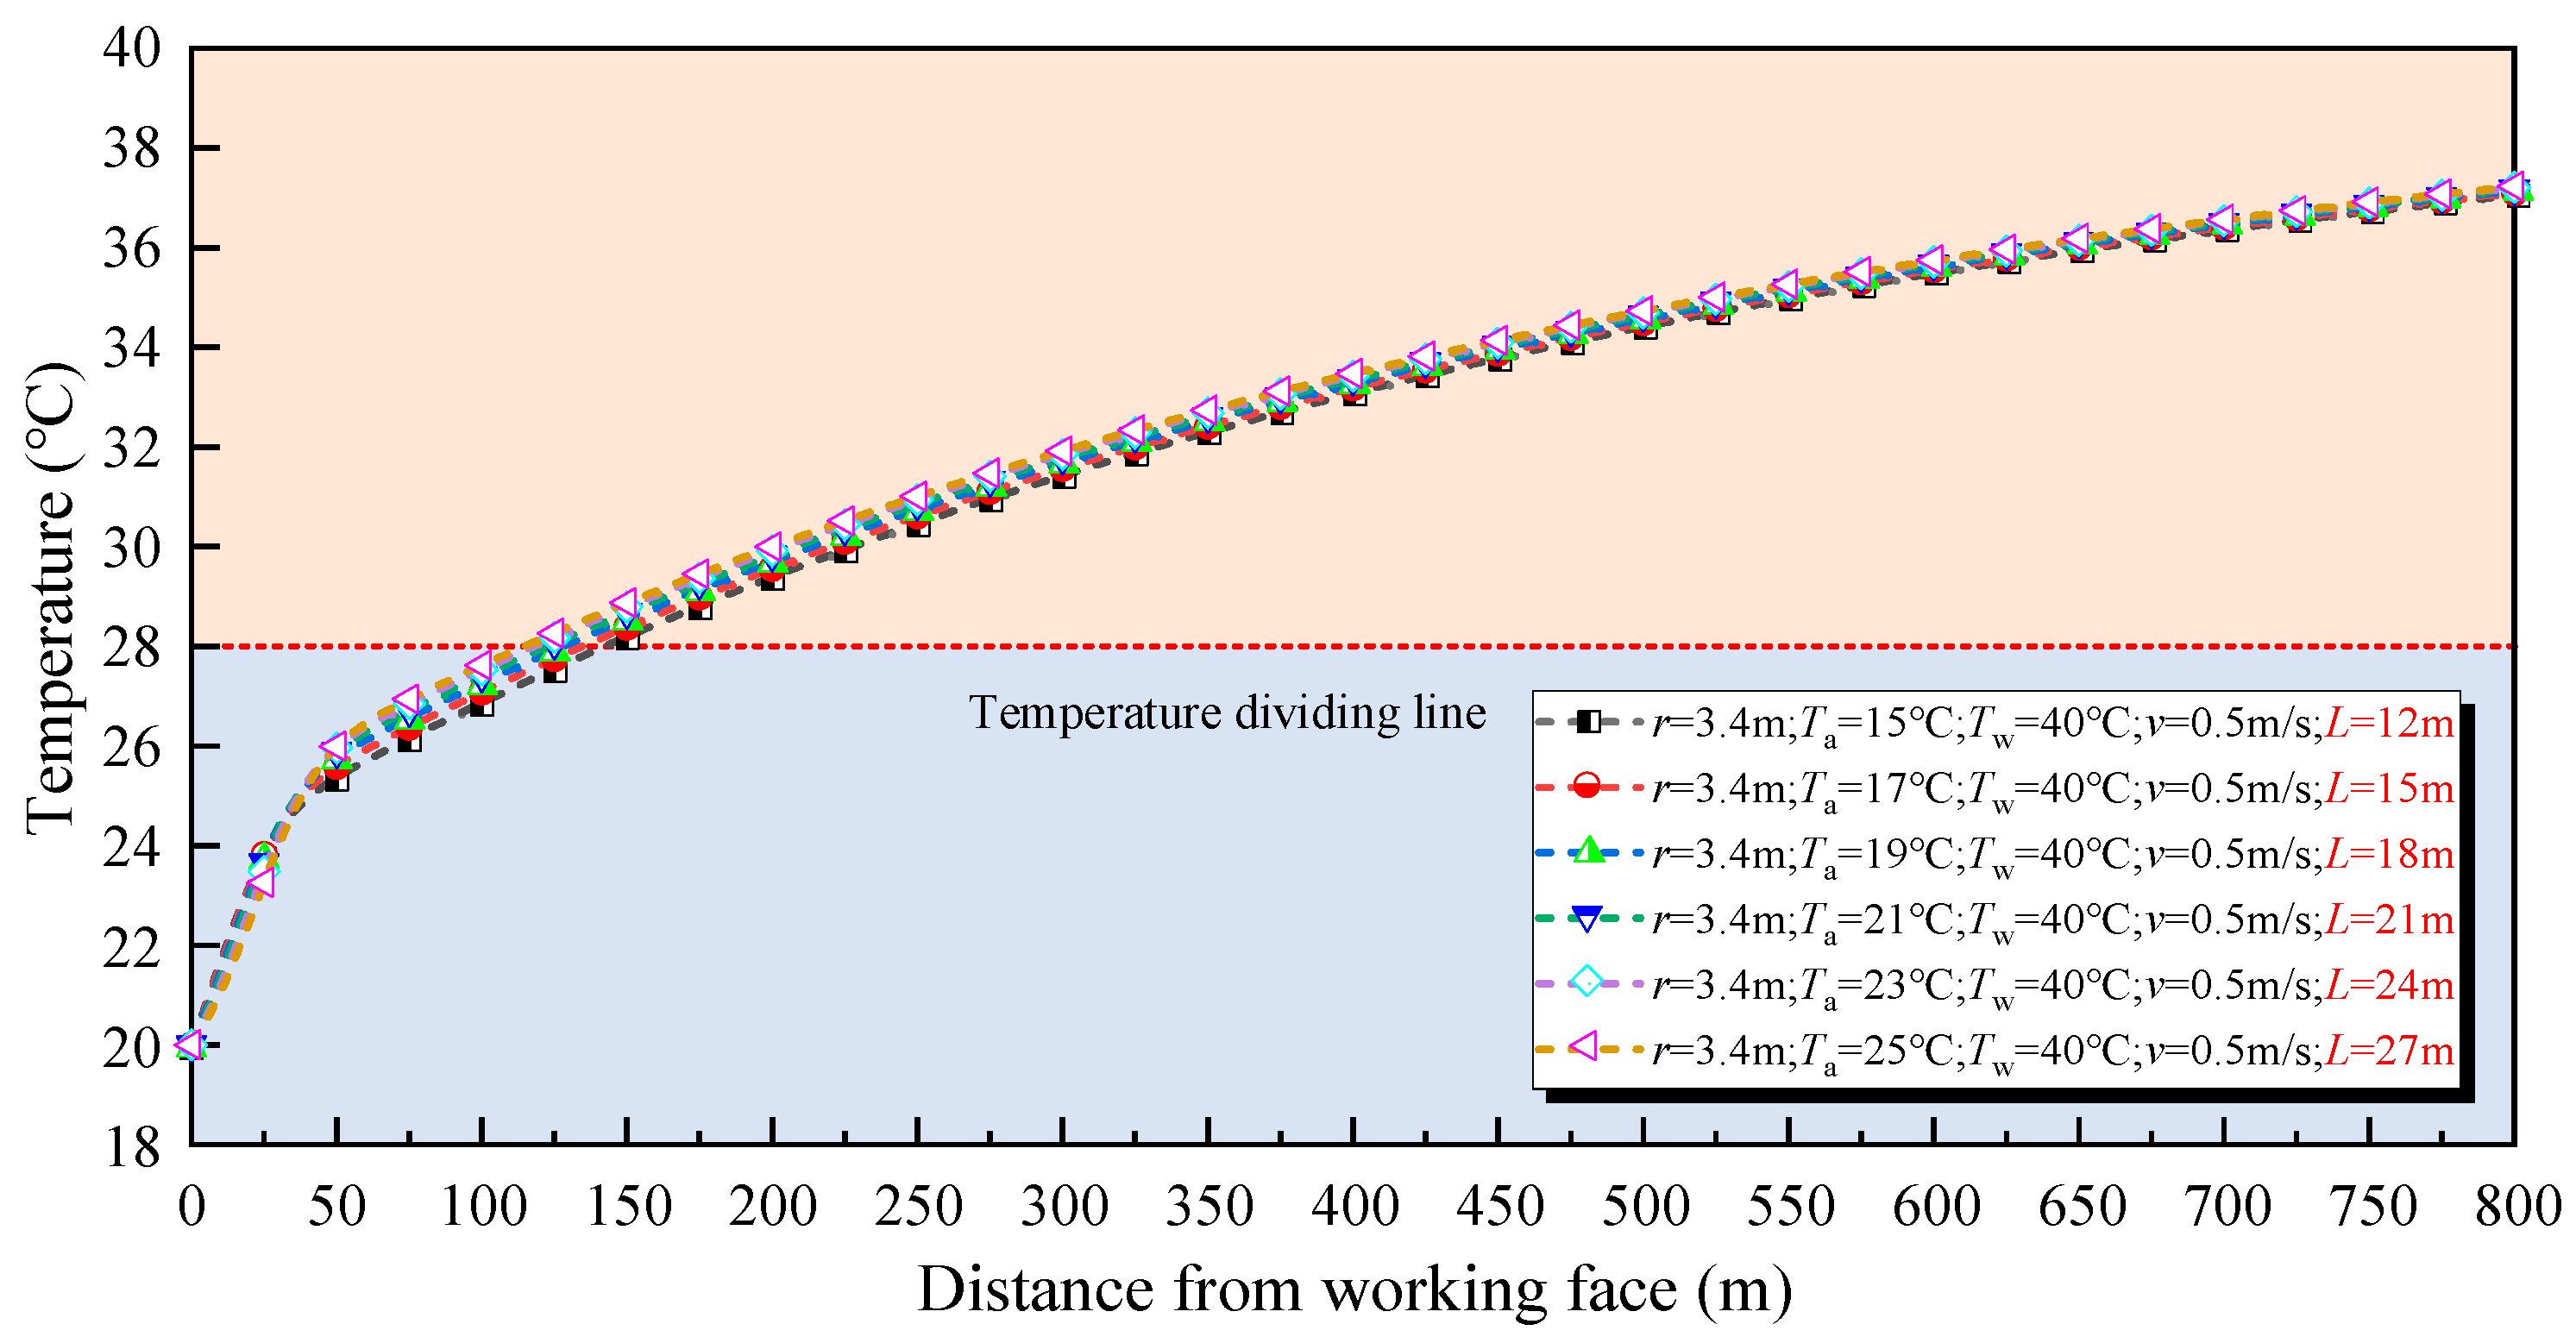
5.4. Distance between Air Duct and Tunnel Face

The variation law of air temperature in the tunnel was studied under the working conditions of different arrangement positions of air ducts. The distance between the air ducts and the tunnel face was increased from 12 m to 27 m. The design of the working conditions and the temperature distribution curve of the tunnel are shown in Figure 16.
According to the analysis of Figure 16, although the overall trend shows that the farther the outlet of the air duct is from the tunnel face, the higher the air temperature, this influence shows different intensities and characteristics in different positions in the tunnel. Especially in the area close to the tunnel face (for example, within the range of 50 m~250 m, the maximum temperature difference between 12 m and 27 m is 0.79 °C), the temperature difference is most significant, which may be due to the insufficient mixing of fresh cold air with the surrounding hot air at a short distance after it is ejected from the air duct, resulting in a large local temperature difference. With the increase in distance, the mixing process of cold air sprayed from the air duct and the original hot air in the tunnel is gradually completed, and the heat transfer tends to be uniform, so the temperature difference gradually decreases. To the area far away from the tunnel face (such as 800 m), there is almost no difference in the air temperature under each working condition, which shows that the air temperature in the tunnel has reached a relatively stable state at this time. Considering the health and safety of construction personnel and construction efficiency, the distance between the air duct and the tunnel face needs to be carefully designed. Too short a distance may lead to too low a temperature near the tunnel face, which will affect the operations of construction personnel; too long a distance may not effectively reduce the overall temperature in the tunnel. With the increase in the distance between the air duct and the tunnel face, the areas that meet the temperature range of less than 28 °C are 143 m, 135 m, 172 m, 124 m, 120 m, and 115 m, respectively.
To sum up, comparing the influence of four different parameters on the tunnel temperature, the supply air temperature increased from 15 °C to 25 °C, and the tunnel temperature increased by 1.5 °C at a distance of 800 m. The temperature of the rock wall increased from 35 °C to 60 °C, and the temperature of the tunnel at a distance of 800 m increased by 21.1 °C. The section size of the tunnel increased from 3.4 m to 5.9 m, and the temperature of the tunnel decreased by 2.5 °C at the distance of 800 m. The distance between the air duct and the tunnel face increased from 12 m to 27 m, and the maximum temperature change was 0.79 °C. It is easy to conclude that the change in rock wall temperature has the greatest influence on the temperature distribution in the tunnel, and the different placement distances of air ducts have the least influence on the temperature distribution in the tunnel. This also shows that the proportion of heat sources in the first chapter is consistent, and the convection heat transfer between the surrounding rock and the tunnel basin accounts for the majority. The temperature distribution of different supply air temperatures and rock wall temperatures is highly unified with the demand for air volume in the second chapter. The higher the supply air temperature and the rock wall temperature, the higher the temperature in the tunnel and the higher the demand for air volume.

6. Conclusions

There may be a complex coupling relationship among many factors influencing the temperature field distribution in high geothermal tunnels. The difference between theoretical models and actual situations makes it difficult to accurately predict the temperature field distribution in tunnels, and the establishment of a temperature field prediction model in high geothermal tunnels may not be able to be extended to other high-temperature tunnels. In this paper, the theoretical calculation method is used to predict the distribution law of air demand and the temperature field in the ventilation process of high-ground-temperature tunnel construction, the changes in air demand and the temperature field under different environmental parameters are studied, and the main conclusions are as follows:
(1)
Increasing the air temperature greatly increases the required air volume. The closer the supply air temperature is to 28 °C, the more the air volume needs to be increased. The difference between the supply air temperature and the wall temperature in the construction ventilation cooling should not be less than 8 °C; otherwise, the ventilation cost and energy consumption will be greatly increased, and the ideal cooling effect cannot be achieved at the same time. Both the curve of air demand–cooling section length and the curve of air demand–wall temperature show a linear growth relationship.
(2)
The change in supply air temperature has little effect on the temperature far away from the tunnel face. When the supply air temperature increases from 15 °C to 25 °C, the tunnel temperature at 800 m distance increases from 36.3 °C to 37.8 °C.
(3)
The wall temperature has a great influence on the tunnel temperature, and changing the wall temperature significantly increases the growth rate of the temperature; within 50 m away from the tunnel face, the temperature increases at rates of 0.0842 °C·m−1, 0.112 °C·m−1, 0.139 °C·m−1, 0.166 °C·m−1, 0.192 °C·m−1, and 0.219 °C·m−1, respectively.
(4)
The increase in the tunnel cross-section increases the convective heat transfer area, but at the same time, it reduces the surface heat transfer coefficient and increases the total air mass, which has a greater influence on the air temperature. With the increase in the tunnel cross-sectional area, the final temperatures on the temperature curve are 37.11 °C, 36.53 °C, 35.99 °C, 35.49 °C, 35.03 °C, and 34.60 °C, respectively; that is, the temperature at a distance of 800 m from the tunnel face drops by about 0.5 °C for every 10 m increase in the tunnel diameter.
(5)
Changing the distance between the air duct and the tunnel face has little influence on the temperature distribution law, and the general trend is that the farther the outlet of the air duct is from the tunnel face, the higher the temperature is. From the tunnel face to a distance of 800 m, the temperature difference under different working conditions first increases and then decreases, especially in the range from 50 m to 250 m from the tunnel face, but there is almost no difference in the temperature under different working conditions at 800 m.

Author Contributions

G.W. proposed the research plan and framework of ideas for this article and completed the writing—original draft; Y.F. provided financial support for the research on this project and investigated the geological conditions and distribution of buildings and structures within the study area; K.R. carried out numerical simulation after receiving the processed data, and analyzed and verified the prediction results; F.D. provided detailed temperature parameters, highway tunnel size data, and other information for this study; B.W. processed the data collected during the construction and optimized the readability of the chart; H.Z. optimized the organizational structure of the article and offered useful suggestions for the preparation and writing of the paper. All authors have read and agreed to the published version of the manuscript.

Funding

This study is financially supported by the technology projects of the Transportation Department of Guizhou Province (2023-122-007), and the Fundamental Research Funds for Central Universities (2682024ZTPY030, 2682023KJ001, and 2682023CX072). We are also very grateful to the National Natural Science Foundation of China (NSFC) for support under Grant No. 51508477.

Data Availability Statement

The original contributions presented in the study are included in the article, further inquiries can be directed to the corresponding author.

Acknowledgments

We also highly appreciate the data collection and processing work of Guizhou Road and Bridge Group Co., Ltd. and the Key Laboratory of Transportation Tunnel Engineering of Southwest Jiaotong University. Finally, the authors would like to thank the reviewers for their useful comments and the editors for improving the manuscript.

Conflicts of Interest

Author Guofeng Wang was employed by the company Guizhou Road and Bridge Group Co., Ltd. Author Yongqiao Fang, Kaifu Ren and Fayi Deng were employed by the company Guizhou Road and Bridge Group Co., Ltd. 1 ST Branch. The remaining authors declare that the research was conducted in the absence of any commercial or financial relationships that could be construed as a potential conflict of interest.

References

  1. Huang, L.H.; Huang, S.; Lai, Z.S. On the Optimization of Site Investigation Programs Using Centroidal Voronoi Tessellation and Random Field Theory. Comput. Geotech. 2020, 118, 103331. [Google Scholar] [CrossRef]
  2. Tao, Y.C.; Hu, H.; Zhang, H.; Zhang, G.; Hao, Z.H.; Wang, L. A new ventilation system for extra-long railway tunnel construction by using the air cabin relay: A case study on optimization of air cabin parameters length. J. Build. Eng. 2022, 45, 103480. [Google Scholar] [CrossRef]
  3. Xu, D.L.; Zhang, X.H.; Chen, W.; Jiang, X.; Liu, Z.; Bai, Y. Utilisation of the Deep Underground Space in Shanghai. Proc. Inst. Civ. Eng. Munic. Eng. 2019, 172, 218–223. [Google Scholar] [CrossRef]
  4. Chen, X.; Zhou, X.H.; Zhong, Z.X.; Liang, N.H.; Wang, Y.; Zhang, X.Y. Study on Temperature Field and Influencing Factors of the High Geothermal Tunnel with Extra-Long One-End Construction Ventilation. Int. J. Therm. Sci. 2023, 191, 108322. [Google Scholar] [CrossRef]
  5. Li, C.; Jiang, Z.A.; Zhang, G.L.; Feng, X.; Zeng, F.B. Dust Pollution during Shotcrete Process in High-Altitude Tunnel Based on Numerical Simulation. Particuology 2023, 75, 82–95. [Google Scholar] [CrossRef]
  6. Zhang, H.; Zhao, Y.Q.; Zhang, G.; Tao, Y.C.; Ge, Z.H. The Dust Pollution Characteristic after Tunnel Blasting and Related Influence Parameters by Using Experimental Method. Tunn. Undergr. Space Technol. 2024, 148, 105752. [Google Scholar] [CrossRef]
  7. Zhang, H.; Sun, J.C.; Xiang, F.; Wang, L.; Tu, P. Assessment method to deal with the wall face roughness in the tunnel construction and its application. J. Saf. Environ. 2019, 19, 217–225. [Google Scholar]
  8. Zhang, H.; Hao, Z.H.; Zhang, G.; Tao, Y.C.; Wang, L. The Cooling Effect of High Geothermal Tunnel Construction Environment: A Case of Ice and Spray Method in an Extra-Long Tunnel. Int. J. Therm. Sci. 2022, 178, 107606. [Google Scholar] [CrossRef]
  9. Zhang, Z.Q.; Tan, Y.J.; Zhang, H.; Zhao, Y.; Zhu, X.Y. Experimental and numerical study on the influence of wall roughness on the ventilation resistance coefficient in a tunnel under construction. Tunn. Undergr. Space Technol. 2021, 119, 104198. [Google Scholar] [CrossRef]
  10. Guo, W.Q.; Tang, J.H.; Wang, F.J.; Jiang, J.Y.; Xu, W.X. Freezing Deformation of Saturation-Dependent Porous Media Considering Interface Energy and Microstructure Effects: From Thermodynamics-Based Macroscopic Constitutive Relation to Micromechanical Upscaling Model. Int. J. Rock Mech. Min. Sci. 2024, 177, 105733. [Google Scholar] [CrossRef]
  11. Liu, D.K.; Chen, H.N.; Su, R.K.L. Effects of Heat-Treatment on Physical and Mechanical Properties of Limestone. Constr. Build. Mater. 2024, 411, 134183. [Google Scholar] [CrossRef]
  12. He, T.; Cao, Y.X. Regularity of Permeability Evolution of Rock after High Temperature. J. Yangtze River Sci. Res. Inst. 2018, 35, 107–111+116. [Google Scholar]
  13. Jiang, S.; Jiang, T.; Wang, S.G.; Luo, Z.F.; Wang, Z.; Yin, L.; Zhai, K.B. Analytical Solution of Surrounding Rock Temperature and Influence of Thermal Insulation Layer on Lining Temperature: A Case Study on Gaoligongshan Tunnel on Dali-Ruili Railway. Tunn. Constr. 2020, 40, 195–201. [Google Scholar]
  14. Duan, L.M.; Zhang, Y.H.; Lai, J.X. Influence of Ground Temperature on Shotcrete-to-Rock Adhesion in Tunnels. Adv. Mater. Sci. Eng. 2019, 2019, 8709087. [Google Scholar] [CrossRef]
  15. Yuan, Q.; Peng, M.Q.; Yao, H.; Zhang, S.H.; Li, Y.L. The Internal Temperature Field of Shotcrete in High Geothermal Tunnel and Its Effect on Microstructures and Mechanical Properties. Constr. Build. Mater. 2022, 335, 127507. [Google Scholar] [CrossRef]
  16. Jiang, N.; Zhou, C.B. Blasting Vibration Safety Criterion for a Tunnel Liner Structure. Tunn. Undergr. Space Technol. 2012, 32, 52–57. [Google Scholar] [CrossRef]
  17. Zhu, X.R.; Miao, T.W.; Chen, Z.L.; Li, C.S.; Cao, Z.X.; Liu, A. Blasting safety technology of high ground temperature tunnel construction. Eng. Blasting 2020, 26, 63–67+74. [Google Scholar]
  18. Zhang, X.H.; Chen, J.; Bai, Y.; Chen, A.; Huang, D.Z. Ground surface deformation induced by quasi-rectangle EPB shield tunneling. J. ZheJiang Univ. (Eng. Sci.) 2018, 52, 317–324. [Google Scholar] [CrossRef]
  19. Wang, X.; Wang, M.N.; Chen, J.; Yan, T.; Bao, Y.F.; Chen, J.Y.; Qin, P.C.; Li, K.J.; Deng, T.; Yan, G.F. Analysis of Calculation of Fresh-Air Demand for Road Tunnel Ventilation Design in China. Tunn. Undergr. Space Technol. 2020, 103, 103469. [Google Scholar] [CrossRef]
  20. Luo, M.R.; Tao, Y.C.; Yuan, Z.B.; Tao, L.L.; He, C.; Yuan, Y.P.; Tian, X.Y.; Zeng, Y.H. Effect of Tunnel Ventilation on Surrounding Rock Temperature Field and Heat Regulating Circle during Construction Phase. Tunn. Undergr. Space Technol. 2024, 150, 105835. [Google Scholar] [CrossRef]
  21. Wang, L.J.; Lu, J.Q.; Lin, H.C.; Wei, J.F.; Liu, W. Calculation of tunnel ventilation considering infuence ofrandom wind. China Build. Mater. Sci. Technol. 2024, 33, 53–56. [Google Scholar]
  22. Dong, Z.; Luo, S.J.; Xu, S.Y.; Yang, Y.; Zhang, Y.A. Prediction of air demand for a highway tunnel in Yunnan and study on its jet fan setting. China Plant Eng. 2024, 3, 190–192. [Google Scholar]
  23. Technical Specification for Railway Tunnel Construction; China Railway Publishing House: Beijing, China, 1959.
  24. JTGT 3660-2020; Technical Specification for Highway Tunnel Construction. China Communications Press: Beijing, China, 2020.
  25. Tang, X.H.; Wang, M.N.; Tong, J.J.; Dong, C.Y.; Zhang, C. Study on Stress Field and Security of Primary Support in High Rock Temperature Tunnel. J. Southwest Jiaotong Univ. 2019, 54, 32–38. [Google Scholar]
  26. Luo, M.R.; Zhang, X.Y.; Yuan, Z.B.; Wu, X.J.; Zeng, Y.H.; Ye, Y.Z. Thermal Performance Comparison and New Layout Scheme Study of High Geothermal Tunnel Insulation Layer. Case Stud. Therm. Eng. 2023, 52, 103780. [Google Scholar] [CrossRef]
  27. Wang, Y.; Zhou, X.H.; Liu, X.R.; Chen, X.; Xu, Q.; Wang, Q.L. Ambient Temperature Prediction Model and Cooling Requirement Analyze in the High-Altitude Construction Tunnel Passing through the Abnormally High Geothermal Region. Tunn. Undergr. Space Technol. 2023, 141, 105360. [Google Scholar] [CrossRef]
  28. Lin, Z.L.; Xia, C.C.; Du, S.G.; Zhou, S.W. Numerical Investigation of the Temperature Field and Frost Damages of a Frost-Penetration Tunnel Considering Turbulent Convection Heat Transfer. Tunn. Undergr. Space Technol. 2023, 131, 104777. [Google Scholar] [CrossRef]
  29. Lu, Y.; Zhang, X.N.; Guan, H.H.; Jiang, X.P. Study on influence of thermal potential difference on propagation characteristics of hot air at tunnel face. J. Saf. Sci. Technol. 2024, 20, 111–117. [Google Scholar]
  30. Zhang, Z.; Hu, Y.F. Temperature Prediction of Excavation Face in Long Tunnel with Thick Overburden. Mod. Tunn. Technol. 1998, 6, 33–36. [Google Scholar]
  31. Xu, Z.S.; Liu, Y.; Liu, Q.L.; Chen, Y.Y.; Chen, J.W.; Xie, B.C. Study of smoke spread length in single-side exhaust mode tunnel. J. Saf. Environ. 2024, 24, 1–11. [Google Scholar]
  32. Gao, Y.J.; Luo, Y.Y.; Li, Z.S.; Zhang, Y.C.; Yu, Y.Y.; Li, T. Experimental study on smoke back-layering length and temperature distribution in bifurcation tunnels. China Saf. Sci. J. 2022, 32, 109–115. [Google Scholar]
  33. Jiang, T. Temperature Field of the Surrounding Rock and Air Temperature Distribution in Tunnels with High Geothermal Temperature. Ph.D. Thesis, Dalian University of Technology, Dalian, China, 2021. [Google Scholar]
  34. Wu, C. Mine Ventilation and Air Conditioning; Central South University Press: Changsha, China, 2008. [Google Scholar]
  35. Yan, J.; He, C.; Zeng, Y.H.; Wang, B.; Zhang, J.B. Cooling Technology and Effect Analysis for High Geothermal Tunnel on Sichuan-Tibet Railway. China Railw. Sci. 2019, 5, 53–62. [Google Scholar]
  36. Sathya, P.; Naveen, P. Comparative Study of Nonlinear Thermal Convection on Magnetized Dissipative Flow along a Shrinking Riga Sheet with Entropy Generation. Case Stud. Therm. Eng. 2024, 58, 104375. [Google Scholar] [CrossRef]
  37. Chen, Q.; Zhang, H.; Zhu, Y.M.; Chen, S.G.; Ran, G.Y. Study on distributions of airflow velocity and convective heat transfer coefficient characterizing duct ventilation in a construction tunnel. Build. Environ. 2021, 188, 107464. [Google Scholar] [CrossRef]
  38. Brambati, G.; Guilizzoni, M.; Foletti, S. Convective Heat Transfer Correlations for Triply Periodic Minimal Surfaces Based Heat Exchangers. Appl. Therm. Eng. 2024, 242, 122492. [Google Scholar] [CrossRef]
  39. Chen, Q.; Chen, S.G.; Zhang, H.; Ran, G.Y.; Zhang, F.; Yang, H.P. Augmentation of Tunnel-Air Convective Heat Transfer Forced by Duct Ventilation in a Geothermal Construction Tunnel. Build. Environ. 2021, 205, 108219. [Google Scholar] [CrossRef]
  40. Qin, B.; Li, H.; Wang, Z.; Jiang, Y.; Lu, D.; Du, X.; Qian, Q. New Framework of Low-Carbon City Development of China: Underground Space Based Integrated Energy Systems. Undergr. Space 2024, 14, 300–318. [Google Scholar] [CrossRef]
Figure 1. High geothermal tunnel construction ventilation heat source diagram.
Buildings 14 02908 g001
Figure 2. Air demand–supply air temperature curve.
Buildings 14 02908 g002
Figure 3. Air volume–cooling section length curve.
Buildings 14 02908 g003
Figure 4. Air volume–wall temperature curve.
Buildings 14 02908 g004
Figure 5. Distribution law of wind speed on ventilation wall of tunnel.
Buildings 14 02908 g005
Figure 6. Convective heat transfer of tunnel return air disc.
Buildings 14 02908 g006
Figure 7. Fitting curve of air thermophysical properties changing with air temperature.
Buildings 14 02908 g007
Figure 8. Nuc distribution curve of convective heat transfer enhancement zone.
Buildings 14 02908 g008
Figure 9. Fitting curve and equation of convective heat transfer enhancement.
Buildings 14 02908 g009
Figure 10. Temperature distribution curve.
Buildings 14 02908 g010
Figure 11. Mesh generation of 3D model.
Buildings 14 02908 g011
Figure 12. Comparison curve of calculation results.
Buildings 14 02908 g012
Figure 13. Temperature distribution law of tunnel with different supply air temperatures. (Note: r—tunnel radius; Ta—wind temperature; Tw—surrounding rock temperature; v—return air velocity; L—distance between air duct and tunnel face.)
Buildings 14 02908 g013
Figure 14. Distribution law of tunnel air temperature under different wall temperatures.
Buildings 14 02908 g014
Figure 15. Temperature distribution law of different tunnel section sizes.
Buildings 14 02908 g015
Figure 16. Distribution law of air temperature at different placement distances of air duct.
Buildings 14 02908 g016
Table 1. Values of μ i at different construction stages.
Heat Dissipation Time μ 1 μ 2 μ 3 μ 4 μ 5
Construction Stage
Ventilation and smoke extraction stage11010
Slag discharge and support stage11101
Drilling construction stage11101
Table 2. Q3 heat source calculation parameters.
Mechanical VehicleThe First StageThe Second StageThe Third Stage
- K i N i H i (kW) K i N i H i (kW)
Excavator-0.21223---
Mechanical loader-0.31412---
Dump truck-0.423160.21316
Table 3. Q5 heat source calculation parameters.
Process And LaborThe First StageThe Second StageThe Third Stage
- K j N j H j (kW) K j N j H j (kW)
Excavation----150.47
Slagging-0.470.28---
Supporting-0.530.47---
Bottom floor construction-0.790.47---
Management and others-150.28150.28
Table 4. Calculation results for heat source heat dissipation and air demand in three stages.
StageUnstable Convection Heat Transfer Coefficient
(W·m−2·K−1)
Q 1 (kW) Q 2 (kW) Q 3 (kW) Q 4 (kW) Q 5 (kW)Required Air Volume
(m3·s−1)
Ventilation and smoke extraction stage6.58372.0807.047-222.848-57.58
Slag discharge support stage6.58372.0807.0474.210-0.0037536.32
Drilling construction stage6.58372.0807.0470.632-0.0037536.32
Table 5. Thermophysical properties of air at atmospheric pressure (p = 1.01325 × 10⁵ Pa).
t ° C ρ kg / m 3 c p kJ / ( kg ° C ) λ × 10 2 W / ( m ° C ) a × 10 6 m 2 / s η × 10 6 kg / ( m s ) P r
−501.5841.0132.0412.714.60.728
−401.5151.0132.1213.815.20.728
−301.4531.0132.2014.915.70.723
−201.3951.0092.2816.216.20.716
−101.3421.0092.3617.416.70.712
01.2931.0052.4418.817.20.707
101.2471.0052.5120.017.60.705
201.2051.0052.5921.418.10.703
301.1651.0052.6722.918.60.701
401.1281.0052.7624.319.10.699
501.0931.0052.8325.719.60.698
601.0601.0052.9027.220.10.696
701.0291.0092.9628.620.60.694
801.0001.0093.0530.221.10.692
900.9721.0093.1331.921.50.690
1000.9461.0093.2133.621.90.688
Table 6. Design parameters of research tunnel objects.
Tunnel Design
Parameters
ShapeRadiusWind
Temperature
Surrounding Rock TemperatureReturn Air
Velocity
Distance between Air Duct and Tunnel Face
Design situationCircular3.4 m25 °C40 °C0.5 m/s15 m
Table 7. Calculation results for tunnel temperature within 10 m.
Air Temperature (°C)Convective Heat Transfer
Temperature Difference (°C)
Airflow Density (kg·m−3)Convective Heat Transfer
Coefficient (W·m−2·°C−1)
25151.1837977.385728
Disclaimer/Publisher’s Note: The statements, opinions and data contained in all publications are solely those of the individual author(s) and contributor(s) and not of MDPI and/or the editor(s). MDPI and/or the editor(s) disclaim responsibility for any injury to people or property resulting from any ideas, methods, instructions or products referred to in the content.

