Article

Lateral Performance of Composite Wall with Cold-Formed Thin-Walled Steel–Concrete Sandwich Panel

1
School of Civil Engineering and Architecture, Hainan University, Haikou 570228, China
2
Civil and Transportation Engineering College, Weifang University, Weifang 261061, China
*
Author to whom correspondence should be addressed.
Buildings 2024, 14(9), 2928; https://doi.org/10.3390/buildings14092928
Submission received: 11 August 2024 / Revised: 9 September 2024 / Accepted: 11 September 2024 / Published: 16 September 2024
(This article belongs to the Section Building Structures)

Abstract

:
To study the lateral performance of a cold-formed steel–concrete insulation sandwich panel composite wall, two full-scale specimens with different arrangements were designed. The specimens underwent cyclic loading tests to examine the failure characteristics of the composite wall, and lateral performance aspects such as the experimental hysteresis curve, skeleton curve, and characteristic value of the whole loading process were acquired. The experimental results indicate that the failure of the composite wall system was primarily caused by the failure of the connection; the overall lateral performance of composite walls with one wall panel at the bottom and two wall panels at the top (W1) was superior to that of composite walls with two wall panels at the bottom and one wall panel at the top (W2). When loaded to an inter-story drift ratio of 1/300, the composite wall did not exhibit any significant damage. A finite element (FE) model was developed and validated by the experiments. Factors affecting the shear bearing capacity were analyzed based on the FE model, including the yield strength of diagonal braces, the thickness of the diagonal braces, the arrangement pattern of the wall panels, the dimensions of the wall panels, and the strength of the connection of the L-shaped connector and the flat connector. The FE results show that all these factors can influence the lateral performance of the composite wall.

1. Introduction

Cold-formed thin-walled steel composite walls are widely utilized in low-rise constructions and serve as key components in seismic resistance for such cold-formed steel structures. They consist of cold-formed thin-walled steel frames connected with cladding panels, offering benefits like light weight, easy installation, and environmental friendliness.
Presently, researchers have engaged in extensive experimental studies on composite walls composed of various structural panels and light steel frames. These studies have utilized experiments as a benchmark to derive theoretical calculation formulas and validate them through finite element simulations. Tarpy and Hauenstein [1] found that the shear load capability of double-sided gypsum board composite walls is approximately twice that of single-sided gypsum board composite walls. This indicates that gypsum board predominantly contributes to the shear load capability of composite walls. Serrette et al. [2,3] suggested that decreasing the gap between self-tapping screws at the panel edges, incorporating pull-out resistant connectors, and using plywood facing can effectively enhance the shear load capability of composite walls. Tian et al. [4] conducted monotonic horizontal loading tests on ten composite wall specimens, demonstrating that the frame with two side X-shaped braces exhibited the best bracing performance. Fiorino et al. [5] explored the effects of different wall materials on the failure of self-tapping screws. The results indicate that under low-cycle reciprocating loading, various wall panel materials exhibit differences in shear capacity for self-tapping screws. Yu [6], Mohebbi et al. [7], Dabreo et al. [8], and Javaheri-Tafti et al. [9] have found that externally sheathed steel plate composite walls exhibit superior shear performance. Cheng and Chen [10] carried out monotonic and low-cycle repeated loading tests on cold-formed steel plate shear walls with widths of 1.83 m and 2.44 m and gave structural recommendations. Zeynalian and Ronagh [11] conducted experimental research on cold-formed steel composite walls with cement fiberboard and provided recommended values for the structural modification factor. Gao and Xiao [12] conducted horizontal loading tests on cold-formed steel walls covered with bamboo plywood, providing recommended values for the nominal shear strength. Fiorino et al. [13] analyzed the earthquake behavior of gypsum board cold-formed steel walls. Wu et al. [14,15] carried out experimental research on cold-formed steel composite walls filled with desulfurized gypsum-modified materials. The results indicated that the internal filling material could substantially improve the shear load capability and lateral stiffness of the walls. Zhang [16] undertook a study on the shear performance of five composite walls and derived a shear capacity formula for these walls based on finite element analysis. Wang et al. [17] subjected six specimens to low-cycle reciprocating loading and found that specimens connected with rectangular steel tubes exhibited superior seismic performance. Almasabha et al. [18] introduced a novel prefabricated steel cage designed to reinforce reinforced concrete squat structural walls (SSWs). Under low-drift-ratio conditions, these walls demonstrated excellent performance in terms of drift, ductility ratio, and wall damage. Chao et al. [19] argued that the horizontal stiffener detailing (HSD) can serve as a replacement for conventional stiffener detailing (CSD) and offers improved mechanical performance. Additionally, the cross-sectional shape of cold-formed thin-walled steel sections is also critical for the wall’s load-bearing capacity [20,21,22]. In summary, the cladding panels and their connection are crucial factors in the shear capacity of the composite walls. However, current research predominantly focuses on the impact of composite wall shear performance or insulation performance. Prefabricated sandwich wall panels are typically used in steel structures but are rarely applied in cold-formed thin-walled steel structures. Therefore, this study explores the application of prefabricated sandwich wall panels in cold-formed thin-walled steel structures. There is relatively less research on wall panels that can both bear shear capacity and provide insulation. The document suggests a concrete sandwich wall panel as the cladding panel for composite walls. The sandwich panel is connected to the steel frame using L-shaped connectors and flat connectors. The study investigates the mechanical properties and failure patterns of the composite wall. Based on experimental data, numerical analysis and parametric studies of the composite wall system were conducted using Abaqus finite element software. This provides a reference for theoretical research and engineering applications of the system.

2. Materials and Methods

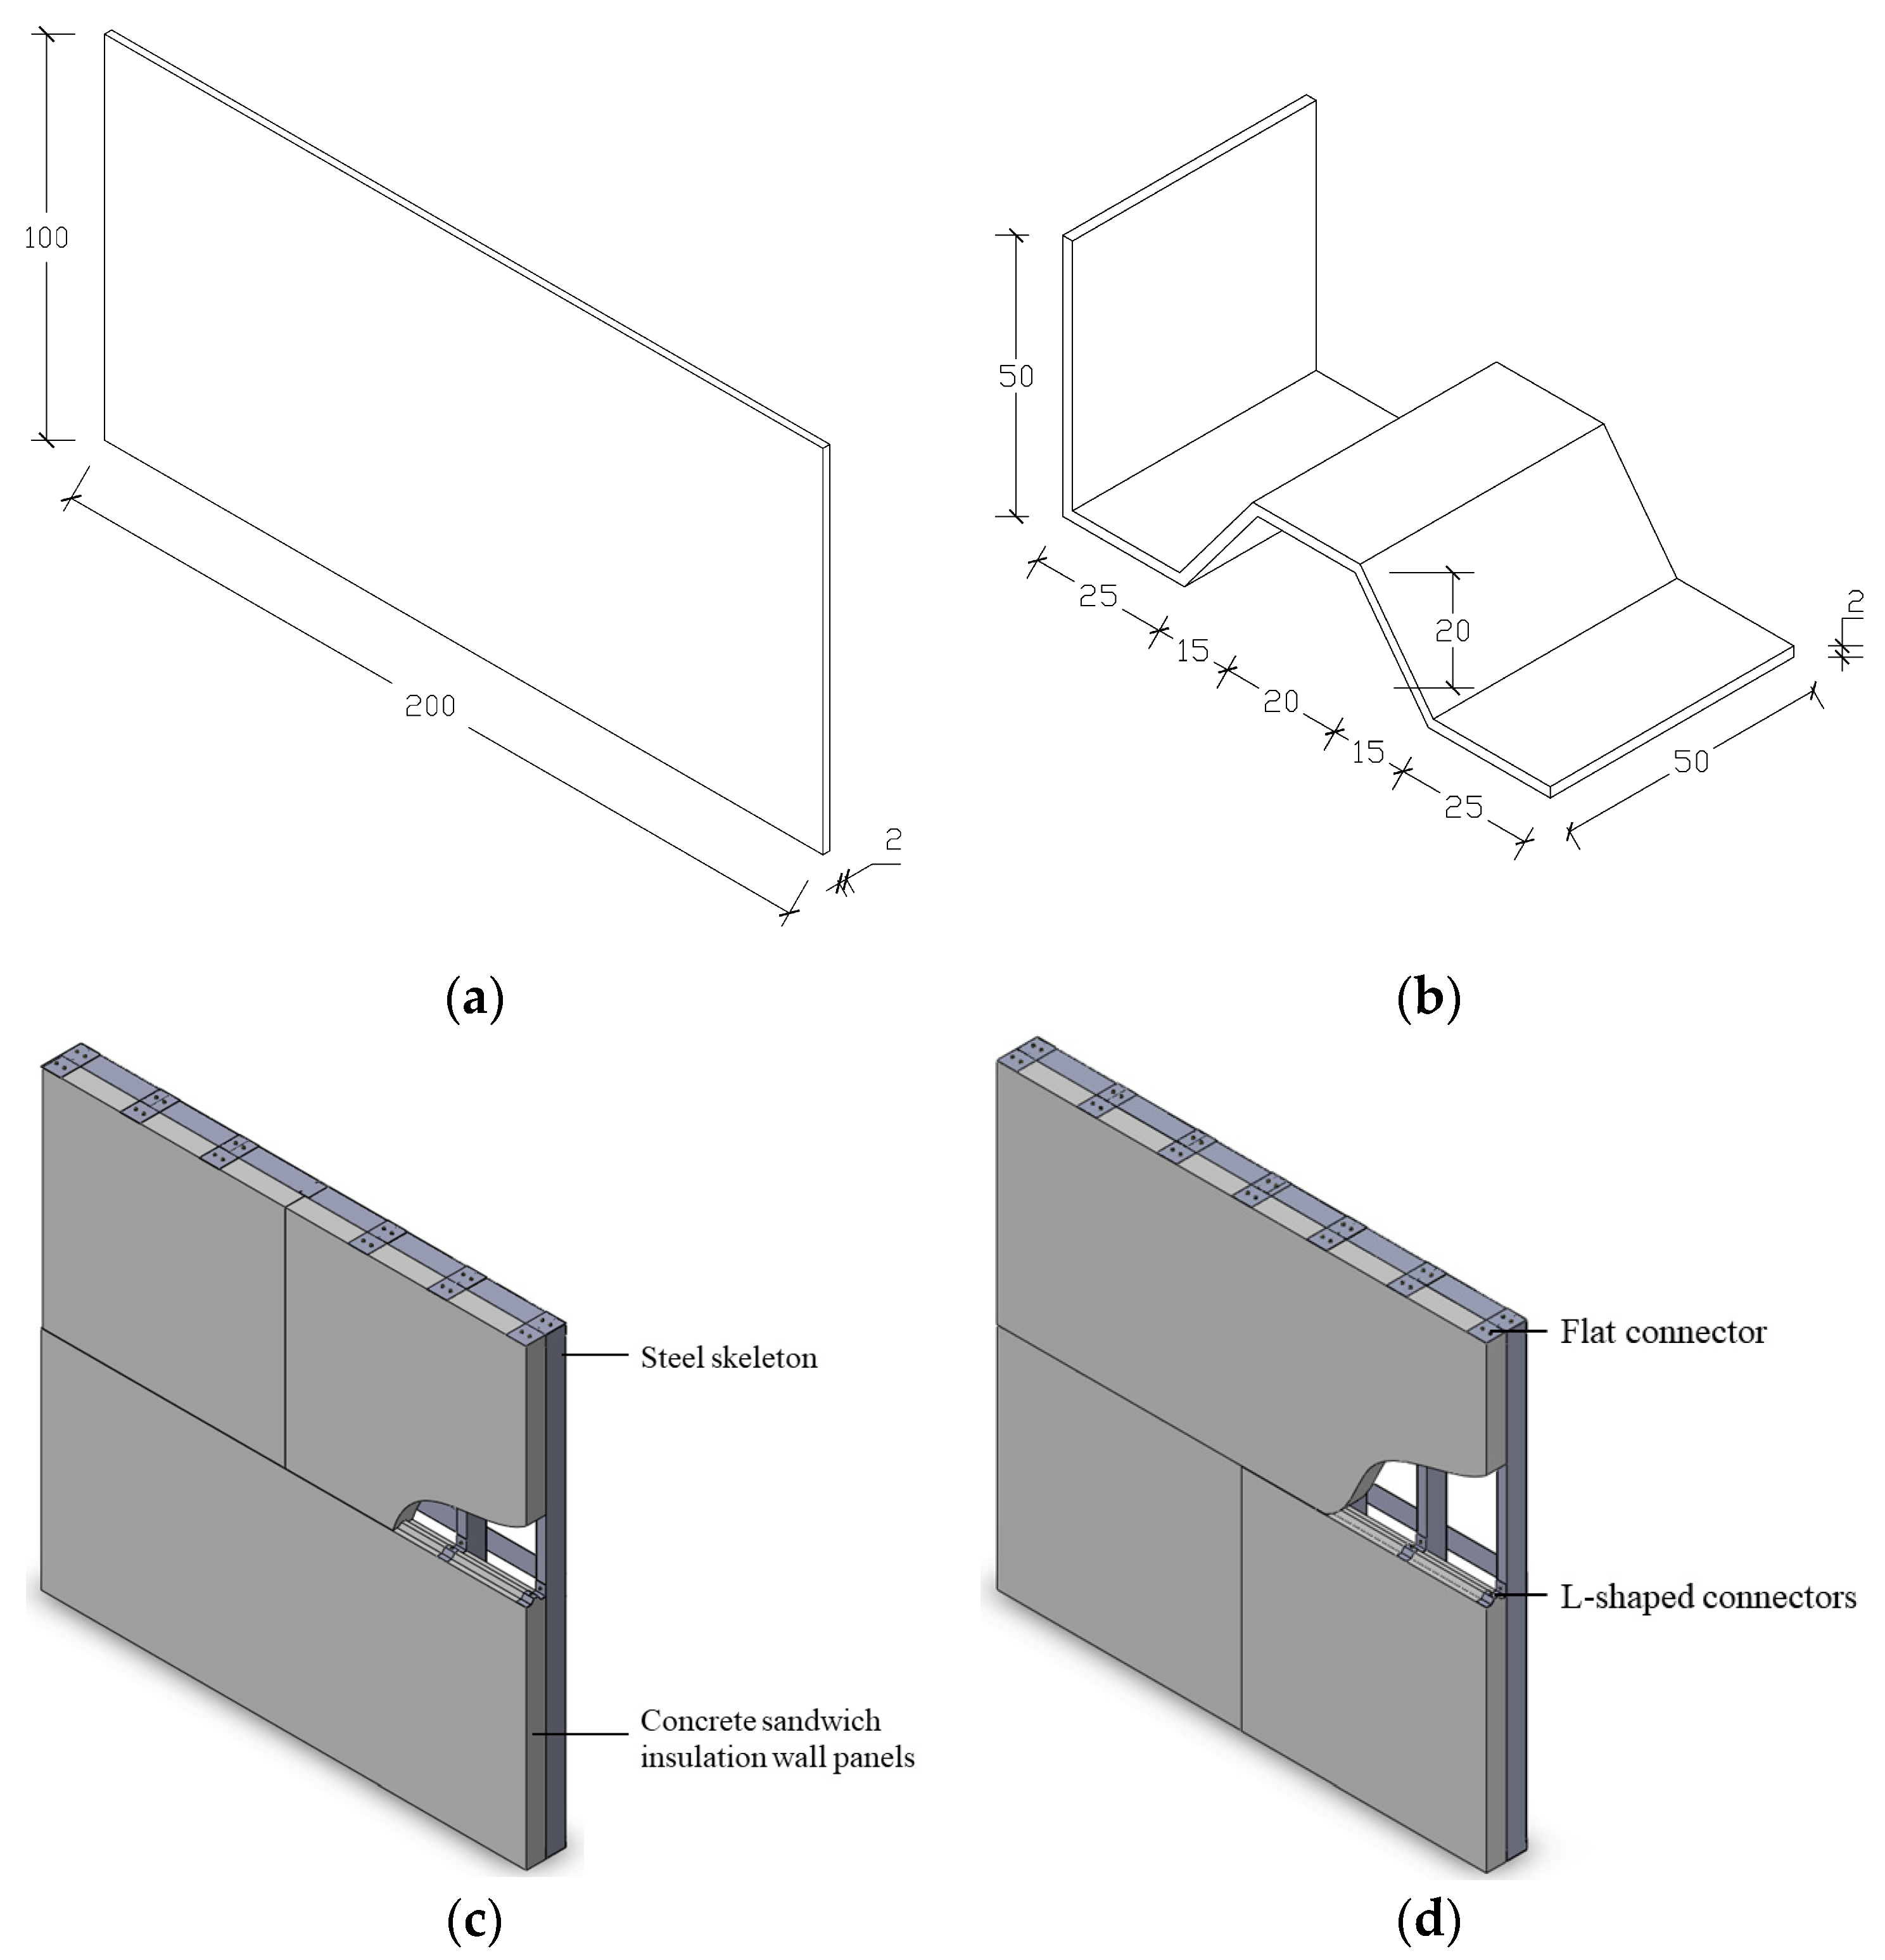
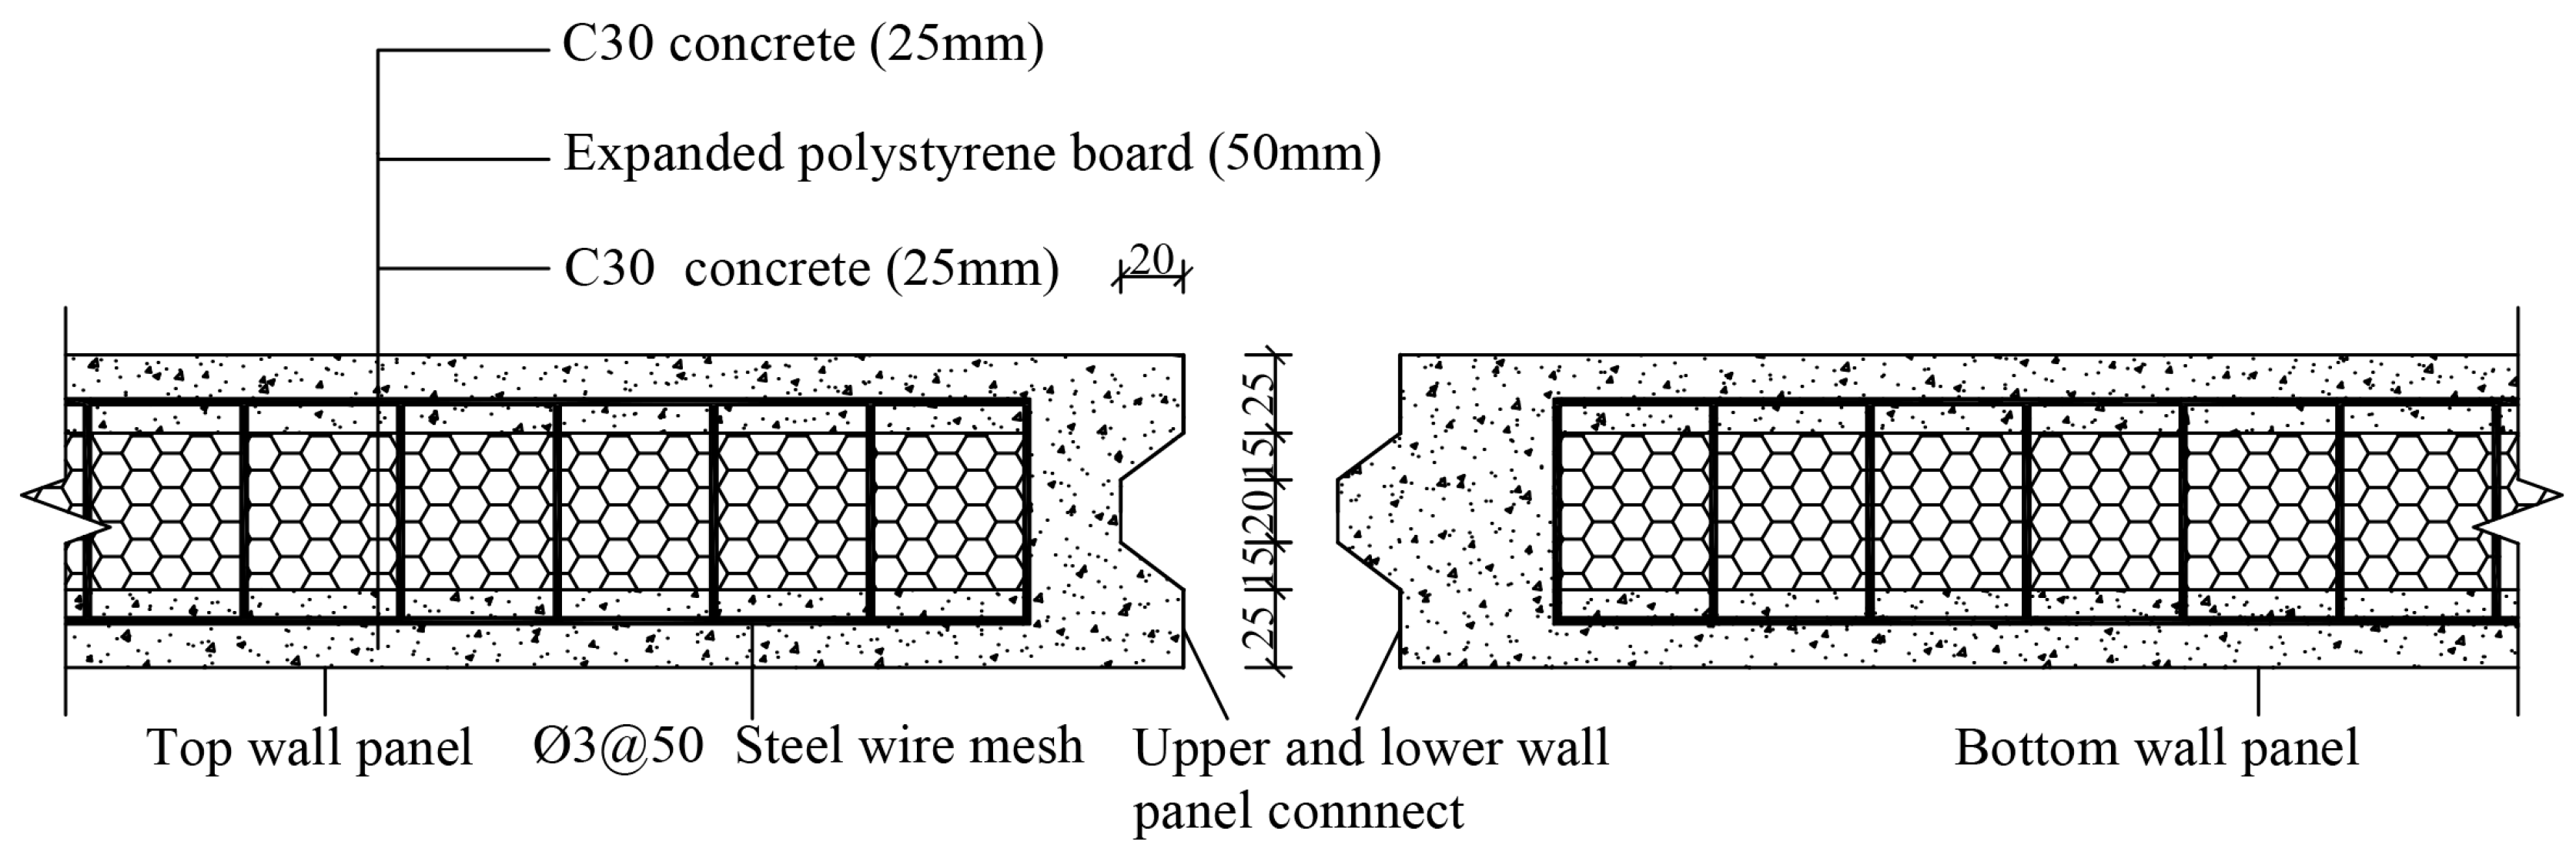
2.1. Experimental Design

In this experiment, two specimens were designed as shown in Figure 1 and labeled as W1 and W2. The steel frame of the walls had a height and width of 2300 mm and 2450 mm, respectively, for both specimens. The steel frames of the two specimens had identical configurations, consisting of C-shaped steel columns, U-shaped steel rails at the top and bottom of the wall, and flat steel straps as horizontal bracing and anti-pull components. The net spacing between columns was 350 mm for both specimens. The C-shaped steel section dimensions were 105 mm × 50 mm × 14 mm × 2 mm, with a length of 2300 mm, while the U-shaped steel section dimensions were 100 mm × 50 mm × 2 mm, with a length of 2450 mm. The flat steel strap section dimensions were 100 mm × 2 mm (width × thickness), with a length of 2450 mm. Q235 steel was used for all steel materials. Specimens W1 and W2 employed precast concrete sandwich insulation wall panels as cladding panels, consisting of C30 concrete, foam boards, and steel wire mesh. The joint form of the upper and lower wall panels was a “tongue and groove” joint, as detailed in Figure 2. The lower wall panel was joined to the steel frame using L-shaped connectors. One side of the L-shaped connector is attached to the wall panel using a nail gun, while the other side was connected to the steel framework with a self-tapping screw. While the upper wall panel was joined to the steel frame using flat steel connectors, the flat connector was attached to the wall panel with two nails on one side and to the steel framework with two self-tapping screws on the other side. The sizes of the flat steel connectors were 104 mm × 100 mm × 2 mm (length × width × thickness), and the sizes of the L-shaped connectors are illustrated in Figure 1b. The structure criteria for the components are detailed in Table 1.

2.2. Material Mechanical Property

For steel, the elastic modulus, yield strength, ultimate tensile strength, and elongation after fracture were 178.3 Gpa, 260.1 MPa, 316.7MPa, and 34.0%, respectively, which were determined by the tensile tests according to the Chinese standard GB/T 228.1-2010 [23]. The compressive strength of cubic specimens with side lengths of 150 mm was 28.0 MPa, determined by the compressive tests as per the Chinese code GB/T 50081-2019 [24]. As shown in Figure 3, shear tests were conducted on self-tapping screw connections between two 2 mm steel plates in terms of the Chinese code JGJ 227-2011 [25], obtaining the peak shear capacity and peak displacement, which were 6.92 kN and 5.24 mm, respectively. The bearing capacity of the foam board was extremely low [26], and mechanical testing of the foam board was not easy to complete, so the data from reference [26] are cited. In addition, the foam board mainly played the role of heat preservation, so a foam board with lower mechanical properties in the literature [26] was selected. For the foam board, the compressive strength and tensile strength were 0.089 Mpa and 0.276 Mpa.

2.3. Loading Regime and Displacement Gauge Layout

The experiment was conducted using displacement-controlled loading (Figure 4). Before reaching a displacement of 10 mm, the loading increment was 2.5 mm. From 10 mm to 30 mm of displacement, the increment was 5 mm. After reaching 30 mm, the displacement increased with an interval of 10 mm. Every displacement level had two cycles of loading. The test ceased when the force decreased to 85% of its maximum value. The loading rate remained constant throughout the entire process.
The electro-hydraulic servo loading system with a range of ±250 mm was used to apply the load. Sideway support with pulleys was fixed to prevent the out-of-plane displacement of the components. The sideway support was connected to the four door frames using 16 bolts. The sideway support was equipped with four pulleys, with two pulleys placed on each side of the loading beam. Each pulley made contact with the loading beam to restrict out-of-plane movement of the loading beam and the specimen. At the bottom corners of the steel frame, two anti-pull devices were used to link the frame to the ground beam by M16 bolts to prevent the specimen from being pulled out. In the middle of the bottom of the steel frame, M14 bolts with a spacing of 400 mm were utilized to join the steel frame to the ground beam. At the top of the specimen, the steel frame was joined to the loading beam using M16 bolts. The loading beam was connected to the actuator with four bolts, which were used to transfer displacement and load to the loading beam. A total of 8 position sensors were arranged, as depicted in Figure 5 [25], to obtain the position of the specimen during loadings.

2.4. Experimental Program

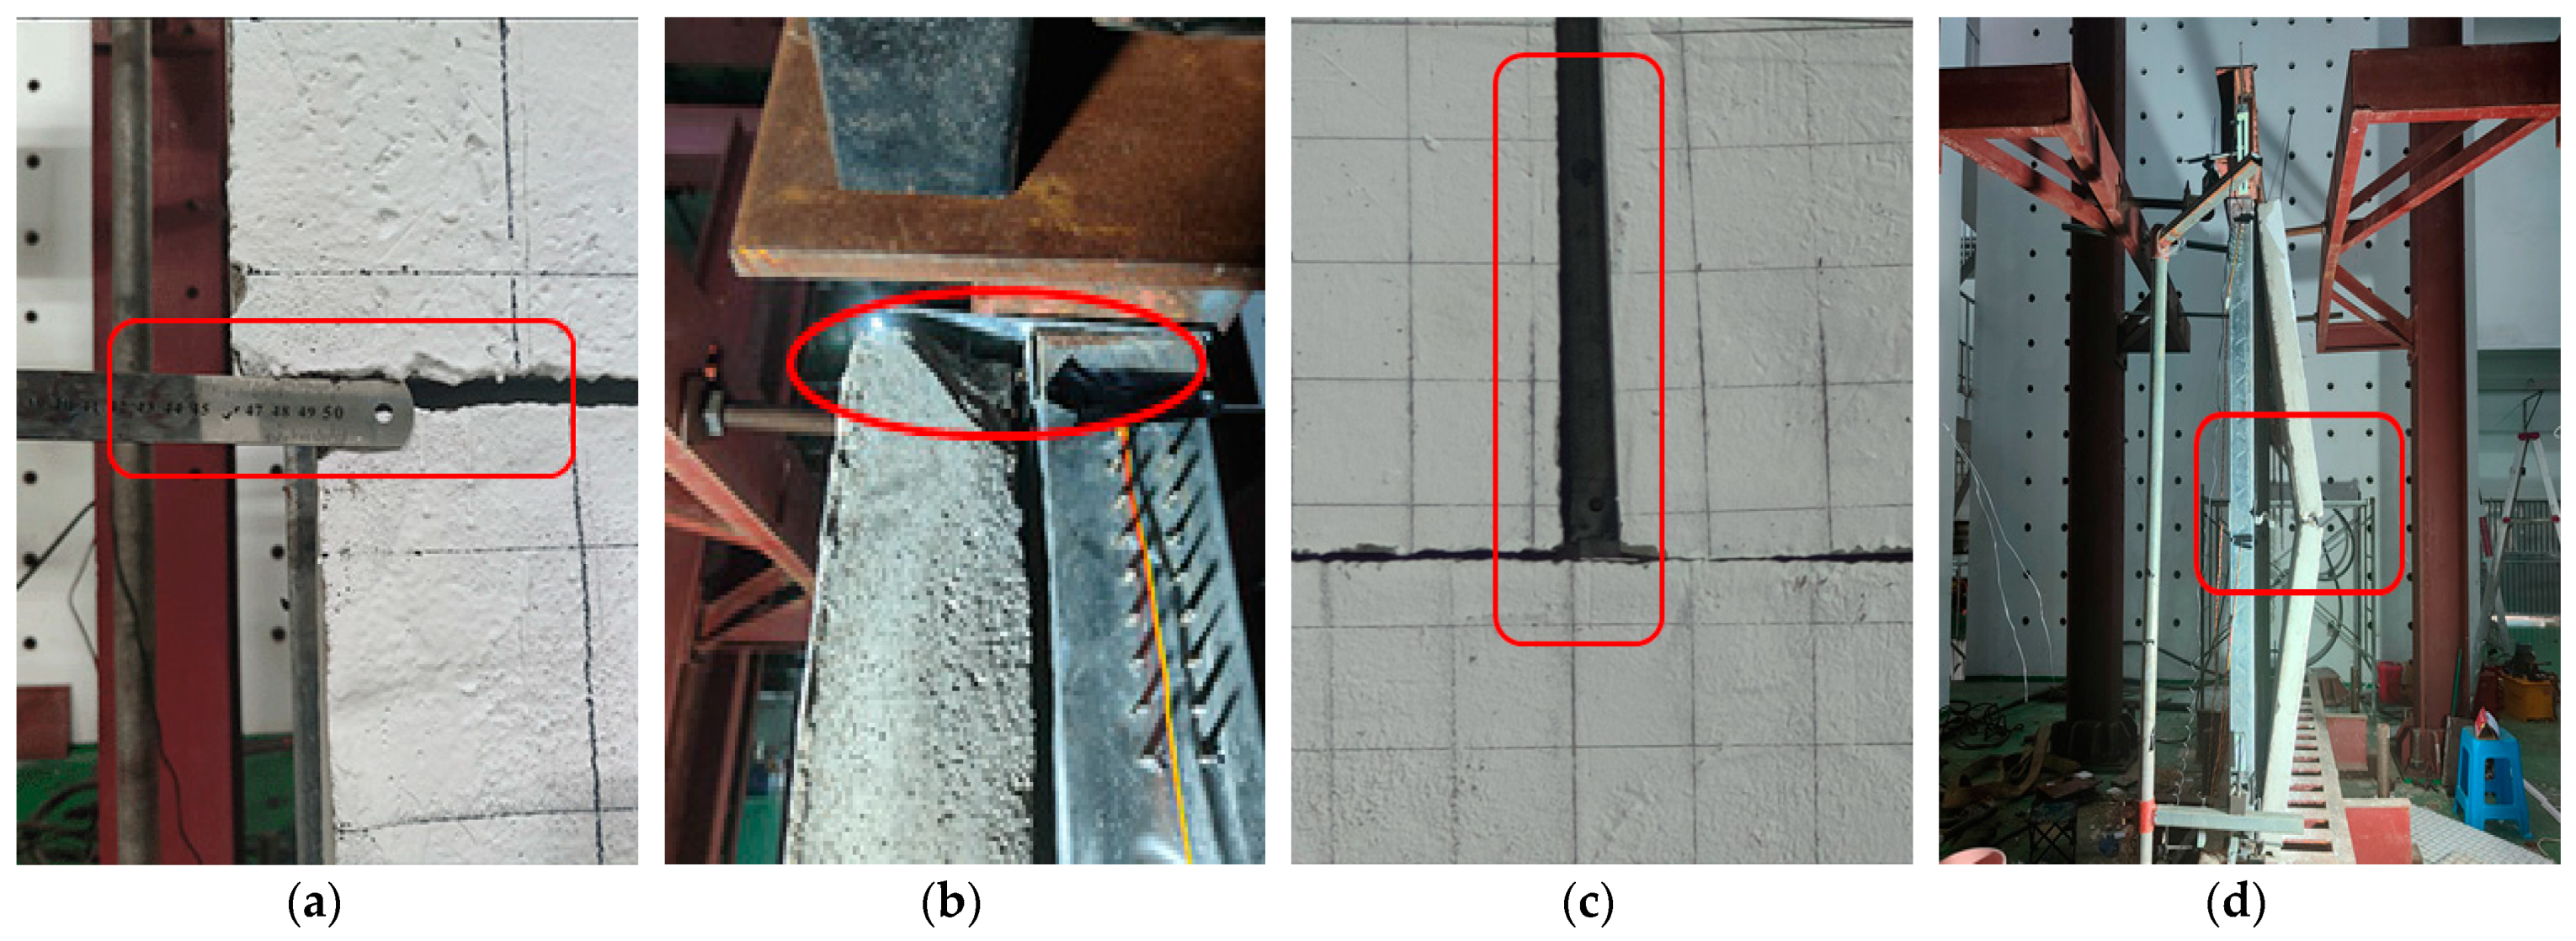
2.4.1. Main Phenomena and Characteristics of Specimen W1

Specimen W1 has one lower cladding panel and two upper cladding panels. At a displacement of 5 mm, there was a slight sound of misalignment between the wall panel and the steel frame. As the displacement increased, the sound gradually intensified. At 40 mm displacement in the first loading cycle, a sound was heard, and the upper and lower wall panels were out of alignment (Figure 6a). During the first cycle of loading at a displacement of 50 mm, there was slippage observed between the connector at the top right end and the wall panel, resulting in cracking of the wall panel at that location (Figure 6b). During the first cycle of loading, the upper wall panels were detached (Figure 6c). At a displacement of 80 mm during the second cycle of loading, the wall panel suddenly bulged outward, leading to severe damage to the specimen (Figure 6d). The experiment was terminated. Within the inter-story drift ratio of 1/300 by the code in [20], the specimens did not exhibit any significant damage. The main failure pattern of the specimen is depicted in Figure 6.

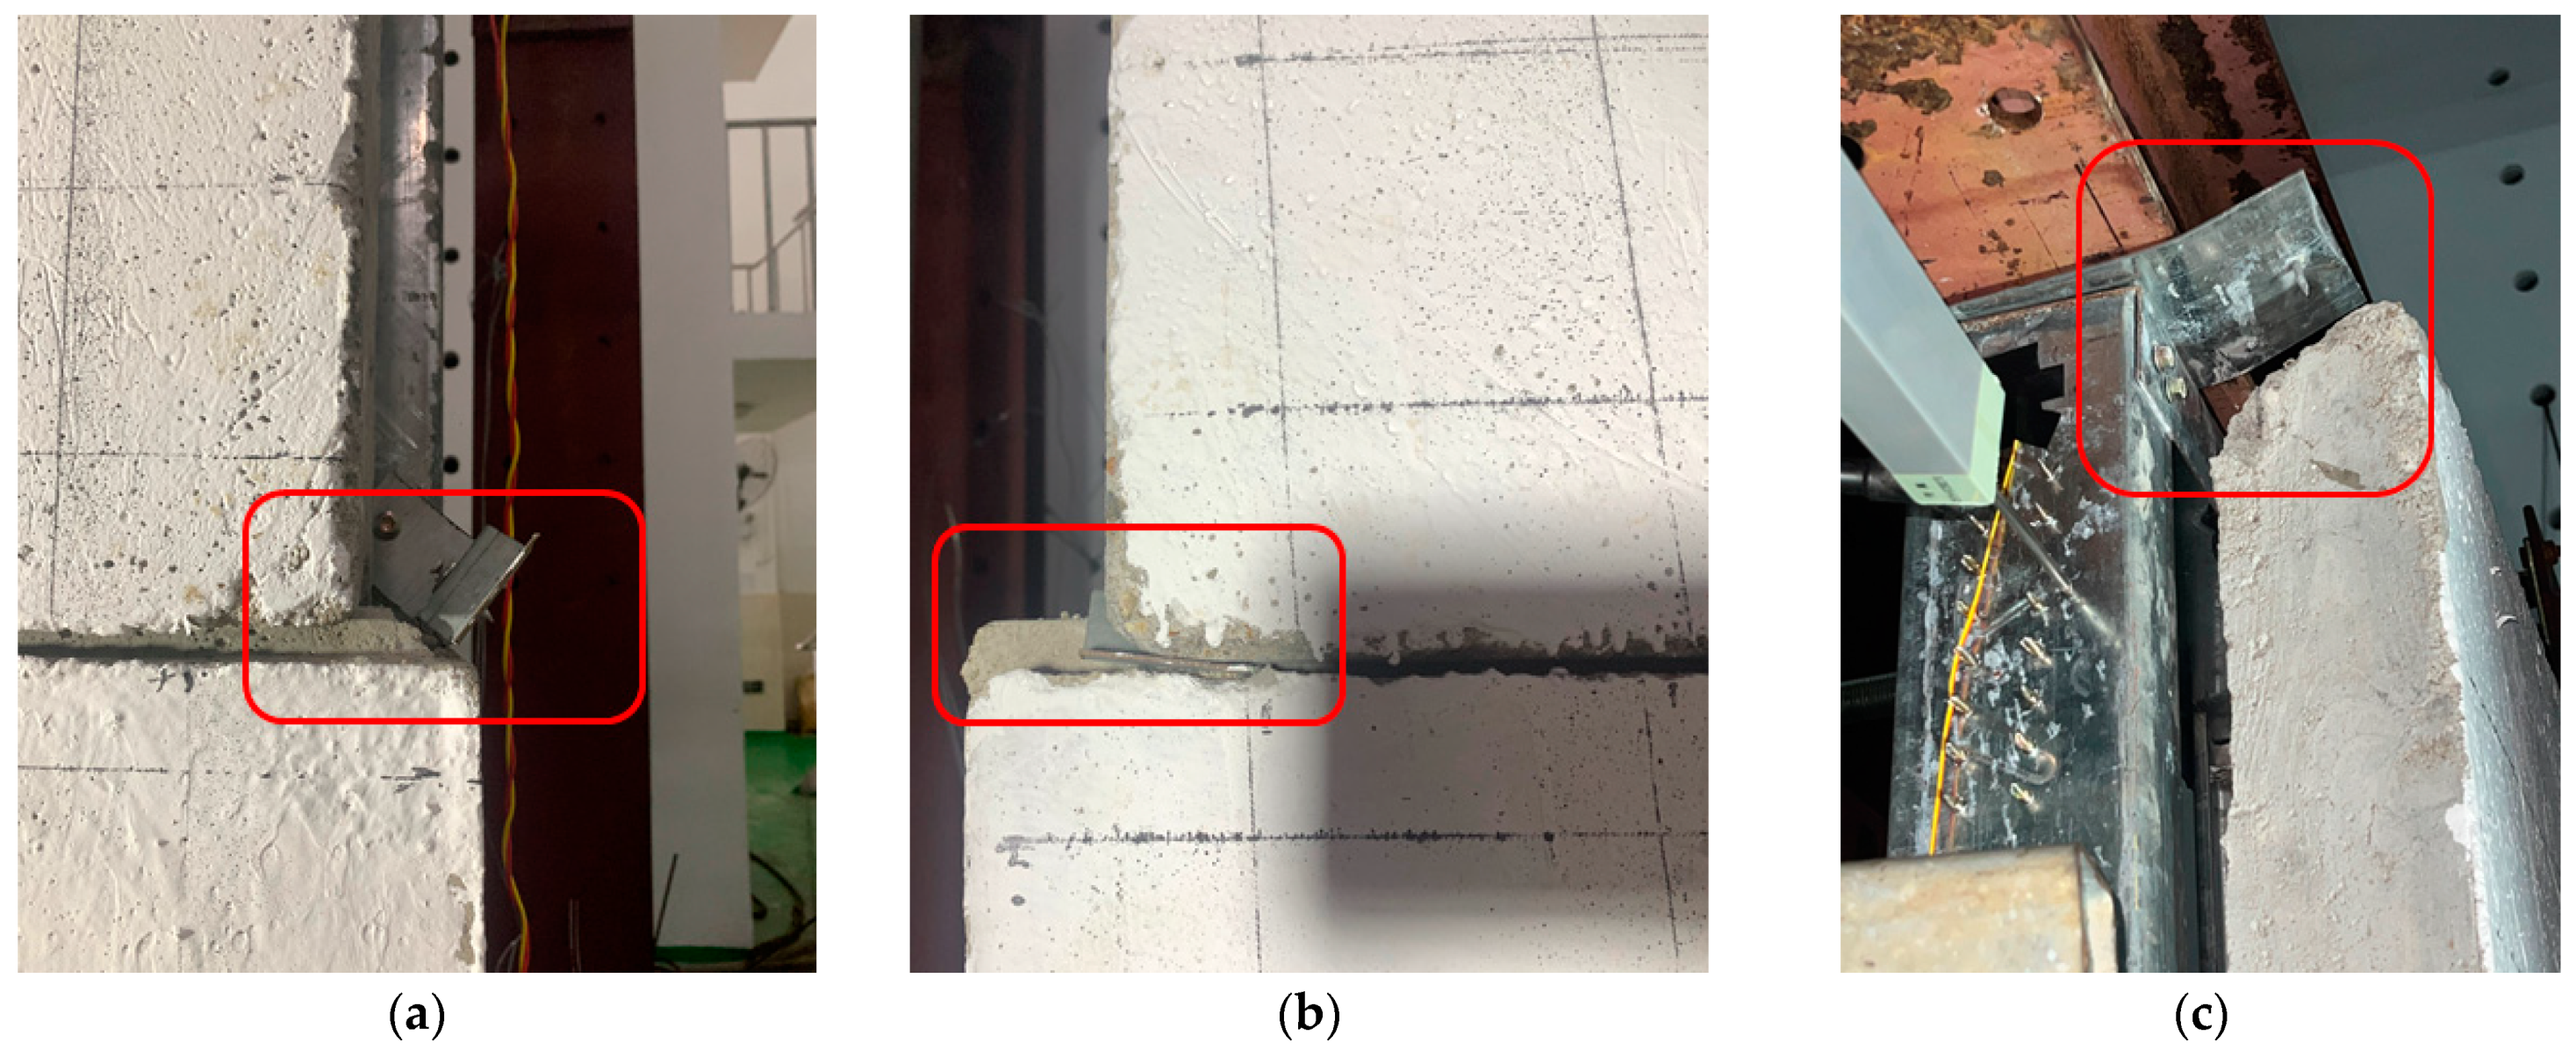
2.4.2. Main Phenomena and Characteristics of Specimen W2

Specimen W2 had two lower panels and one upper panel. At a displacement of 5 mm, there was a continuous, slight sound due to friction between the wall panels and the steel frame; no other phenomena were observed. At a displacement of 25 mm during the second cycle of loading, the L-shaped connector at the right end was damaged (Figure 7a). At a displacement of 40 mm during the first cycle of loading, an abnormal sound was heard. The upper and lower wall panels were out of alignment (Figure 7b). At a displacement of 60 mm during the second cycle of loading, the excessive force on the flat connector at the left of the wall caused damage to the concrete in that area (Figure 7c). Within the inter-story drift ratio of 1/300 by the code [20], the specimens did not exhibit any significant damage. The primary failure pattern of the specimen is illustrated in Figure 7.

3. Test Results and Analysis

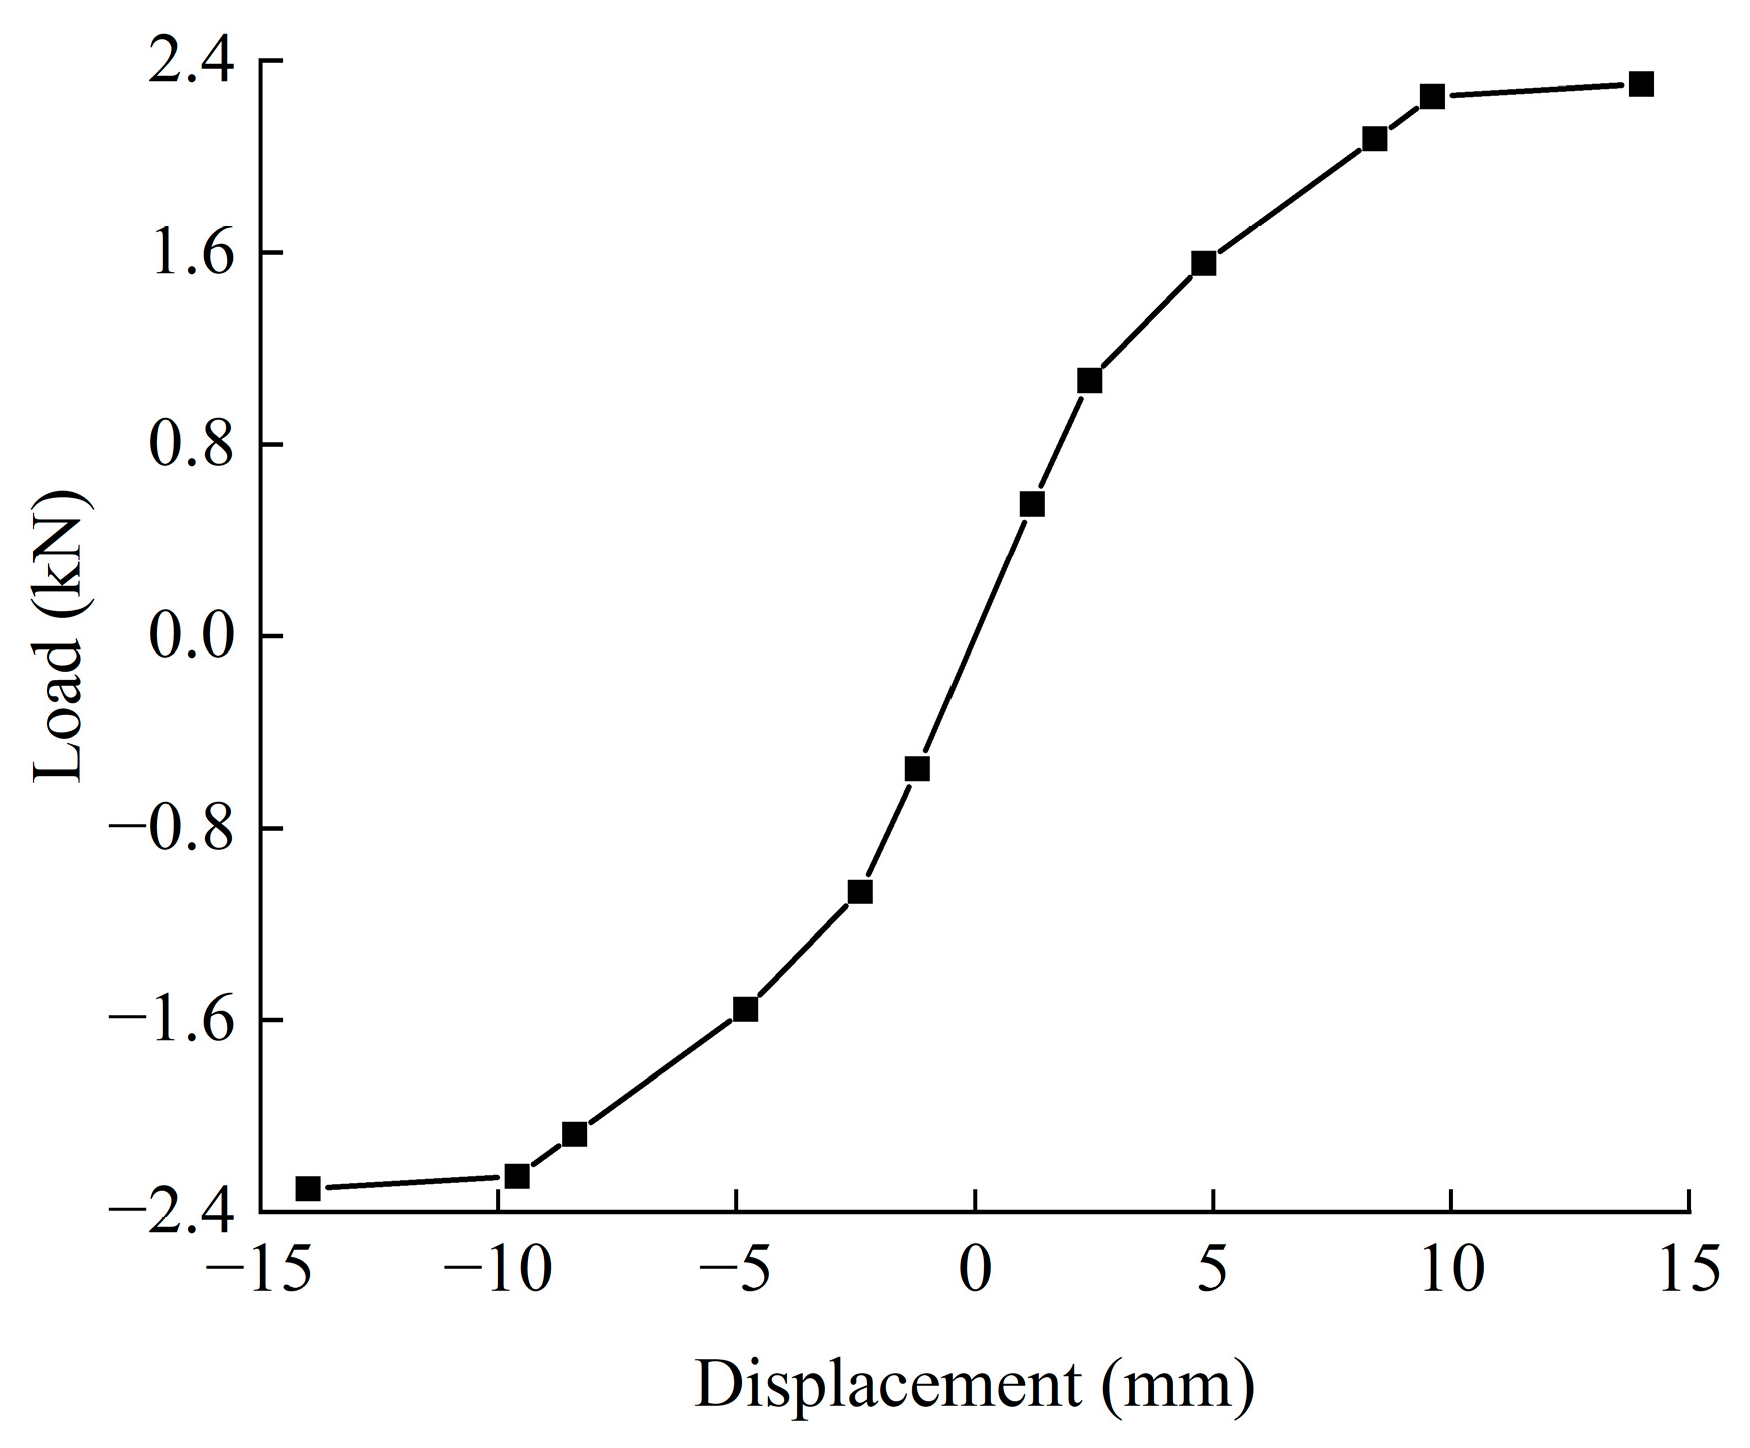
3.1. Load-Displacement Curve

According to the specifications outlined in “Technical specification for low-rise cold-formed thin-walled steel building” (JGJ 227-2011) [25], the displacement (Δ) of the wall was obtained. By correlating the respective force values on the actuators, displacement–load curves could be obtained. The hysteresis loops of each specimen are illustrated in Figure 8.
Both specimens exhibited pronounced nonlinearity and pinching behavior in their hysteresis loops. At small displacement levels, the hysteresis loops of all specimens exhibited an hourglass shape, indicating good energy dissipation capacity. Correspondingly, deformations at zero load were minimal, with elastic deformation dominating the behavior of the specimens. As the displacement increased with loading levels, the joints between the concrete core wall panels and the steel frame of specimens W1 and W2 failed. Consequently, the hysteresis loops transitioned from an hourglass shape to an S-shape. Eventually, the out-of-plane instability of the wall panels in specimen W1 led to brittle failure, while in specimen W2, the failure and loosening of the connects resulted in a decrease in load-bearing capacity.
In the later stages of loading, the specimens entered the plastic and damage phases. Starting from the beginning displacement at the loading point (displacement = 0) to the peak point, the tangent stiffness gradually increased. Near displacement = 0, both the stiffness and force were relatively small. As displacement progressed, there was a noticeable increase in the stiffness of the hysteresis loop. The stiffness of the specimens gradually decreased during unloading. After unloading to a certain value, the stiffness experienced significant degradation, rapidly dropping to around zero and maintaining this stiffness during unloading. The initial unloading stiffness was noticeably larger than the final unloading stiffness. The changes in stiffness near the peak point and at the initial point of loading were relatively small. In the second cycle of loading, the forces for the same displacements were lower. This can be attributed to the damage inflicted on the specimens during the previous loading cycle. In the second cycle of unloading, the unloading path closely followed the path of the previous unloading cycle.

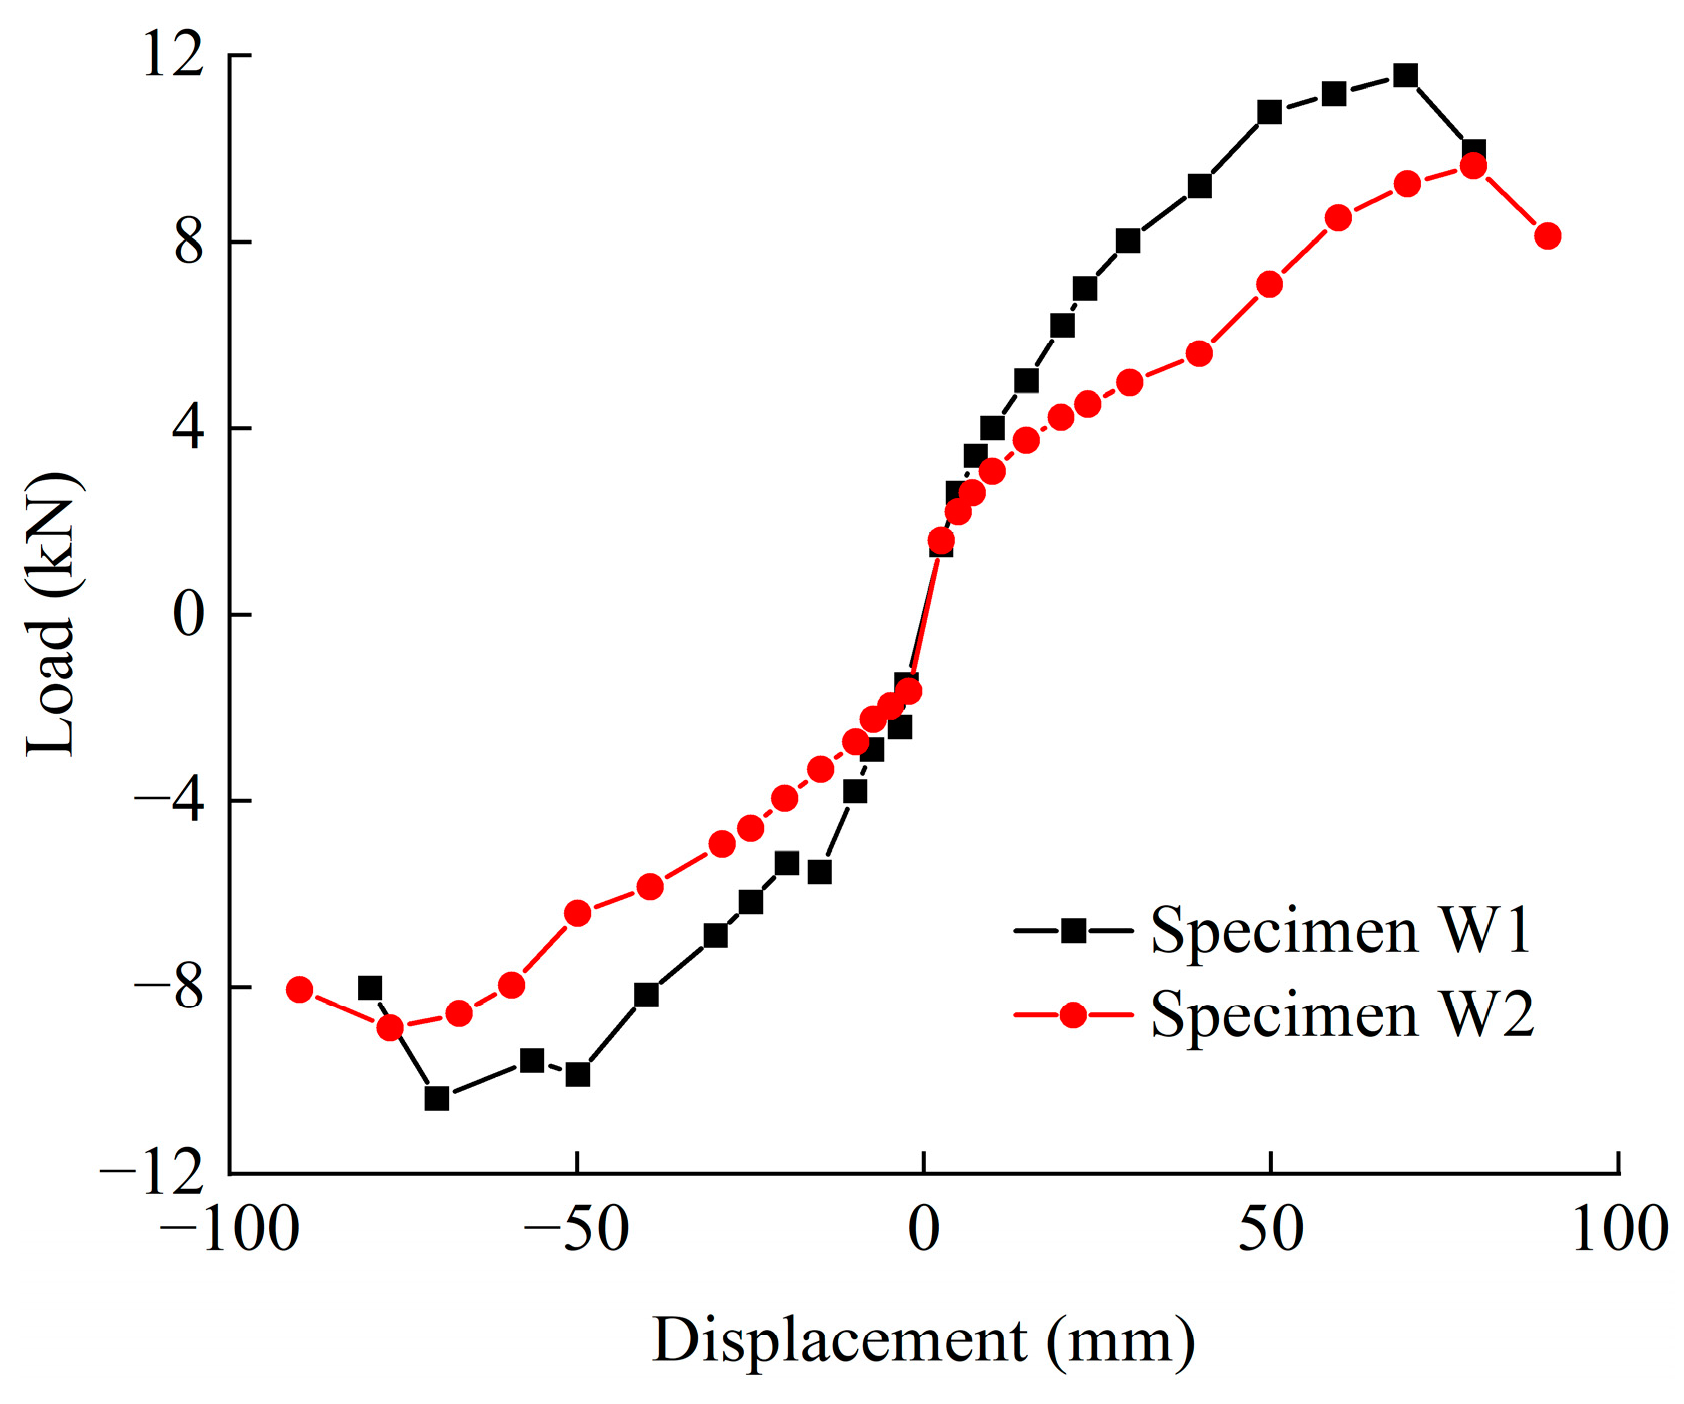
3.2. Skeleton Curves

Based on “Specification for seismic test of buildings” (JPJ 101-2015) [27], the peak points of the first cycle at each loading level were extracted, and these points were connected to form the skeleton curve, as shown in Figure 9. Since there was an absence of clear yield points on the skeleton curve of the test, the energy equivalent area method was utilized to ascertain the yield point P y and yield displacement y . The peak points on the skeleton curve were utilized as the maximum load P m a x , and the force value at 0.85 P m a x on the lowering segment of the curve was taken as the ultimate load P u , with the correlating displacement as the ultimate displacement u . The ductility factor μ was characterized as the ratio of ultimate displacement u to yield displacement y . The lateral stiffness K 300 of the wall was computed by employing the subsequent equation:
K 300 = V 300 ( 1 / 300 ) l ω
where: l ω is the width of the wall and V 300 is the load corresponding to a drift ratio of 1/300 on on the skeleton curve.
From Table 2, it can be observed that, compared to specimen W2, the lateral stiffness of specimen W1 was augmented by 5.0%. The patterns of the positive and negative skeleton curves for both specimens were largely consistent, owing to the symmetrical construction of the two components. During the initial loading phases, the load values for W1 and W2 were nearly identical. However, as displacement increased, at the same displacement, the load values for W1 exceeded those of W2. Specifically, the yield load, peak load, and ultimate load for W1 were augmented by 14.26%, 20.07%, and 21.36%, respectively, compared to W2. However, the yield displacement and peak displacement for W1 decreased by 27.35% and 12.40%, respectively. This can be attributed to significant tilting of the upper concrete core wall panel in specimen W1. The upper core wall panel compressed the lower wall panel, increasing the frictional force between the upper and lower panels.

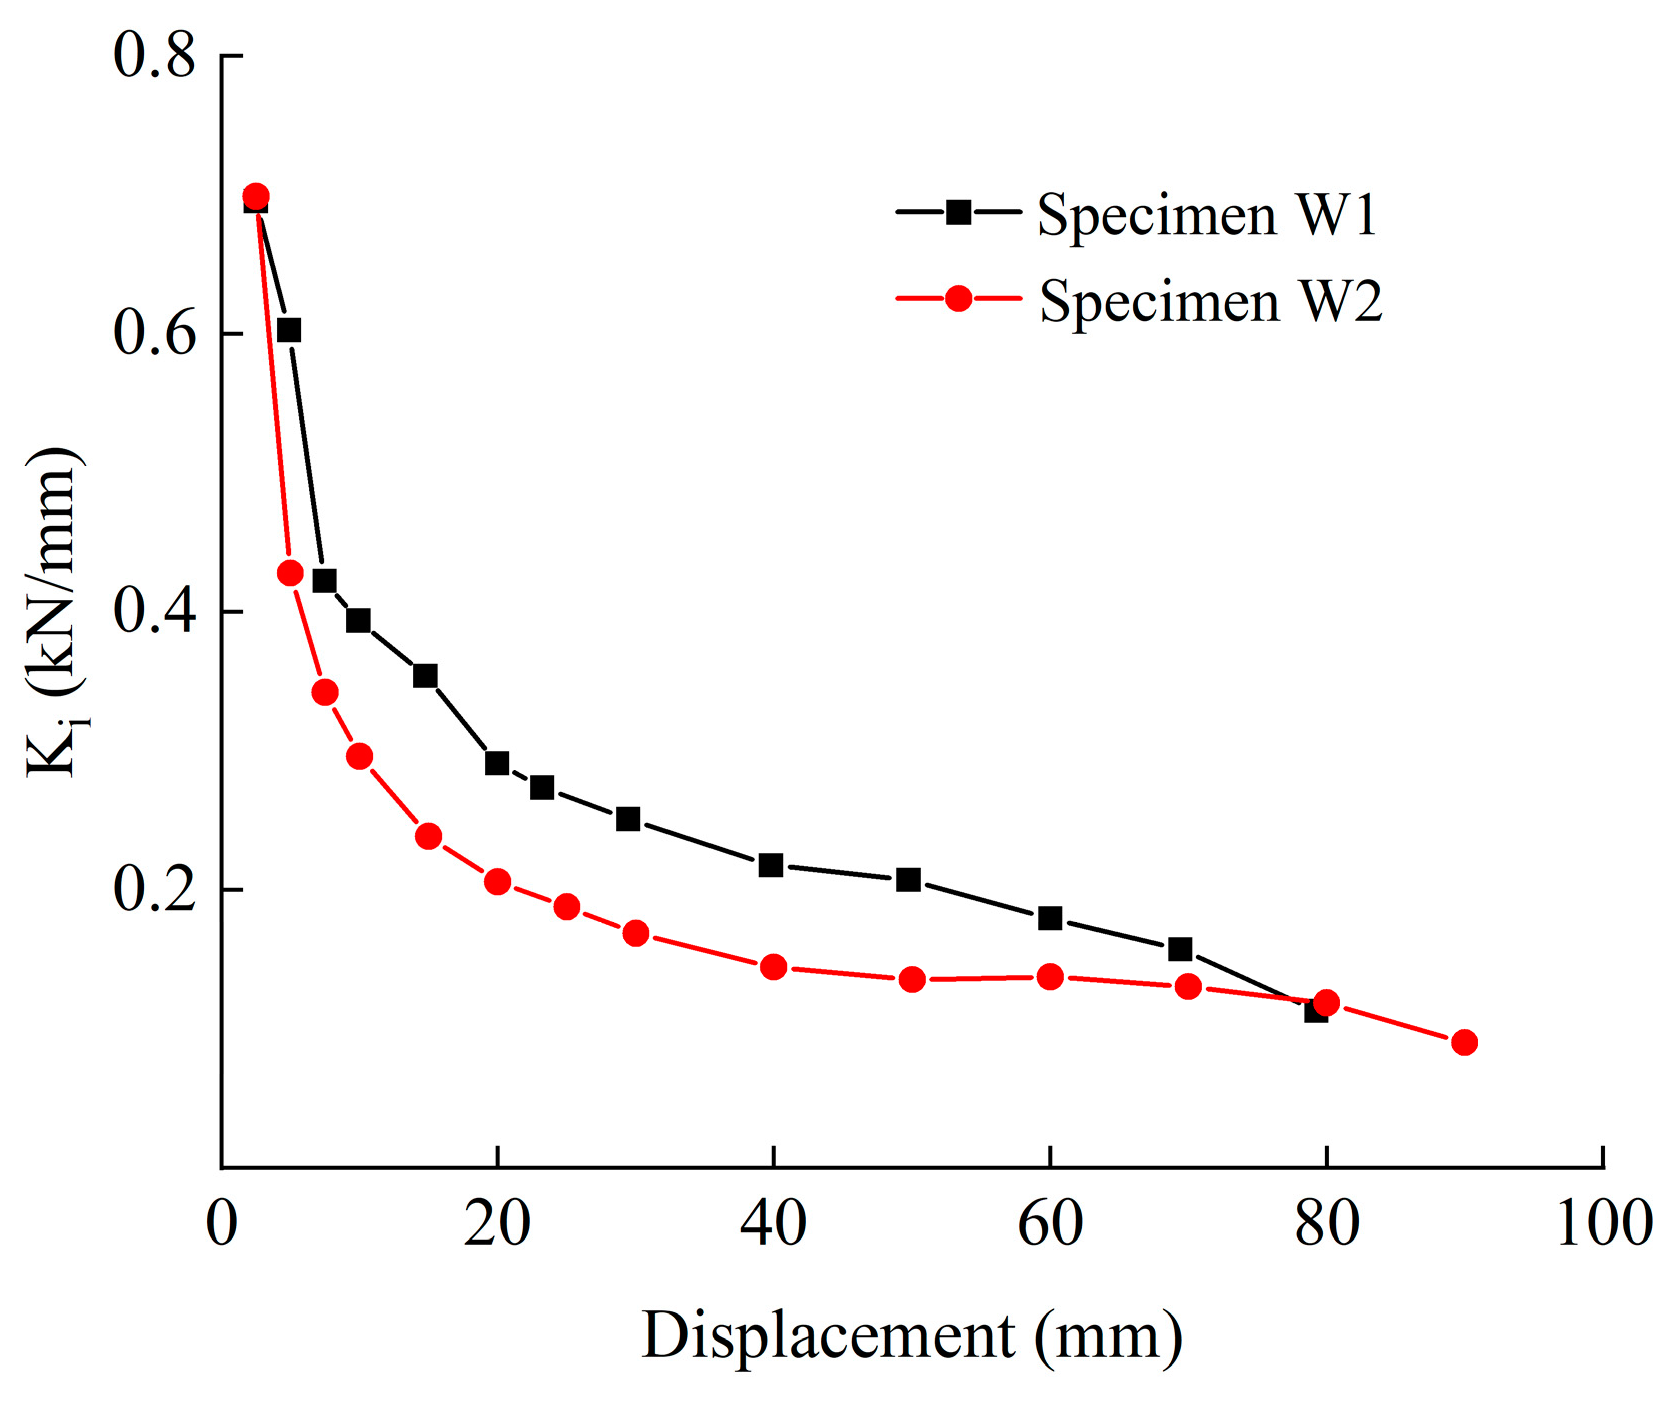
3.3. Stiffness Degradation

The stiffness of a component can be expressed using secant stiffness, taking the value at the first loading stage for each increment. The expression is as follows:
K i = + F i + F i + X i + X i
where: + F i , F i represent the affirmative and adverse peak load values at the i-th loading stage, respectively, and X i , X i denote the displacement values at the affirmative and adverse peak points of the i-th loading stage.
We calculated the stiffness coefficients K i according to the formula. The stiffness coefficient represents the component’s resistance to deformation. The calculation results are shown in Figure 10, where the stiffness of specimen W1 is generally greater than that of specimen W2. During the initial loading stages, both specimens exhibited a higher rate of stiffness degradation. As displacement increases, the degradation became more gradual. Towards the end of loading, significant damage occurred in the connectors and screw holes of the components and wall panels, leading to a stiffness approaching zero.

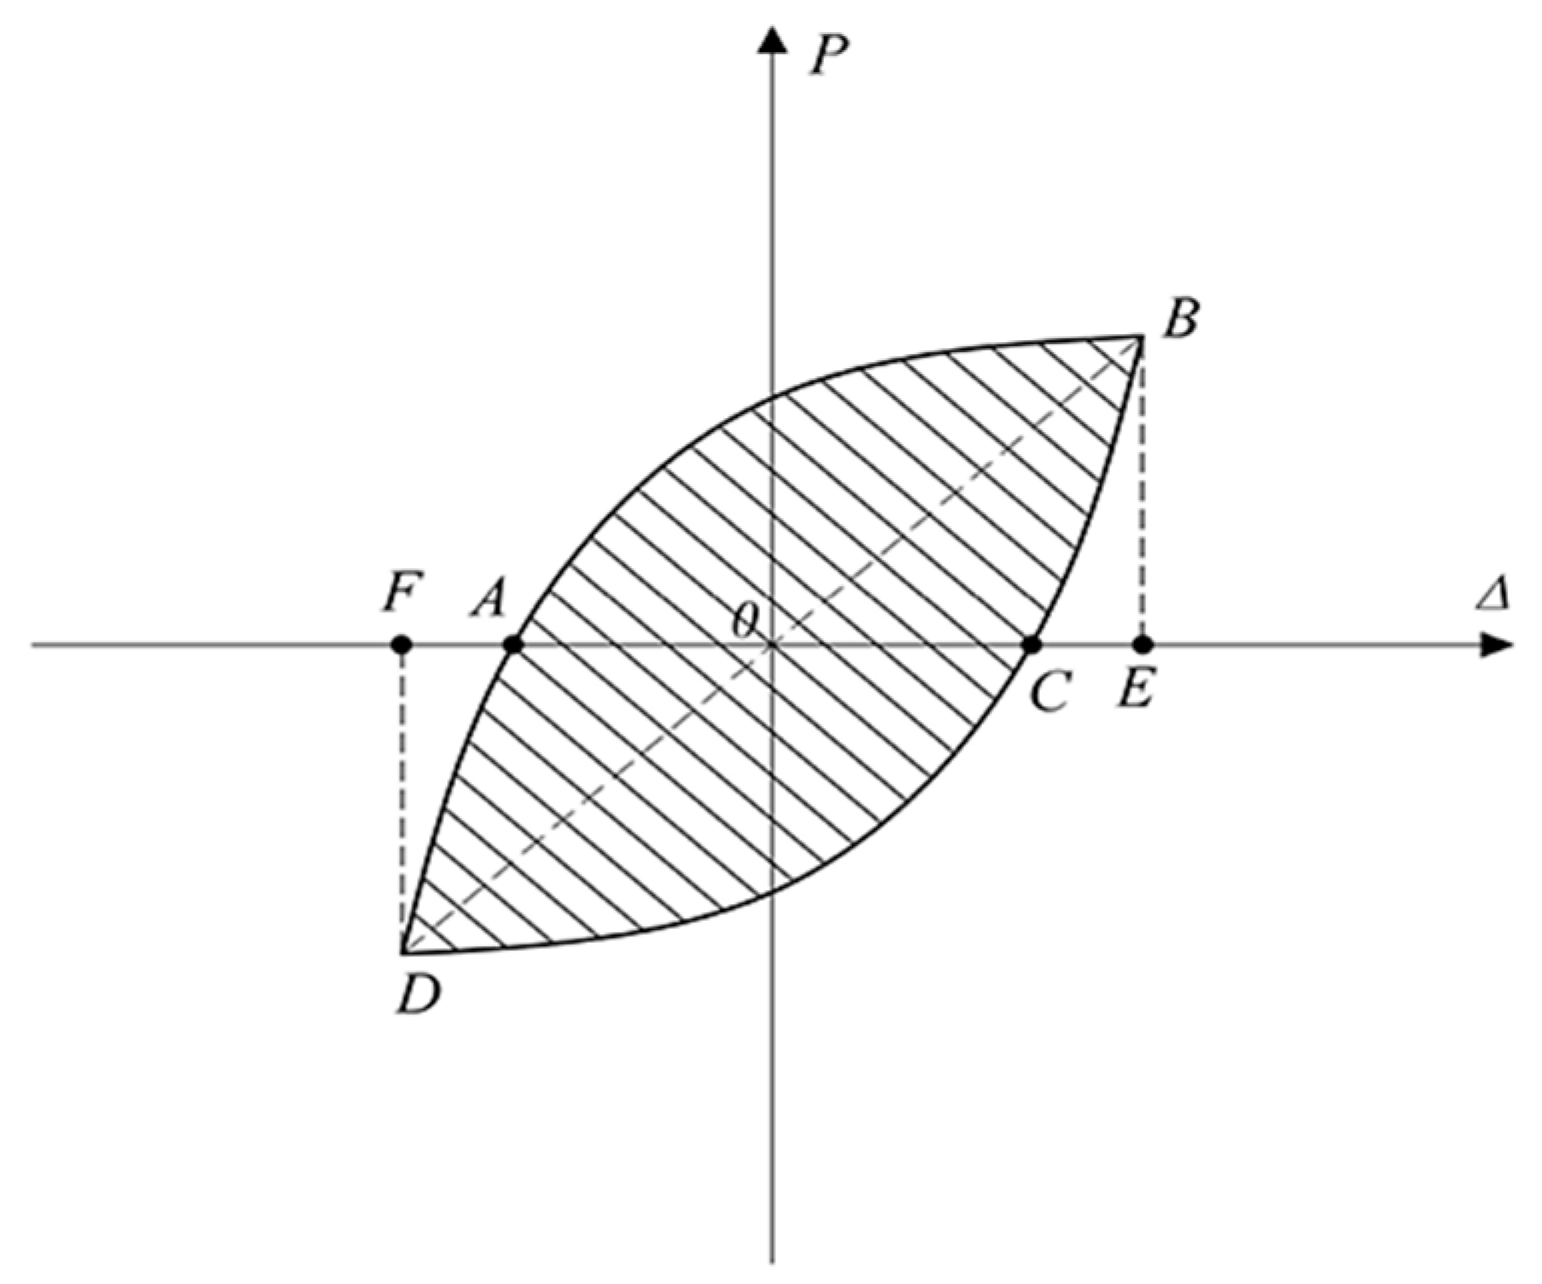
3.4. Evaluation and Analysis of Energy Dissipation

The energy dissipation coefficient E represents the energy dissipation capacity of the component and is a significant parameter for assessment of the seismic performance. A larger E indicates better energy dissipation performance of the component, while a smaller E indicates poorer performance. The expression is as follows [27]:
E = S ( A B C + C D A ) S ( O D B + O D F )
where: S ( A B C + C D A ) is the region contained by the hysteresis loop in Figure 11 and S ( O B E + O D F ) is the total of the region of triangles polygons OBE and ODF in Figure 11.
Using Formula (3), the energy dissipation coefficients of components W1 and W2 could be computed, as shown in Table 3, and the trends of the energy dissipation coefficients of the two components were consistent. The elastic point was defined as the point corresponding to the lateral stiffness K 300 . The energy dissipation coefficients at the elastic point were 1.36 and 1.32, indicating better energy dissipation performance of the components in the early loading stages when the specimens had not experienced significant damage. With the escalation in loading displacement, there was a remarkable decrease in the energy dissipation coefficients of the specimens, indicating noticeable damage to the components. The energy dissipation efficiency of component W1 was superior to that of component W2 at each stage. The total energy dissipation coefficients of the two components were 1.24 and 1.06, respectively. It can be inferred that the arrangement of wall panels had a considerable influence on the energy dissipation of the components.

4. Finite Element Analysis

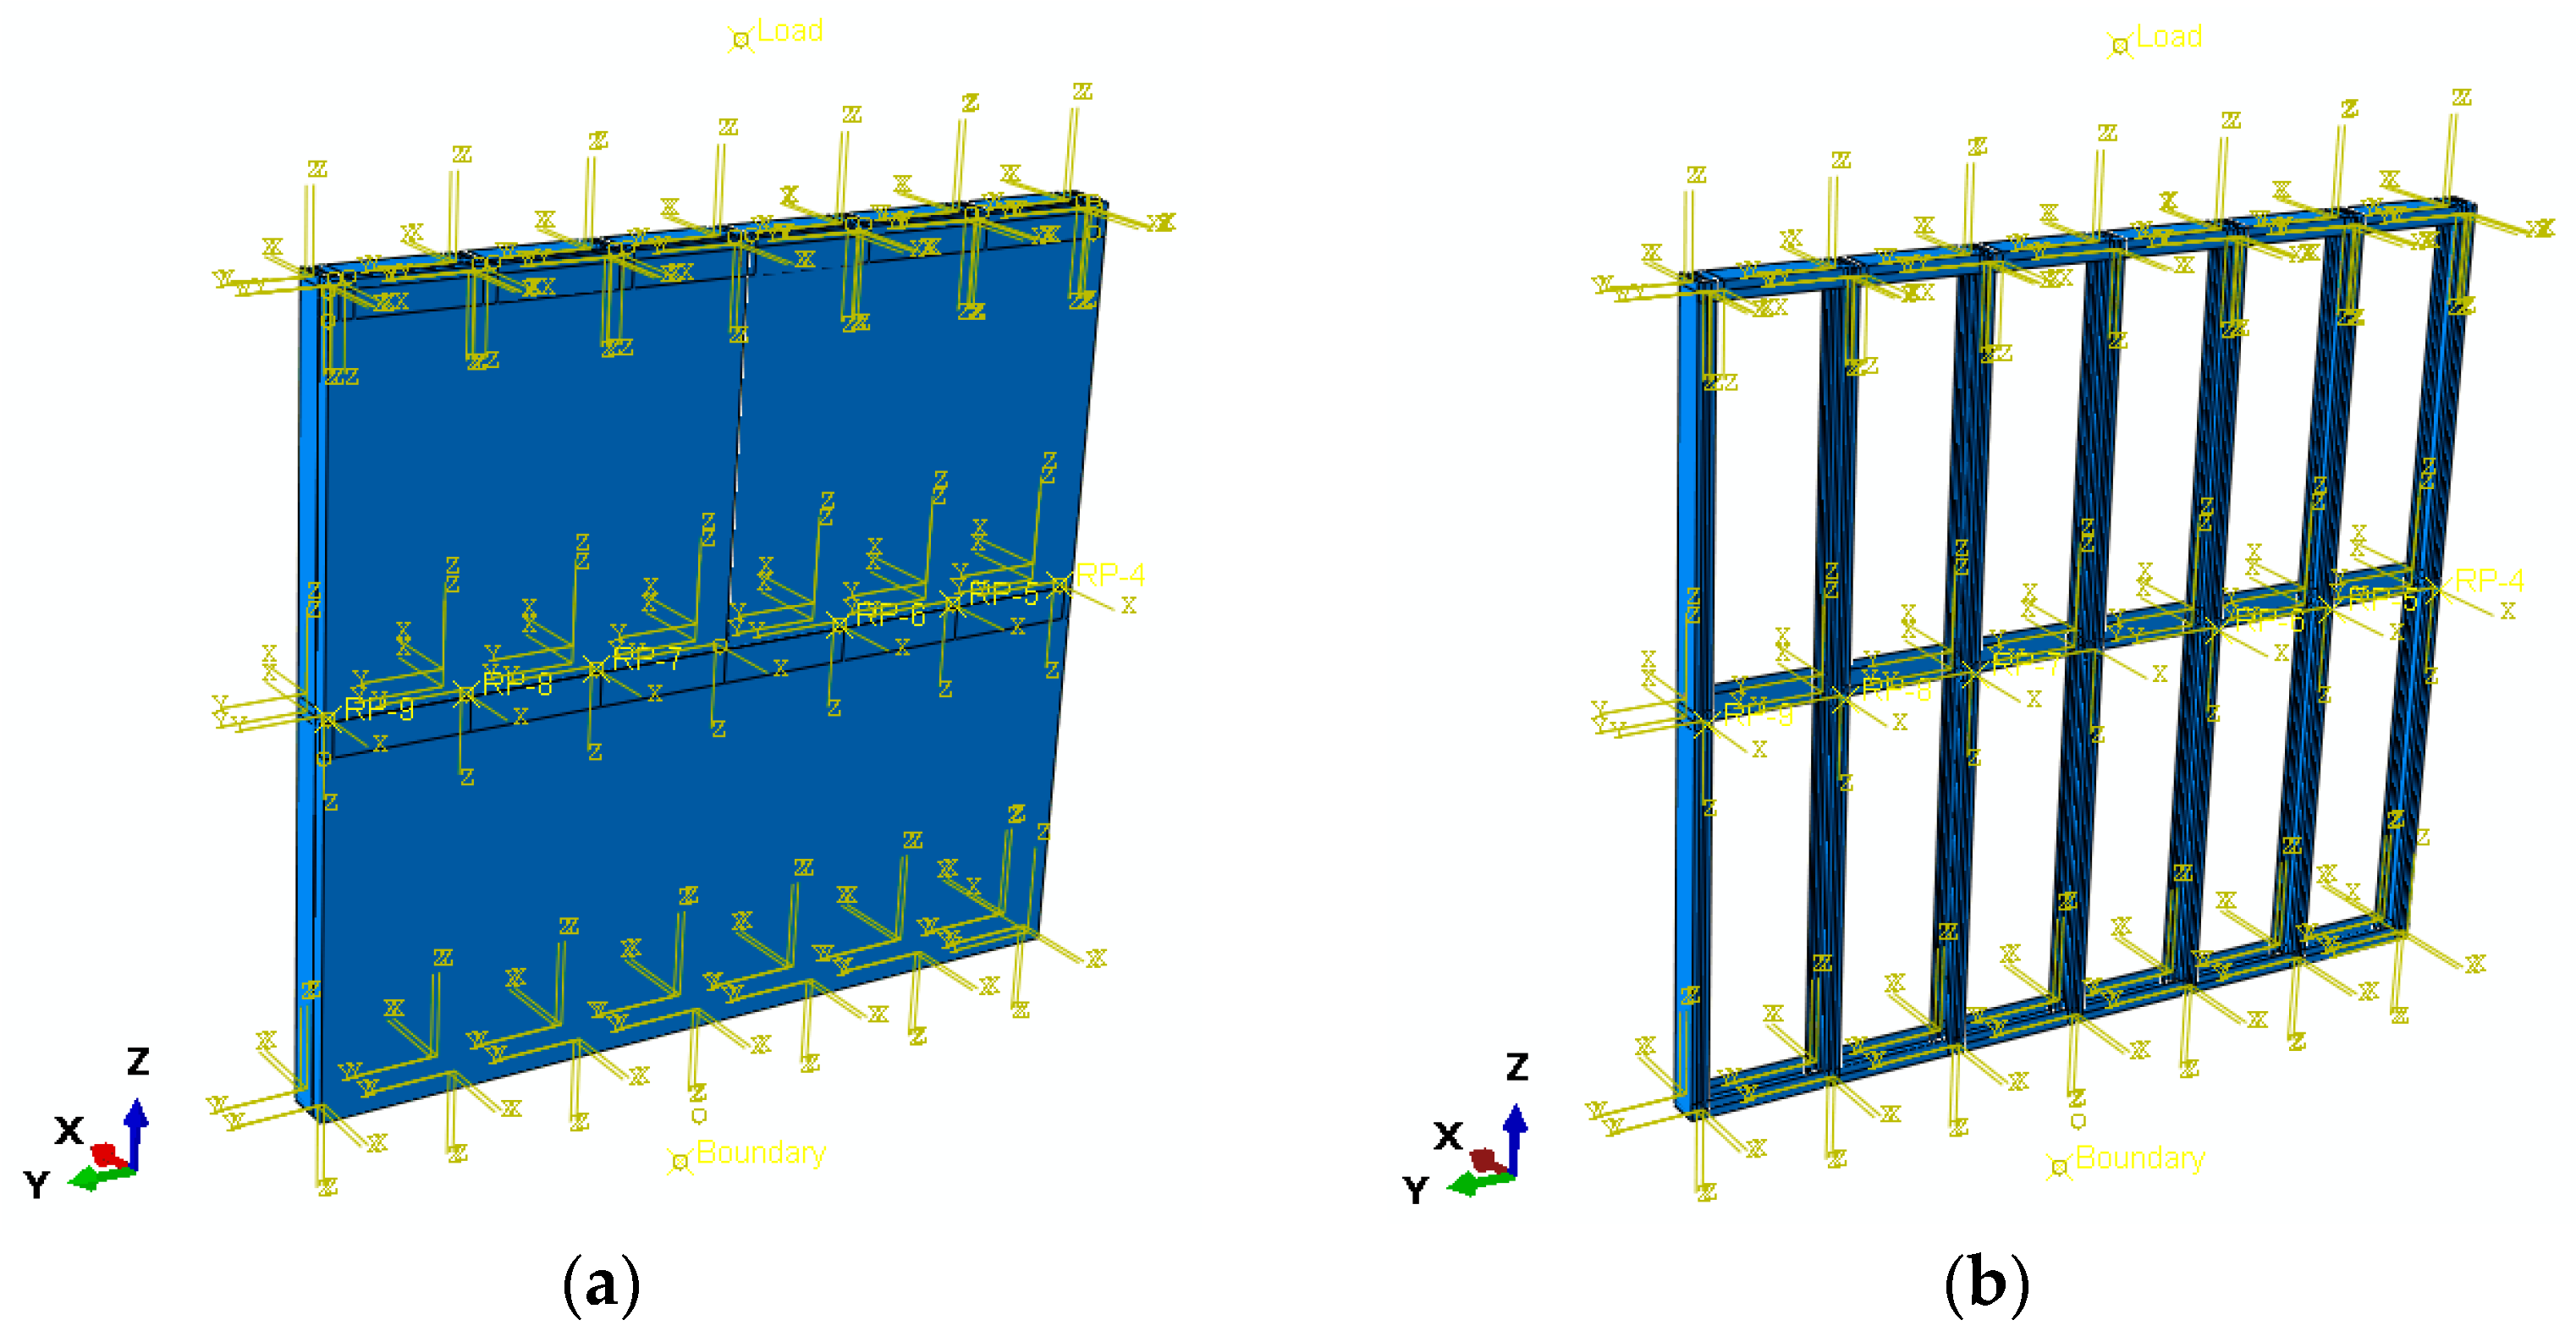
4.1. Finite Element Modeling

S4R shell elements were selected for the cold-formed thin-walled steel [28], while C3D8R elements were chosen for the sandwich wall panels. Cold-formed thin-walled steel was chosen to follow the ideal elastic–plastic model [29], with the yield standard being the von Mises yield standard [30]. The concrete damage plastic (CDP) model [31] was used for concrete with an elastic modulus and compressive and tensile behaviors, following the reference [31,32]. Due to the inconsistency between the damage parameters input into Abaqus and those provided in reference [31], it was necessary to convert the damage parameters.
d = 1 σ E 0 ε
D = 1 1 d
where d is the damage factor for concrete under tensile or compressive states, as described in the reference; D is the damage factor for concrete under tensile or compressive states in Abaqus; σ is the true stress of the concrete; E 0 is the initial elastic modulus of the concrete; and ε is the true strain of the concrete.
In addition, Abaqus requires the input of other parameters (Table 4) [32], fb0 is the ratio of the biaxial ultimate compressive strength, fc0 is the ratio of the biaxial ultimate compressive strength, and K is the ratio of secondary stress invariants on the tensile to compressive meridian planes.
The flat steel connectors, L-shaped connectors, and self-tapping screws of the specimens were simulated using connector elements, with the Slide-Plane attribute selected. The freedom of movement in Ux, Urx, Ury, and Urz orientations was fixed, while the freedom of movement in the Uy and Uz directions was released [32].
The connect relationship of the self-tapping screws was based on the shear test data from Section 2. The thickness of the concrete sandwich wall panel was relatively large, and it was difficult to clamp the fixture, making it impossible to conduct connectivity performance tests. Therefore, referring to reference [30], the constitutive relationship of the connector element was adjusted through finite element simulation and comparison with experimental results. Finally, the constitutive relationship was determined, as shown in Figure 12 and Figure 13.
At the bottom of the specimen, a reference point, ‘Boundary’, was established and coupled with the six degrees of freedom of the bottom U-shaped steel plate. Since there was no translational or rotational motion at the bottom of the specimen during the experiment, the six degrees of freedom of this reference point were constrained in the initial analysis step. In the Step 1 analysis step, gravity was applied to the concrete. A reference point, ‘Load’, was established to couple the six degrees of freedom of movement of the top U-shaped steel plate. In Step 2, the same horizontal displacement boundary conditions as the experiment were applied to the reference point ‘Boundary’. The mesh size for the steel was set to 30 mm, with the mesh being generated using a free meshing method. For the concrete, the mesh size was 40 mm, and a structured meshing method was employed to generate the mesh.

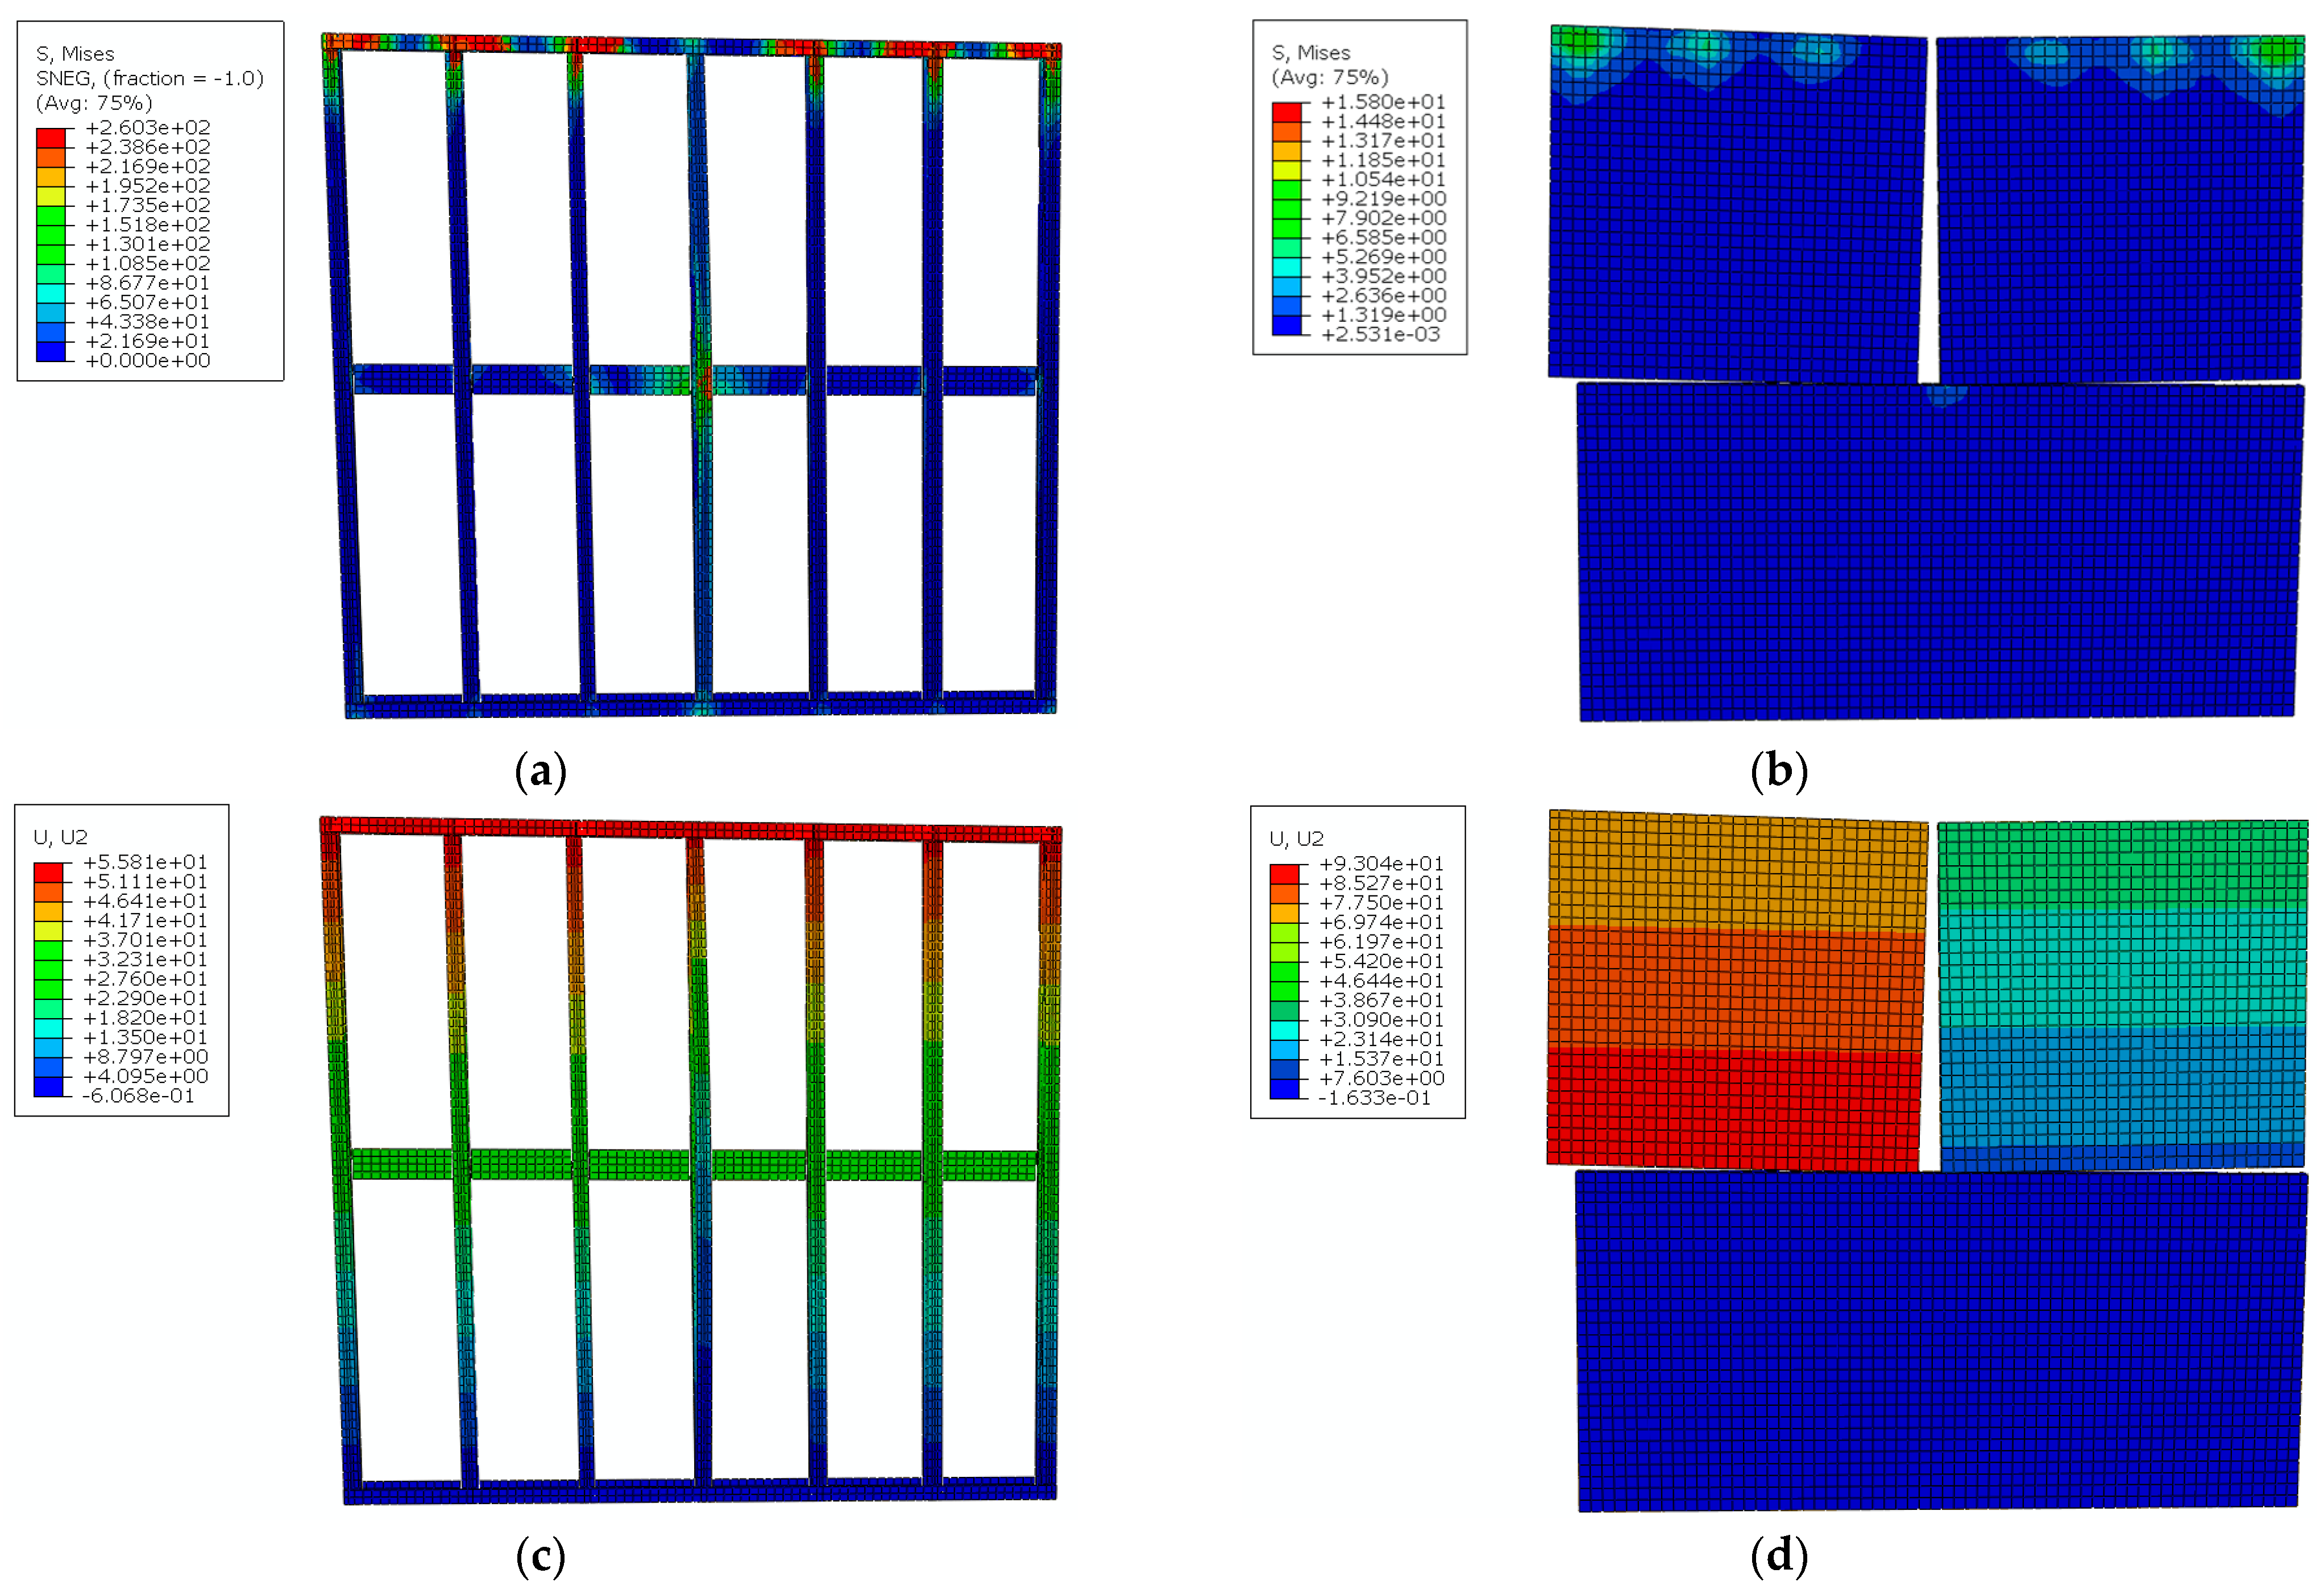
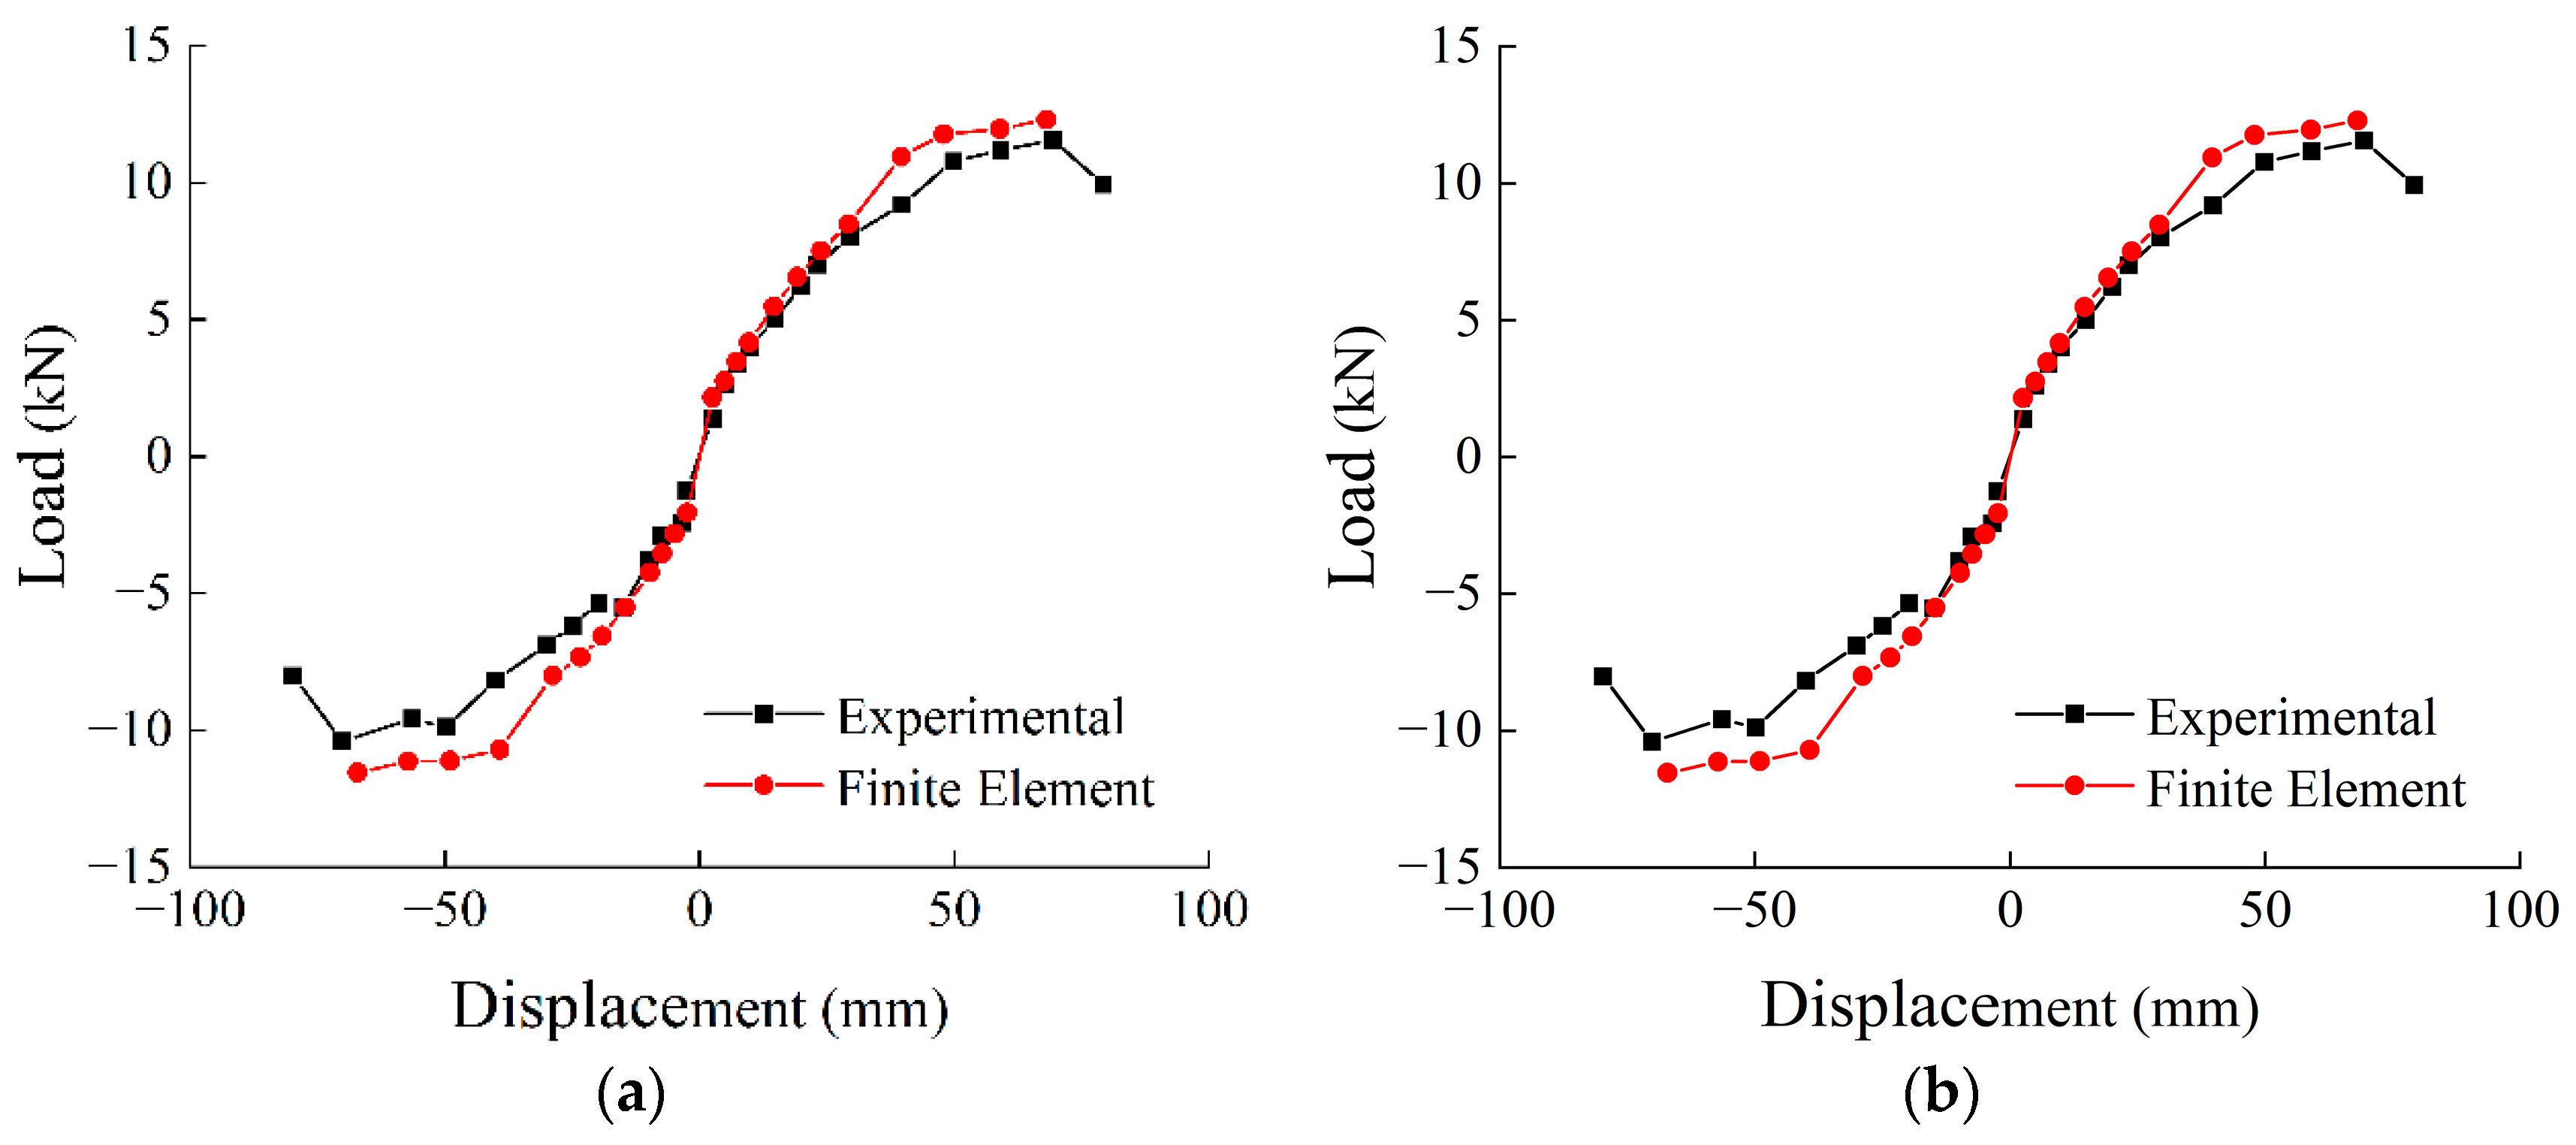
4.2. Validation of Finite Element Model

Based on the aforementioned finite element method, a finite element model was generated using ABAUQS2021 software. The failure pattern of the W1 specimen is depicted in Figure 14. The connection among the steel frame and the concrete insulated sandwich wall panel experienced significant stress concentration. The top portion of the steel frame reaching 260.06 MPa indicates that it yielded, suggesting that the wall panel will fail first at the corresponding connect location. The upper region of the steel frame exhibited significant displacement, with displacement increasing progressively from top to bottom. There was considerable relative displacement between the upper and lower wall panels, accompanied by slight rotation of the upper wall panel. This phenomenon is consistent with the experimental observations.
As depicted in Figure 15, the skeleton curves of the finite element analysis closely matched those of the experiments. The errors between the finite element analysis and tests for the yield displacements were 7.26% and 8.57%, while for the yield loads, they were 12.53% and 4.16%. The errors for the peak displacements were 1.83% and 0.75%, and for the peak loads, they were 6.27% and 10.39%. The stiffness errors were 3.26% and 14.27%. All errors were within 15%. The method demonstrated a high degree of precision in simulating the behavior of the experiment under low-cycle reciprocating motion. This indicates that the finite element model can effectively capture the experimental response with a high degree of fidelity.

4.3. Analysis of Factors Influencing Shear Resistance

To further investigate the shear resistance of the specimen, the validated finite element method was enhanced by incorporating the effect of diagonal braces (X-braces) and the arrangement pattern of the wall panels on shear capacity, the dimensions of the wall panels, and the strength of the connection.

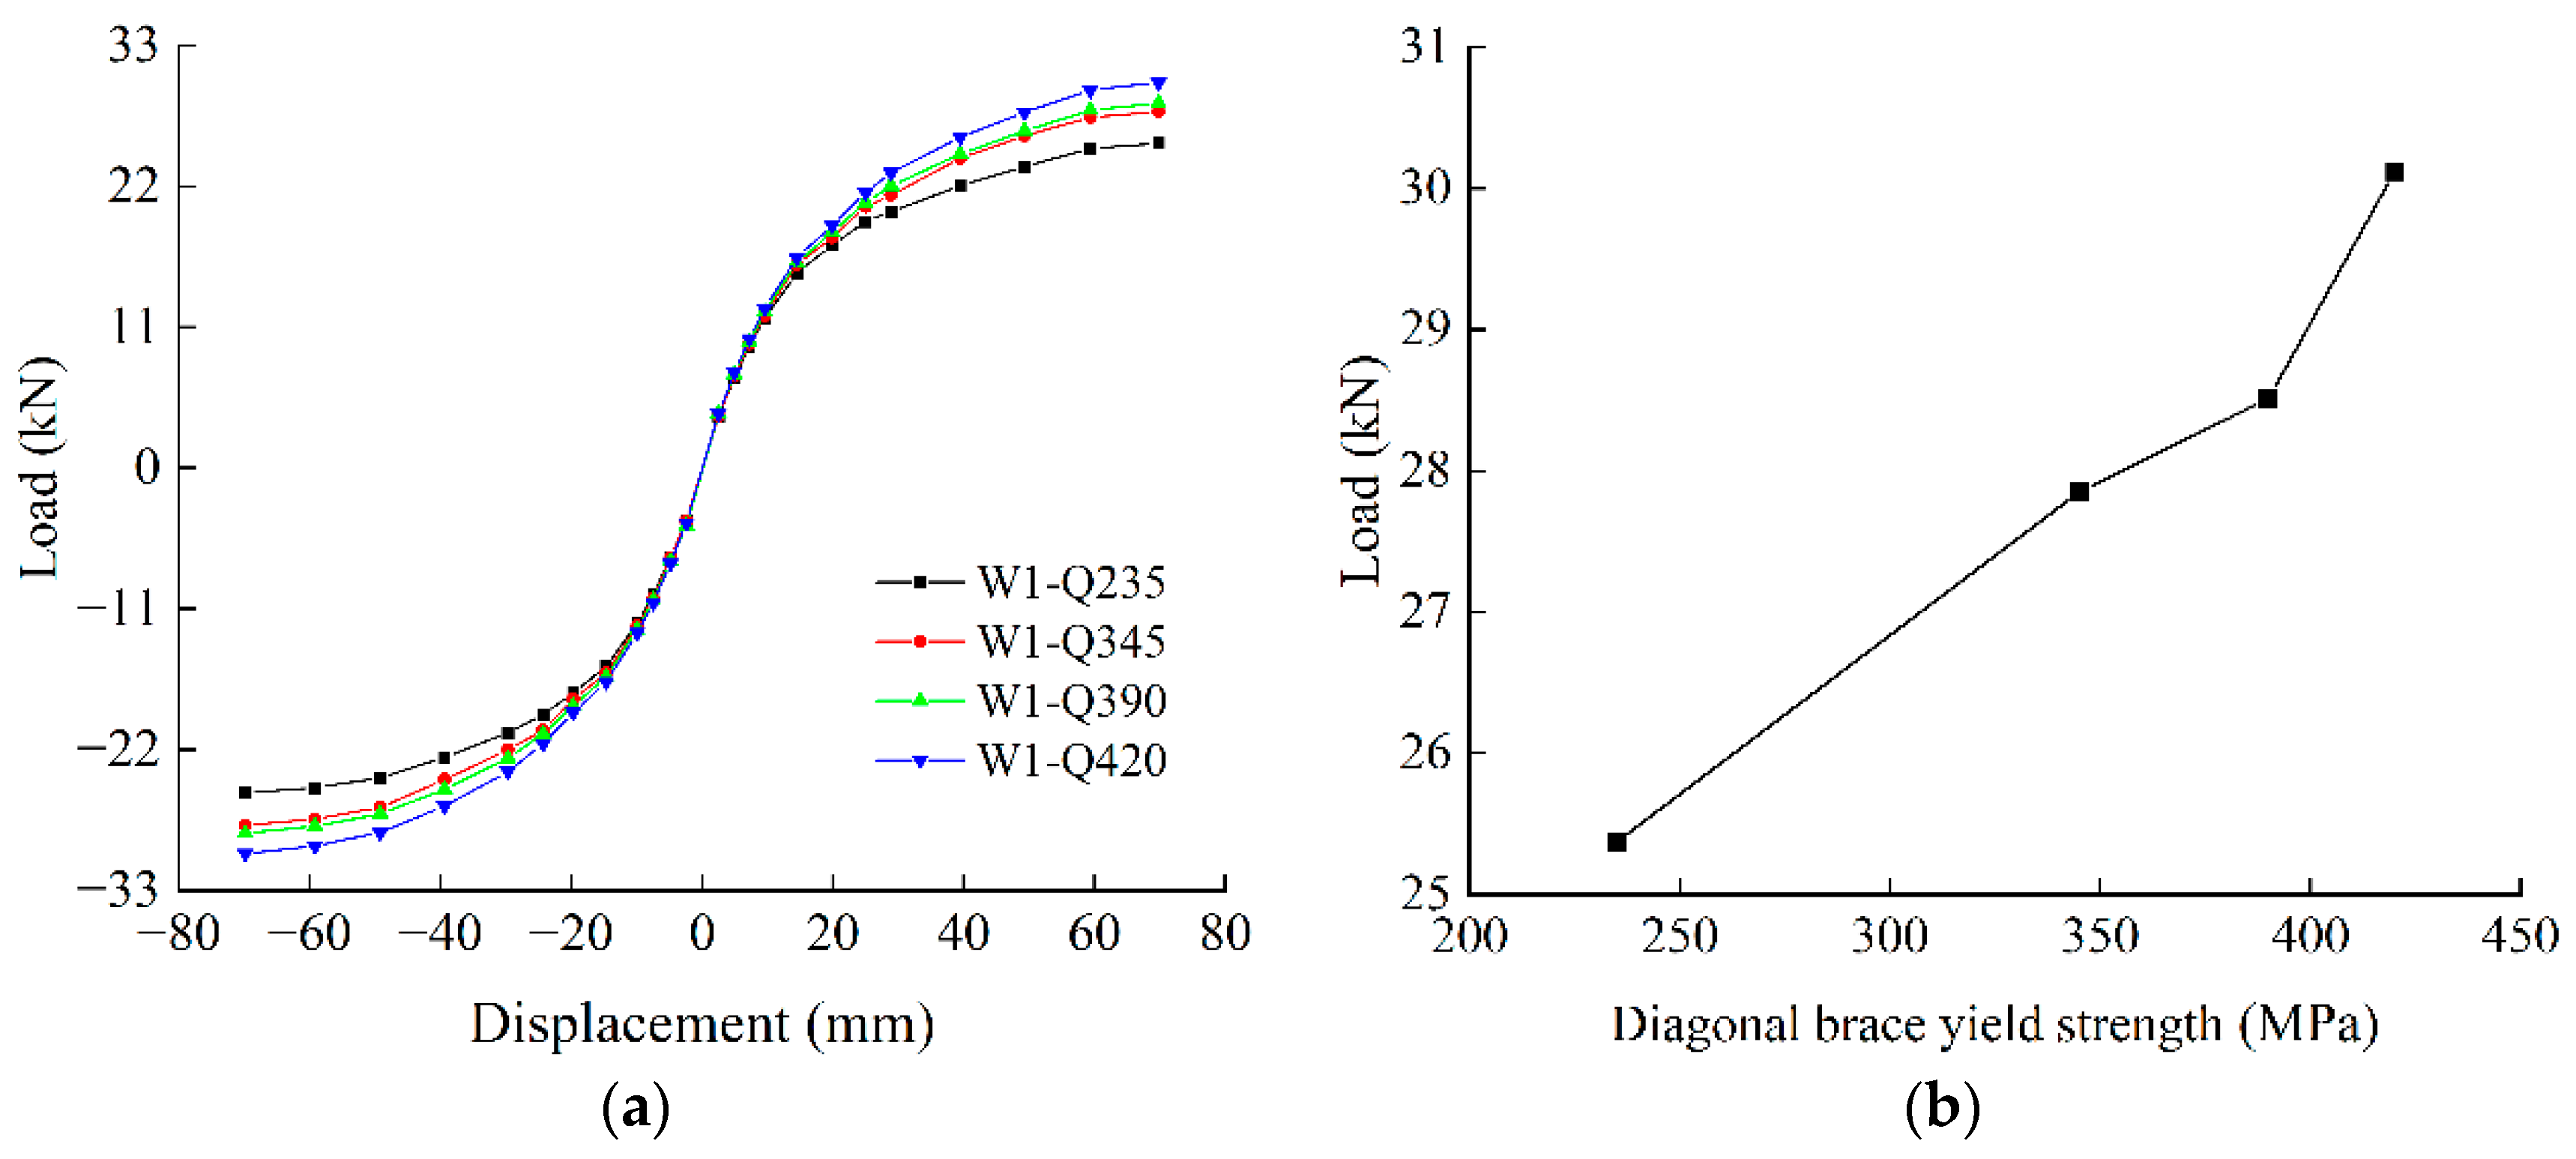
4.3.1. Diagonal Brace Yield Strength

The steel materials selected for the diagonal braces in this study included Q235, Q345, Q390, and Q420, with respective yield strengths of 235 MPa, 345 MPa, 390 MPa, and 420 MPa. The parameters are outlined in Table 5.
The impact of diagonal braces with different yield strengths on the shear capacity of the W1 specimens was assessed. The skeleton curves of each finite element model after analysis are illustrated in Figure 16. From Figure 16, it can be observed that the trends of the curves were essentially the same. Prior to loading, the skeleton curves overlapped almost entirely. However, in the later stages of loading, as the displacement increased, the shear capability of the components improved with the yield strength of the diagonal braces. During the process of increasing the yield strength of the diagonal braces from 230 MPa to 420 MPa, the shear bearing capacity of the braces increased by 9.767% to 18.71%. This suggests that increasing the yield strength of the diagonal bracing can enhance the shear capability of the component.

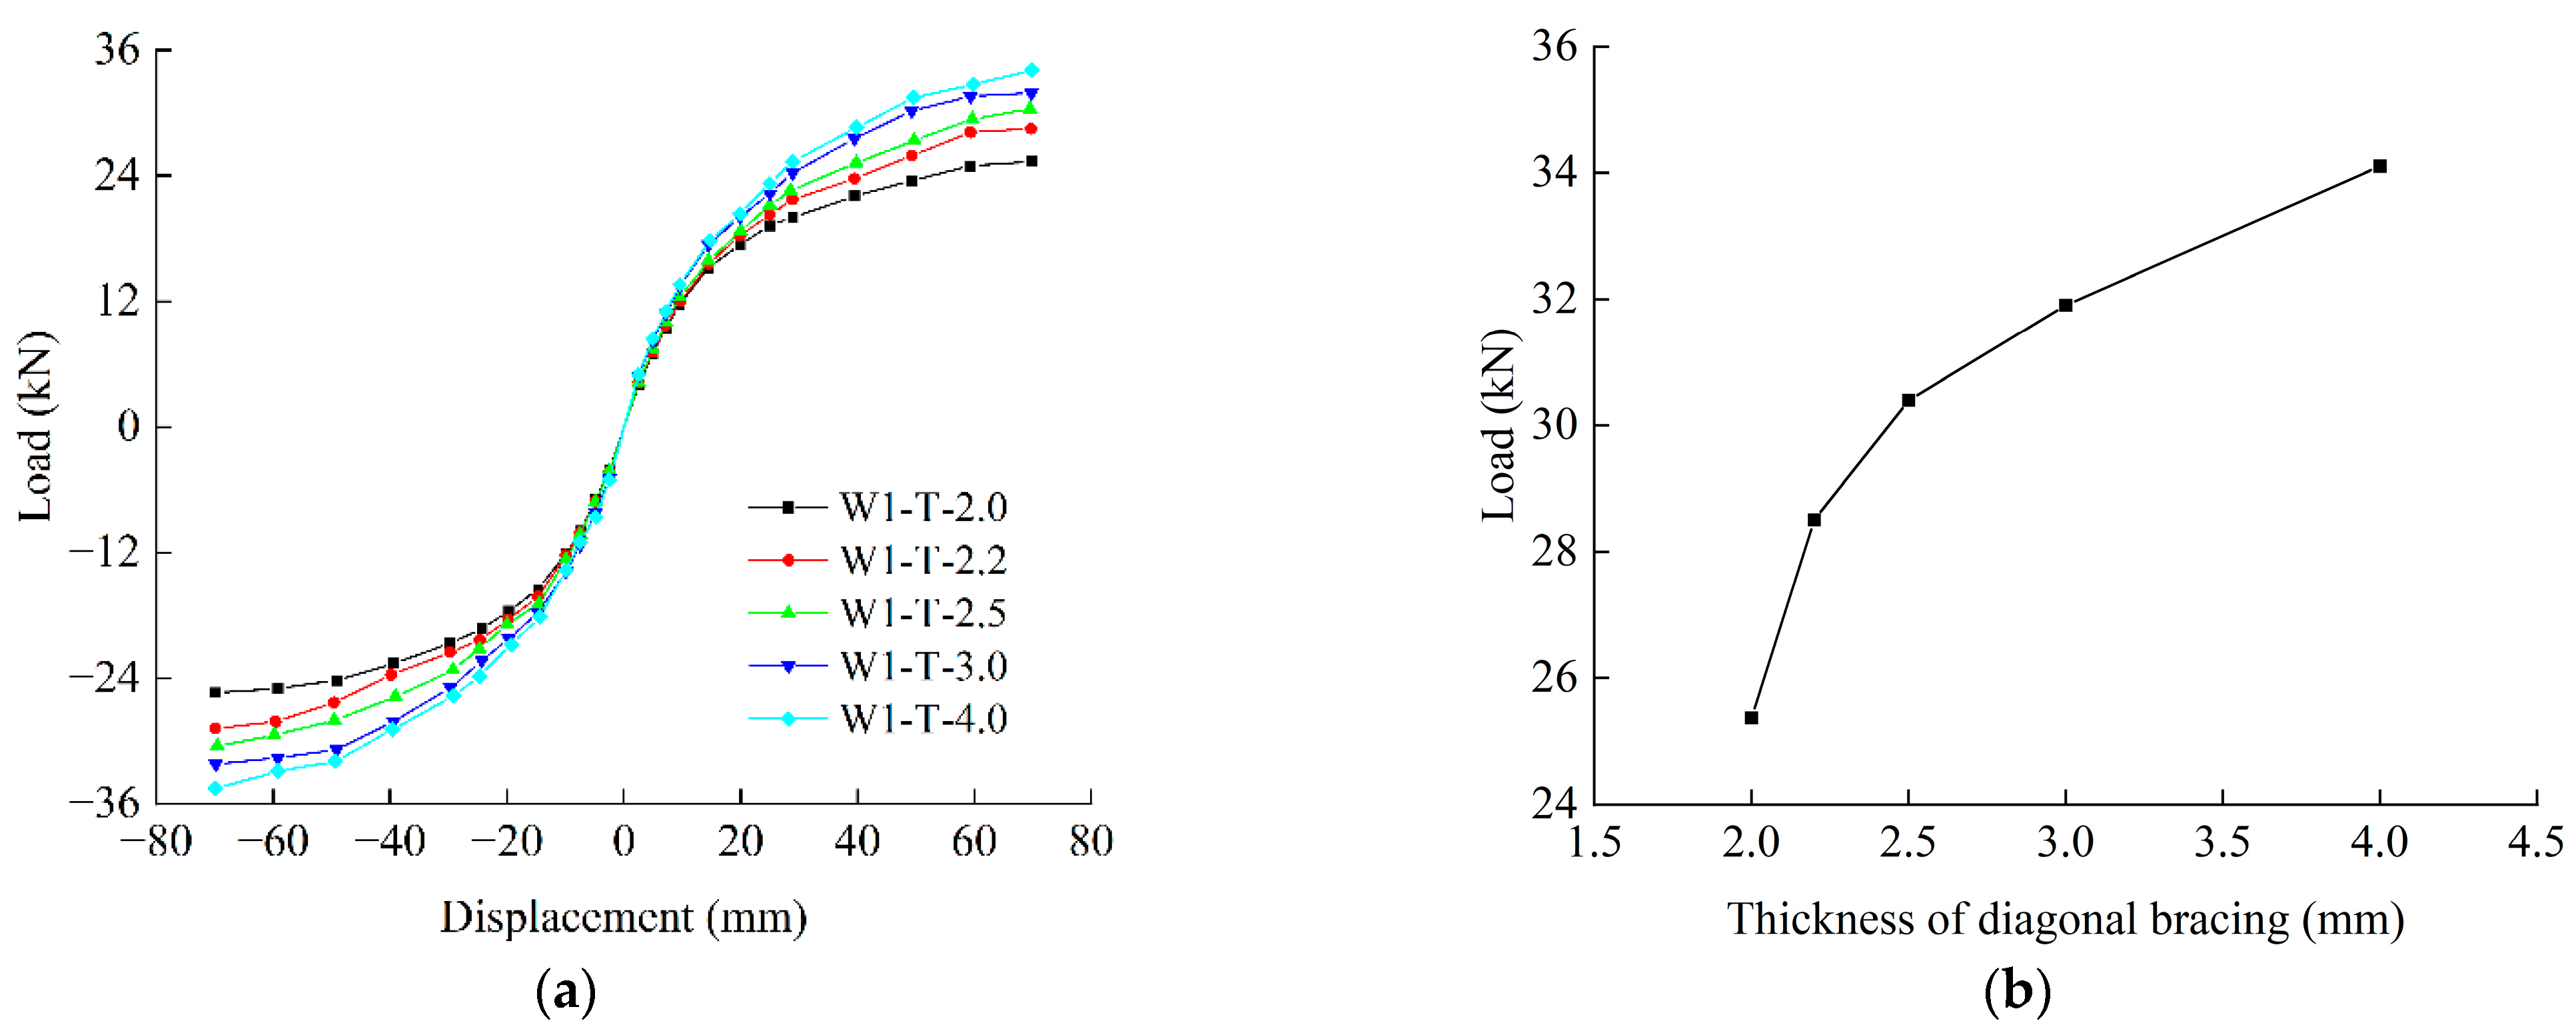
4.3.2. Thickness of Diagonal Bracing

Figure 17 shows that as the diagonal brace thickness increased, the lateral load capacity of the finite element models improved. The load-bearing capacity increased by 12.36% to 34.42% relative to the wall without diagonal braces when increasing the diagonal brace thickness from 2.0 mm to 4.0 mm. This indicates that increasing the diagonal brace thickness can enhance the lateral load capacity of the component.

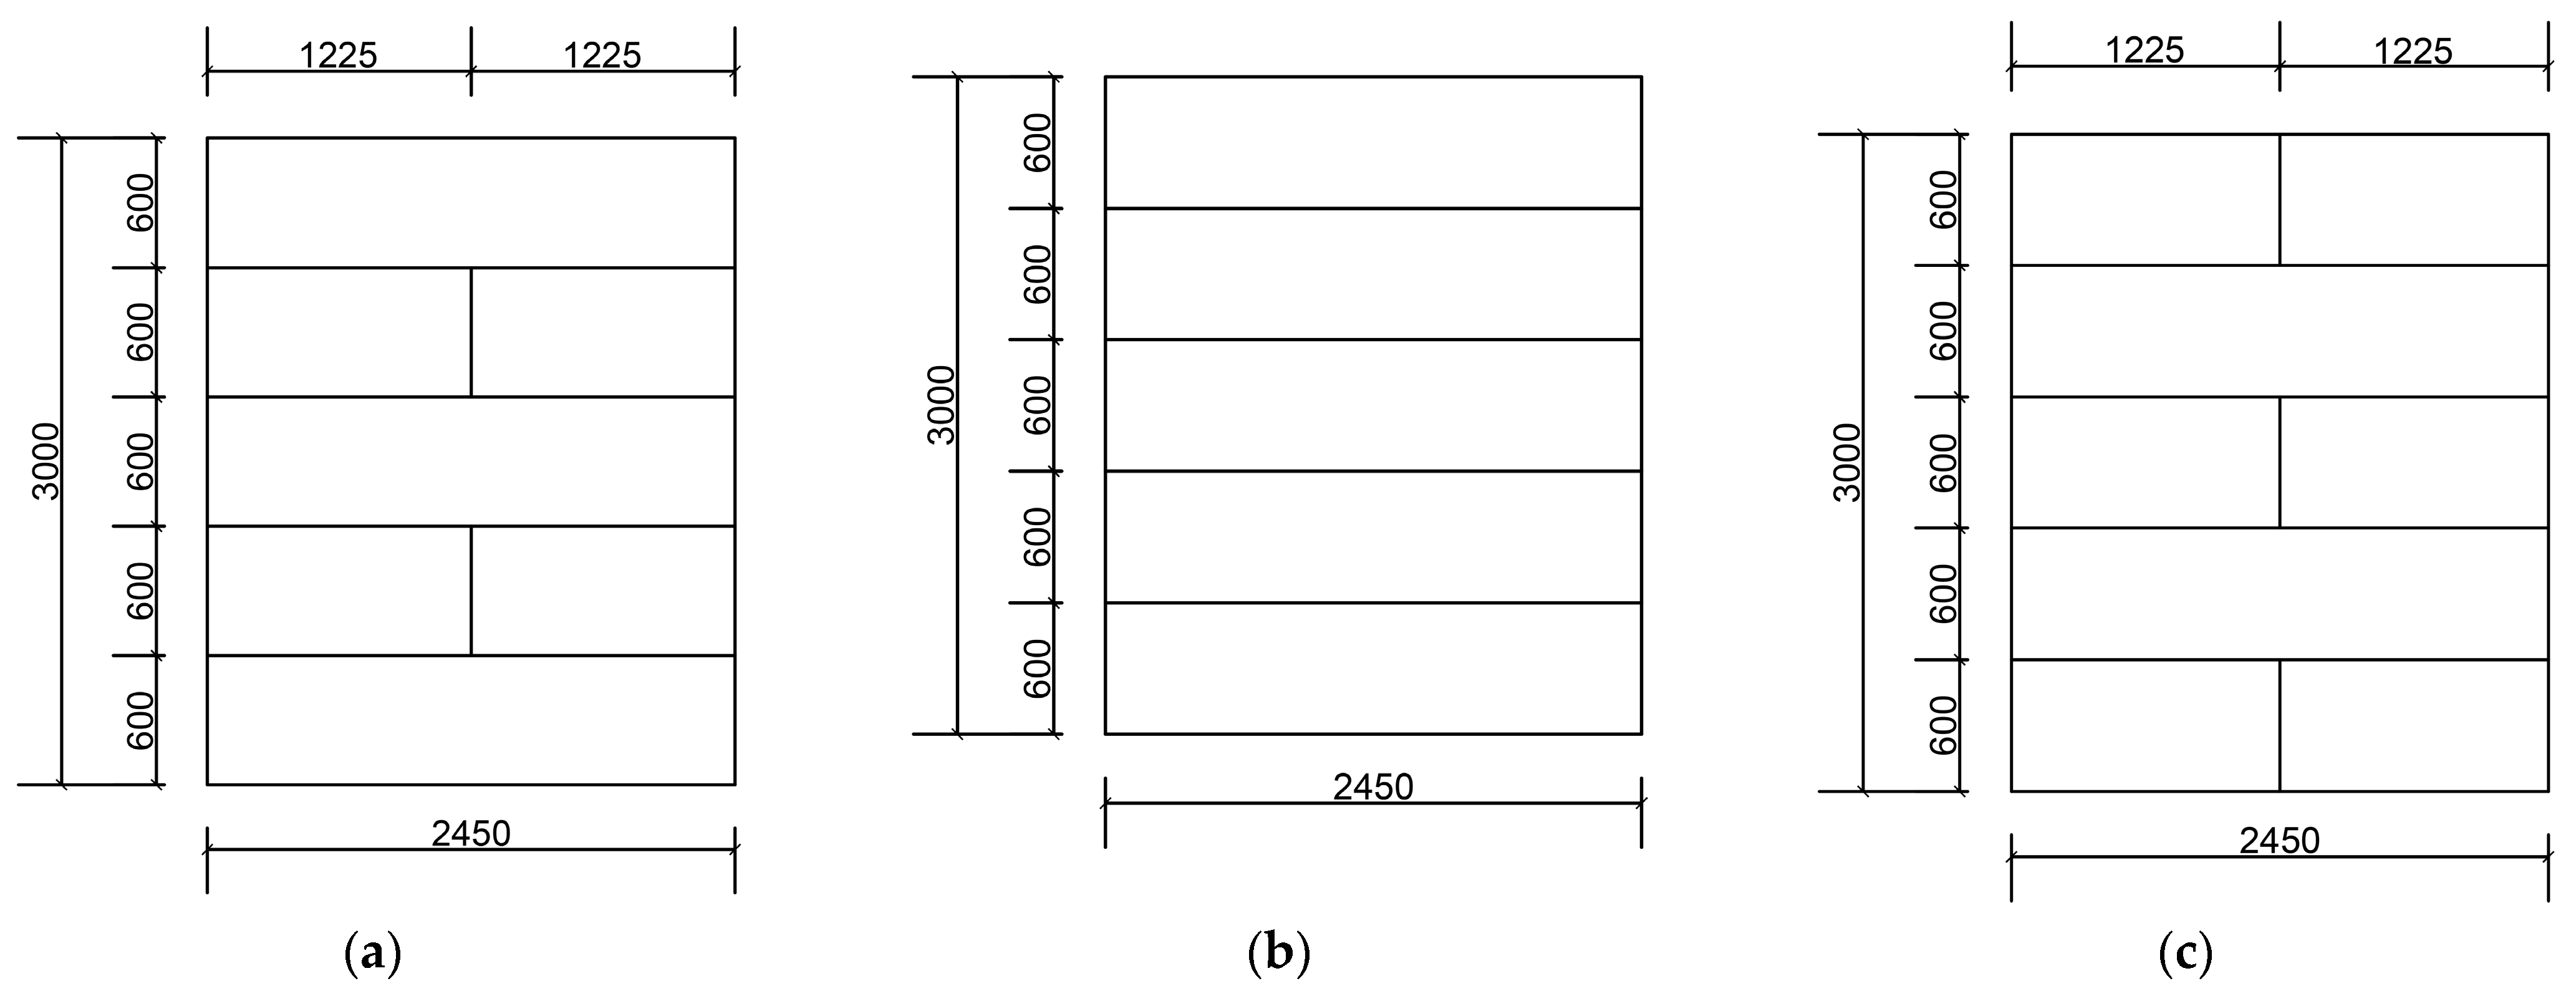
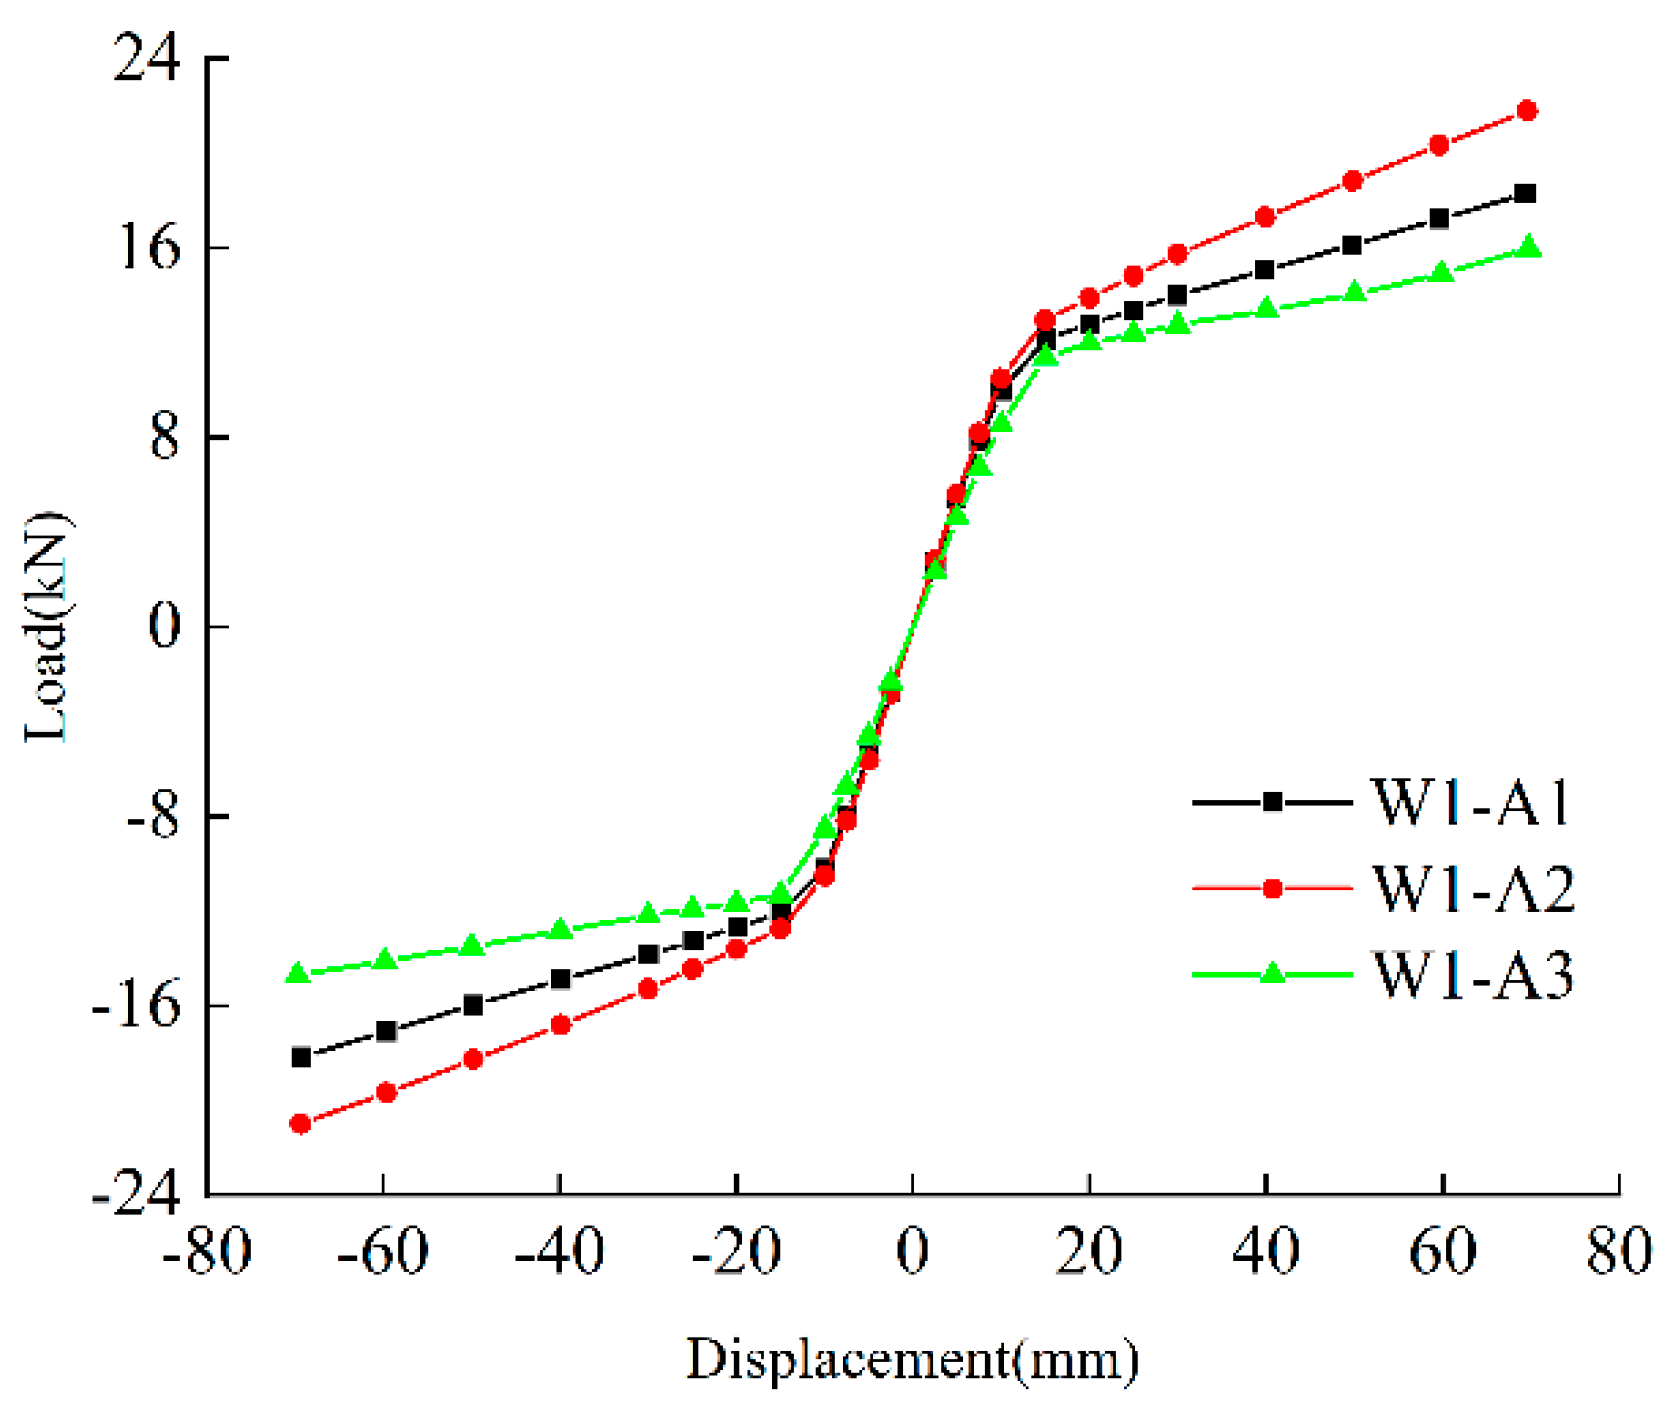
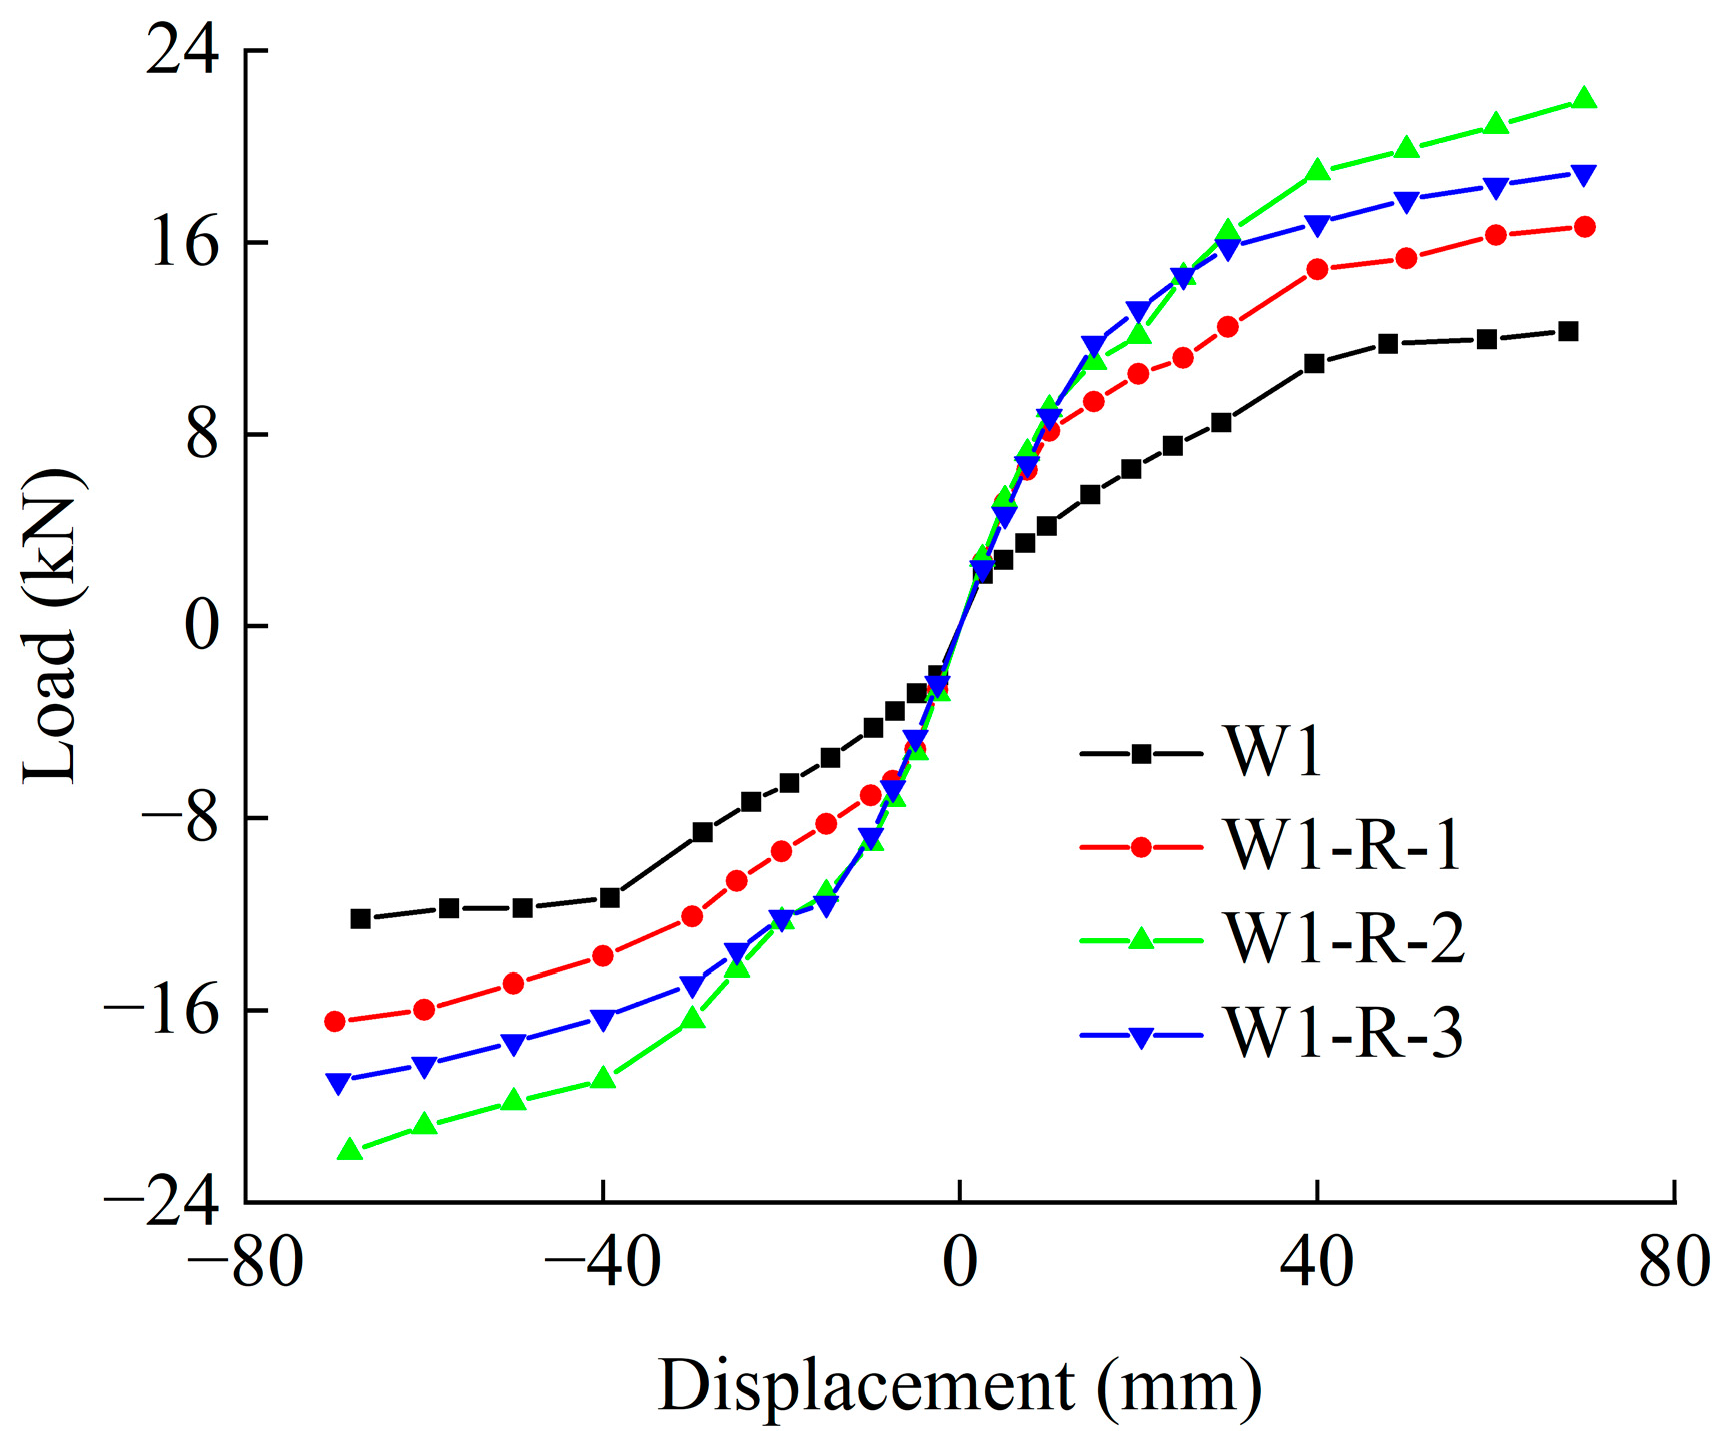
4.3.3. Arrangement Pattern of the Wall Panels

The experimental results indicated that the arrangement of wall panels significantly influenced various seismic performance indicators of specimens. Therefore, three different arrangements of wall panels were selected for finite element analysis. The height of single-story cold-formed thin-walled steel buildings typically ranges from 2.9 m to 3.1 m. Therefore, this study selected a model height of 3.0 m, with wall panel dimensions of 2450 mm × 600 mm × 50 mm and 1225 mm × 600 mm × 50 mm (length × height × thickness). The specific arrangement and numbering of the wall panels are detailed in Figure 18.
The finite element analysis results are shown in Figure 19. Prior to loading, the three curves largely overlapped, whereas in the later stages of loading, the curves gradually diverged. The peak load rankings were as follows: W1-A2 > W1-A1 > W1-A3, with the peak load of W1-A2 being 36.24% higher than that of W1-A3. This indicates that different arrangements of wall panels have a significant impact.

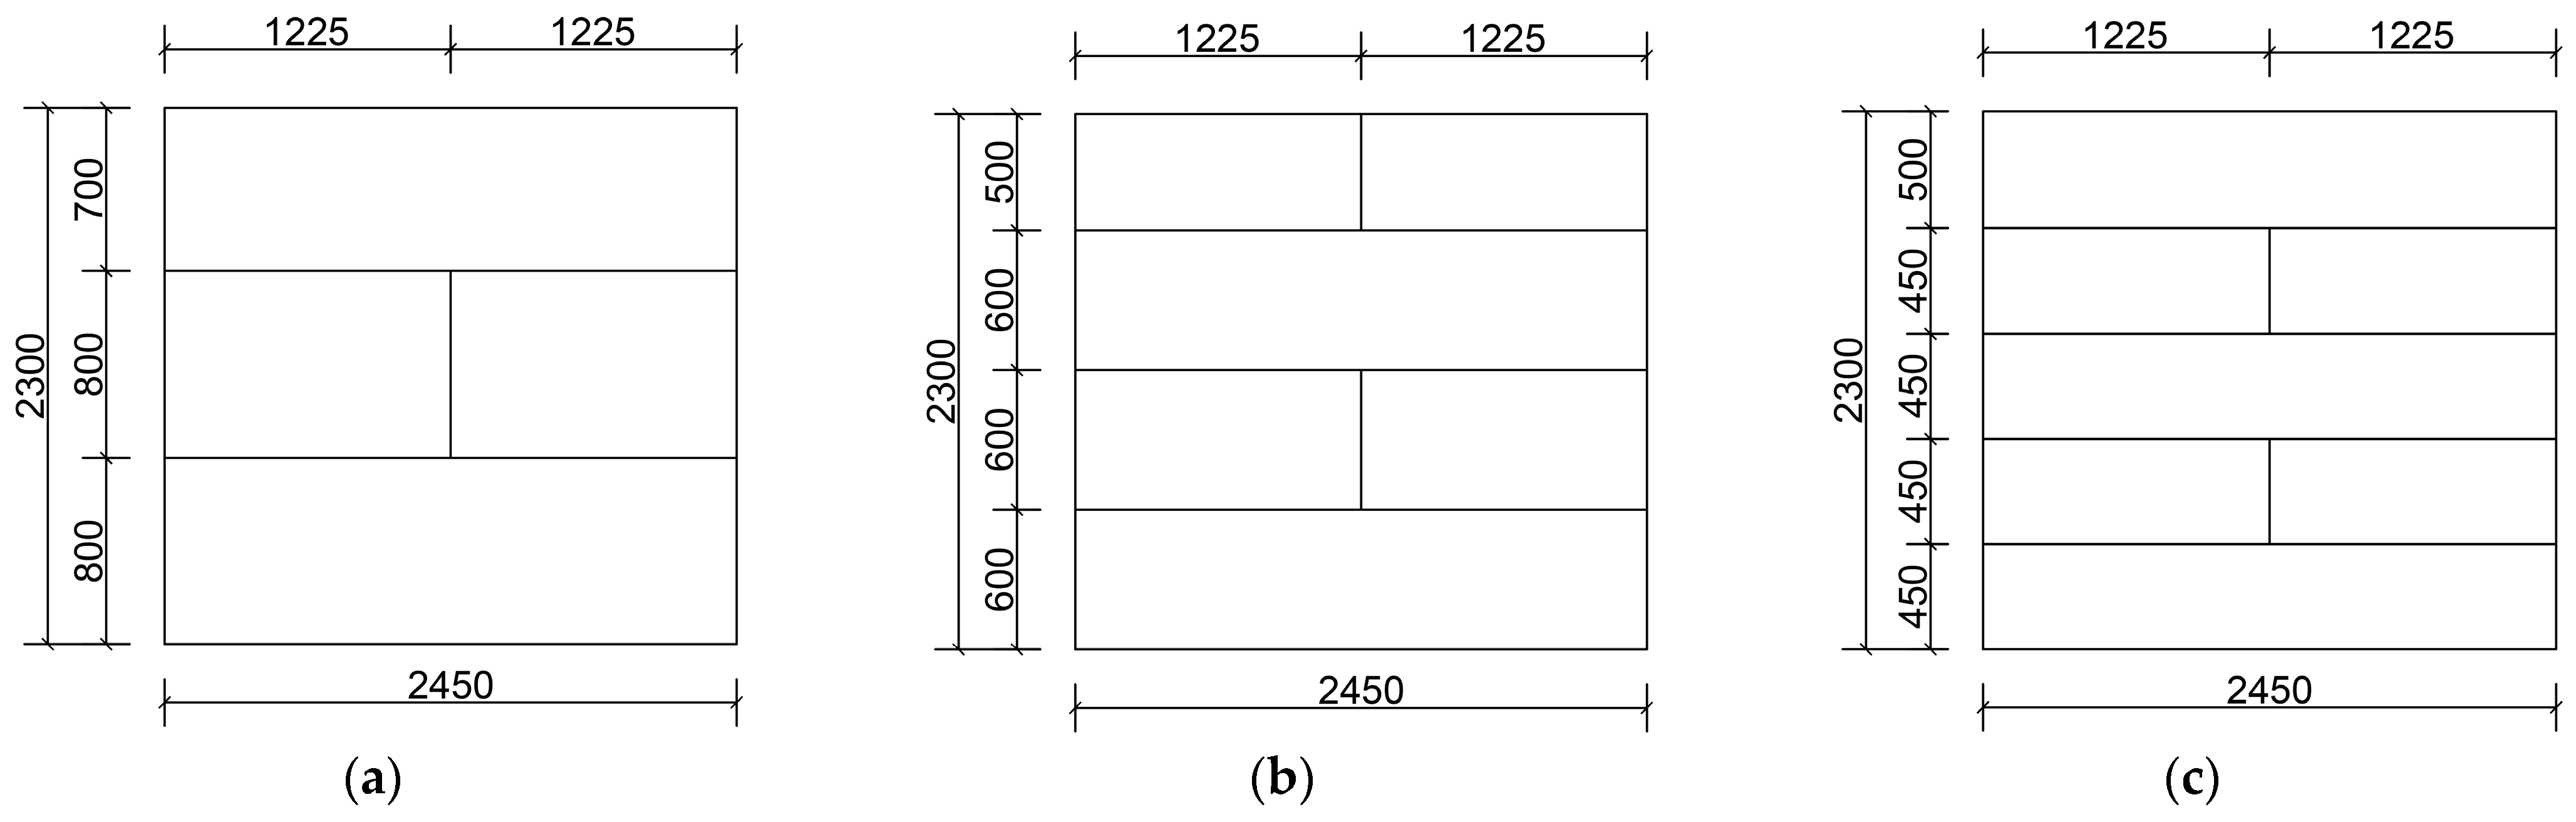
4.3.4. Dimensions of Wall Panels

The dimensions of wall panels are changed by changing their height. When the height of the wall panels is reduced, the number of L-shaped connectors increases due to the increase in the wall panels. The parameters of the wall panels’ dimensions are shown in Table 6. The finite element model for W1 in Table 6 is the same as the finite element model for W1 in Section 4.1. The layout of the wall panel is shown in Figure 20. From Figure 21, it can be seen that reducing the dimensions of the wall panels can improve the lateral load capacity of the specimens. The lateral load capacities of W1-R1, W1-R2, and W1-R3 increased by 35.41%, 78.25%, and 53.79%, respectively, compared to W1.

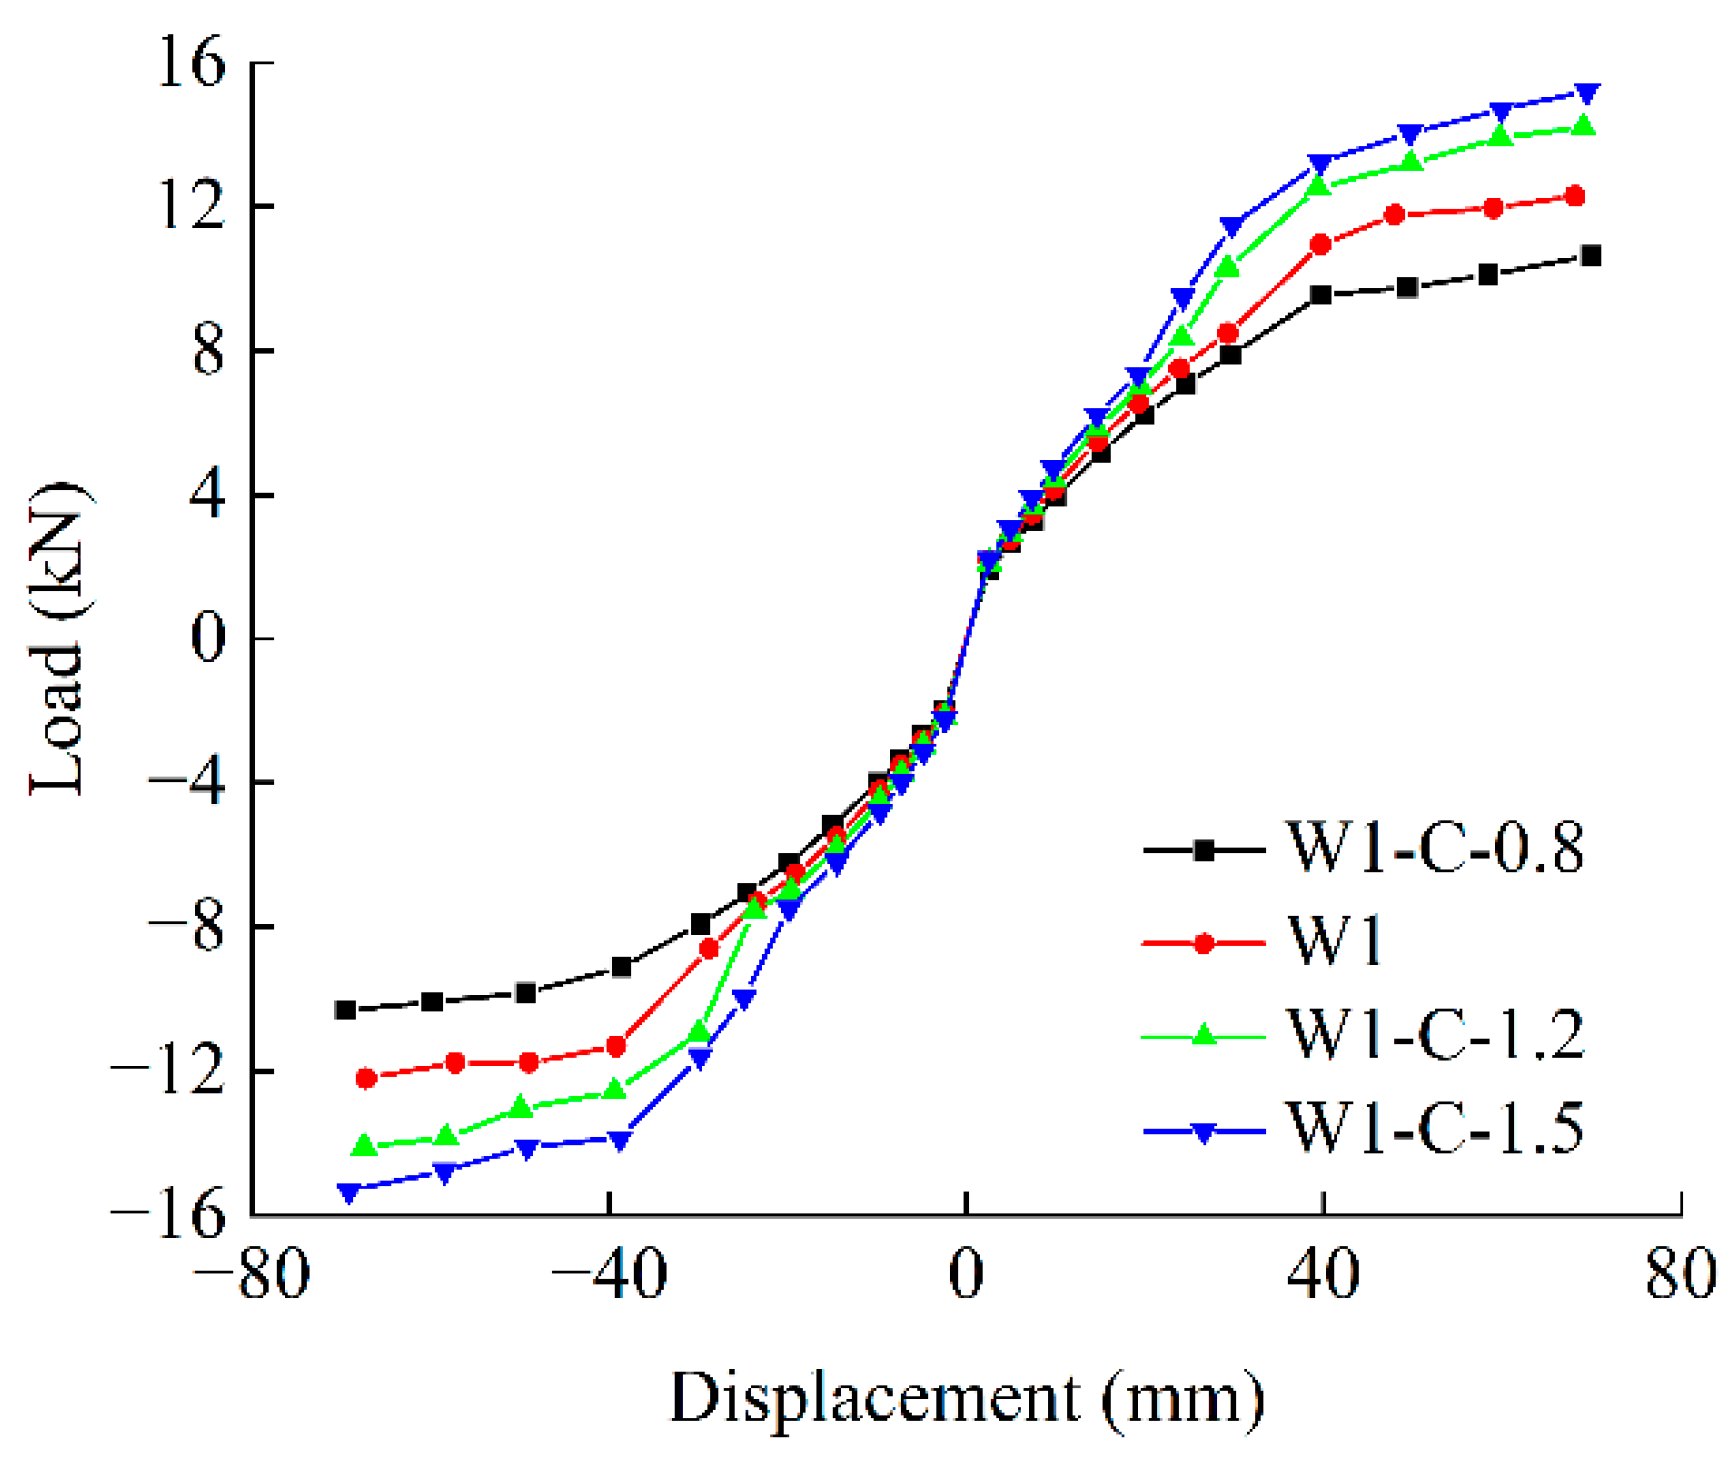
4.3.5. Strength of the Connections of the L-Shaped Connector and the Flat Connector

Only the strength of the connection of the L-shaped connector and the flat connector was changed to explore the influence on the shear bearing capacity of the specimen. Under constant displacement conditions, W1-C-0.8 was used to reduce the strength of the connection of the L-shaped connector and the flat connector to 0.8 times, while W1-C-1.2 and W1-C-1.5 were used to amplify the strength of the connection of the L-shaped connector and the flat connector by 1.2 times and 1.5 times, respectively.
The results obtained after analysis using the finite element method are shown in Figure 22. As the strength of the connection of the L-shaped connector and the flat connector increased from 1.2 to 1.5 times, the shear capacity increased by 15.54% and 23.67%, respectively. Conversely, reducing the strength of the connection of the L-shaped connector and the flat connector decreased the shear-carrying capacity.

5. Conclusions

This study conducted mechanical testing experiments on steel and concrete, performed low-cycle loading tests on composite wall specimens, and carried out parametric analysis of the specimens using finite element methods.
  • Two full-scale specimens were exposed to cyclic loading. According to experimental analysis, significant displacements occurred at the junctions of the upper and lower wall panels of both specimens. Furthermore, severe deformations and damage were observed at the joints around the perimeter of the wall panels.
  • Compared to specimen W2, specimen W1 exhibited significantly higher values for yield load, peak load, ultimate load, and energy dissipation coefficient. However, the yield displacement and peak displacement were notably lower for W1, indicating that the arrangement of concrete core wall panels has a significant impact on shear resistance. The ductility coefficients of specimens W1 and W2 were 1.82 and 1.49, respectively, indicating good ductility performance. Additionally, within the specified displacement limits, the walls did not exhibit any damage, making them suitable for use as structural walls.
  • The shear capacity of specimens W1 and W2 mainly relies on the friction, compression among the upper and lower wall panels, and deformation of flat connectors and L-shaped connectors. Therefore, it is recommended that the vertical length of the panels be shortened and the number of vertical panels increased to enhance the lateral load capacity of the composite wall.
  • Parameter analysis indicates that increasing the yield strength of the diagonal braces or the thickness of the diagonal braces, enhancing the strength of connection of the flat connectors and L-shaped connectors, appropriately altering the arrangement of the wall panels, or reducing the size of the wall panels can all improve the shear bearing capacity of the composite wall. The panel arrangement of the W1-A2 model in Section 4.3.3 demonstrated the best performance throughout the entire study. It is recommended to use this type of wall configuration for further research. The panel arrangement of the W1-A2 model demonstrated the best performance throughout the entire study. It is recommended to use this type of wall configuration for further research.
  • The insulation wall panels used in this experiment are designed for light steel systems; their application in other structural systems requires further investigation. The dimensions of the insulation wall panels used in this experiment are fixed. To investigate the lateral performance of the specimens, varying the dimensions of the insulation panels could be explored. Additionally, the limited number of components in this study may have resulted in deviations from real-world conditions. Therefore, increasing the number of components is recommended to reduce experimental errors and enhance the rigor of the study.

Author Contributions

Conceptualization, J.Z. and B.C.; methodology, J.Z. and B.C.; software, J.Z.; formal analysis, J.Z.; investigation, J.Z. and Y.Z.; resources, B.C.; data curation, J.Z.; writing—original draft preparation, J.Z.; writing—review and editing, J.Z., B.C., X.Z. and Y.Z.; visualization, B.C. and X.Z.; supervision, B.C. and X.Z.; project administration, B.C. and X.Z.; funding acquisition, B.C. and X.Z. All authors have read and agreed to the published version of the manuscript.

Funding

This research was funded by The Provincial Key R&D Program of Hainan, China (No. ZDYF2024SHFZ081).

Data Availability Statement

The data presented in this study are available on request from the corresponding author. The data are not publicly available because they constitute a component of an ongoing study.

Conflicts of Interest

The authors declare no conflicts of interest.

References

  1. Tarpy, T.S.; Hauenstein, S.F. Effect of Construction Details on Shear Resistance of Steel-Stud Wall Panels; AISI: Washington, DC, USA, 1978; pp. 1201–1412. [Google Scholar]
  2. Serrette, R.L.; Encalada, J.; Juadines, M.; Nguyen, H. Static racking behavior of plywood, OSB, gypsum, and fiberbond walls with metal framing. J. Struct. Eng. 1997, 123, 1079–1086. [Google Scholar] [CrossRef]
  3. Serrette, R.L.; Ogunfunmi, K. Shear resistance of gypsum-sheathed light-gauge steel stud walls. J. Struct. Eng. 1996, 122, 383–389. [Google Scholar] [CrossRef]
  4. Tian, Y.S.; Wang, J.; Lu, T.J. Racking strength and stiffness of cold-formed steel wall frames. J. Constr. Steel Res. 2004, 60, 1069–1093. [Google Scholar] [CrossRef]
  5. Fiorino, L.; Della Corte, G.; Landolfo, R. Experimental tests on typical screw connections for cold-formed steel housing. J. Eng. Struct. 2007, 29, 1761–1773. [Google Scholar] [CrossRef]
  6. Cheng, Y. Shear resistance of cold-formed steel framed shear walls with 0.686 mm, 0.762 mm, and 0.838 mm steel sheet sheathing. J. Eng. Struct. 2010, 32, 1522–1529. [Google Scholar]
  7. Mohebbi, S.; Mirghaderi, R.; Farahbod, F.; Sabbagh, A.B. Experimental work on single and double-sided steel sheathed cold-formed steel shear walls for seismic actions. J. Thin-Walled Struct. 2015, 91, 50–62. [Google Scholar] [CrossRef]
  8. DaBreo, J.; Balh, N.; Ong-Tone, C.; Rogers, C.A. Steel sheathed cold-formed steel framed shear walls subjected to lateral and gravity loading. J. Thin-Walled Struct. 2014, 74, 232–245. [Google Scholar] [CrossRef]
  9. Javaheri-Tafti, M.R.; Ronagh, H.R.; Behnamfar, F.; Memarzadeh, P. An experimental investigation on the seismic behavior of cold-formed steel walls sheathed by thin steel plates. J. Thin-Walled Struct. 2014, 80, 66–79. [Google Scholar] [CrossRef]
  10. Cheng, Y.; Chen, Y.J. Detailing recommendations for 1.83 m wide cold-formed steel shear walls with steel sheathing. J. Constr. Steel Res. 2011, 67, 93–101. [Google Scholar]
  11. Zeynalian, M.; Ronagh, H.R. Seismic performance of cold formed steel walls sheathed by fibre-cement board panels. J. Constr. Steel Res. 2015, 107, 1–11. [Google Scholar] [CrossRef]
  12. Gao, W.C.; Xiao, Y. Seismic behavior of cold-formed steel frame shear walls sheathed with ply-bamboo panels. J. Constr. Steel Res. 2017, 132, 217–229. [Google Scholar] [CrossRef]
  13. Macillo, V.; Fiorino, L.; Landolfo, R. Seismic response of CFS shear walls sheathed with nailed gypsum panels: Experimental tests. J. Thin-Walled Struct. 2017, 122, 359–370. [Google Scholar] [CrossRef]
  14. Wu, H.; Chao, S.; Zhou, T.; Liu, X. Cold-formed steel framing walls with infilled lightweight FGD gypsum Part I: Cyclic loading tests. J. Thin-Walled Struct. 2018, 132, 759–770. [Google Scholar] [CrossRef]
  15. Wu, H.; Chao, S.; Zhou, T.; Liu, X. Cold-formed steel framing walls with infilled lightweight FGD gypsum Part II: Axial compression tests. J. Thin-Walled Struct. 2018, 132, 771–782. [Google Scholar] [CrossRef]
  16. Zhang, Z.N.; Qian, H.K.; Wang, C.G.; Zhang, M.; Yang, Z.Y. Study on Shear Performance of Cold-Formed Thin-Walled Steel Composite Walls with Embedded Honeycomb Core. J. Archit. Struct. 2023, 44, 282–292. [Google Scholar]
  17. Wang, L.P.; Wu, X.Y.; Hu, M.; Liu, J.; Ding, J.X. Analysis of Lateral Resistance Performance of Novel Prefabricated Cold-Formed Thin-Walled Steel Walls. J. Southeast Univ. 2024, 54, 135–141. [Google Scholar]
  18. Almasabha, G.; Chao, S.H.A. New Reinforcing Configuration for Achieving High-Ductility and High-Strength Rectangular Squat Structural Walls. ACI Struct. J. 2023, 120, 235. [Google Scholar]
  19. Chao, S.H.; Almasabha, G.; Price, B.; Jiansinlapadamrong, C. A horizontal stiffener detailing for shear links at the link-to-column connection in eccentrically braced frames. J. Struct. Eng. 2023, 149, 04023114. [Google Scholar] [CrossRef]
  20. Chen, M.T.; Zuo, W.; Young, B. Tests of cold-formed steel T-joints with semi-oval hollow section chord. J. Struct. Eng. 2023, 149, 04023099. [Google Scholar] [CrossRef]
  21. Liu, R.; Jiang, L.; Ye, J.; Yang, H.; Hu, Y.; Han, H. Buckling behavior and failure mechanism of cold-formed steel built-up special shape cross-section columns. Eng. Fail. Anal. 2024, 165, 108716. [Google Scholar] [CrossRef]
  22. Dai, Y.; Roy, K.; Fang, Z.; Chen, B.; Raftery, G.M.; Lim, J.B. Buckling resistance of axially loaded cold-formed steel built-up stiffened box sections through experimental testing and finite element analysis. Eng. Struct. 2024, 302, 117379. [Google Scholar] [CrossRef]
  23. GB/T 228.1-2010; Metallic Materials-Tensile Testing-Part 1: Method of Test at Room Temperature. China Standards Press: Beijing, China, 2010. (In Chinese)
  24. GBT/50081-2019; Standard for Test Methods of Concrete Physical Mechanics. China Construction Industry Press: Beijing, China, 2019. (In Chinese)
  25. JGJ 227-2011; Technical Specification for Low-Rise Cold-Formed Thin-Walled Steel Building. China Construction Industry Press: Beijing, China, 2011. (In Chinese)
  26. Chen, W.; Hao, H.; Hughes, D.; Shi, Y.; Cui, J.; Li, Z.X. Static and dynamic mechanical properties of expanded polystyrene. Mater. Des. 2015, 69, 170–180. [Google Scholar] [CrossRef]
  27. JPJ 101-2015; Specification for Seismic Test of Buildings. China Construction Industry Press: Beijing, China, 2015. (In Chinese)
  28. Ye, J.; Feng, R. Behavior of cold-formed steel wall stud with sheathing subjected to compression. J. Constr. Steel Res. 2016, 116, 79–91. [Google Scholar] [CrossRef]
  29. Li, Z. Experimental Study on Seismic Behavior of Light Steel Keel-Strawboard Composite Walls. Master’s Thesis, Chongqing University, Chongqing, China, 2022. [Google Scholar]
  30. Hu, J.X. Study on Seismic Behavior of Cold-Formed and Thin-Walled Steel Composite Wall with Diagonal Bracing. Master’s Thesis, Chongqing University, Chongqing, China, 2018. [Google Scholar]
  31. GB 50010-2010; Code for Design of Concrete Structures. China Construction Industry Press: Beijing, China, 2010. (In Chinese)
  32. Xiao, T.P. Seismic Behavior of Lightweight Steel and EPS Concrete Shear Walls. Master’s Thesis, Southwest University of Science and Technology, Mianyang, China, 2023. [Google Scholar]
Figure 1. Composite wall: (a) flat steel connectors; (b) axial view of L-shaped connectors; (c) W1; (d) W2.
Buildings 14 02928 g001
Figure 2. Joint and structure of upper and lower wall panels.
Buildings 14 02928 g002
Figure 3. Mechanical property testing of the material: (a) steel tensile fracture; (b) concrete compressive failure; (c) shear failure of self-tapping screws.
Buildings 14 02928 g003
Figure 4. Loading regime.
Buildings 14 02928 g004
Figure 5. Layout of the loading apparatus and sensor position: (a) loading apparatus schematic; (b) sensor position layout diagram.
Buildings 14 02928 g005
Figure 6. Failure patterns of specimen W1: (a) the upper and lower wall panels are out of alignment; (b) flat connector at the left end is damaged; (c) the upper wall panels are detached. (d) The wall panel bulged outward.
Buildings 14 02928 g006
Figure 7. Failure patterns of specimen W2: (a) the L-shaped connector at the right end is damaged; (b) the upper and lower wall panels are out of alignment; (c) flat connector at the left end is damaged.
Buildings 14 02928 g007
Figure 8. Hysteresis curves of the specimens: (a) specimen W1 hysteresis curve; (b) specimen W2 hysteresis curve.
Buildings 14 02928 g008
Figure 9. Skeleton curve.
Buildings 14 02928 g009
Figure 10. Stiffness degradation curves.
Buildings 14 02928 g010
Figure 11. Computation of energy dissipation coefficient.
Buildings 14 02928 g011
Figure 12. Load–displacement curve of steel and concrete connection.
Buildings 14 02928 g012
Figure 13. Finite element modeling: (a) finite element global model; (b) finite element model of steel framework.
Buildings 14 02928 g013
Figure 14. The finite element failure mode of the W1 specimen: (a) Von Mises stress contour map of steel frame; (b) Von Mises stress contour map of wall panel; (c) displacement contour map in the Uy direction of steel frame; (d) displacement contour map in the Uy direction of wall panel.
Buildings 14 02928 g014
Figure 15. Comparison of experimental and finite element simulation results: (a) skeleton curve of specimen W1; (b) skeleton curve of specimen W2.
Buildings 14 02928 g015
Figure 16. The influence of diagonal brace yield strength on seismic performance: (a) skeletal curves with different diagonal brace yield strengths. (b) The effect on the shear capability of the specimens.
Buildings 14 02928 g016
Figure 17. The impact of diagonal bracing thickness on seismic performance. (a) Skeletal curves with varying diagonal brace thicknesses; (b) the impact on the load-bearing capacity of the specimens.
Buildings 14 02928 g017
Figure 18. Arrangement pattern of the wall panels. (a) W1-A1; (b) W1-A2; (c) W1-A3.
Buildings 14 02928 g018
Figure 19. The skeleton curves for different wall panel arrangements.
Buildings 14 02928 g019
Figure 20. Dimensions of wall panels. (a) W1-R-1. (b) W1-R-2. (c) W1-R-3.
Buildings 14 02928 g020
Figure 21. The skeleton curves for different dimensions of wall panels.
Buildings 14 02928 g021
Figure 22. The skeleton curves for different strengths of the connection.
Buildings 14 02928 g022
Table 1. The structural parameters of the specimens and load method.
Specimen Identification NumbersLength/mm × Height/mmWall Panel MaterialsArrangement Pattern of the Wall PanelsLoading MethodVertical Load
W12450 × 2300Precast concrete sandwich insulation wall panelsBuildings 14 02928 i001cyclic loading-
W224,502 × 300Precast concrete sandwich insulation wall panelsBuildings 14 02928 i002cyclic loading-
Table 2. The characteristic values of the skeleton curves for each specimen.
Specimen Identification NumberYield PointPeak PointUltimate PointLateral StiffnessDuctility Coefficient
P y
(mm)
y
(mm)
P m a x
(kN)
m a x
(mm)
P u
(kN)
u
(mm)
K300
(kN/(m·rad))
μ
W19.7943.511.5768.629.9479.20424.011.82
W28.5659.989.6379.228.2089.66336.731.49
Table 3. Energy dissipation coefficient.
Specimen Identification NumberEnergy Dissipation Coefficient at the Elastic Point E1Energy Dissipation Coefficient at the Yield Point E2Energy Dissipation Coefficient at the Peak Point E3Total Energy Dissipation Doefficient E
W11.360.820.711.24
W21.320.710.681.06
Table 4. Concrete damage plastic parameter.
ParameterDilation AngleEccentricityfb0/fc0KViscosity Parameter
Value400.11.160.6670.0005
Table 5. Finite element model analysis table for diagonal brace parameters.
Parameterized Analysis ObjectFinite Element Model Identification NumberDiagonal Brace Yield Strength (MPa)Thickness of Diagonal Bracing (mm)
W1W1-Q2352352.0
W1-Q3453452.0
W1-Q3903902.0
W1-Q4204202.0
W1-T-2.02352.0
W1-T-2.22352.2
W1-T-2.52352.5
W1-T-3.02353.0
W1-T-4.02354.0
Table 6. Parameters of dimensions of wall panels.
Finite IDDimensions of Wall Panels (Length/mm × Height/mm × Thickness/mm)Number of Wall PanelsNumber of L-Shaped Connectors
W12450 × 1150 × 5017
1225 × 1150 × 502
W1-R12450 × 800 × 50113
1225 × 800 × 502
2450 × 700 × 501
W1-R22450 × 600 × 50220
1225 × 600 × 502
1225 × 500 × 502
W1-R32450 × 450 × 50226
1225 × 450 × 504
2450 × 500 × 501
Disclaimer/Publisher’s Note: The statements, opinions and data contained in all publications are solely those of the individual author(s) and contributor(s) and not of MDPI and/or the editor(s). MDPI and/or the editor(s) disclaim responsibility for any injury to people or property resulting from any ideas, methods, instructions or products referred to in the content.

