
Identifying Safety Technology Opportunities to Mitigate Safety-Related Issues on Construction Sites


Abstract
:1. Introduction
2. Background
2.1. Technology Innovation in Safety
2.2. Big Data Analytics for Safety Technology Identification
2.2.1. Text Analytics for Technology Innovation Studies
2.2.2. Text Analytics for Incident Analysis
2.3. Research Gap and Focus
3. Proposed Approach
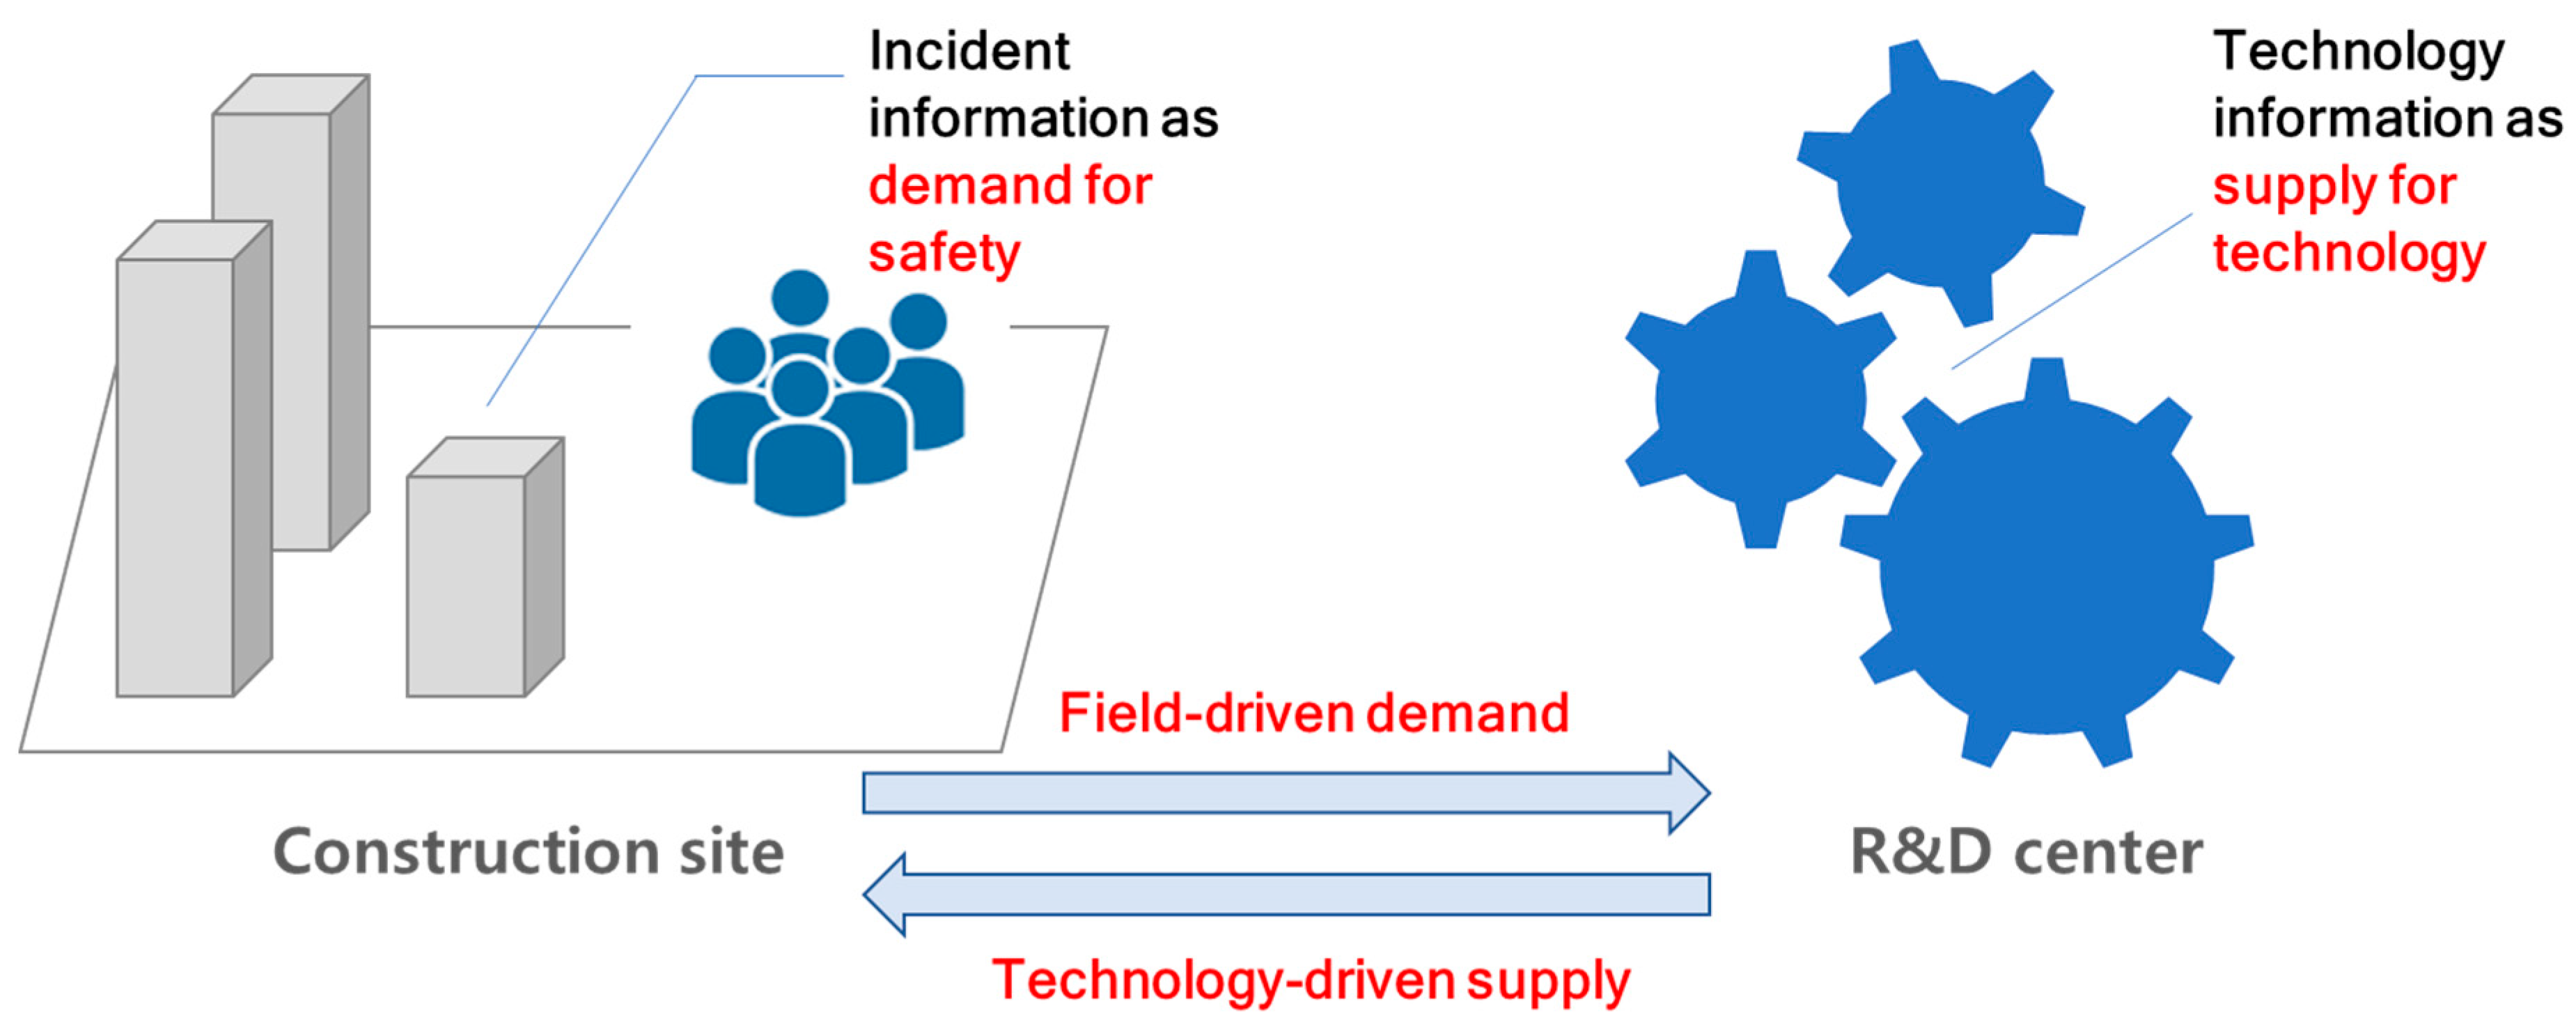
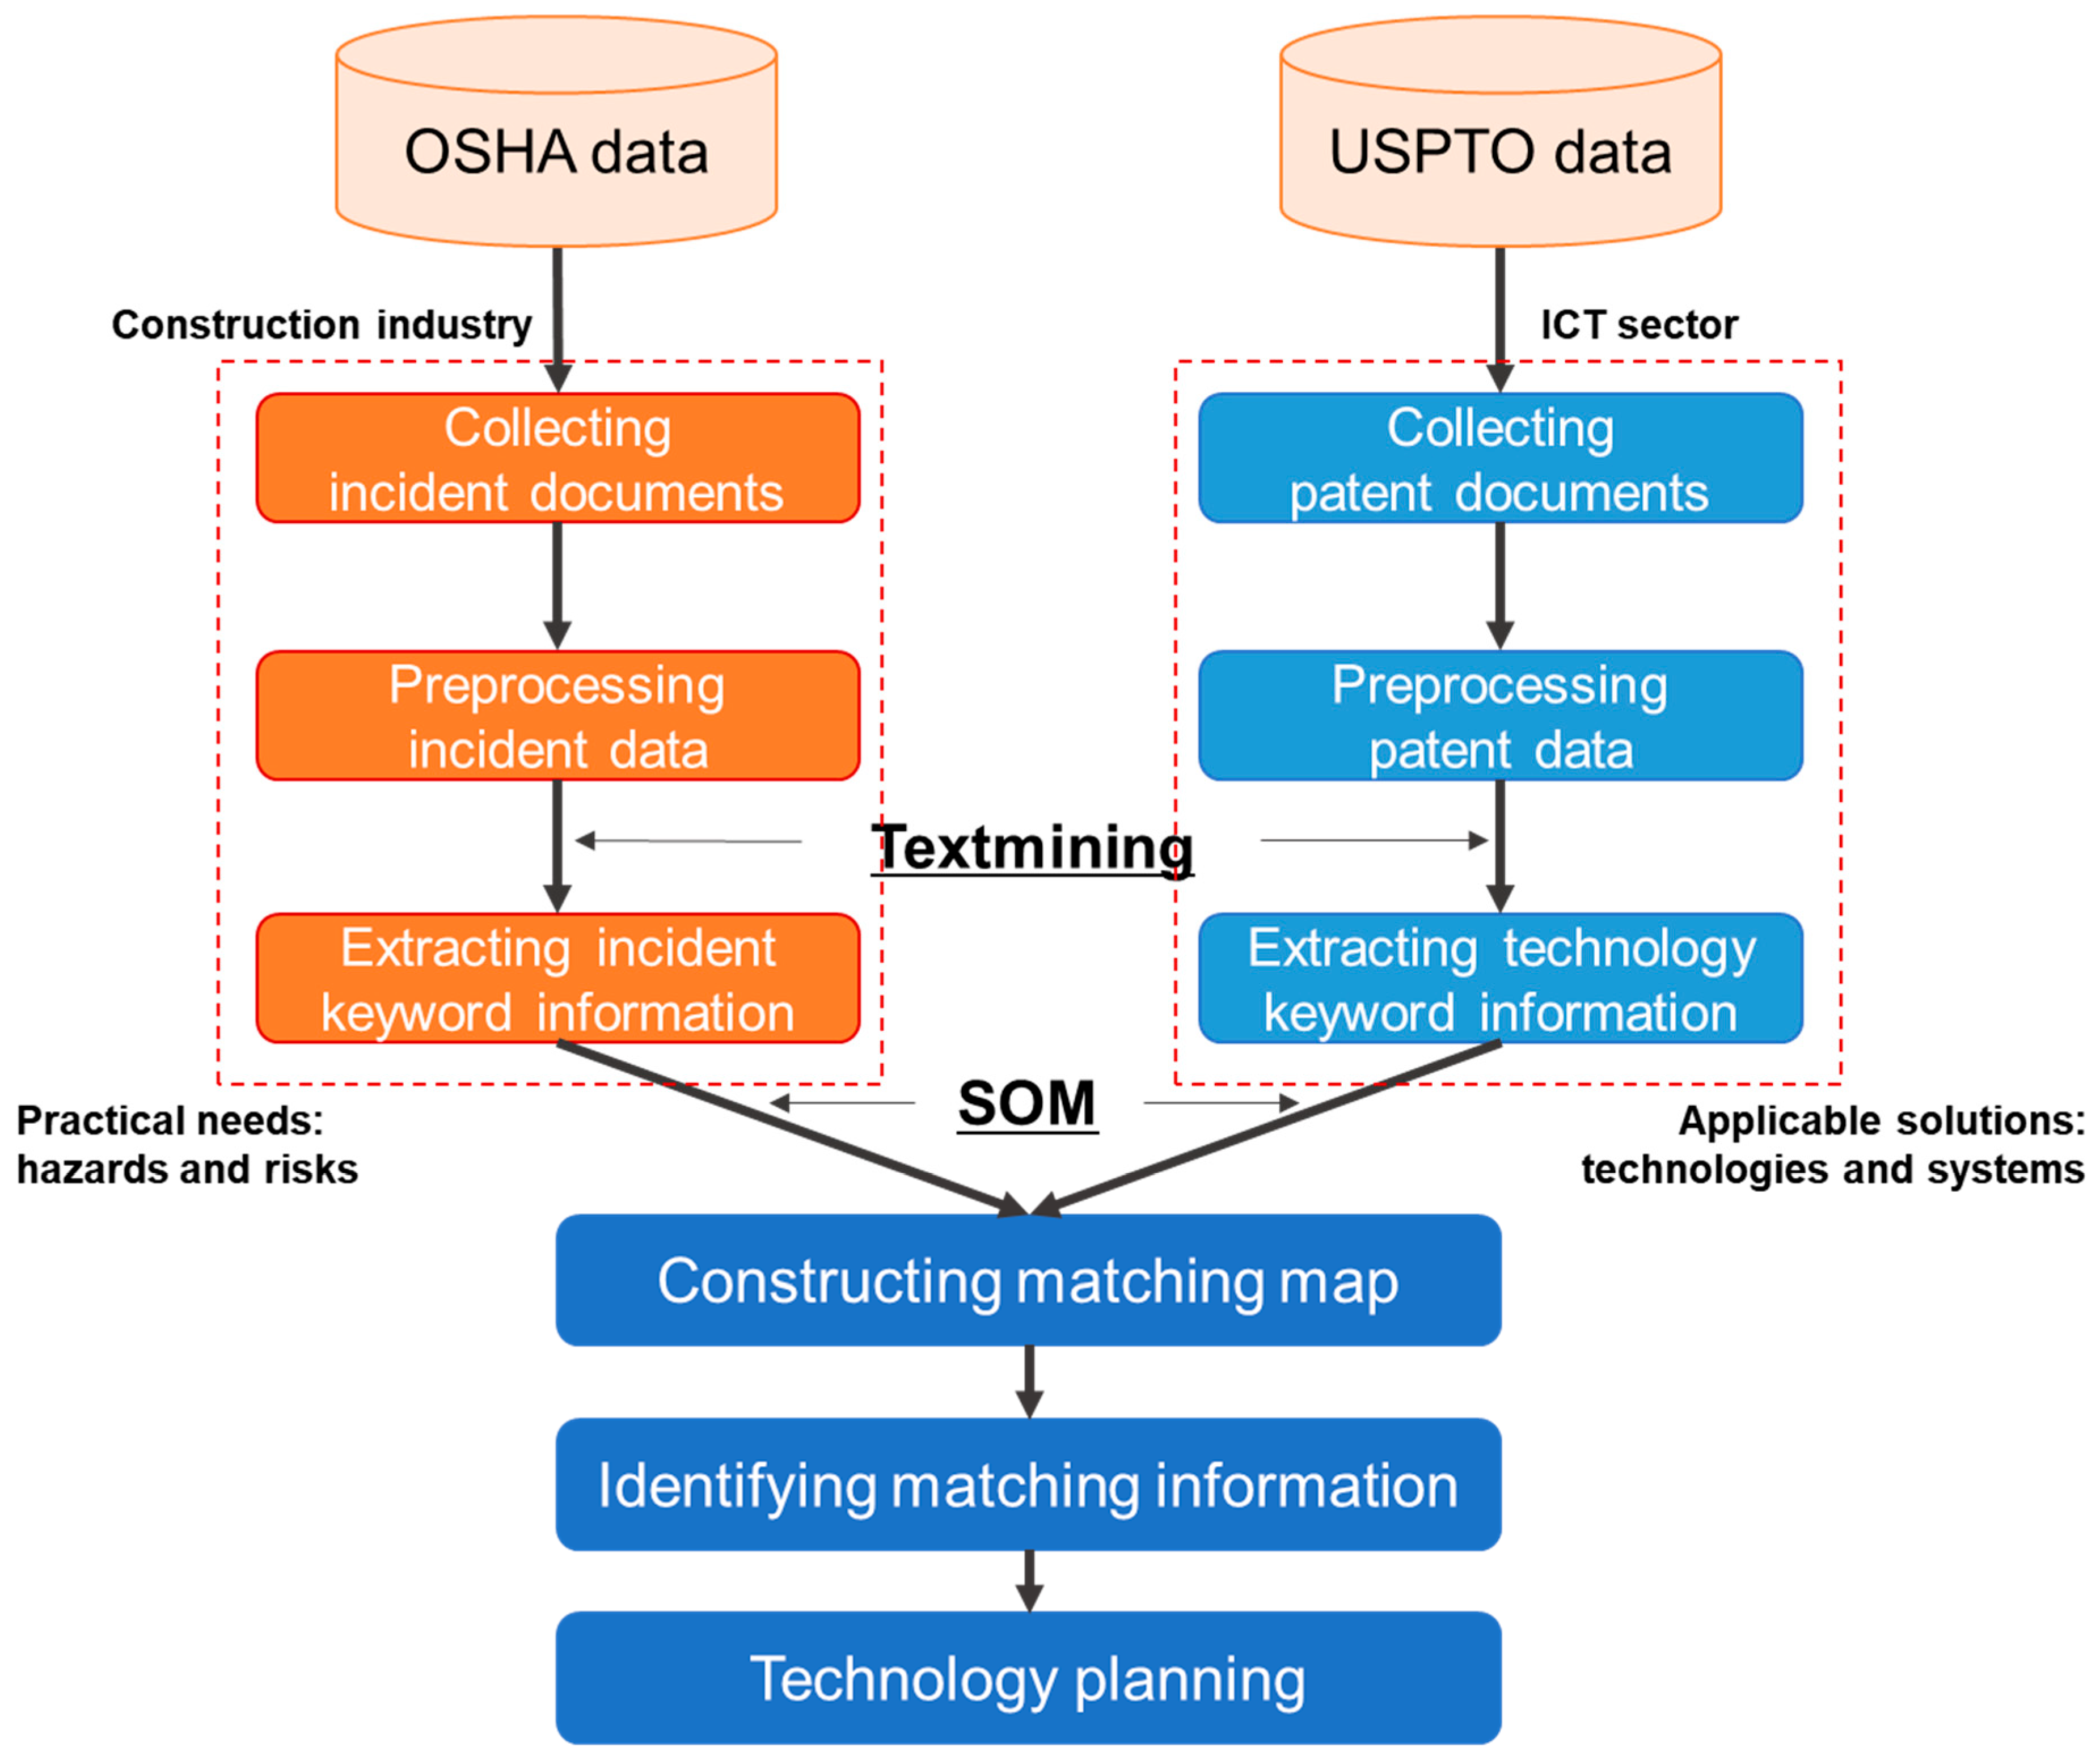
3.1. Integrating Incident Data with Patent Data
3.2. Applied Methodology
3.2.1. Textmining
3.2.2. Self-Organizing Map (SOM)
- Step 1. Initialization
- Step 2. Competition
- Step 3. Cooperative Step
- Step 4. Adjustment
- Step 5. Convergence
4. Results
4.1. Data Collection: Incident and Patent Data
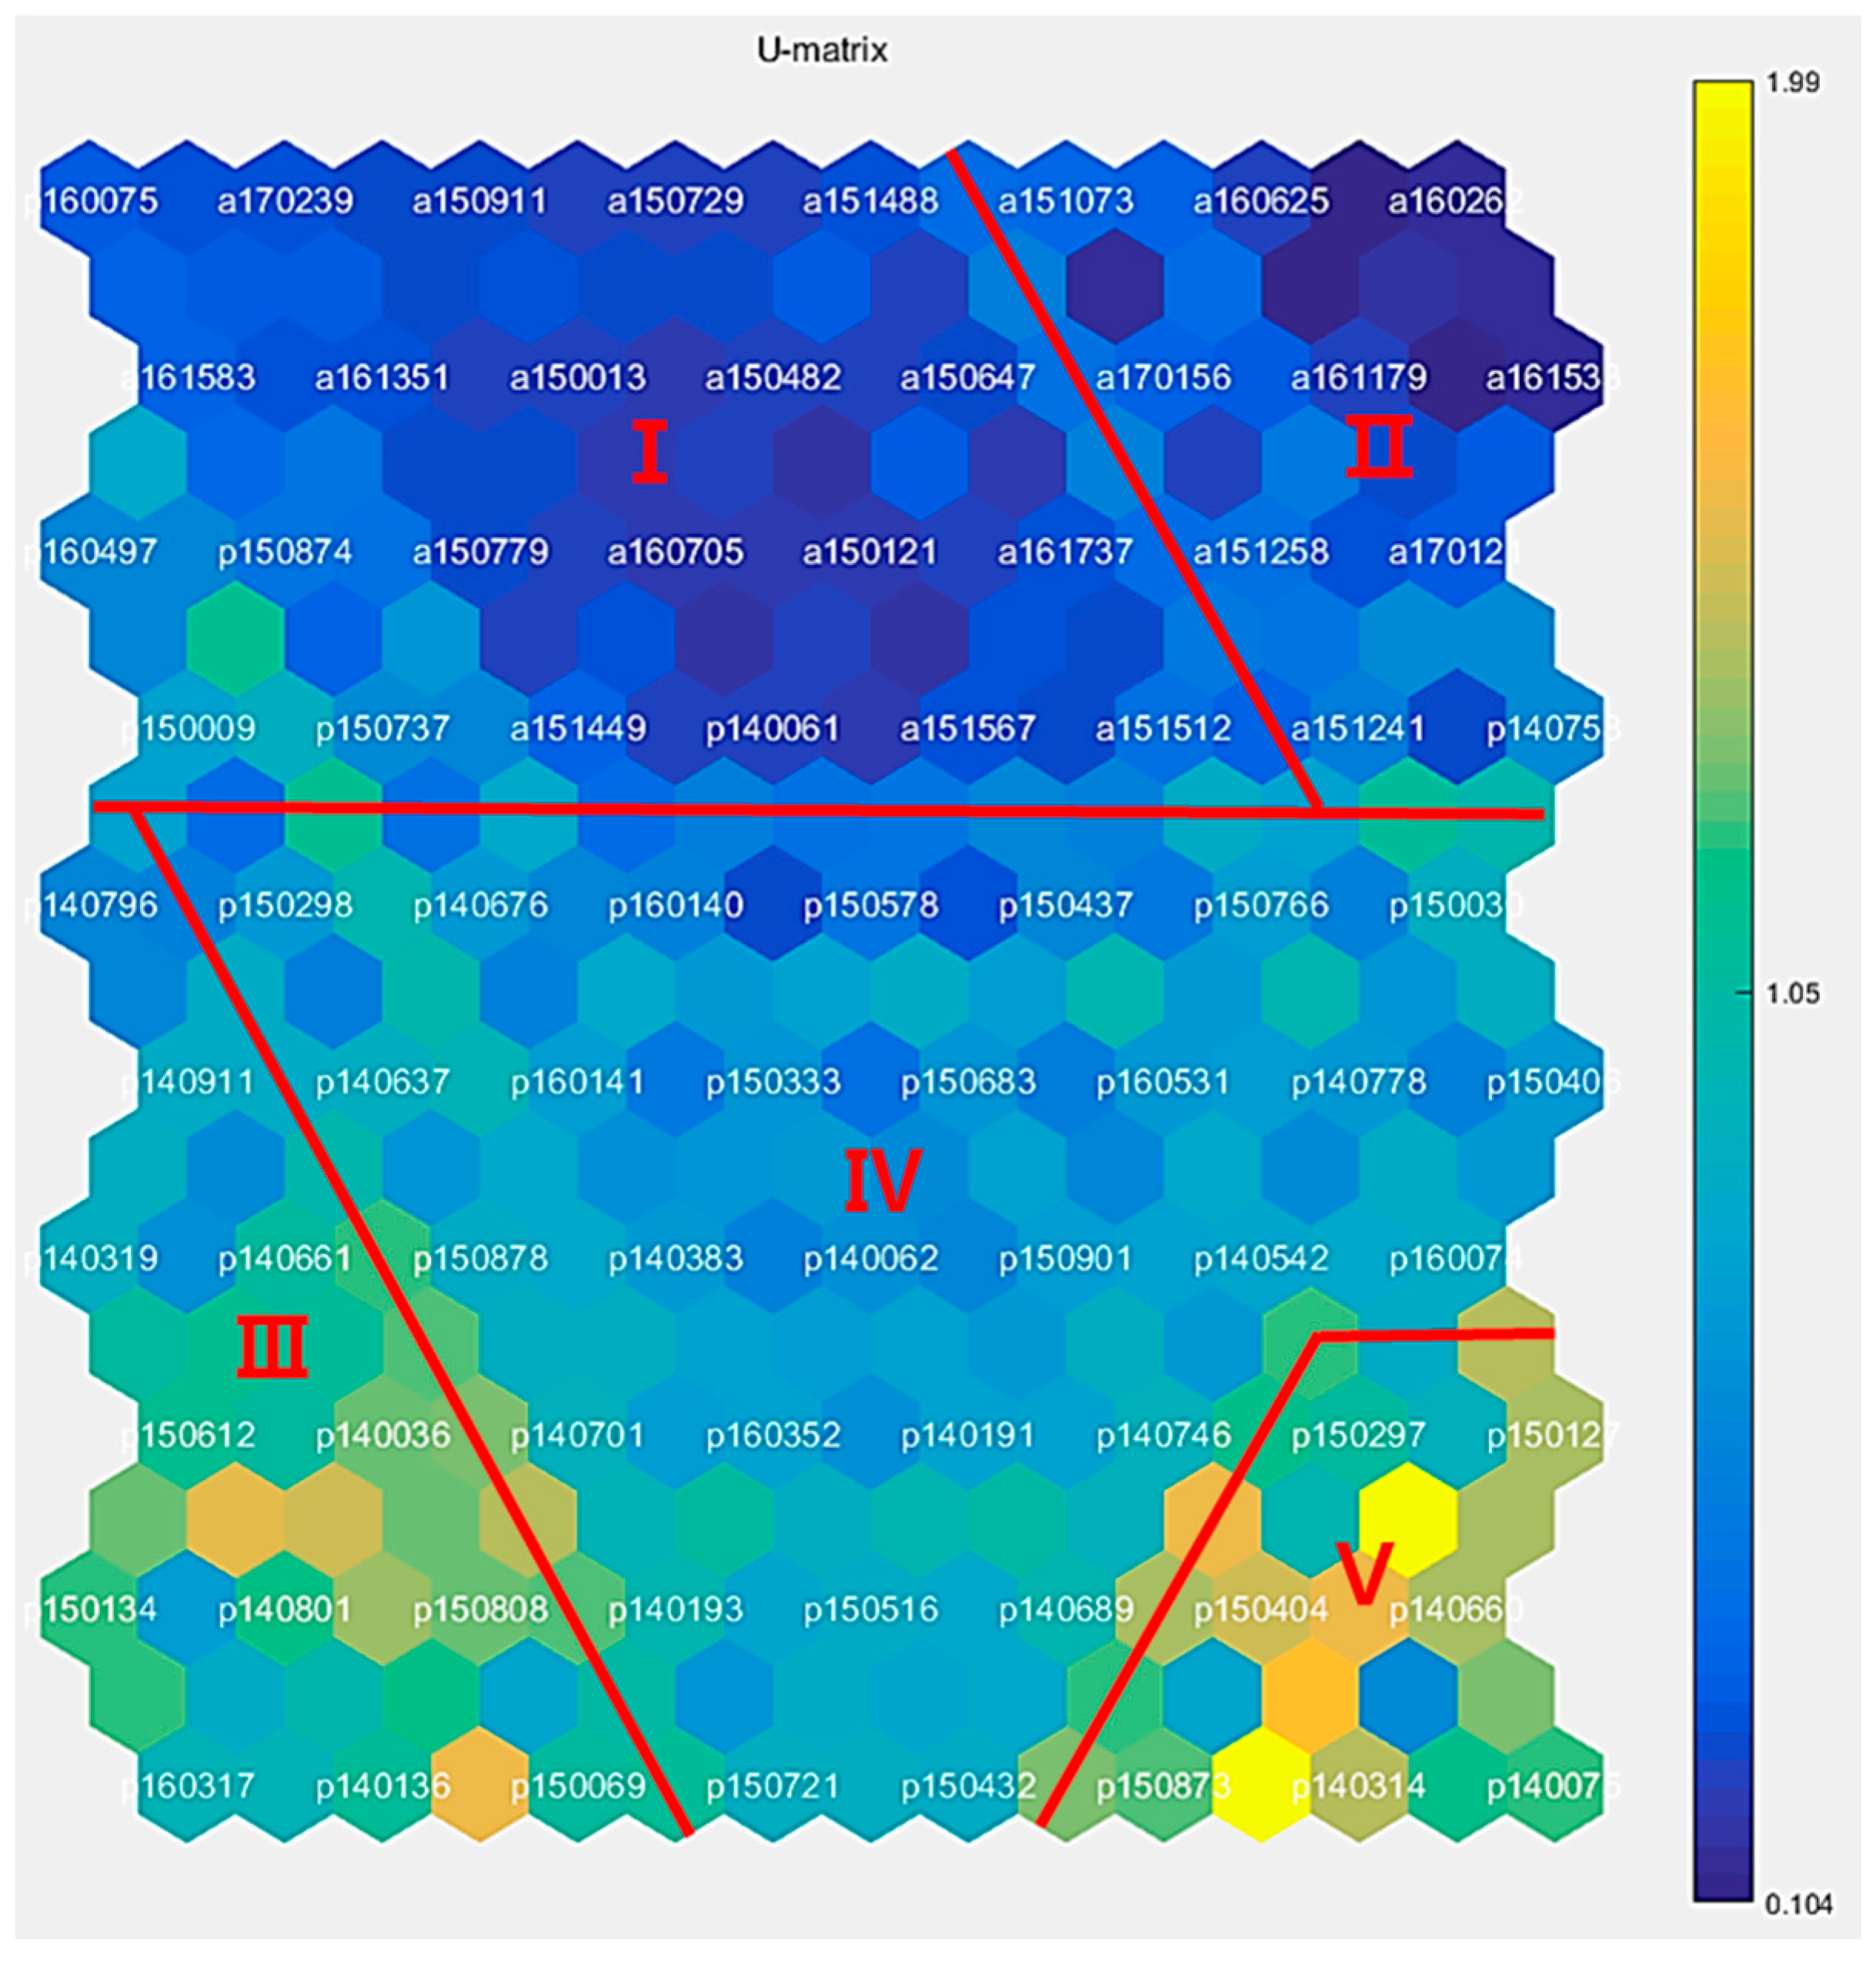
4.2. Constructing Matching Map
- Cluster I: This cluster contains 737 incident cases and 333 patent cases. The main keywords in both incident and patent data are related to “machine tool work”, with keywords such as pipe, concrete, metal, machine, piece, cut, cover, hand, and finger. The primary incidents in this cluster are amputation and being stuck. These incidents are typically associated with machinery, indicating a need for safety technologies related to machine tool operations.
- Cluster II: This cluster is heavily biased toward incident data, with 1537 cases of incidents. The incidents are primarily related to “high place work”, with keywords such as fell, roof, head, concrete, fractured, scaffold, pipe, ribs, breaking, and slipped. The high-risk nature of working at heights is evident, and the lack of technology support for these types of incidents is highlighted. This cluster emphasizes the need for safety technologies to prevent falls and injuries during high-place work.
- Cluster III: This cluster contains 583 patent cases and focuses on “vehicle” safety technology. The keywords in this cluster include truck, vehicle, control, signal, sensor, module, controller, struck, electrical, and motor. The emphasis here is on vehicle-related safety technology, with patents aimed at improving vehicle safety and preventing accidents related to construction vehicles.
- Cluster IV: This cluster deals with safety technologies or incidents related to “hydraulic machines”, which are commonly used on construction sites for tasks like lifting and moving objects. The keywords in this cluster include battery, lift, belt, vehicle, pressure, and layer. The data indicate the potential for improving safety technologies around hydraulic machinery.
- Cluster V: This cluster presents ambiguous incident and patent data related to various mechanical components, such as position, needle, valve, seat, locking, support, and housing. The specific safety concerns in this cluster are less clearly defined, but they suggest a need for safety technologies around mechanical systems and components.
- Cluster I (Machine Tool Work): The automatic control and interlock systems are essential technologies for improving safety in machine tool work. The interlock system helps prevent dangerous situations by ensuring that certain operations cannot happen simultaneously or in unsafe sequences. For example, an interlock might prevent a machine from starting unless safety guards are in place, reducing the risk of pinch points and injuries.
- Cluster II (High-Place Work): For high-place work, facility strength monitoring technologies are crucial. These technologies can monitor the integrity of scaffolds, ladders, and other temporary structures to ensure they are safe for workers. Sensors can detect signs of potential structural failure or instability, issuing alerts to prevent accidents caused by collapses. These systems can be integrated into construction management platforms to offer the real-time monitoring of workplace safety.
- Cluster III (Vehicle Safety): This cluster focuses on vehicle safety technologies, particularly proximity sensors and alarm systems that detect vehicles near workers on construction sites. In environments where construction vehicles like forklifts, trucks, and backhoes are frequently in operation, vehicle-to-worker detection systems can prevent accidents by issuing real-time warnings to workers when vehicles are in close proximity. These sensors can be installed on vehicles and worn by workers to ensure both vehicle and worker safety.
- Cluster IV (Hydraulic Machines): For hydraulic machinery, battery monitoring and valve control systems are critical. Hydraulic machines often operate with high force and energy, which can be dangerous without proper control systems. ICT solutions in this cluster can include the real-time monitoring of battery health and performance, ensuring that hydraulic systems are operating efficiently. Additionally, valve control systems can ensure that fluid pressure and flow rates are appropriately maintained to prevent malfunction or accidents.
4.3. Identifying Matching Information
4.4. Technology Planning
4.4.1. Data Distribution Analysis
4.4.2. Technology Roadmapping Using Gap Analysis
5. Discussion
5.1. Implications
5.1.1. Interest in Stakeholders of Safety Technology
5.1.2. Identification of Incident–Technology Linkage
5.1.3. Technology Planning for Safety Management
5.2. Limitations and Future Research
6. Conclusions
Funding
Data Availability Statement
Conflicts of Interest
References
- Li, Y.; Guldenmund, F.W. Safety management systems: A broad overview of the literature. Saf. Sci. 2018, 103, 94–123. [Google Scholar] [CrossRef]
- Song, B.; Suh, Y. Identifying convergence fields and technologies for industrial safety: LDA-based network analysis. Technol. Forecast. Soc. Change 2019, 138, 115–126. [Google Scholar] [CrossRef]
- Niu, Y.; Fan, Y.; Ju, X. Critical review on data-driven approaches for learning from accidents: Comparative analysis and future research. Saf. Sci. 2024, 171, 106381. [Google Scholar] [CrossRef]
- Suh, Y. Sectoral patterns of accident process for occupational safety using narrative texts of OSHA database. Saf. Sci. 2021, 142, 105363. [Google Scholar] [CrossRef]
- Junior, J.A.G.; Busso, C.M.; Gobbo, S.C.O.; Carreão, H. Making the links among environmental protection, process safety, and industry 4.0. Process Saf. Environ. Prot. 2018, 117, 372–382. [Google Scholar]
- Swuste, P.; Groeneweg, J.; van Gulijk, C.; Zwaard, W.; Lemkowitz, S. Safety management systems from Three Mile Island to Piper Alpha, a review in English and Dutch literature for the period 1979 to 1988. Saf. Sci. 2018, 107, 224–244. [Google Scholar] [CrossRef]
- Liu, Z.; Xie, K.; Li, L.; Chen, Y. A paradigm of safety management in Industry 4.0. Syst. Res. Behav. Sci. 2020, 37, 632–645. [Google Scholar] [CrossRef]
- Zhou, Z.; Irizarry, J.; Li, Q. Applying advanced technology to improve safety management in the construction industry: A literature review. Constr. Manag. Econ. 2013, 31, 606–622. [Google Scholar] [CrossRef]
- Akinlolu, M.; Haupt, T.C.; Edwards, D.J.; Simpeh, F. A bibliometric review of the status and emerging research trends in construction safety management technologies. Int. J. Constr. Manag. 2022, 22, 2699–2711. [Google Scholar] [CrossRef]
- Nnaji, C.; Karakhan, A.A. Technologies for safety and health management in construction: Current use, implementation benefits and limitations, and adoption barriers. J. Build. Eng. 2020, 29, 101212. [Google Scholar] [CrossRef]
- Zhang, X.; Srinivasan, P.; Mahadevan, S. Sequential deep learning from NTSB reports for aviation safety prognosis. Saf. Sci. 2021, 142, 105390. [Google Scholar] [CrossRef]
- Dabić, M.; Marzi, G.; Vlačić, B.; Daim, T.U.; Vanhaverbeke, W. 40 years of excellence: An overview of Technovation and a roadmap for future research. Technovation 2021, 106, 102303. [Google Scholar] [CrossRef]
- Han, X.; Zhu, D.; Lei, M.; Daim, T. R&D trend analysis based on patent mining: An integrated use of patent applications and invalidation data. Technol. Forecast. Soc. Change 2021, 167, 120691. [Google Scholar]
- Li, R.; Yu, J.; Li, F.; Yang, R.; Wang, Y.; Peng, Z. Automatic bridge crack detection using Unmanned aerial vehicle and Faster R-CNN. Constr. Build. Mater 2023, 362, 129659. [Google Scholar] [CrossRef]
- Arts, S.; Hou, J.; Gomez, J.C. Natural language processing to identify the creation and impact of new technologies in patent text: Code, data, and new measures. Res. Policy 2021, 50, 104144. [Google Scholar] [CrossRef]
- Just, J. Natural language processing for innovation search–Reviewing an emerging non-human innovation intermediary. Technovation 2024, 129, 102883. [Google Scholar] [CrossRef]
- Joung, J.; Kim, K. Monitoring emerging technologies for technology planning using technical keyword based analysis from patent data. Technol. Forecast. Soc. Change 2017, 114, 281–292. [Google Scholar] [CrossRef]
- Liu, Z.; Feng, J.; Uden, L. Technology opportunity analysis using hierarchical semantic networks and dual link prediction. Technovation 2023, 128, 102872. [Google Scholar] [CrossRef]
- Yoon, B.; Magee, C.L. Exploring technology opportunities by visualizing patent information based on generative topographic mapping and link prediction. Technol. Forecast. Soc. Change 2018, 132, 105–117. [Google Scholar] [CrossRef]
- Forcina, A.; Silvestri, L.; De Felice, F.; Falcone, D. Exploring Industry 4.0 technologies to improve manufacturing enterprise safety management: A TOPSIS-based decision support system and real case study. Saf. Sci. 2024, 169, 106351. [Google Scholar] [CrossRef]
- Abdat, F.; Leclercq, S.; Cuny, X.; Tissot, C. Extracting recurrent scenarios from narrative texts using a Bayesian network: Application to serious occupational accidents with movement disturbance. Accid. Anal. Prev. 2014, 70, 155–166. [Google Scholar] [CrossRef] [PubMed]
- Ahn, Y.; Choi, H.; Kim, B.S. Development of early fire detection model for buildings using computer vision-based CCTV. J. Build. Eng. 2023, 65, 105647. [Google Scholar] [CrossRef]
- Rao, A.S.; Radanovic, M.; Liu, Y.; Hu, S.; Fang, Y.; Khoshelham, K.; Palaniswami, M.; Ngo, T. Real-time monitoring of construction sites: Sensors, methods, and applications. Autom. Constr. 2022, 136, 104099. [Google Scholar] [CrossRef]
- Asadzadeh, A.; Arashpour, M.; Li, H.; Ngo, T.; Bab-Hadiashar, A.; Rashidi, A. Sensor-based safety management. Autom. Constr. 2020, 113, 103128. [Google Scholar] [CrossRef]
- Jeong, M.; Lee, H.; Bae, M.; Shin, D.B.; Lim, S.H.; Lee, K.B. Development and application of the smart helmet for disaster and safety. In Proceedings of the 2018 International Conference on Information and Communication Technology Convergence (ICTC), Jeju Island, Republic of Korea, 17–19 October 2018; IEEE: New York, NY, USA, 2018; pp. 1084–1089. [Google Scholar]
- Choi, Y.; Kim, Y. Applications of smart helmet in applied sciences: A systematic review. Appl. Sci. 2021, 11, 5039. [Google Scholar] [CrossRef]
- Nnaji, C.; Awolusi, I.; Park, J.; Albert, A. Wearable sensing devices: Towards the development of a personalized system for construction safety and health risk mitigation. Sensors 2021, 21, 682. [Google Scholar] [CrossRef]
- Chen, H.; Hou, L.; Zhang, G.K.; Moon, S. Development of BIM, IoT and AR/VR technologies for fire safety and upskilling. Autom. Constr. 2021, 125, 103631. [Google Scholar] [CrossRef]
- Sharma, A.; Mehtab, R.; Mohan, S.; Mohd Shah, M.K. Augmented reality–an important aspect of Industry 4.0. Industrial Robot. Int. J. Robot. Res. 2022, 49, 428–441. [Google Scholar] [CrossRef]
- Shanti, M.Z.; Cho, C.S.; de Soto, B.G.; Byon, Y.J.; Yeun, C.Y.; Kim, T.Y. Real-time monitoring of work-at-height safety hazards in construction sites using drones and deep learning. J. Saf. Res. 2022, 83, 364–370. [Google Scholar] [CrossRef]
- Ding, L.; Fang, W.; Luo, H.; Love, P.E.; Zhong, B.; Ouyang, X. A deep hybrid learning model to detect unsafe behavior: Integrating convolution neural networks and long short-term memory. Autom. Constr. 2018, 86, 118–124. [Google Scholar] [CrossRef]
- Feng, L.; Wang, Q.; Wang, J.; Lin, K.Y. A review of technological forecasting from the perspective of complex systems. Entropy 2022, 24, 787. [Google Scholar] [CrossRef] [PubMed]
- Yoon, B.; Jeong, Y.; Lee, K.; Lee, S. A systematic approach to prioritizing R&D projects based on customer-perceived value using opinion mining. Technovation 2020, 98, 102164. [Google Scholar]
- Jang, H.; Park, S.; Yoon, B. Exploring technology opportunities based on user needs: Application of opinion mining and SAO analysis. Eng. Manag. J. 2023, 35, 209–222. [Google Scholar] [CrossRef]
- Antons, D.; Grünwald, E.; Cichy, P.; Salge, T.O. The application of text mining methods in innovation research: Current state, evolution patterns, and development priorities. R D Manag. 2020, 50, 329–351. [Google Scholar] [CrossRef]
- Geum, Y.; Lee, S.; Yoon, B.; Park, Y. Identifying and evaluating strategic partners for collaborative R&D: Index-based approach using patents and publications. Technovation 2013, 33, 211–224. [Google Scholar]
- Chen, X.; Mao, J.; Ma, Y.; Li, G. The knowledge linkage between science and technology influences corporate technological innovation: Evidence from scientific publications and patents. Technol. Forecast. Soc. Change 2024, 198, 122985. [Google Scholar] [CrossRef]
- Cetera, W.; Gogołek, W.; Żołnierski, A.; Jaruga, D. Potential for the use of large unstructured data resources by public innovation support institutions. J. Big Data 2022, 9, 46. [Google Scholar] [CrossRef]
- Yoon, J.; Seo, W.; Coh, B.Y.; Song, I.; Lee, J.M. Identifying product opportunities using collaborative filtering-based patent analysis. Comput. Ind. Eng. 2017, 107, 376–387. [Google Scholar] [CrossRef]
- Lee, M.; Lee, S. Identifying new business opportunities from competitor intelligence: An integrated use of patent and trademark databases. Technol. Forecast. Soc. Change 2017, 119, 170–183. [Google Scholar] [CrossRef]
- Jeong, B.; Yoon, J.; Lee, J.M. Social media mining for product planning: A product opportunity mining approach based on topic modeling and sentiment analysis. Int. J. Inf. Manag. 2019, 48, 280–290. [Google Scholar] [CrossRef]
- Di Stefano, G.; Gambardella, A.; Verona, G. Technology push and demand pull perspectives in innovation studies: Current findings and future research directions. Res. Pol. 2012, 41, 1283–1295. [Google Scholar] [CrossRef]
- Seol, H.; Lee, S.; Kim, C. Identifying new business areas using patent information: A DEA and text mining approach. Expert Syst. Appl. 2011, 38, 2933–2941. [Google Scholar] [CrossRef]
- Wellman, H.M.; Lehto, M.R.; Sorock, G.S.; Smith, G.S. Computerized coding of injury narrative data from the National Health Interview Survey. Accid. Anal. Prev. 2004, 36, 165–171. [Google Scholar] [CrossRef] [PubMed]
- Song, B.; Suh, Y. Narrative texts-based anomaly detection using accident report documents: The case of chemical process safety. J. Loss Prev. Process Ind. 2019, 57, 47–54. [Google Scholar] [CrossRef]
- Bondy, J.; Lipscomb, H.; Guarini, K.; Glazner, J.E. Methods for using narrative text from injury reports to identify factors contributing to construction injury. Am. J. Ind. Med. 2005, 48, 373–380. [Google Scholar] [CrossRef]
- Graves, J.M.; Whitehill, J.M.; Hagel, B.E.; Rivara, F.P. Making the most of injury surveillance data: Using narrative text to identify exposure information in case control studies. Injury 2015, 46, 891–897. [Google Scholar] [CrossRef]
- Taylor, J.A.; Lacovara, A.V.; Smith, G.S.; Pandian, R.; Lehto, M. Near-miss narrative from the fire services: A Bayesian analysis. Accid. Anal. Prev 2014, 62, 119–129. [Google Scholar] [CrossRef]
- Carter, D.A.; Hirst, I.L.; Maddison, T.E.; Porter, S.R. Appropriate risk assessment methods for major accident establishments. Process Saf. Environ. Prot. 2003, 81, 12–18. [Google Scholar] [CrossRef]
- Pike, H.; Khan, F.; Amyotte, P. Precautionary principle (PP) versus as low as reasonably practicable (ALARP): Which one to use and when. Process Saf. Environ. Prot. 2020, 137, 158–168. [Google Scholar] [CrossRef]
- Bilim, A. Demographic analysis of occupational safety in the construction sector: Strategies and insights for risk reduction. Buildings 2025, 15, 528. [Google Scholar] [CrossRef]
- Seo, H.; Yoon, Y.-G. Analyzing research trends in smart construction safety: A topic modeling approach. Buildings 2025, 15, 520. [Google Scholar] [CrossRef]
- Ultsch, A.; Siemon, H.P. Kohonen’s self organizing feature maps for exploratory data analysis. In Proceedings of the International Neural Network Conference (INNC’90), Paris, France, 9–13 July 1990; pp. 305–308. [Google Scholar]
- Segev, A.; Kantola, J. Identification of trends from patents using self-organizing maps. Expert Syst. Appl. 2012, 39, 13235–13242. [Google Scholar] [CrossRef]
- Wu, J.L.; Chang, P.C.; Tsao, C.C.; Fan, C.Y. A patent quality analysis and classification system using self-organizing maps with support vector machine. Appl. Soft Comput. 2016, 41, 305–316. [Google Scholar] [CrossRef]
- Yoon, B.U.; Yoon, C.B.; Park, Y.T. On the development and application of a self–organizing feature map–based patent map. R D Manag. 2002, 32, 291–300. [Google Scholar] [CrossRef]
- Kang, S.; Suh, Y. On the development of risk factor map for accident analysis using textmining and self-organizing map (SOM) algorithms. J. Korean Soc. Saf. 2018, 33, 77–84. [Google Scholar]
- Moura, R.; Beer, M.; Patelli, E.; Lewis, J. Learning from major accidents: Graphical representation and analysis of multi-attribute events to enhance risk communication. Saf. Sci. 2017, 99, 58–70. [Google Scholar] [CrossRef]
- Palamara, F.; Piglione, F.; Piccinini, N. Self-organizing map and clustering algorithms for the analysis of occupational accident databases. Saf. Sci. 2011, 49, 1215–1230. [Google Scholar] [CrossRef]
- Geum, Y.; Lee, H.; Lee, Y.; Park, Y. Development of data-driven technology roadmap considering dependency: An ARM-based technology roadmapping. Technol. Forecast. Soc. Change 2015, 91, 264–279. [Google Scholar] [CrossRef]


| Technology | Case of Innovation |
|---|---|
| Sensor | Worker’s location tracking [24], communication technology [25], bio-sensor and health monitoring [26,27] |
| AR/VR | Emergency plan [28], automotive drivers’ safety [29] |
| Drone | Workplace surveillance [30], crack detection [14] |
| Machine learning | Fire detection [23], worker’s surveillance [22,31], protective equipment [25,26] |
| Market Demand Sources | Technology Supply Sources | Research Design |
|---|---|---|
| Patent | Publication | Index analysis [36], regression analysis [37] |
| Trademark | Patent | Survey [38], topic modeling [19] |
| Product/service specification | Patent | Collaborative filtering [39], association mining, and textmining [40] |
| Web review data | Product/service specification | Textmining, topic modeling [41] |
| Web review data | Patent | Textmining, opinion mining, and structural equation model [33], textmining, opinion mining, and SAO2Vec [34] |
| Cluster | Incident | Patent | Keywords Contained | Main Work | Related ICT | Type of Incident |
|---|---|---|---|---|---|---|
| Ⅰ | 737 | 333 | pipe, concrete, metal, machine, piece, cut, cover, hand, finger, electrical | Machine tool work | Automatic machine, Interlock system | pinch, stuck |
| Ⅱ | 1537 | 64 | fell, roof, head, concrete, fractured, scaffold, pipe, ribs, breaking, slipped, weight | High place work | Weight monitoring, Head defense | fall, hit, slip |
| Ⅲ | 36 | 583 | truck, vehicle, control, signal, sensor, module, controller, struck, electrical, motor, alarm | Vehicle | Sensor in vehicle, Signal processing | fall, hit, pinch |
| Ⅳ | 145 | 945 | battery, lift, belt, vehicle, pressure, layer, electrical, syringe, valve, control | Hydraulic machine | Battery monitoring, Valve control | hit, fire. explosion |
| Ⅴ | 143 | 448 | position, needle, valve, seat, locking, support, power, connected, door, electrical | Miscellaneous; Others | Interlock system, Power monitoring, Safety seat | hit, electric shock |
| Total | 2598 | 2374 |
| Label | Cluster | Documents Classified in Nodes | Linking Keywords | |
|---|---|---|---|---|
| Incident | Patent | |||
| A151449 | Ⅰ, Ⅳ | A140659 A151449 A150735 A161580 A170176 | P150034 P150745 | machine, member, operate, move, open, position, part, connect, switch, control, remote, lock, guard |
| A151241 | Ⅰ, Ⅱ, Ⅳ | A150322 A150361 A150158 A151241 A170081 | P140566 P150259 P150842 P150850 | work, move, remove, position, step, lift, load, attach, assembly, truck, member, ladder, support, assembly, mount |
| P150298 | Ⅰ, Ⅲ, Ⅳ | A150058 A150930 A151449 A161647 | P140276 P140835 P150007 P150032 P150298 | truck, vehicle, control, signal, sensor, module, controller, struck, electrical, motor, pressure, fence, strap, implant, line, location |
| P150578 | Ⅰ, Ⅳ | A150950 A160013 A160883 A161450 | P140058 P140041 P150578 | lift, belt, pressure, layer, electrical, valve, control, crane, shock, line, level |
| P140746 | Ⅳ, Ⅴ | A150019 A150454 A160182 A160348 | P140708 P140746 P150147 P150199 P160084 | power, electrical, vehicle, burns, line, shock, switch, signal, circuit, voltage, load |
| Cluster | Data Distribution | Possible Situation | Possible Technology Strategy |
|---|---|---|---|
| Ⅰ | Balanced documents |
|
|
| Ⅱ | Almost all incident documents |
|
|
| Ⅲ, Ⅳ, Ⅴ | Almost all patent documents |
|
|
| Type of Technology Gap | Criteria | Implication of Technology Strategy |
|---|---|---|
| Technology lag | Year of Patent > Year of Incident | Technology development to reduce risks of incident after occurring incidents |
| Technology lead | Year of Patent < Year of Incident | Late applications of technology despite early technology proposals |
| Gap Strategy | Strategy Type | Related Documents | Linking Keywords | Possible Technology Roadmap | |
|---|---|---|---|---|---|
| Incident | Patent | ||||
| Technology lag (Demand–pull) | Technology development | A140659 | P150745 | machine, member, operate, move, open, position, part, connect, switch, control, remote, lock, guard |  |
| Incident–pull forecasting | A140659 | P150034 P150745 | 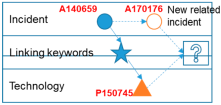 | ||
| Technology lead (Technology–push) | Technology applications | A150019 | P140708 | power, electrical, vehicle, burns, line, shock, switch, signal, circuit, voltage, load |  |
| Technology–push forecasting | A150019 A150454 | P160084 |  | ||
Disclaimer/Publisher’s Note: The statements, opinions and data contained in all publications are solely those of the individual author(s) and contributor(s) and not of MDPI and/or the editor(s). MDPI and/or the editor(s) disclaim responsibility for any injury to people or property resulting from any ideas, methods, instructions or products referred to in the content. |
© 2025 by the author. Licensee MDPI, Basel, Switzerland. This article is an open access article distributed under the terms and conditions of the Creative Commons Attribution (CC BY) license (https://creativecommons.org/licenses/by/4.0/).
Share and Cite
Suh, Y. Identifying Safety Technology Opportunities to Mitigate Safety-Related Issues on Construction Sites. Buildings 2025, 15, 847. https://doi.org/10.3390/buildings15060847
Suh Y. Identifying Safety Technology Opportunities to Mitigate Safety-Related Issues on Construction Sites. Buildings. 2025; 15(6):847. https://doi.org/10.3390/buildings15060847
Chicago/Turabian StyleSuh, Yongyoon. 2025. "Identifying Safety Technology Opportunities to Mitigate Safety-Related Issues on Construction Sites" Buildings 15, no. 6: 847. https://doi.org/10.3390/buildings15060847
APA StyleSuh, Y. (2025). Identifying Safety Technology Opportunities to Mitigate Safety-Related Issues on Construction Sites. Buildings, 15(6), 847. https://doi.org/10.3390/buildings15060847