
Enhancing Daylight and Energy Efficiency in Hot Climate Regions with a Perforated Shading System Using a Hybrid Approach Considering Different Case Studies


Abstract
1. Introduction

| No. | Study | Location | Performance | Method | Shading | Orientation | Validation | MCDM | ||
|---|---|---|---|---|---|---|---|---|---|---|
| Daylight | Glare | Energy and Thermal Comfort | ||||||||
| 1 | [24] | Saudi Arabia (BWh) * | DA | DGP | kWh/m2 | Simulation | Contemporary Mashrabiya | S, E, W, N | x | x |
| 2 | [20] | Michigan (Dfa) | DA | -- | -- | Simulation and Measurements | Contemporary Mashrabiya | S | √ | x |
| 3 | [14] | Seville, Spain (Csa) | Daylit area | -- | Annual energy | Simulation and The Design of Experiments using Orthogonal Arrays | Simple Geometry (circle, triangle, hexagon) | S | x | x |
| 4 | [25] | Iran, Tehran (BSk) | sDA | ASE | -- | Optimization- GA | Kinetic Rosetta Pattern | S | x | x |
| 5 | [21] | Egypt (BWh) | Point time illuminance | -- | -- | Simulation and measurement | Fixed IGPs | -- | √ | × |
| 6 | [26] | Catalonia, Spain (Csa) | SDA | ASE | -- | MOO NSGA II | Modern Design | S | x | x |
| 7 | [27] | Taipei (Cfa) | DA | ASE | -- | Prediction with metamodel using ANN | Simple Geometry (circle) | S | x | x |
| 8 | [28] | UAE (BWh) | UDI | -- | Solar radiation | Simulation | Fixed Rosetta | -- | x | x |
| 9 | [29] | semi-arid climate (BSh) | UDI, sDA | -- | EUI | Grid-based simulation and general morphological analysis | Hexagonal shape of IGP with Orosi windows | S | x | x |
| 10 | [23] | UAE (BWh) | -- | -- | KWH solar radiation | simulation | Six triangular units | S | x | x |
| 11 | [22] | Saudi Arabia (BWh) | DF | KW/h, solar gain | simulation | Fixed Traditional Mashrabiya | S | x | x | |
| 12 | [30] | Turkey (Csa) | sDA, UDI | ASE, DGP | -- | Simulation | semi-regular and demi-regular tessellations | S | x | x |
| 13 | [31] | Istanbul (Csa) | sDA, UDI | DGP | -- | Simulation | Dynamic origami | S | x | x |
| 14 | [32] | Isfahan (BWk) | UDI, sDA | sGA | EUI | Simulation | PSS, louvers, eggcrate | S, SW, W, NW, N, NE, E, SE | x | Multi-Attribute Utility Theory (MAUT) |
| 15 | [13] | Wuhan, China (Cfa) | UDI, sDA, Temporal uniformity factor (TUF) | SDG | -- | Simulation study-Data Envelopment Analysis | Non-uniform PPS | S | x | x |
- Most studies focus primarily on south-facing (S) orientations, with fewer investigations into other cardinal directions [32,36], and most studies do not account for how shading performance varies across different latitudes, climates, or regional solar exposure patterns. This limits the global applicability of the findings.
- Only a few studies include fabrication and validation [20,21,36], meaning most research relies solely on simulations or theoretical models without physical prototyping or real-world testing. This lack of experimental validation raises questions about the practical applicability and accuracy of the proposed shading systems.
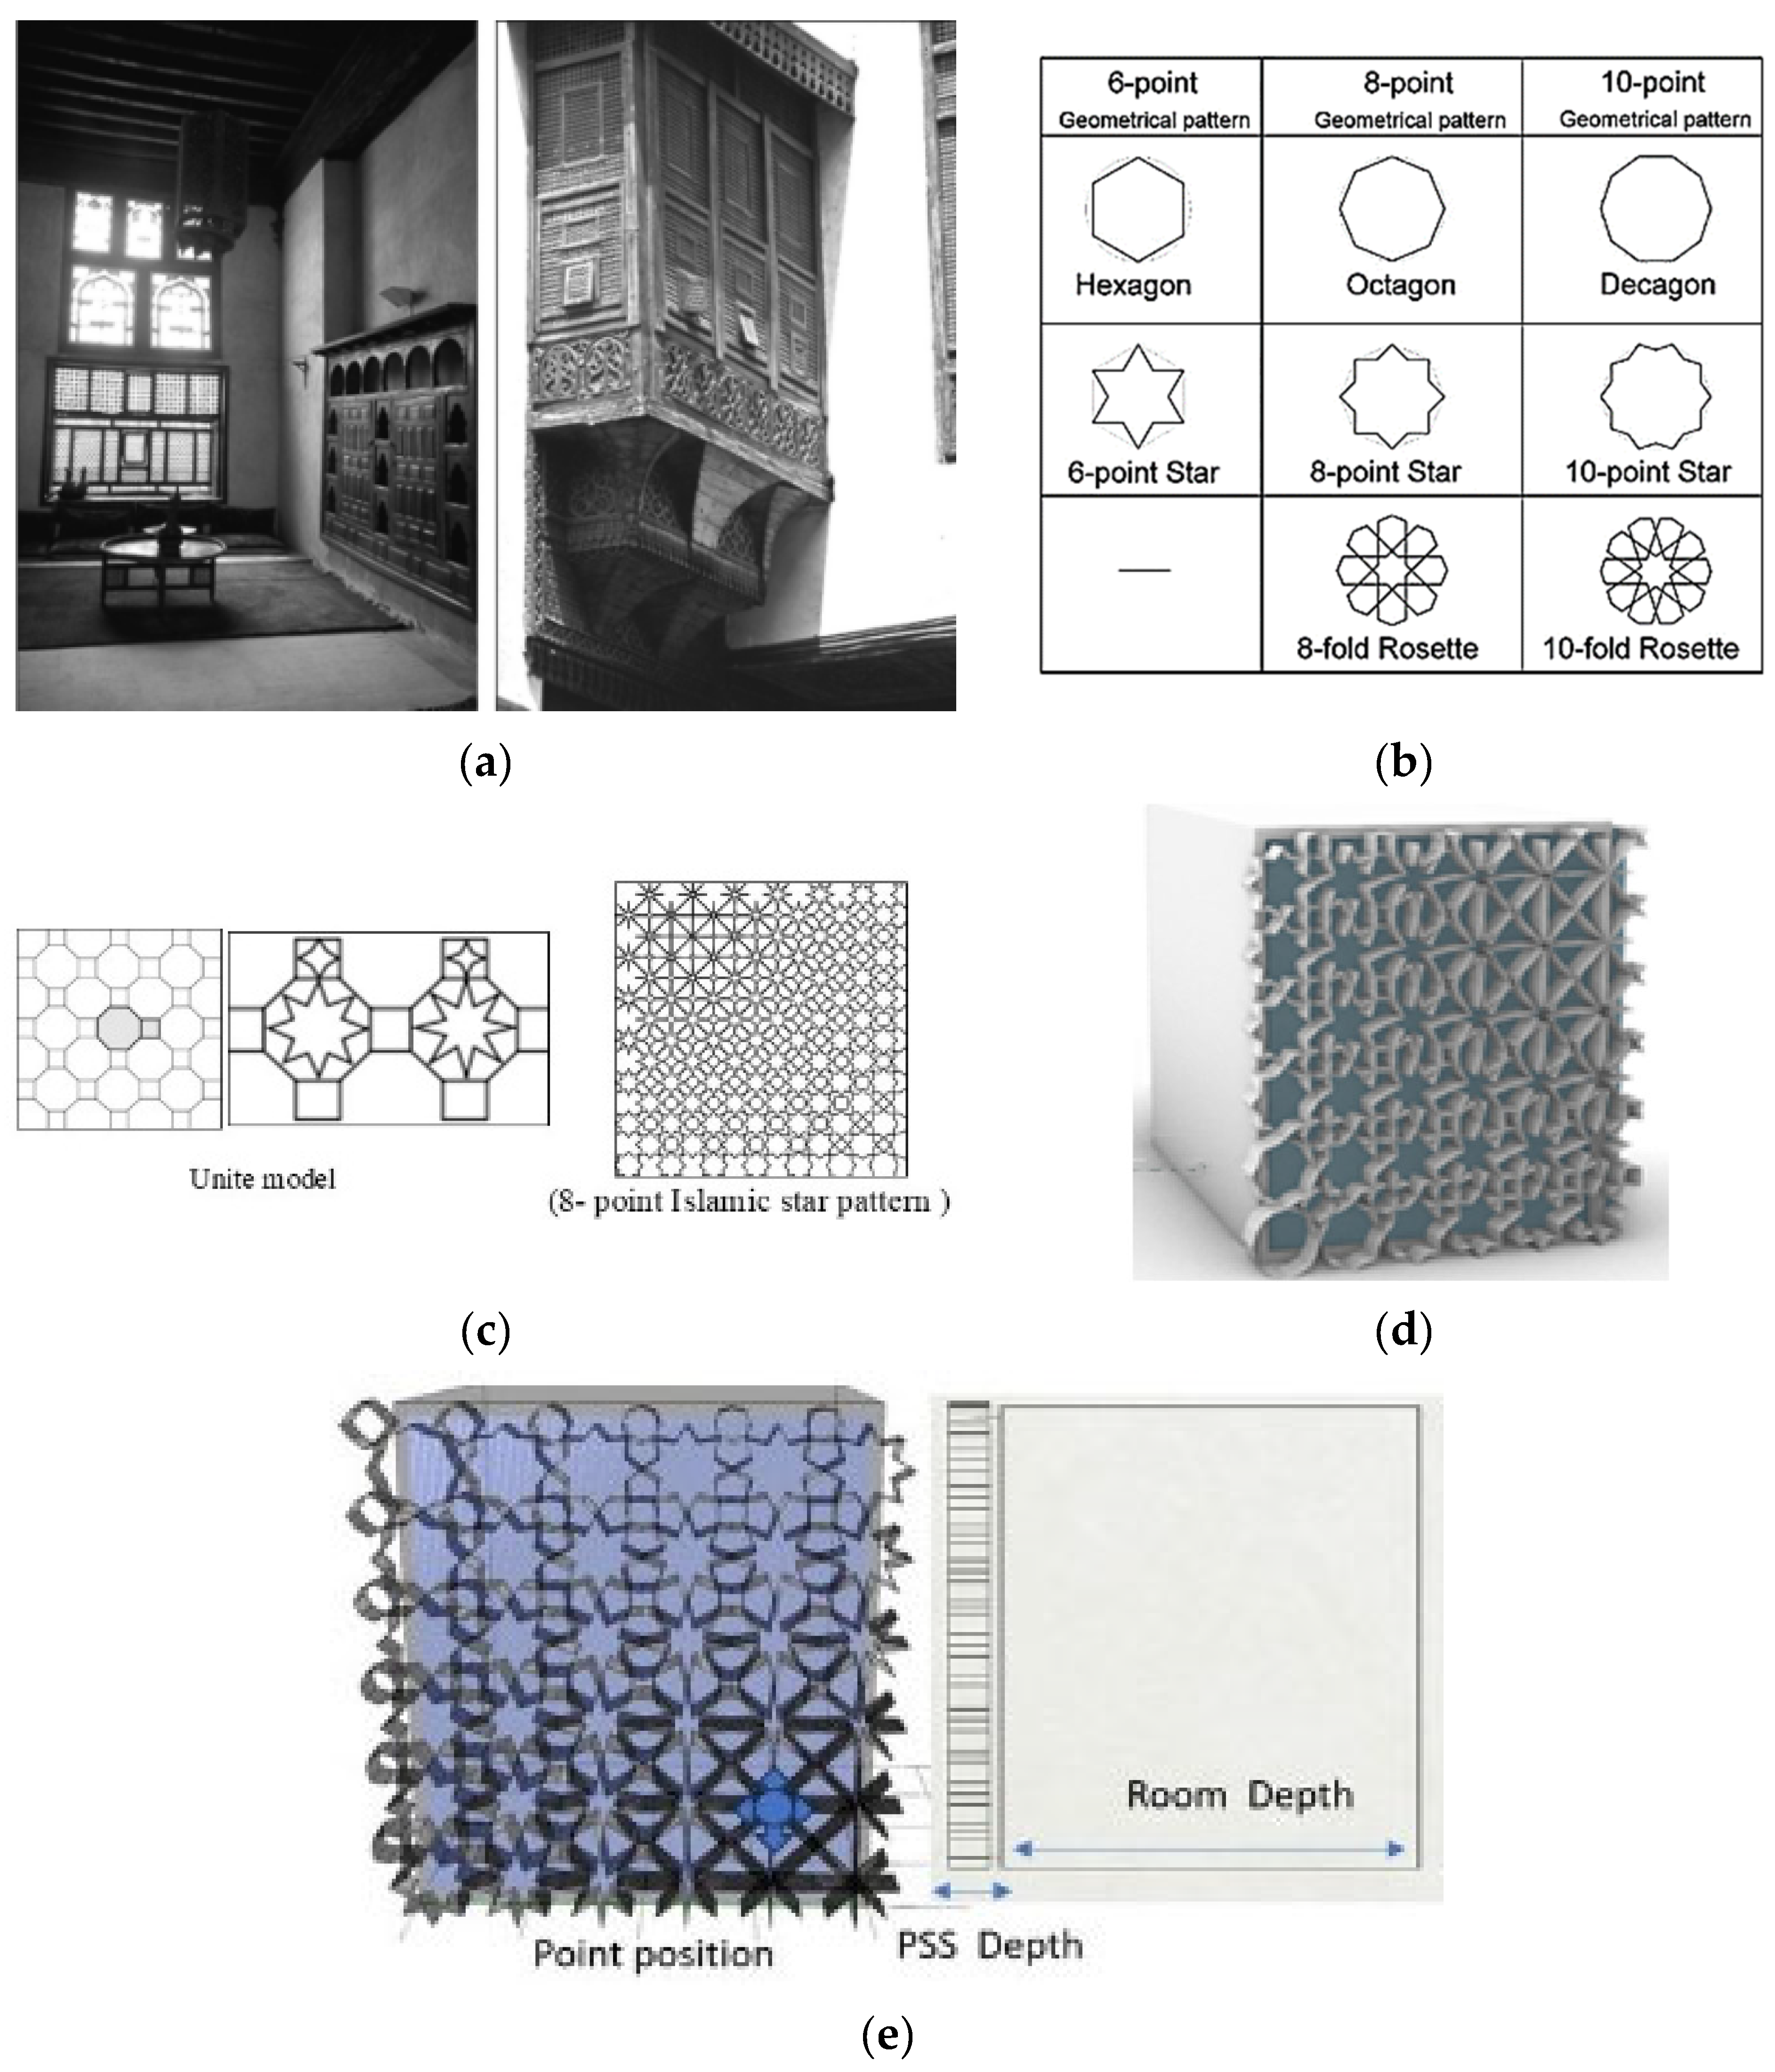
- In the design and optimization of PSS, the chosen patterns varied based on the context of each study, encompassing modules of Islamic Geometric Patterns (IGPs) such as Rosetta, as well as simple geometric shapes like circles, squares, and hexagons, along with folded geometry [29]. In contrast, other patterns, such as the star pattern, received comparatively less focus.
- Additionally, the current literature predominantly emphasizes daylight performance, while thermal performance is less explored [13,25]. Most studies focused on the improvement of lighting through UDI [30,37], neglecting other metrics that could indicate the presence of glare. In particular, ASE (Annual Sunlight Exposure) was often overlooked, despite its importance in assessing excessive sunlight that may cause visual discomfort and reduce indoor lighting quality.
- Furthermore, existing studies often overlook architects’ preferences and fail to account for the interdependencies between performance metrics. Traditional MCDM methods, such as Analytic Hierarchy Process (AHP), assume independence among criteria. In contrast, ANP can account for interdependence and feedback between criteria and alternatives, making it particularly suitable for complex decision-making scenarios. By incorporating ANP, designers and researchers can better capture the dynamic relationships between various design parameters, leading to more robust and informed decisions in shading system selection. This approach can ultimately enhance the performance, sustainability, and adaptability of building façades in diverse climatic conditions.
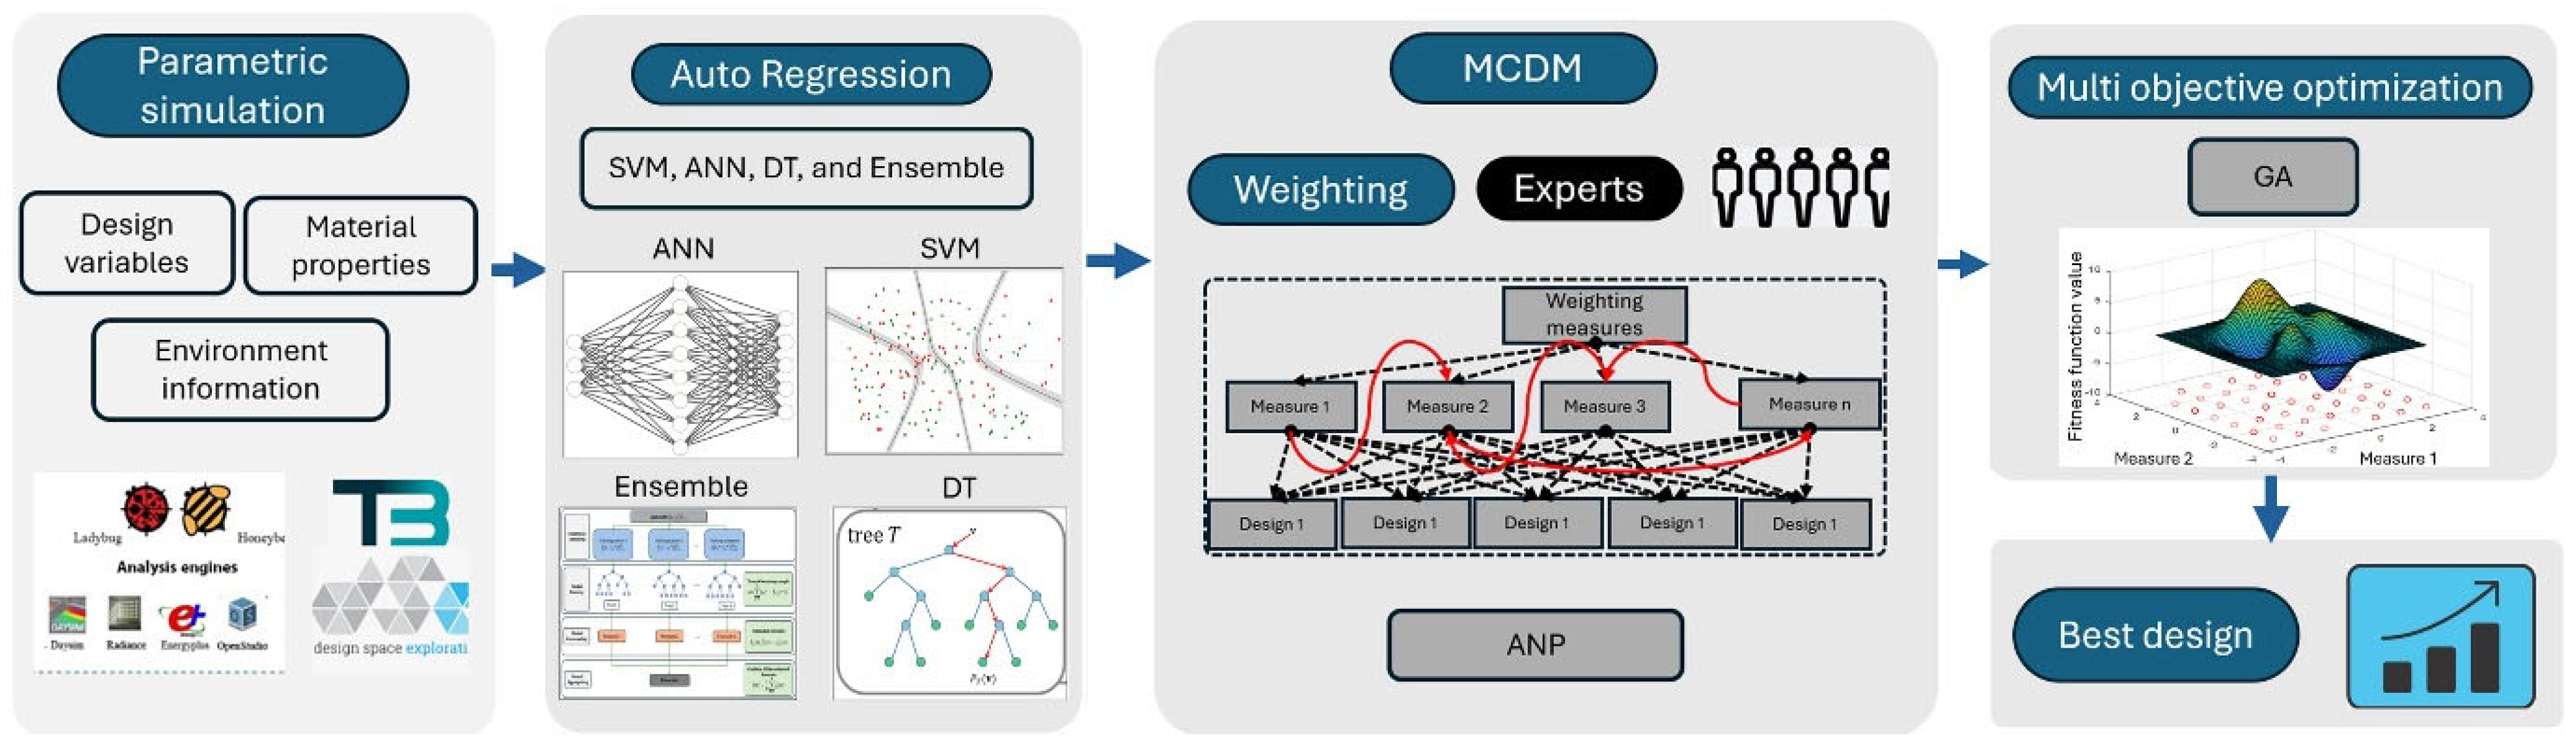
2. Materials and Methods
2.1. The Proposed PSS Design
2.2. Shading System Design Framework
2.3. Dataset Generation
2.3.1. Case Studies
2.3.2. Performance Measures
2.4. Regression Models Generation
2.5. Optimization
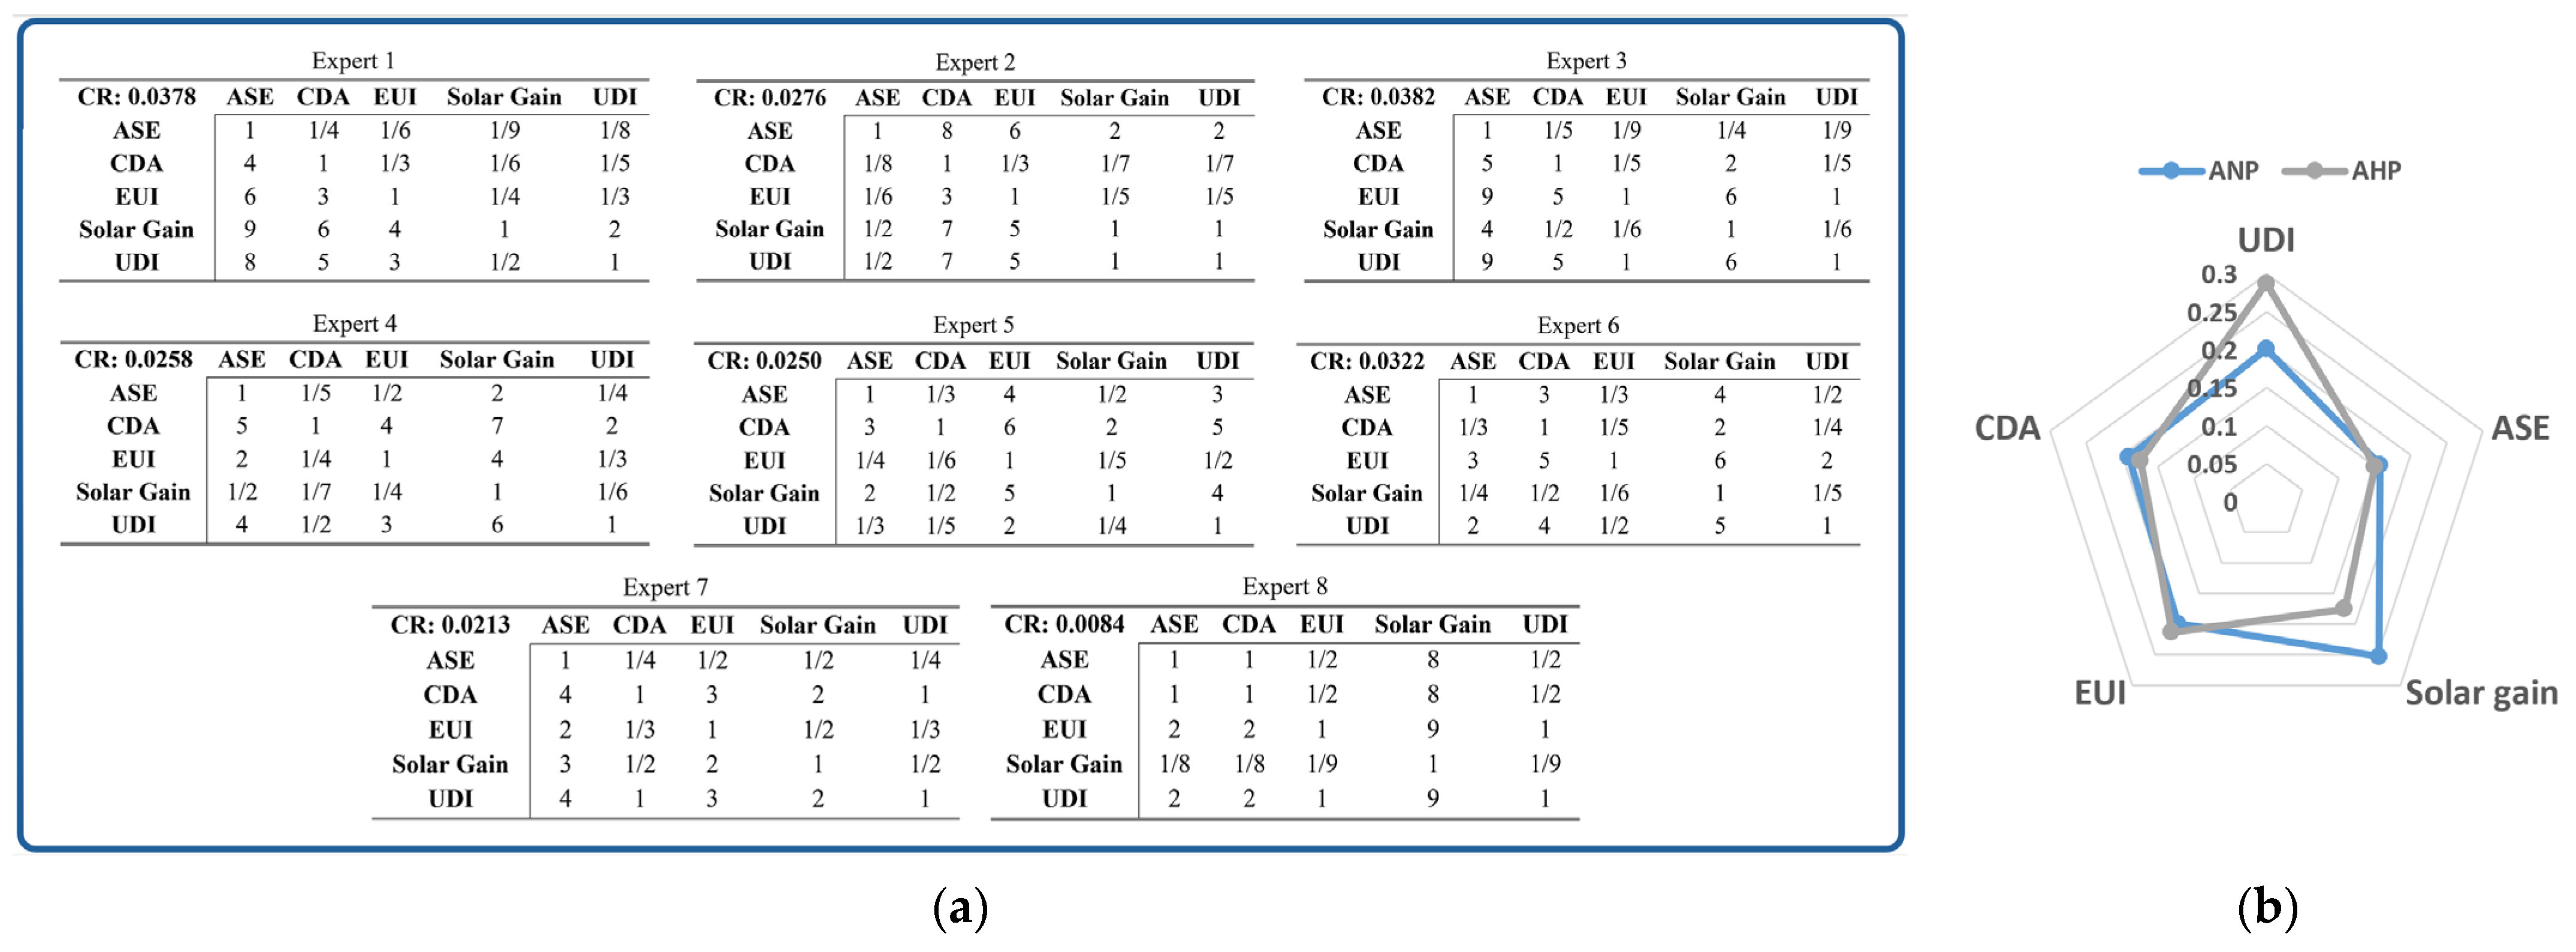
2.6. MCDM—ANP
- A group of experts will give their pairwise judgment (Analytic hierarchy process (AHP) pairwise comparison matrix) considering the relative importance of the performance measures using the popular Saaty’s scale [65]. This scale is as follows: 1: Equal importance, 2: Weak importance, 3: Moderate importance, 4: Moderate plus, 5: Strong importance, 6: Strong plus, 7: Very strong importance, 8: Very very strong, 9: Extreme importance. The judging matrix () is as follows:
- 2.
- For each of these matrices, the cumulative column product is calculated then the weight vector , which is the geometric mean of the resulting values, which is then normalized by dividing to the summation of the vector.
- 3.
- Then, the consistency index , random consistency , and consistency ratio are calculated. Where , the consistency index is accepted only if .
- 4.
- Subsequently, the opinion of each expert will be obtained as a weight vector for each performance measure.
- 5.
- The weight vector that is obtained in AHP will be employed in ANP.
- 6.
- Interdependence among the criteria is addressed by conducting pairwise comparisons () to assess the impact of each criterion on the others, with input provided by experts.
- 7.
- Then, the normalized matrix () is calculated based on the following equation:
- 8.
- Then, the adjusted weight vector are calculated as follows:
- 9.
- Then, those weights will be combined in a single weight vector through taking the arithmetic means.
3. Results and Discussion
3.1. MCDM
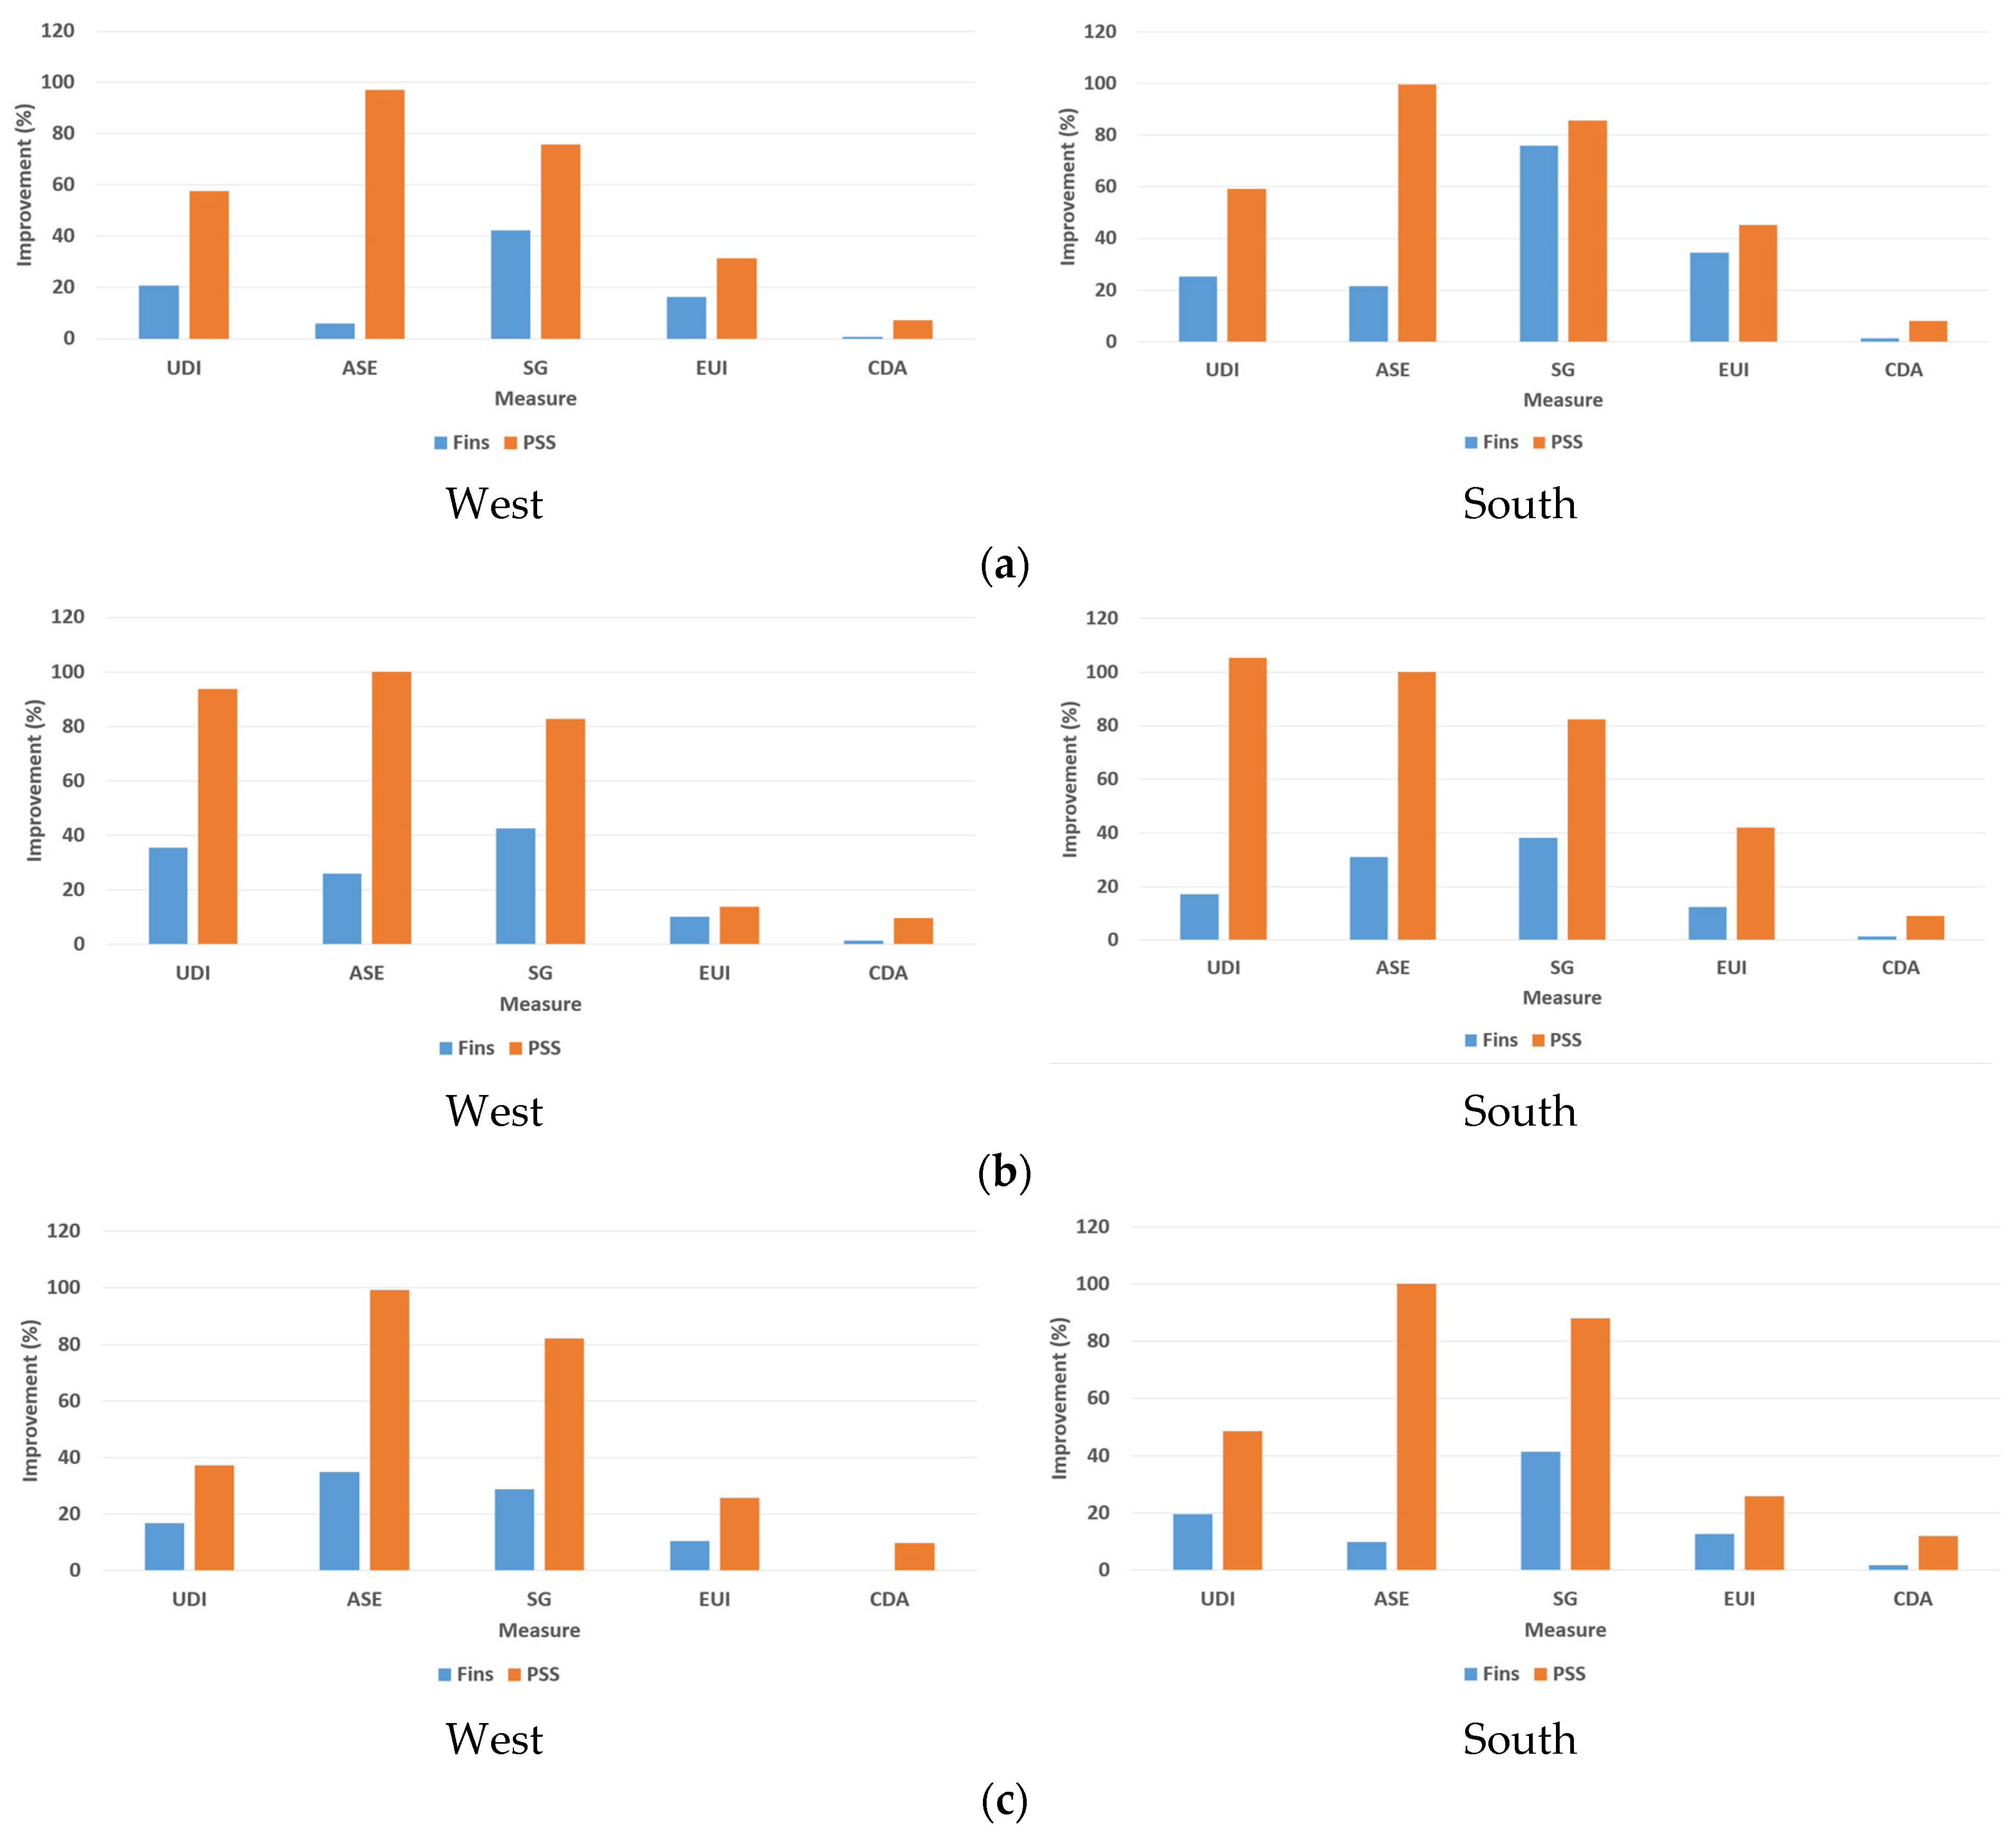
3.2. Analysis
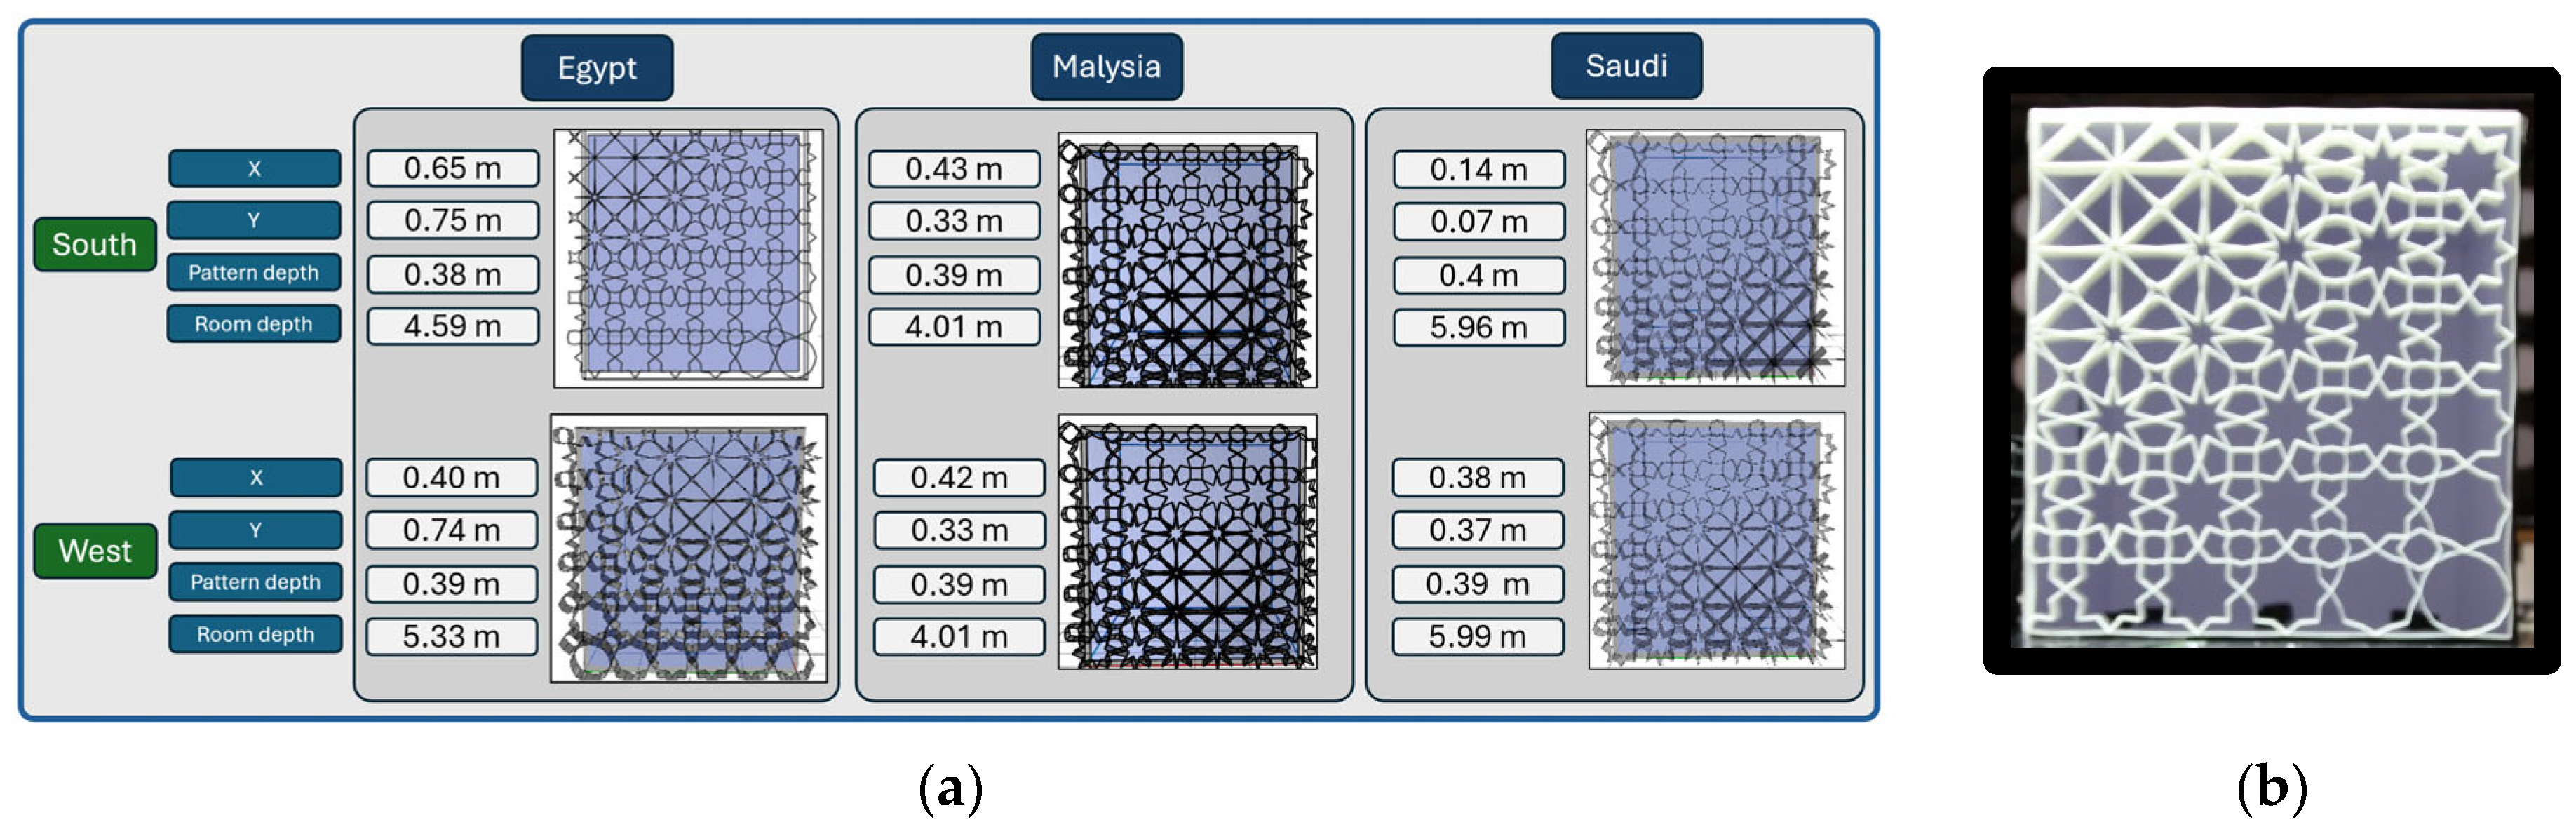
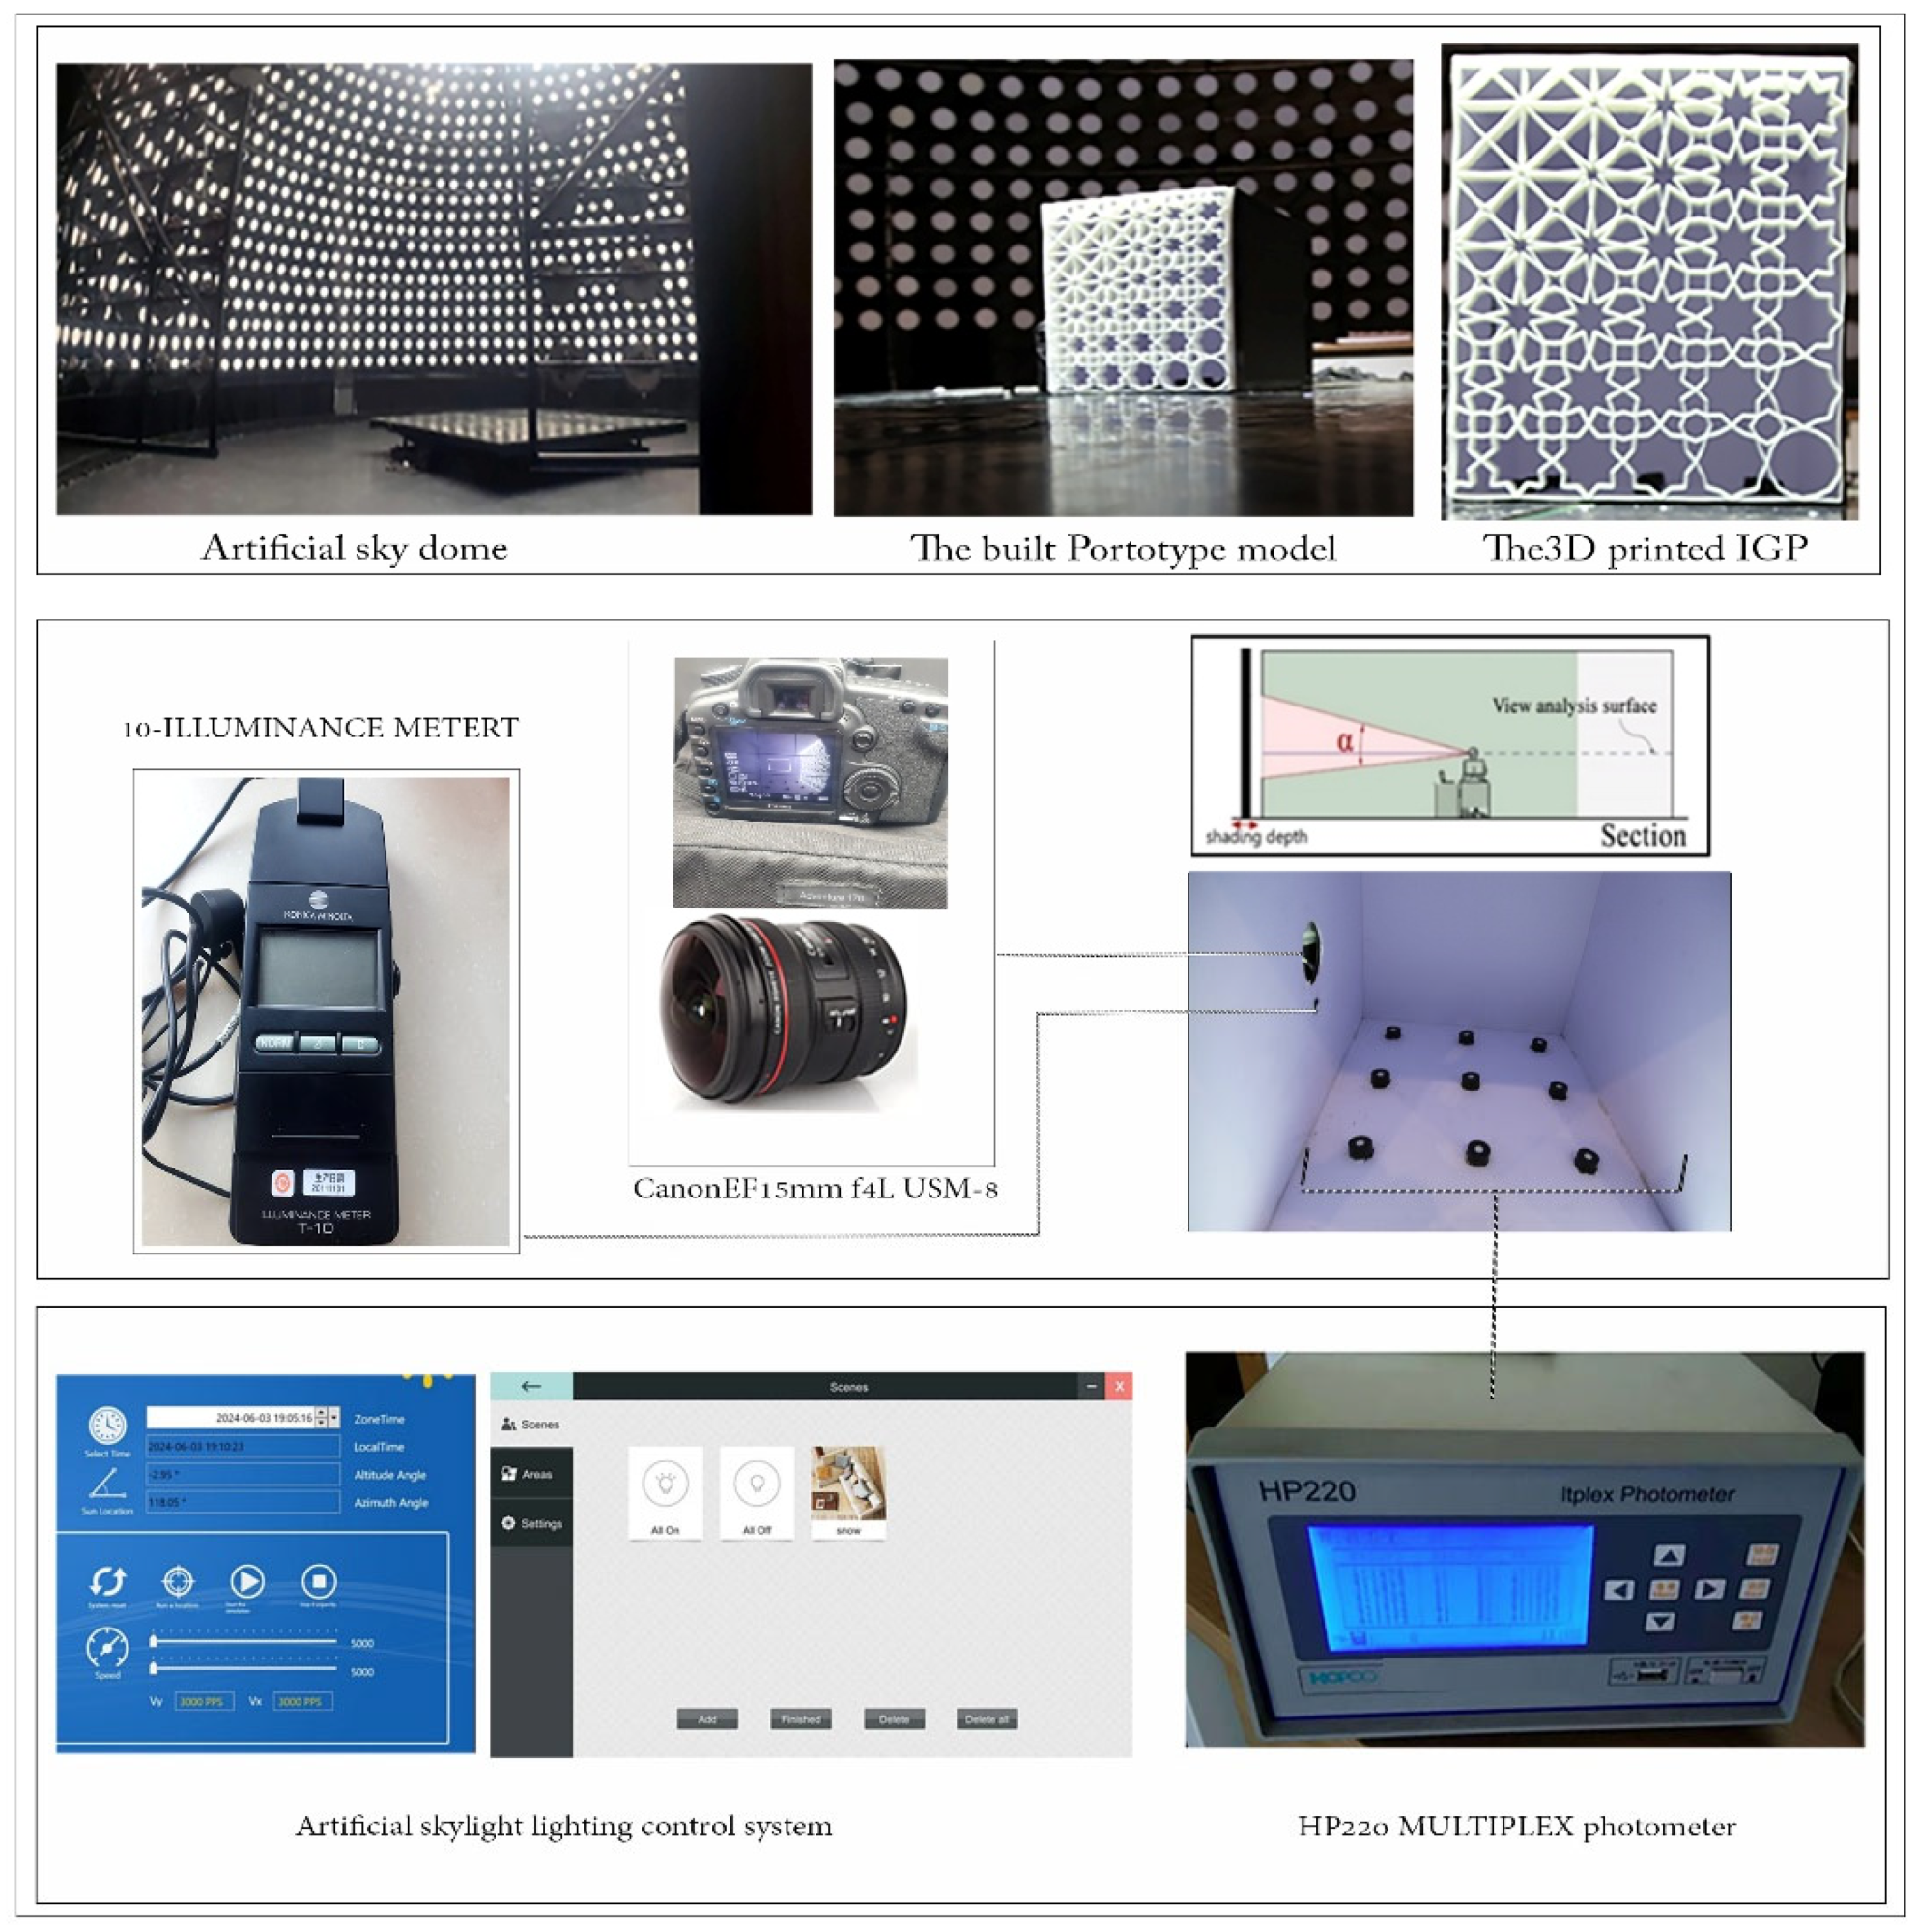
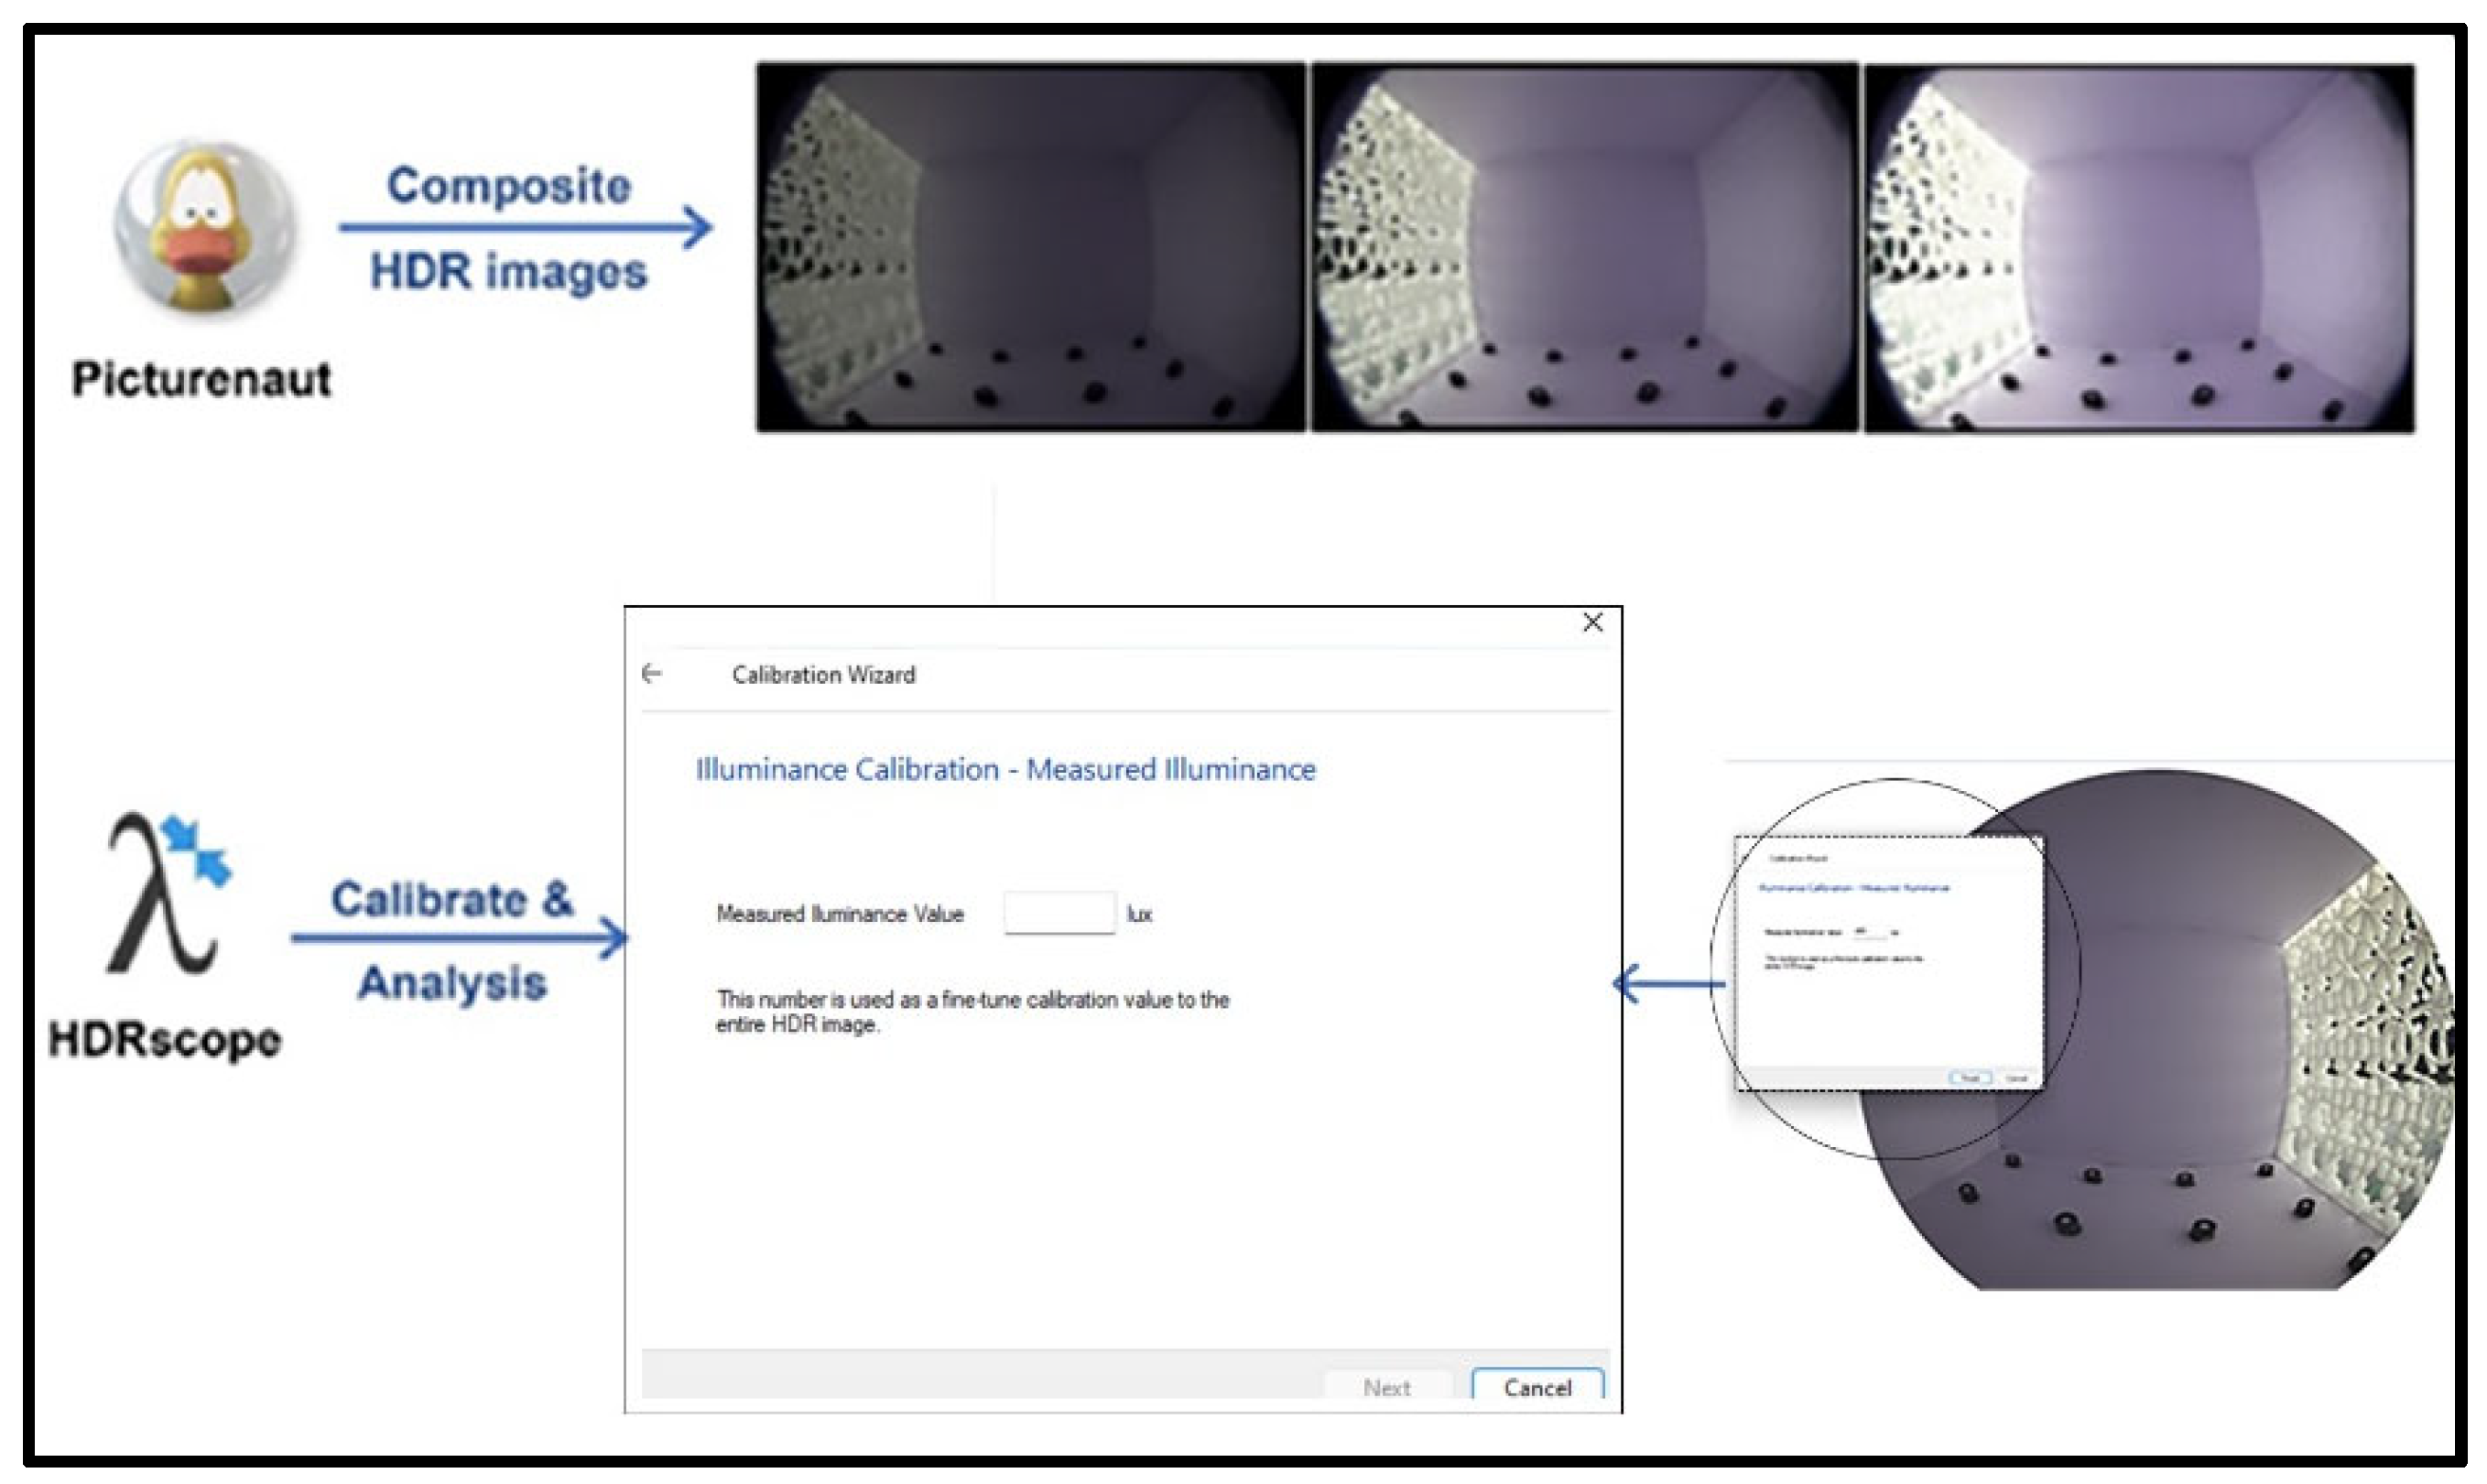
3.3. Experimental Validation of the PSS Shading System
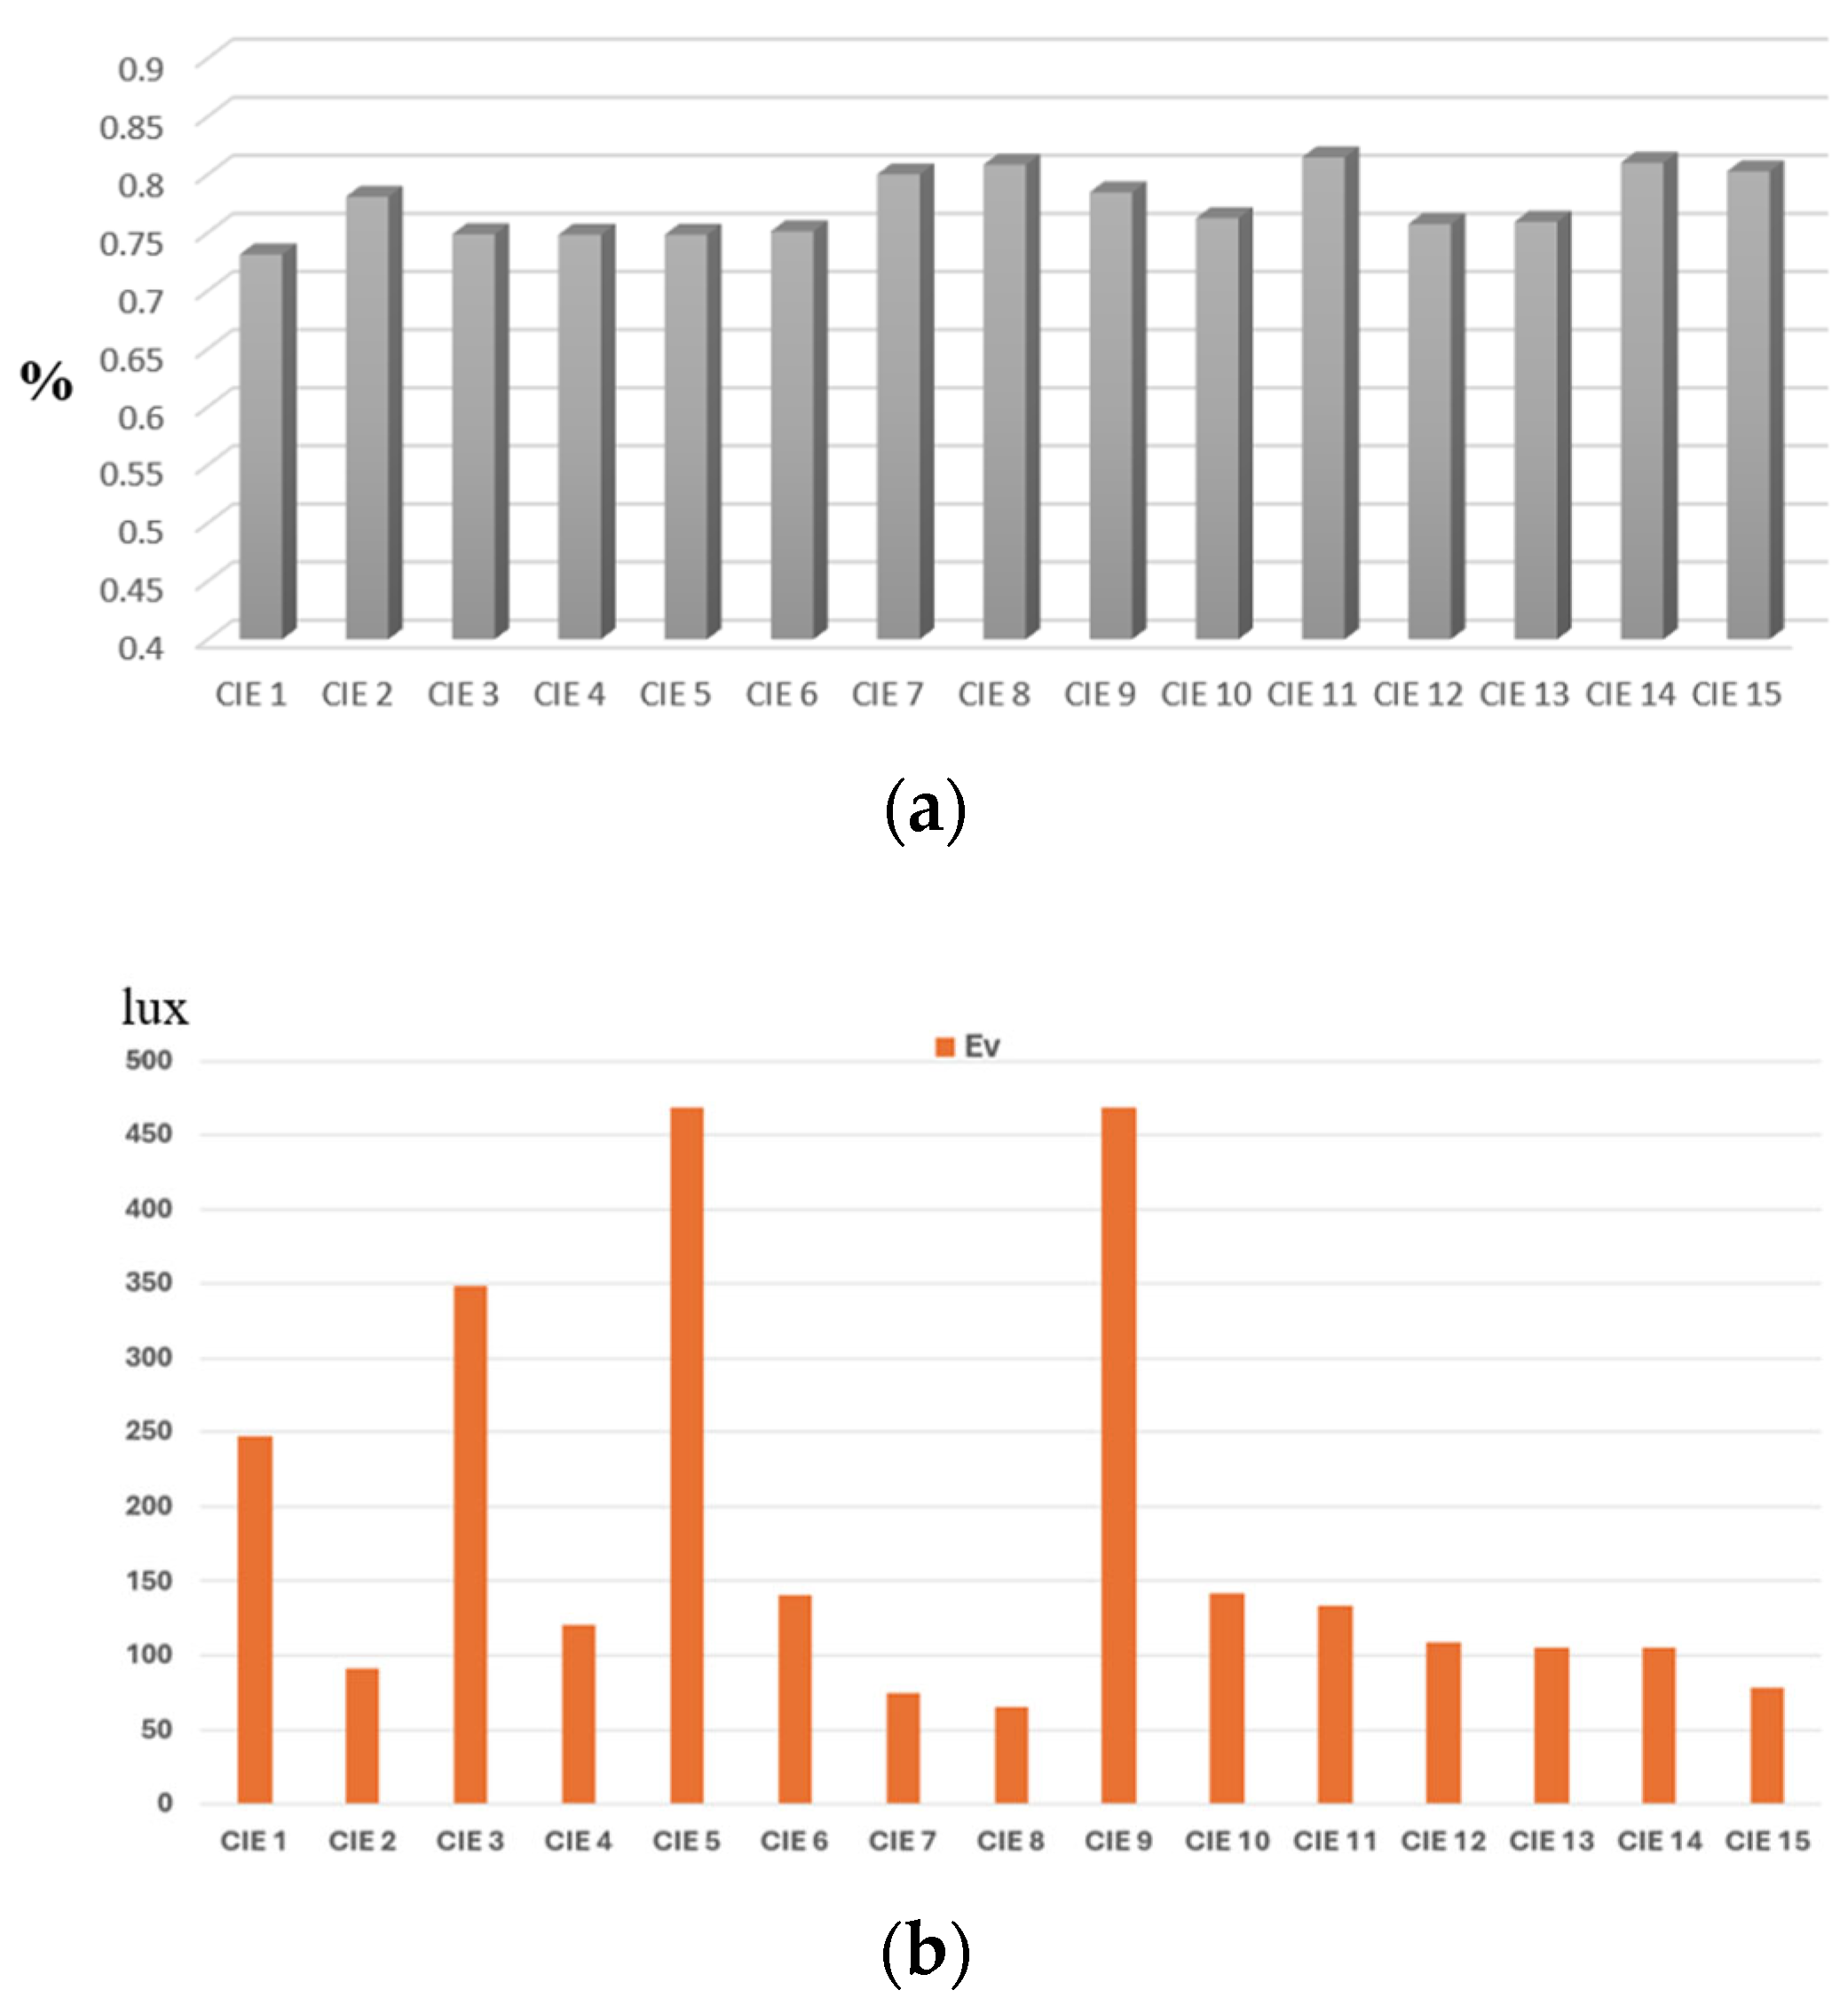
- (1)
- ClE standard overcast sky, steep luminance gradation towards zenith, azimuthal uniformity.
- (2)
- Overcast, with steep luminance gradation and slight brightening towards the sun.
- (3)
- Overcast, moderately graded with azimuthal uniformity.
- (4)
- Overcast, moderately graded and slightly brightening towards the sun.
- (5)
- Sky of uniform luminance.
- (6)
- Partly cloudy sky, no gradation towards zenith, slight brightening towards the sun.
- (7)
- Partly cloudy sky, no gradation towards zenith, brighter circumsolar region.
- (8)
- Partly cloudy sky, no gradation towards zenith, distinct solar corona.
- (9)
- Partly cloudy, with the obscured sun.
- (10)
- Partly cloudy, with brighter circumsolar region.
- (11)
- White-blue sky with distinct solar corona.
- (12)
- ClE standard clear sky, low luminance turbidity.
- (13)
- ClE standard clear sky, polluted atmosphere.
- (14)
- Cloudless, turbid sky with broad solar corona.
- (15)
- White-blue turbid sky with broad solar corona.
3.4. Summary of the Main Findings
3.5. Limitations and Future Work
4. Conclusions
Author Contributions
Funding
Data Availability Statement
Conflicts of Interest
Abbreviations
| PSS | Perforated shading screen |
| MCDM | Multi-criteria decision-making |
| GA | Genetic algorithm |
| ANP | Analytic Network Process |
| ANN | Artificial neural networks |
| MAUT | Multi-Attribute Utility Theory |
| UDI | Useful Daylight Illuminance |
| EUI | Energy intensity use |
| ASE | Annual sun exposure |
| CDA | Continuous Daylight Autonomy |
| SG | Solar gains |
| LHS | Latin hypercube sampling method |
| ENS | Ensemble |
| DT | Decision tree |
| SVM | Support vector machines |
| AHP | Analytic Hierarchy Process |
References
- Kamal, A.; Kadam, S.T.; Hou, D.; Hassan, I.G.; Wang, L.; Sezer, N.; Rahman, M.A. Detailed profiling of high-rise building energy consumption in extremely hot and humid climate. Clean. Energy Syst. 2023, 4, 100060. [Google Scholar] [CrossRef]
- Lakhdari, K.; Sriti, L.; Painter, B. Parametric optimization of daylight, thermal and energy performance of middle school classrooms, case of hot and dry regions. Build. Environ. 2021, 204, 108173. [Google Scholar] [CrossRef]
- Mahrous, R.; Giancola, E.; Osman, A.; Asawa, T.; Mahmoud, H. Review of key factors that affect the implementation of bio-receptive façades in a hot arid climate: Case study north Egypt. Build. Environ. 2022, 214, 108920. [Google Scholar] [CrossRef]
- Ishac, M.; Nadim, W. Standardization of optimization methodology of daylighting and shading strategy: A case study of an architectural design studio—The German University in Cairo, Egypt. J. Build. Perform. Simul. 2021, 14, 52–77. [Google Scholar] [CrossRef]
- Rocha, A.P.d.A.; Oliveira, R.C.L.F.; Mendes, N. Technical Review of Solar Distribution Calculation Methods: Enhancing Simulation Accuracy for High-Performance and Sustainable Buildings. Buildings 2025, 15, 578. [Google Scholar] [CrossRef]
- Yusoff, W.F.M.; Shaharil, M.I.; Mohamed, M.F.; Rasani, M.R.M.; Sapian, A.R.; Dahlan, N.D. Review of openings with shading devices at naturally ventilated buildings. Archit. Eng. Des. Manag. 2023, 19, 463–479. [Google Scholar] [CrossRef]
- Masoud, S.; Zamani, Z.; Hosseini, S.M.; Attia, S. A Review of Factors Affecting the Lighting Performance of Light Shelves and Controlling Solar Heat Gain. Buildings 2024, 14, 1832. [Google Scholar] [CrossRef]
- Gaber, B.; Zhan, C.; Han, X.; Omar, M.; Li, G. A novel decision support system for designing fixed shading systems in the early design stage: A case study in Egypt. J. Build. Eng. 2024, 96, 110453. [Google Scholar] [CrossRef]
- Koç, S.G.; Maçka Kalfa, S. The effects of shading devices on office building energy performance in Mediterranean climate regions. J. Build. Eng. 2021, 44, 102653. [Google Scholar] [CrossRef]
- Al-Saadi, S.N.; Al-Jabri, K.S. Optimization of envelope design for housing in hot climates using a genetic algorithm (GA) computational approach. J. Build. Eng. 2020, 32, 101712. [Google Scholar] [CrossRef]
- Al-Kodmany, K. Sustainability and the 21st Century Vertical City: A Review of Design Approaches of Tall Buildings. Buildings 2018, 8, 102. [Google Scholar] [CrossRef]
- Lumpkin, D.R.; Horton, W.T.; Sinfield, J.V. Holistic synergy analysis for building subsystem performance and innovation opportunities. Build. Environ. 2020, 178, 106908. [Google Scholar] [CrossRef]
- Huang, L.; Zou, K.; Zhang, X.; Zhao, S. Effects of non-uniform perforated solar screen on daylighting and visual comfort performance. J. Build. Eng. 2024, 97, 110684. [Google Scholar] [CrossRef]
- Chi, D.A.; Moreno, D.; Navarro, J. Design optimisation of perforated solar façades in order to balance daylighting with thermal performance. Build. Environ. 2017, 125, 383–400. [Google Scholar] [CrossRef]
- Fernando, D.; Navaratnam, S.; Rajeev, P.; Sanjayan, J. Study of Technological Advancement and Challenges of Façade System for Sustainable Building: Current Design Practice. Sustainability 2023, 15, 14319. [Google Scholar] [CrossRef]
- Caetano, I.; Leitão, A. Mathematically Developing Building Facades: An Algorithmic Framework. In Formal Methods in Architecture; Eloy, S., Leite Viana, D., Morais, F., Vieira Vaz, J., Eds.; Springer International Publishing: Cham, Switzerland, 2021; pp. 3–17. ISBN 978-3-030-57508-3. [Google Scholar]
- Hazbei, M.; Rafati, N.; Kharma, N.; Eicker, U. Optimizing architectural multi-dimensional forms; a hybrid approach integrating approximate evolutionary search, clustering and local optimization. Energy Build. 2024, 318, 114460. [Google Scholar] [CrossRef]
- Ranjazmay Azari, M.; Bemanian, M.; Mahdavinejad, M.; Körner, A.; Knippers, J. Application-based principles of islamic geometric patterns; state-of-the-art, and future trends in computer science/technologies: A review. Herit. Sci. 2023, 11, 22. [Google Scholar] [CrossRef]
- Dastoum, M.; Sanchez Guevara, C.; Arranz, B. Efficient daylighting and thermal performance through tessellation of geometric patterns in building façade: A systematic review. Energy Sustain. Dev. 2024, 83, 101563. [Google Scholar] [CrossRef]
- Emami, N.; Giles, H. Geometric Patterns, Light and Shade: Quantifying Aperture Ratio and Pattern Resolution in the Performance of Shading Screens. Nexus Netw. J. 2016, 18, 197–222. [Google Scholar] [CrossRef]
- Rashwan, A.; El Gizawi, L.; Sheta, S. Evaluation of the effect of integrating building envelopes with parametric patterns on daylighting performance in office spaces in hot-dry climate. Alex. Eng. J. 2019, 58, 551–557. [Google Scholar] [CrossRef]
- Taki, A.; Kumari, H. Examining Mashrabiya’s Impact on Energy Efficiency and Cultural Aspects in Saudi Arabia. Sustainability 2023, 15, 10131. [Google Scholar] [CrossRef]
- Bande, L.; Asmelash, Y.; Ahmad, A.; Cyiza, A.; Berengueres, J. Evaluation of an Existing Validated Emirati House versus a New Parametric Design Based on the Local Social Environment through the Application of Advanced Tools. Buildings 2023, 13, 2627. [Google Scholar] [CrossRef]
- Sabry, H.; Sherif, A.; Gadelhak, M.; Aly, M. Balancing the daylighting and energy performance of solar screens in residential desert buildings: Examination of screen axial rotation and opening aspect ratio. Sol. Energy 2014, 103, 364–377. [Google Scholar] [CrossRef]
- Tabadkani, A.; Banihashemi, S.; Hosseini, M.R. Daylighting and visual comfort of oriental sun responsive skins: A parametric analysis. Build. Simul. 2018, 11, 663–676. [Google Scholar] [CrossRef]
- Yi, Y.K. Building facade multi-objective optimization for daylight and aesthetical perception. Build. Environ. 2019, 156, 178–190. [Google Scholar] [CrossRef]
- Lin, C.-H.; Tsay, Y.-S. A metamodel based on intermediary features for daylight performance prediction of façade design. Build. Environ. 2021, 206, 108371. [Google Scholar] [CrossRef]
- Maksoud, A.; Mushtaha, E.; Al-Sadoon, Z.; Sahall, H.; Toutou, A. Design of Islamic Parametric Elevation for Interior, Enclosed Corridors to Optimize Daylighting and Solar Radiation Exposure in a Desert Climate: A Case Study of the University of Sharjah, UAE. Buildings 2022, 12, 161. [Google Scholar] [CrossRef]
- Hosseini, S.M.; Heidari, S. General morphological analysis of Orosi windows and morpho butterfly wing’s principles for improving occupant’s daylight performance through interactive kinetic façade. J. Build. Eng. 2022, 59, 105027. [Google Scholar] [CrossRef]
- Kızılörenli, E.; Maden, F. Modular responsive facade proposals based on semi-regular and demi-regular tessellation: Daylighting and visual comfort. Front. Archit. Res. 2023, 12, 601–612. [Google Scholar] [CrossRef]
- Kahramanoğlu, B.; Çakıcı Alp, N. Enhancing visual comfort with Miura-ori-based responsive facade model. J. Build. Eng. 2023, 69, 106241. [Google Scholar] [CrossRef]
- Kangazian, A.; Emadian Razavi, S.Z. Multi-criteria evaluation of daylight control systems of office buildings considering daylighting, glare and energy consumption. Sol. Energy 2023, 263, 111928. [Google Scholar] [CrossRef]
- Wen, S.; Hu, X.; Hua, G.; Xue, P.; Lai, D. Comparing the performance of four shading strategies based on a multi-objective genetic algorithm: A case study in a university library. J. Build. Eng. 2023, 63, 105532. [Google Scholar] [CrossRef]
- Dong, Y.; Sun, C.; Han, Y.; Liu, Q. Intelligent optimization: A novel framework to automatize multi-objective optimization of building daylighting and energy performances. J. Build. Eng. 2021, 43, 102804. [Google Scholar] [CrossRef]
- Bianchi, S.; Andriotis, C.; Klein, T.; Overend, M. Multi-criteria design methods in façade engineering: State-of-the-art and future trends. Build. Environ. 2024, 250, 111184. [Google Scholar] [CrossRef]
- Gaber, B.; Zhan, C.; Han, X.; Omar, M.; Li, G. Employing ANN for daylight and energy prediction of hot climate office buildings: A case study of new Cairo, Egypt. Archit. Eng. Des. Manag. 2023, 20, 1752–1776. [Google Scholar] [CrossRef]
- Pinto, M.C.; Crespi, G.; Dell’Anna, F.; Becchio, C. Combining energy dynamic simulation and multi-criteria analysis for supporting investment decisions on smart shading devices in office buildings. Appl. Energy 2023, 332, 120470. [Google Scholar] [CrossRef]
- Almerbati, N.; Ford, P.; Dean, L. Lionel Theodore Dean. In From Vernacular to Personalised and Sustainable; Architectural Science Association: Sydney, Australia, 2014. [Google Scholar]
- Bagasi, A.A.; Calautit, J.K.; Karban, A.S. Evaluation of the Integration of the Traditional Architectural Element Mashrabiya into the Ventilation Strategy for Buildings in Hot Climates. Energies 2021, 14, 530. [Google Scholar] [CrossRef]
- Lee, J.-Y.; Kim, S.-W.; Jeon, Y.-C. Study of the Control of Geometric Pattern Using Digital Algorithm (with Focus on Analysis and Application of the Islamic Star Pattern). Adv. Mater. Sci. Eng. 2015, 2015, 950232. [Google Scholar] [CrossRef]
- Arrow Metal. Available online: https://www.arrowmetal.com.au/ (accessed on 15 January 2025).
- McKay, M.D.; Beckman, R.J.; Conover, W.J. A Comparison of Three Methods for Selecting Values of Input Variables in the Analysis of Output from a Computer Code. Technometrics 1979, 21, 239. [Google Scholar] [CrossRef]
- Choi, Y.; Song, D.; Yoon, S.; Koo, J. Comparison of Factorial and Latin Hypercube Sampling Designs for Meta-Models of Building Heating and Cooling Loads. Energies 2021, 14, 512. [Google Scholar] [CrossRef]
- The MathWorks Inc. MATLAB, Version R2024b; The MathWorks Inc.: Natick, MA, USA, 2024.
- Rafati, N.; Hazbei, M.; Eicker, U. Louver configuration comparison in three Canadian cities utilizing NSGA-II. Build. Environ. 2023, 229, 109939. [Google Scholar] [CrossRef]
- Taherdoost, H.; Madanchian, M. Analytic Network Process (ANP) Method: A Comprehensive Review of Applications, Advantages, and Limitations. J. Data Sci. Intell. Syst. 2023, 1, 12–18. [Google Scholar] [CrossRef]
- Magableh, G.; Mistarihi, M. Applications of MCDM approach (ANP-TOPSIS) to evaluate supply chain solutions in the context of COVID-19. Heliyon 2022, 8, e09062. [Google Scholar] [CrossRef] [PubMed]
- ANSI/ASHRAE Standard 55; Thermal Environmental Conditions for Human Occupancy. American Society of Heating, Refrigerating and Air-Conditioning Engineers: Peachtree Corners, GA, USA, 2023.
- Ladybug Tools. Available online: https://www.ladybug.tools/epwmap/ (accessed on 1 October 2024).
- Li, L.; Qi, Z.; Ma, Q.; Gao, W.; Wei, X. Evolving multi-objective optimization framework for early-stage building design: Improving energy efficiency, daylighting, view quality, and thermal comfort. Build. Simul. 2024, 17, 2097–2123. [Google Scholar] [CrossRef]
- El-Agami, M.; Hanafy, G.; Osman, M. Investigating the Effect of High-Rise Buildings’ Mass Geometry on Energy Efficiency within the Climatic Variation of Egypt. Sustainability 2021, 13, 10529. [Google Scholar] [CrossRef]
- Elkhayat, Y.O.; Ibrahim, M.G.; Tokimatsu, K.; Ali, A.A.M. Multi-criteria selection of high-performance glazing systems: A case study of an office building in New Cairo, Egypt. J. Build. Eng. 2020, 32, 101466. [Google Scholar] [CrossRef]
- Kirimtat, A.; Manioğlu, G. A simulation-based performance evaluation of new generation dynamic shading devices with multi-objective optimization. J. Build. Eng. 2024, 90, 109322. [Google Scholar] [CrossRef]
- Lechner, N. Heating, Cooling, Lighting: Sustainable Design Methods for Architects, 4th ed.; J. Wiley & Sons: Hoboken, NJ, USA, 2015; ISBN 9781118582428. [Google Scholar]
- Choi, J.; Lee, T.; Ahn, E.; Piao, G. Parametric Louver Design System Based On Direct Solar Radiation Control Performance. J. Asian Archit. Build. Eng. 2014, 13, 57–62. [Google Scholar] [CrossRef]
- Toutou, A.; Fikry, M.; Mohamed, W. The parametric based optimization framework daylighting and energy performance in residential buildings in hot arid zone. Alex. Eng. J. 2018, 57, 3595–3608. [Google Scholar] [CrossRef]
- ASHRAE Standard 90.1-2019; Energy Standard for Buildings Except Low-Rise Residential Buildings. American Society of Heating, Refrigerating and Air-Conditioning Engineers, Inc: Atlanta, GA, USA, 2019.
- Nabil, A.; Mardaljevic, J. Useful daylight illuminances: A replacement for daylight factors. Energy Build. 2006, 38, 905–913. [Google Scholar] [CrossRef]
- Wu, C.; Pan, H.; Luo, Z.; Liu, C.; Huang, H. Multi-objective optimization of residential building energy consumption, daylighting, and thermal comfort based on BO-XGBoost-NSGA-II. Build. Environ. 2024, 254, 111386. [Google Scholar] [CrossRef]
- Konis, K.; Gamas, A.; Kensek, K. Passive performance and building form: An optimization framework for early-stage design support. Sol. Energy 2016, 125, 161–179. [Google Scholar] [CrossRef]
- Pilechiha, P.; Mahdavinejad, M.; Pour Rahimian, F.; Carnemolla, P.; Seyedzadeh, S. Multi-objective optimisation framework for designing office windows: Quality of view, daylight and energy efficiency. Appl. Energy 2020, 261, 114356. [Google Scholar] [CrossRef]
- Architectural Energy Corporation. Daylighting Metric Development Using Daylight Autonomy Calculations in the Sensor Placement Optimization Tool; CHPS Daylighting Committee, Daylighting Forum: Boulder, CO, USA, 2006. [Google Scholar]
- EnergyPlus. Version 9.2. Available online: https://bigladdersoftware.com/epx/docs/9-2/engineering-reference/ (accessed on 1 October 2024).
- Ayoub, M. A review on machine learning algorithms to predict daylighting inside buildings. Sol. Energy 2020, 202, 249–275. [Google Scholar] [CrossRef]
- Shi, Y. Cutting-Edge Research Topics on Multiple Criteria Decision Making, Proceedings od the 20th International Conference, MCDM 2009, Chengdu, China, 21–26 June 2009; Springer: Heidelberg, Germany, 2009; ISBN 978-3-642-02297-5. [Google Scholar]
- Omar, M.; Janada, K.; Soltan, H. FAQT: A Precise System for Welding Process Selection. Int. J. Fuzzy Syst. 2022, 24, 1605–1618. [Google Scholar] [CrossRef]
- Li, D.H.; Chau, T.C.; Wan, K.K. A review of the CIE general sky classification approaches. Renew. Sustain. Energy Rev. 2014, 31, 563–574. [Google Scholar] [CrossRef]
- Chen, W.; Li, D.H.; Li, S.; Lou, S. Predicting diffuse solar irradiance on obstructed building façades under irregular skyline patterns for various ISO/CIE standard skies. J. Build. Eng. 2021, 40, 102370. [Google Scholar] [CrossRef]
- Amorim, C.N.D.; Vasquez, N.G.; Matusiak, B.; Kanno, J.; Sokol, N.; Martyniuk-Peczek, J.; Sibilio, S.; Koga, Y.; Ciampi, G.; Waczynska, M. Lighting conditions in home office and occupant’s perception: An international study. Energy Build. 2022, 261, 111957. [Google Scholar] [CrossRef]
- Hu, Y.; Luo, M.R.; Yang, Y. A Study on Lighting Uniformity for LED Smart Lighting System. In Proceedings of the 2015 12th China International Forum on Solid State Lighting (SSLCHINA), Shenzhen, China, 2–4 November 2015; pp. 127–130, ISBN 978-1-5090-0175-0. [Google Scholar]
- Wienold, J.; Christoffersen, J. Evaluation methods and development of a new glare prediction model for daylight environments with the use of CCD cameras. Energy Build. 2006, 38, 743–757. [Google Scholar] [CrossRef]
- Radiance. Available online: https://www.radiance-online.org/learning/documentation/manual-pages/pdfs/evalglare.pdf/view (accessed on 1 October 2024).
- Qi, X.; Luo, Z.; Ghahramani, A.; Zhuang, D.; Sun, C. A study of subjective evaluation factors regarding visual effects of daylight in offices using machine learning. J. Build. Eng. 2024, 86, 108906. [Google Scholar] [CrossRef]
- Kumaragurubaran, V.; Inanici, M. Hdrscope: High Dynamic Range Image Processing Toolkit for Lighting Simulations and Analysis. In Proceedings of the BS 2013: 13th Conference of the International Building Performance Simulation Association, Chambery, France, 25–28 August 2013; pp. 3400–3407. [Google Scholar]


| Representative City | Coordinate | Climate Zone | Construction | U-Factor (W/(m2·K)) | Solar Heat Gain Coefficient |
|---|---|---|---|---|---|
| Cairo | 30°7′19.2″ N, 31°24′21.6″ E | 2B (hot dry) | Exterior wall with shading | 0.760 | N/A |
| Other walls | Adiabatic | N/A | |||
| Ground floor | 2.014 | N/A | |||
| Window | 2.57 | 0.25 | |||
| Riyadh | 24.7136° N, 46.6753° E | 1B (very hot dry) | Exterior wall with shading | 1.636 | N/A |
| Other walls | Adiabatic | N/A | |||
| Ground floor | 2.014 | N/A | |||
| Window | 2.85 | 0.23 | |||
| Kuching | 1.5534° N, 110.3595° E | 1A (Very hot humid) | Exterior wall with shading | 1.636 | N/A |
| Other walls | Adiabatic | N/A | |||
| Ground floor | 2.014 | N/A | |||
| Window | 2.85 | 0.23 |
| Fins | PSS | Building Material Optical Properties | ||||||
|---|---|---|---|---|---|---|---|---|
| Parameter | Range | Parameter | Range | |||||
| Minimum | Maximum | Construction | Value | |||||
| Minimum | Maximum | |||||||
| Room Depth | 4 m | 6 m | Room depth | 4 m | 6 m | Ceiling | reflectance | 70% |
| Depth | 0.2 m | 0.4 m | Pattern depth | 0.2 m | 0.4 m | Floor | reflectance | 20% |
| Angle | 45° | −45° | Point coordinate (x) | 0.1 m | 1 m | Roof | reflectance | 20% |
| Distance between | 0.2 m | 0.4 m | Point coordinate (y) | 0.1 m | 1 m | Wall | reflectance | 50% |
| Count | 5 | 10 | Window | reflectance | 0.6 | |||
| Case | Metric | Regression Model | MSE | R2 | Case | Metric | Regression Model | MSE | R2 |
|---|---|---|---|---|---|---|---|---|---|
| Fins Cairo South | ASE | ANN | 1.4 | 0.98 | Fins Cairo West | ASE | SVM | 0.17 | 0.85 |
| CDA | ANN | 0.03 | 0.99 | CDA | Ensemble | 0.03 | 0.97 | ||
| EUI | SVM | 1.8 | 0.95 | EUI | ANN | 1.57 | 0.98 | ||
| SG | Ensemble | 1.5 | 0.94 | SG | Ensemble | 1.6 | 0.93 | ||
| UDI | ANN | 0.04 | 0.99 | UDI | Ensemble | 0.04 | 0.99 | ||
| PSS Cairo South | ASE | Ensemble | 1.6 | 0.99 | PSS Cairo West | ASE | Ensemble | 1.22 | 0.99 |
| CDA | Ensemble | 0.035 | 0.98 | CDA | Ensemble | 0.04 | 0.97 | ||
| EUI | Ensemble | 1.14 | 0.98 | EUI | Ensemble | 1.25 | 0.99 | ||
| SG | SVM | 0.005 | 0.05 | SG | Ensemble | 0.005 | 0.99 | ||
| UDI | Ensemble | 0.05 | 0.99 | UDI | Ensemble | 0.024 | 0.99 | ||
| Fins Kuching South | ASE | Ensemble | 1.29 | 0.99 | Fins Kuching West | ASE | ANN | 1.8 | 0.97 |
| CDA | SVM | 0.037 | 0.97 | CDA | SVM | 0.037 | 0.99 | ||
| EUI | Ensemble | 1.5 | 0.8 | EUI | SVM | 1.4 | 0.92 | ||
| SG | Ensemble | 1.02 | 0.83 | SG | Ensemble | 1.4 | 0.91 | ||
| UDI | ANN | 0.041 | 0.94 | UDI | ANN | 0.041 | 0.99 | ||
| PSS Kuching South | ASE | Ensemble | 0.85 | 0.96 | PSS Kuching West | ASE | Ensemble | 1.13 | 0.99 |
| CDA | SVM | 0.037 | 0.99 | CDA | ANN | 0.037 | 0.99 | ||
| EUI | ANN | 1.8 | 0.99 | EUI | ANN | 1.7 | 0.88 | ||
| SG | Ensemble | 1.09 | 0.99 | SG | Ensemble | 1.9 | 0.99 | ||
| UDI | ANN | 0.041 | 0.99 | UDI | Ensemble | 0.04 | 0.99 | ||
| Fins Riyadh South | ASE | ANN | 1.23 | 0.98 | Fins Riyadh West | ASE | Ensemble | 1.5 | 0.86 |
| CDA | ANN | 0.003 | 0.96 | CDA | ANN | 0.37 | 0.91 | ||
| EUI | ANN | 1.6 | 0.98 | EUI | ANN | 1.2 | 0.94 | ||
| SG | Ensemble | 1.13 | 0.93 | SG | Ensemble | 1.6 | 0.81 | ||
| UDI | ANN | 0.07 | 0.99 | UDI | ANN | 0.5 | 0.93 | ||
| PSS Riyadh South | ASE | Ensemble | 1.2 | 0.99 | PSS Riyadh West | ASE | Ensemble | 1.8 | 0.99 |
| CDA | SVM | 0.08 | 0.98 | CDA | SVM | 0.04 | 0.98 | ||
| EUI | SVM | 0.06 | 0.99 | EUI | SVM | 0.27 | 0.99 | ||
| SG | Ensemble | 1.7 | 0.99 | SG | Ensemble | 1.6 | 0.99 | ||
| UDI | ANN | 0.026 | 0.99 | UDI | ANN | 0.028 | 0.99 |
Disclaimer/Publisher’s Note: The statements, opinions and data contained in all publications are solely those of the individual author(s) and contributor(s) and not of MDPI and/or the editor(s). MDPI and/or the editor(s) disclaim responsibility for any injury to people or property resulting from any ideas, methods, instructions or products referred to in the content. |
© 2025 by the authors. Licensee MDPI, Basel, Switzerland. This article is an open access article distributed under the terms and conditions of the Creative Commons Attribution (CC BY) license (https://creativecommons.org/licenses/by/4.0/).
Share and Cite
Gaber, B.; Zhan, C.; Han, X.; Omar, M.; Li, G. Enhancing Daylight and Energy Efficiency in Hot Climate Regions with a Perforated Shading System Using a Hybrid Approach Considering Different Case Studies. Buildings 2025, 15, 988. https://doi.org/10.3390/buildings15060988
Gaber B, Zhan C, Han X, Omar M, Li G. Enhancing Daylight and Energy Efficiency in Hot Climate Regions with a Perforated Shading System Using a Hybrid Approach Considering Different Case Studies. Buildings. 2025; 15(6):988. https://doi.org/10.3390/buildings15060988
Chicago/Turabian StyleGaber, Basma, Changhong Zhan, Xueying Han, Mohamed Omar, and Guanghao Li. 2025. "Enhancing Daylight and Energy Efficiency in Hot Climate Regions with a Perforated Shading System Using a Hybrid Approach Considering Different Case Studies" Buildings 15, no. 6: 988. https://doi.org/10.3390/buildings15060988
APA StyleGaber, B., Zhan, C., Han, X., Omar, M., & Li, G. (2025). Enhancing Daylight and Energy Efficiency in Hot Climate Regions with a Perforated Shading System Using a Hybrid Approach Considering Different Case Studies. Buildings, 15(6), 988. https://doi.org/10.3390/buildings15060988