
Analysis of the Influence Structure Between Design Factors and Heat Source Equipment Capacity: A Case Study on Office Building Design with a Central Heat Source System in Warm Regions of Japan


Abstract
1. Introduction
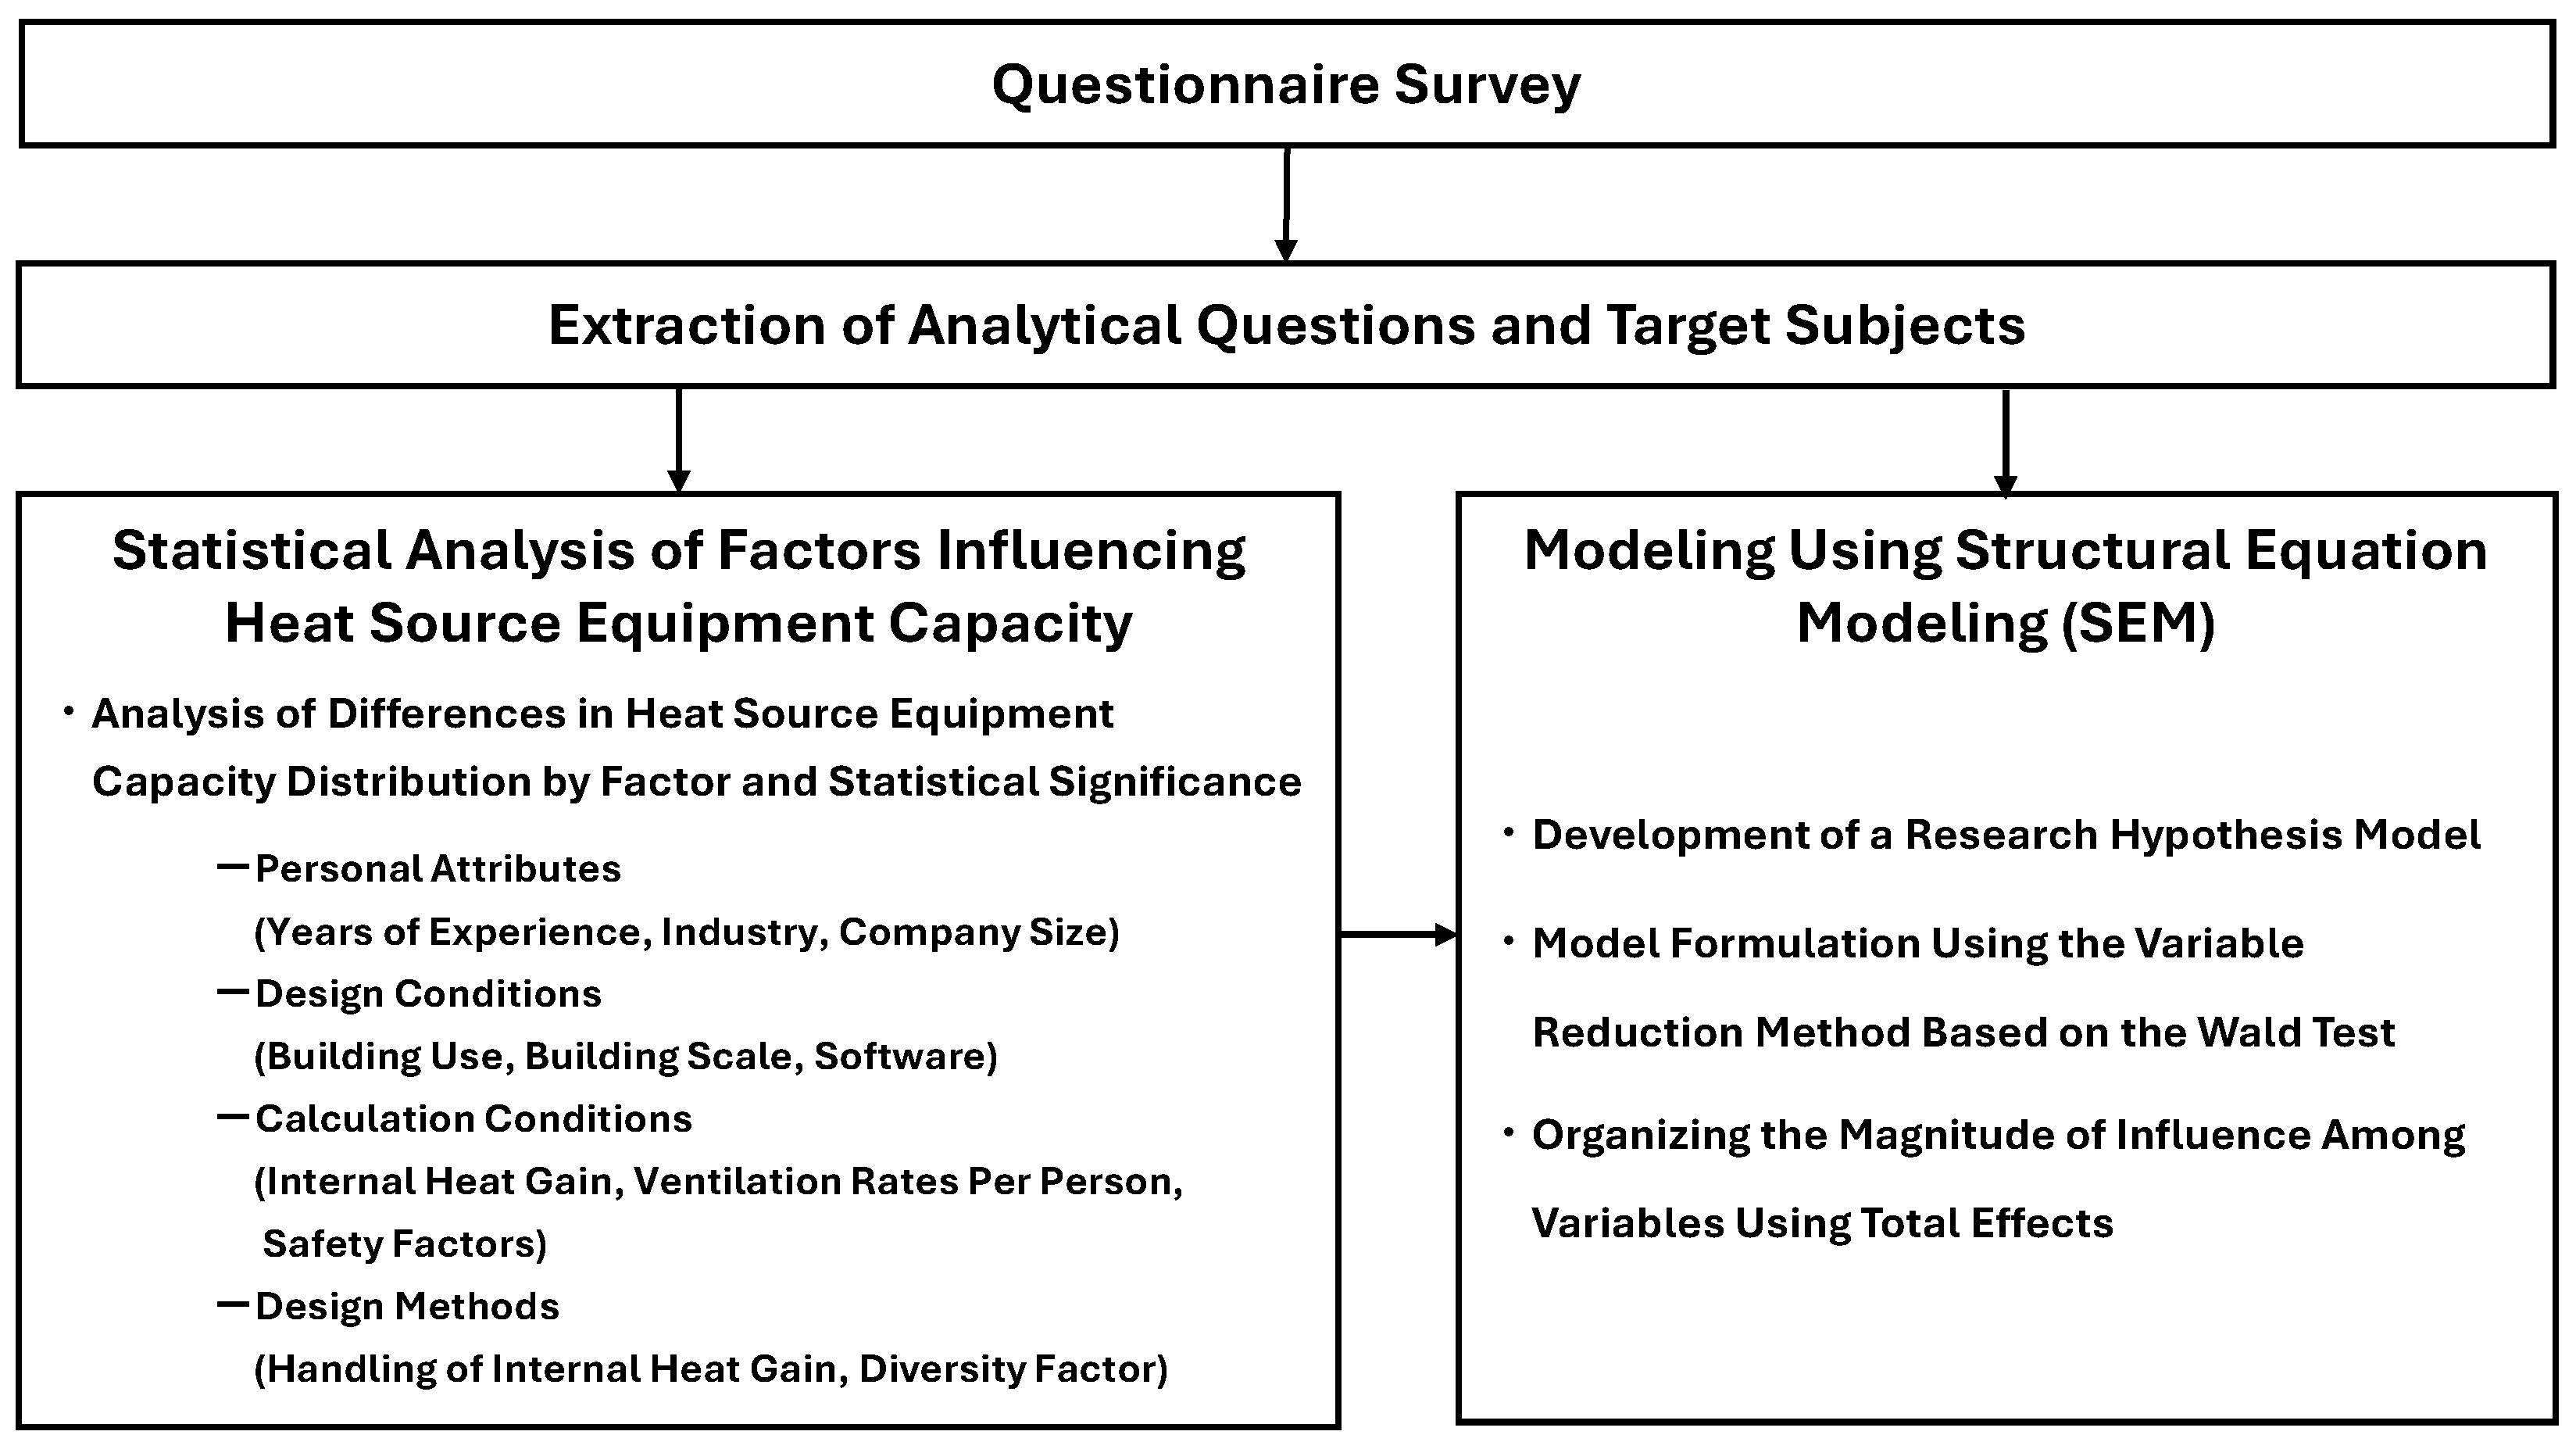
2. Research Flow
3. Material and Methods
3.1. Questionnaires
3.2. Extraction of Analytical Question and Target Subjection, and Statistical Analysis
4. Result
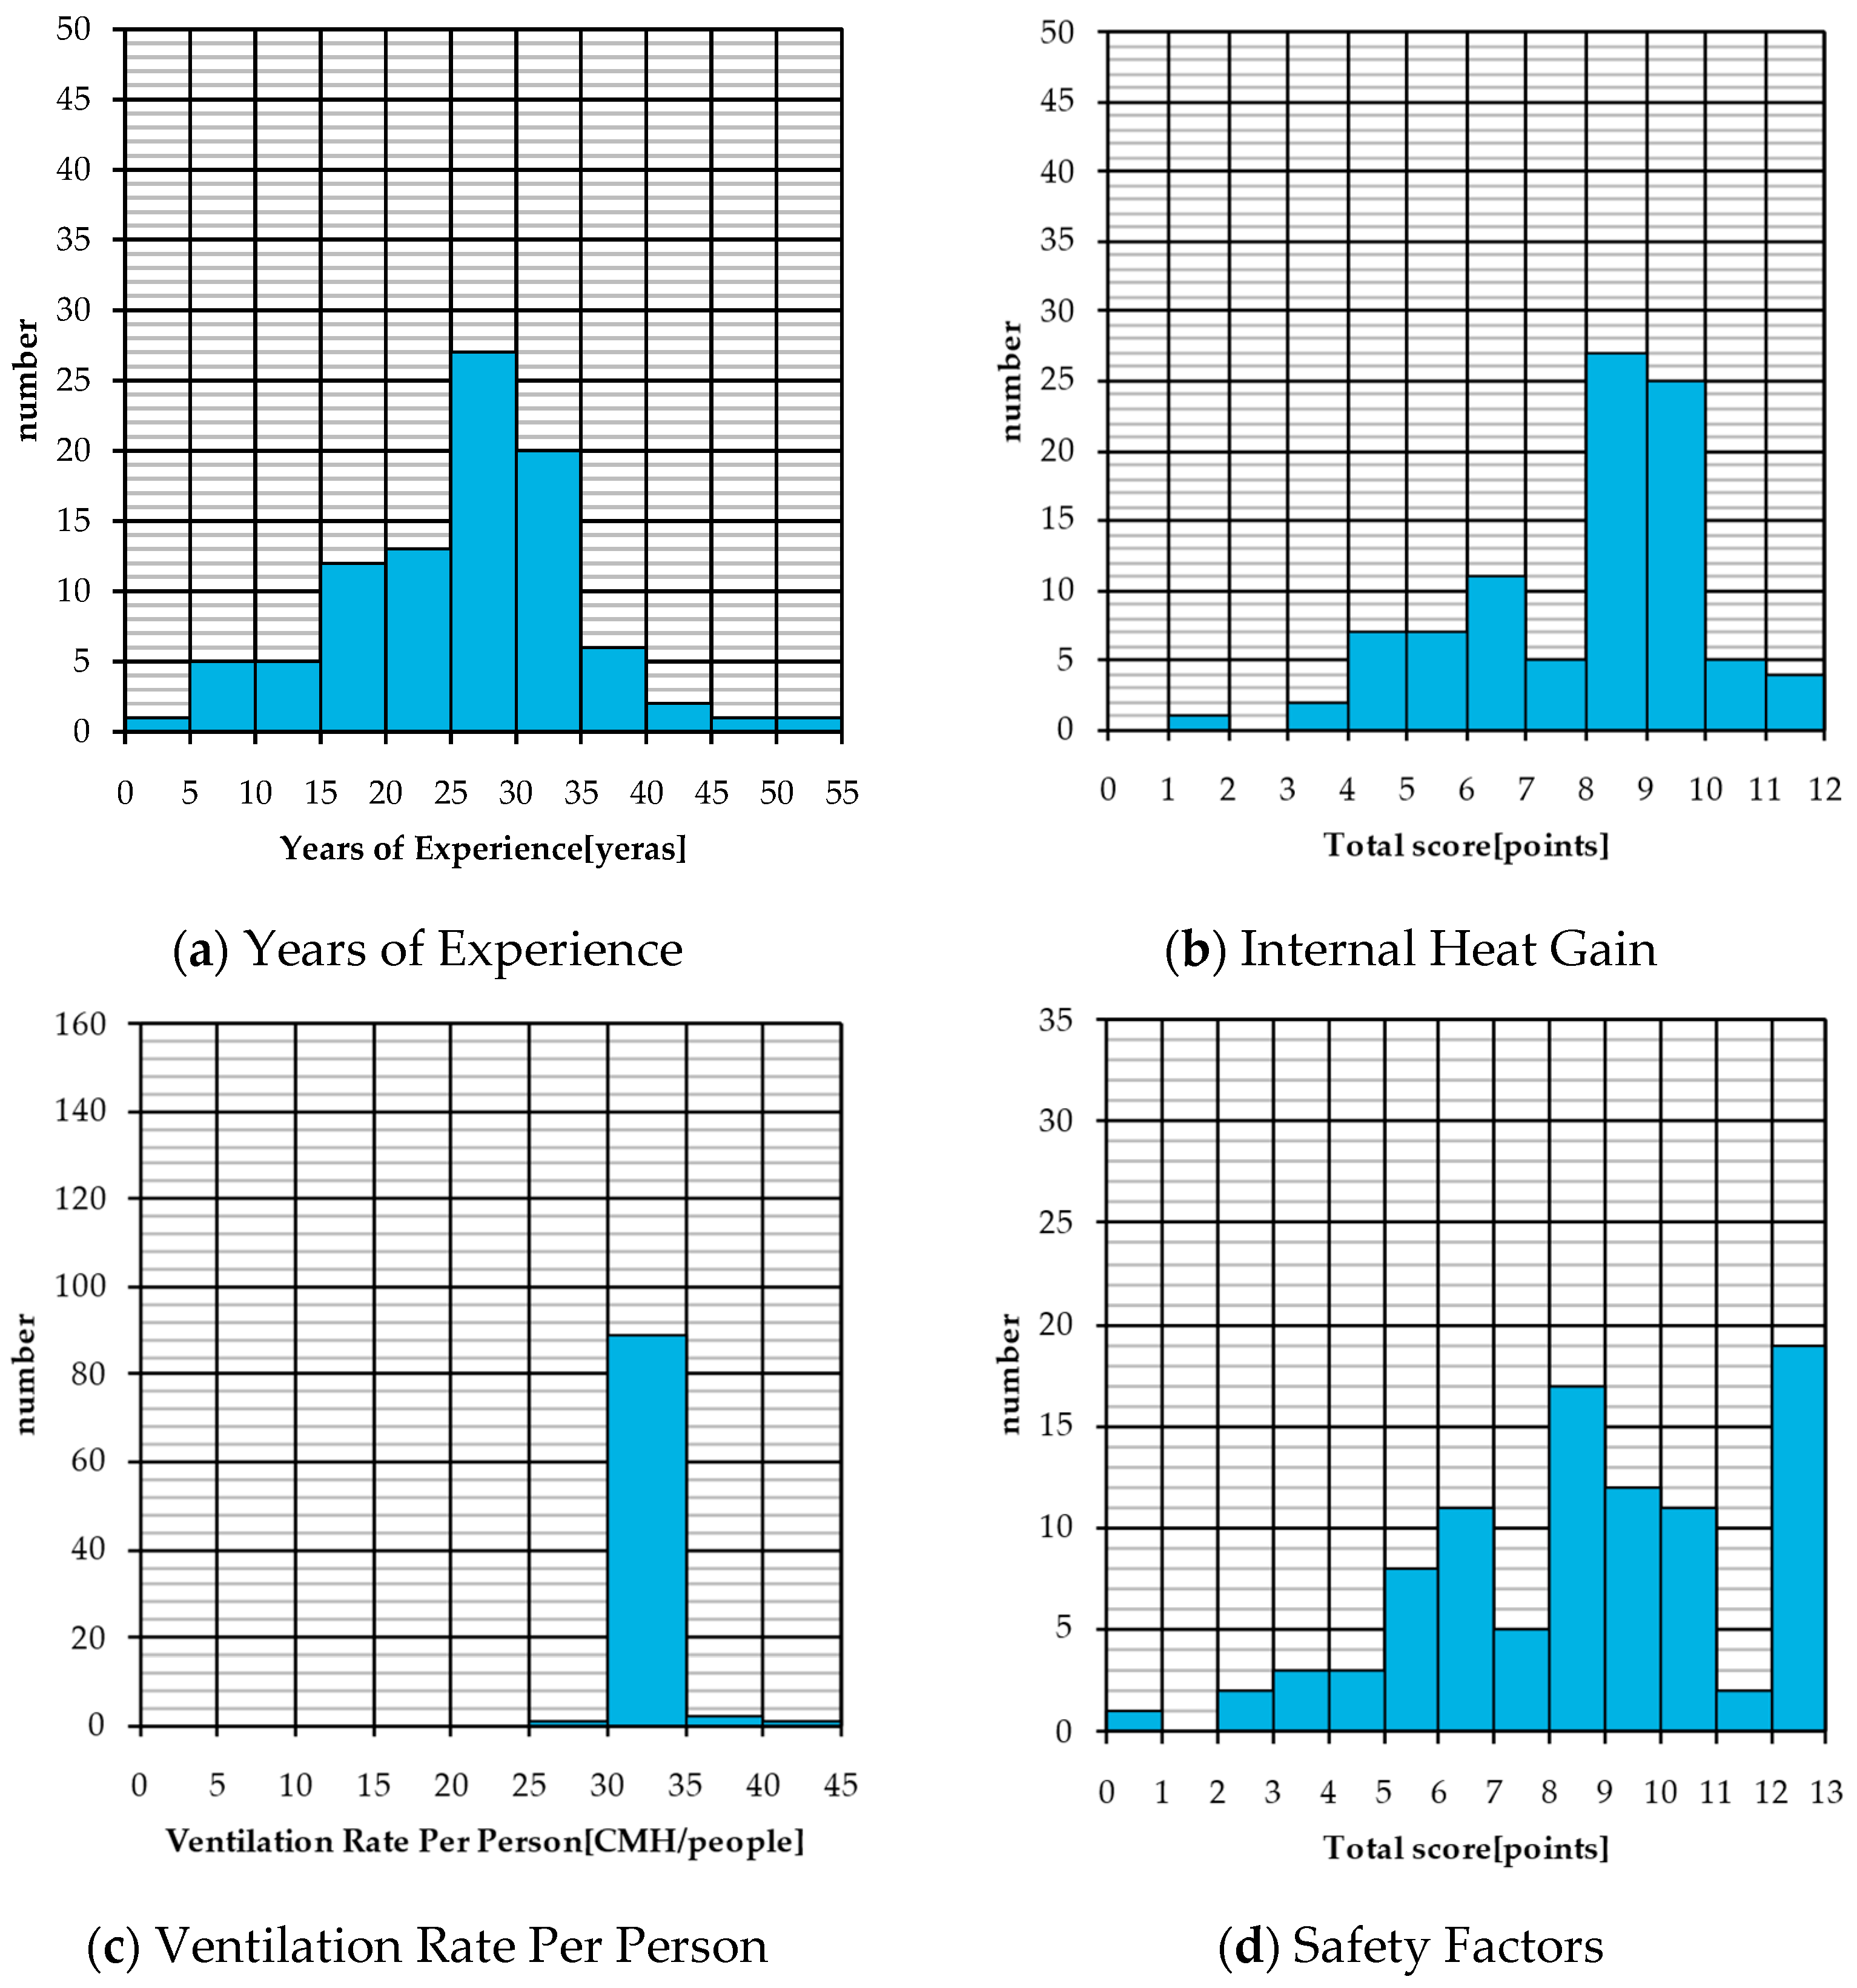
4.1. Respondent Attributes
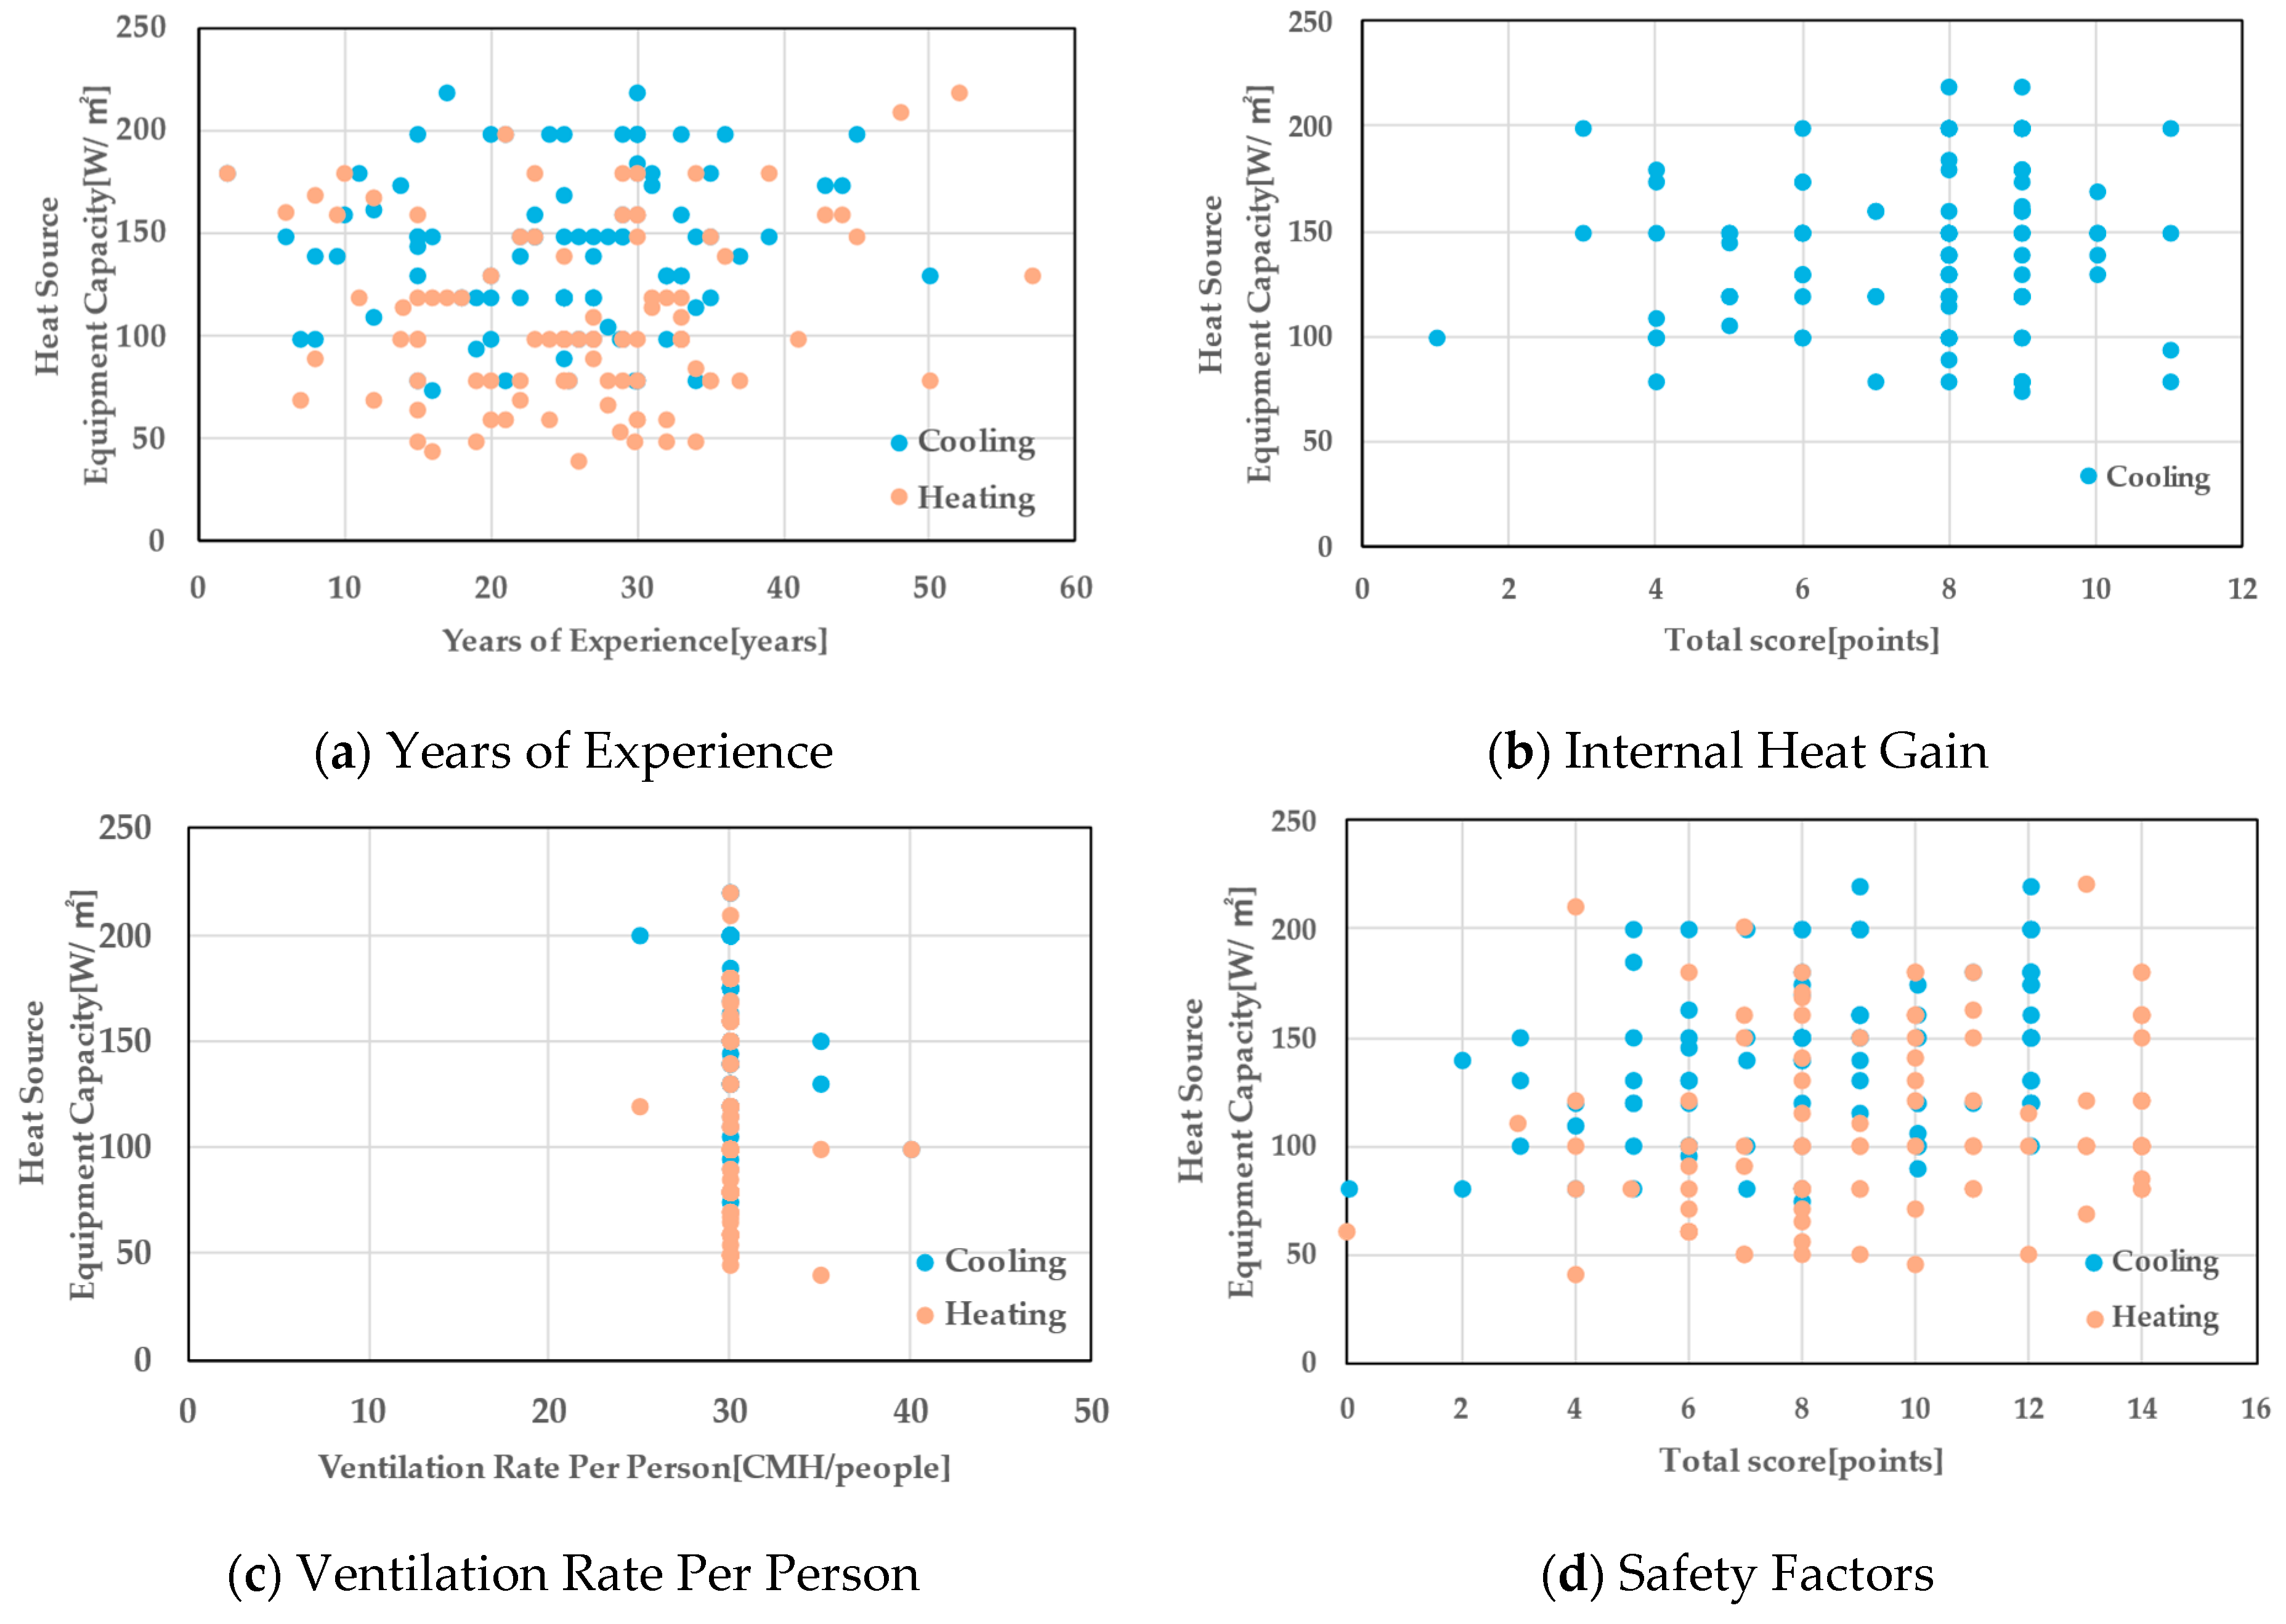
4.2. Statistical Analysis Results for Heat Source Equipment Capacity
4.3. Integration of Various Factors by SEM
4.3.1. Multiple Indicator Modeling
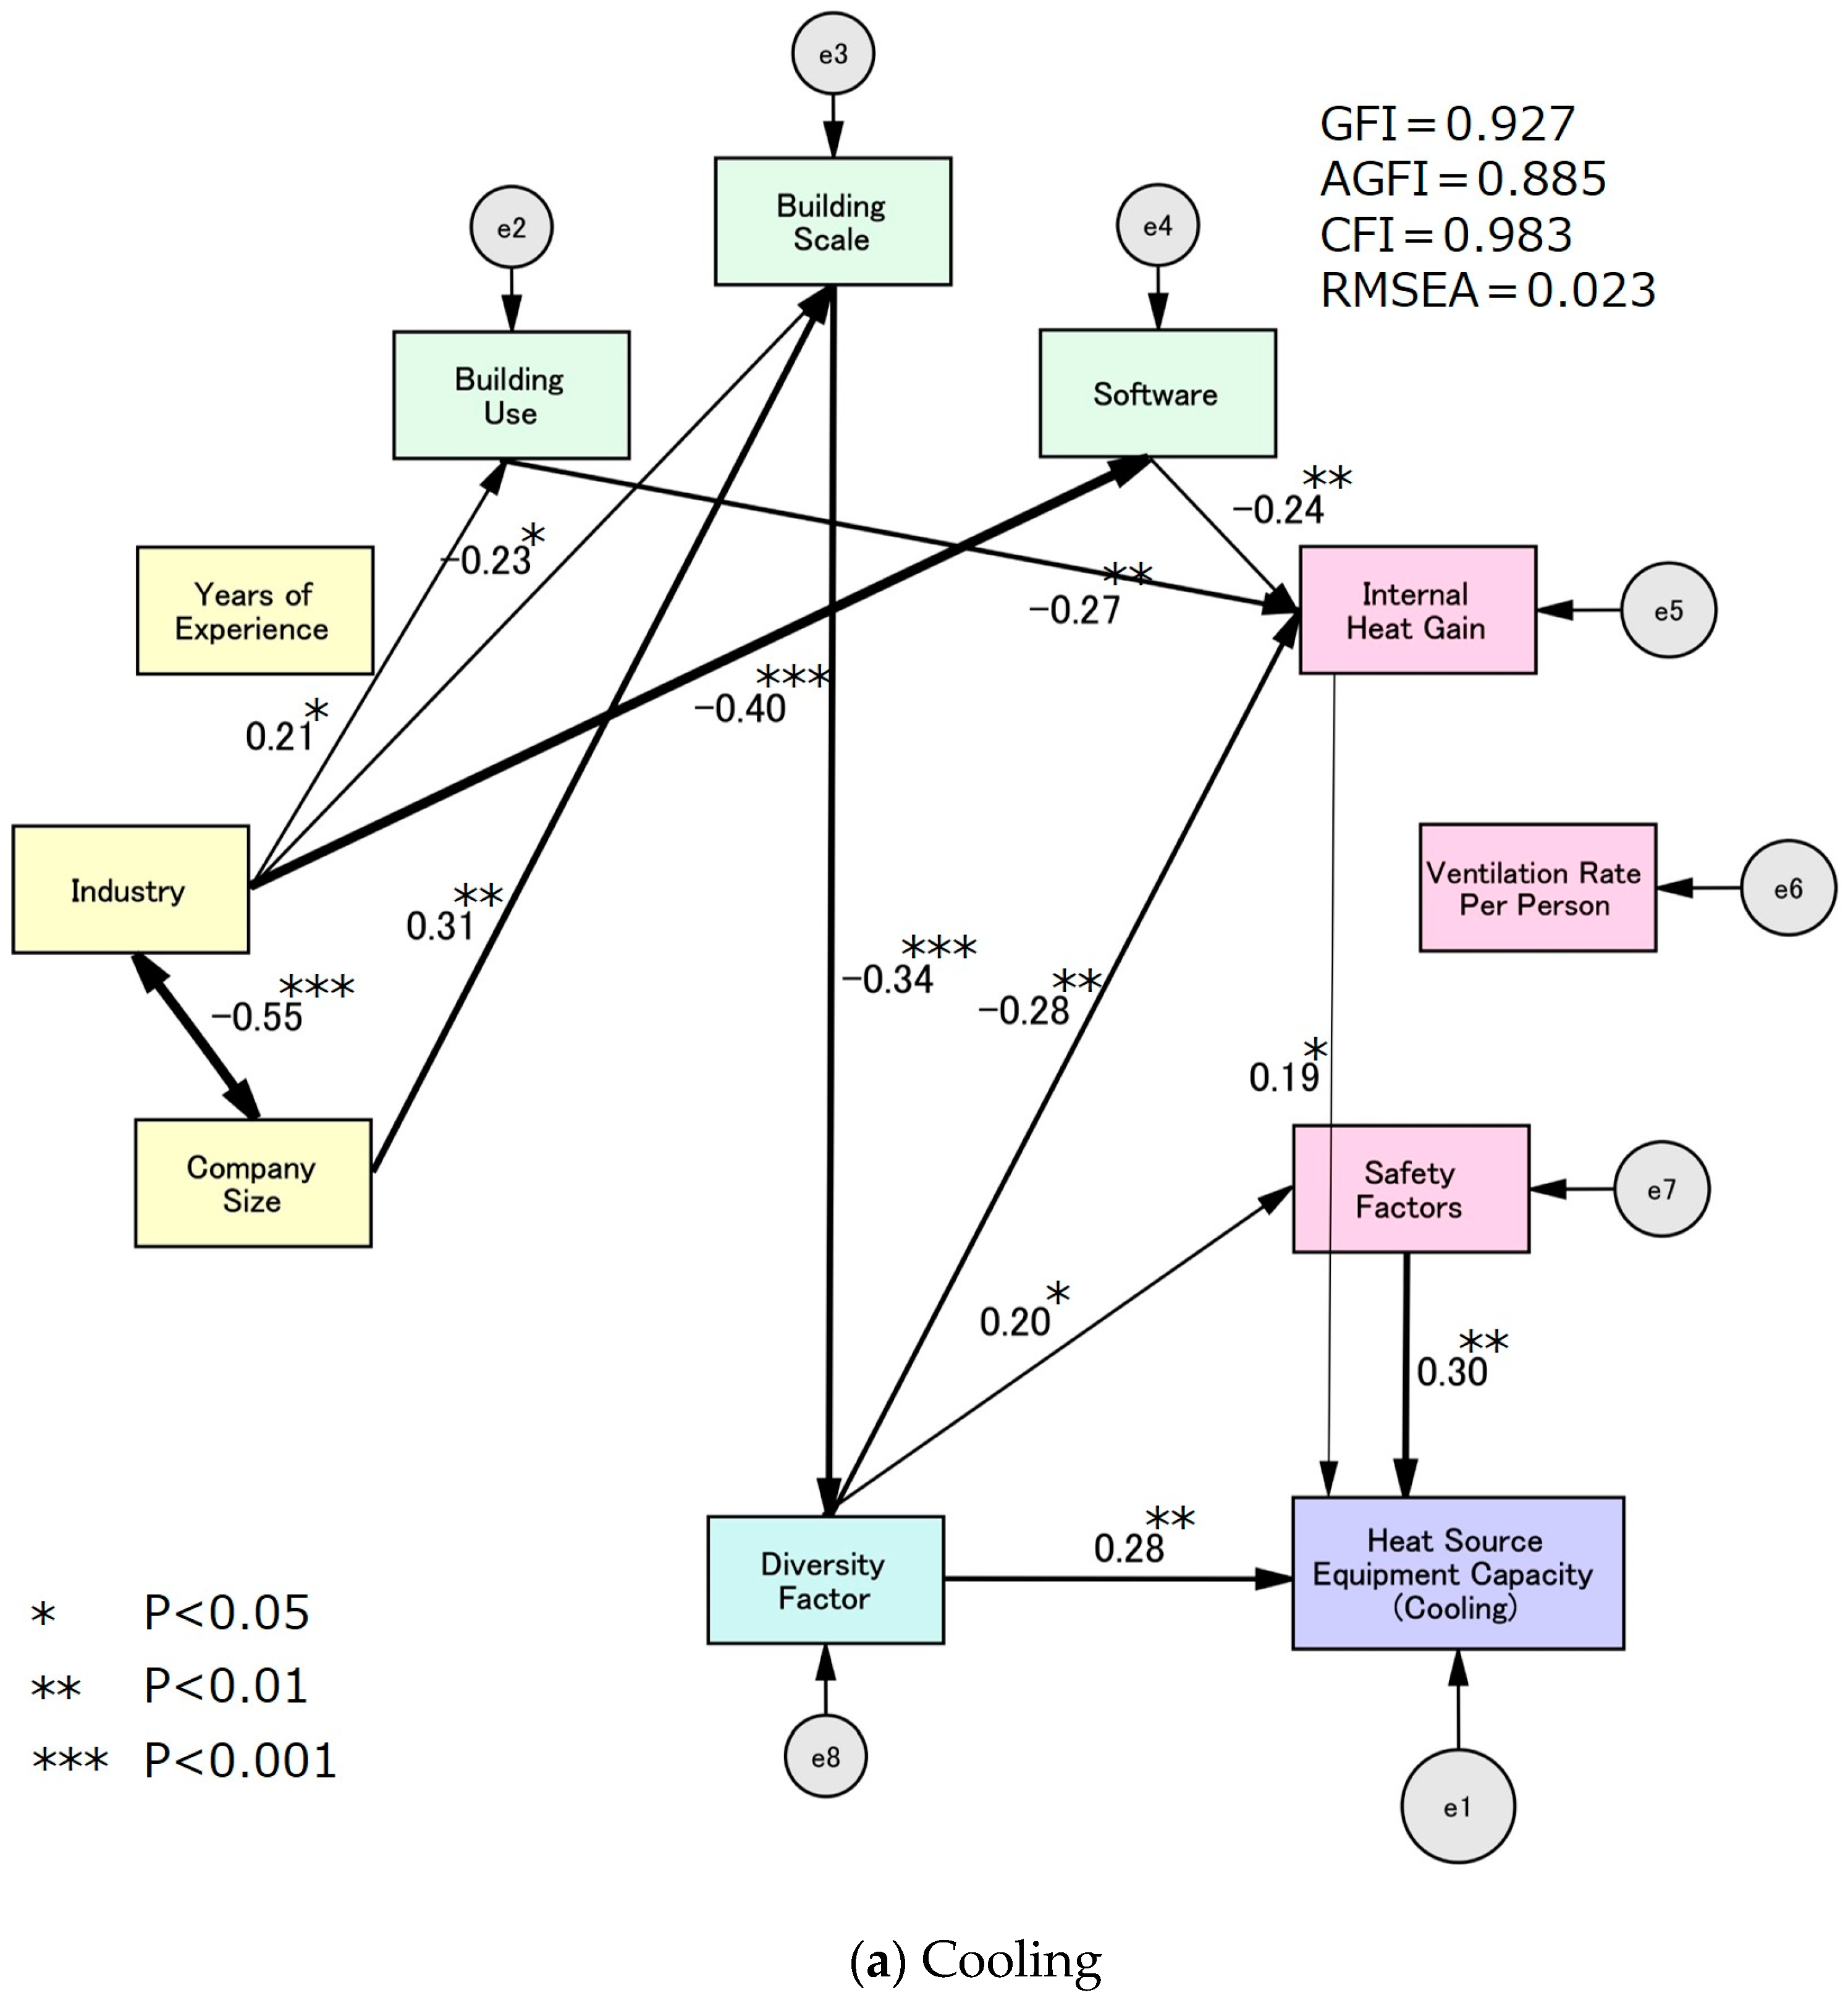
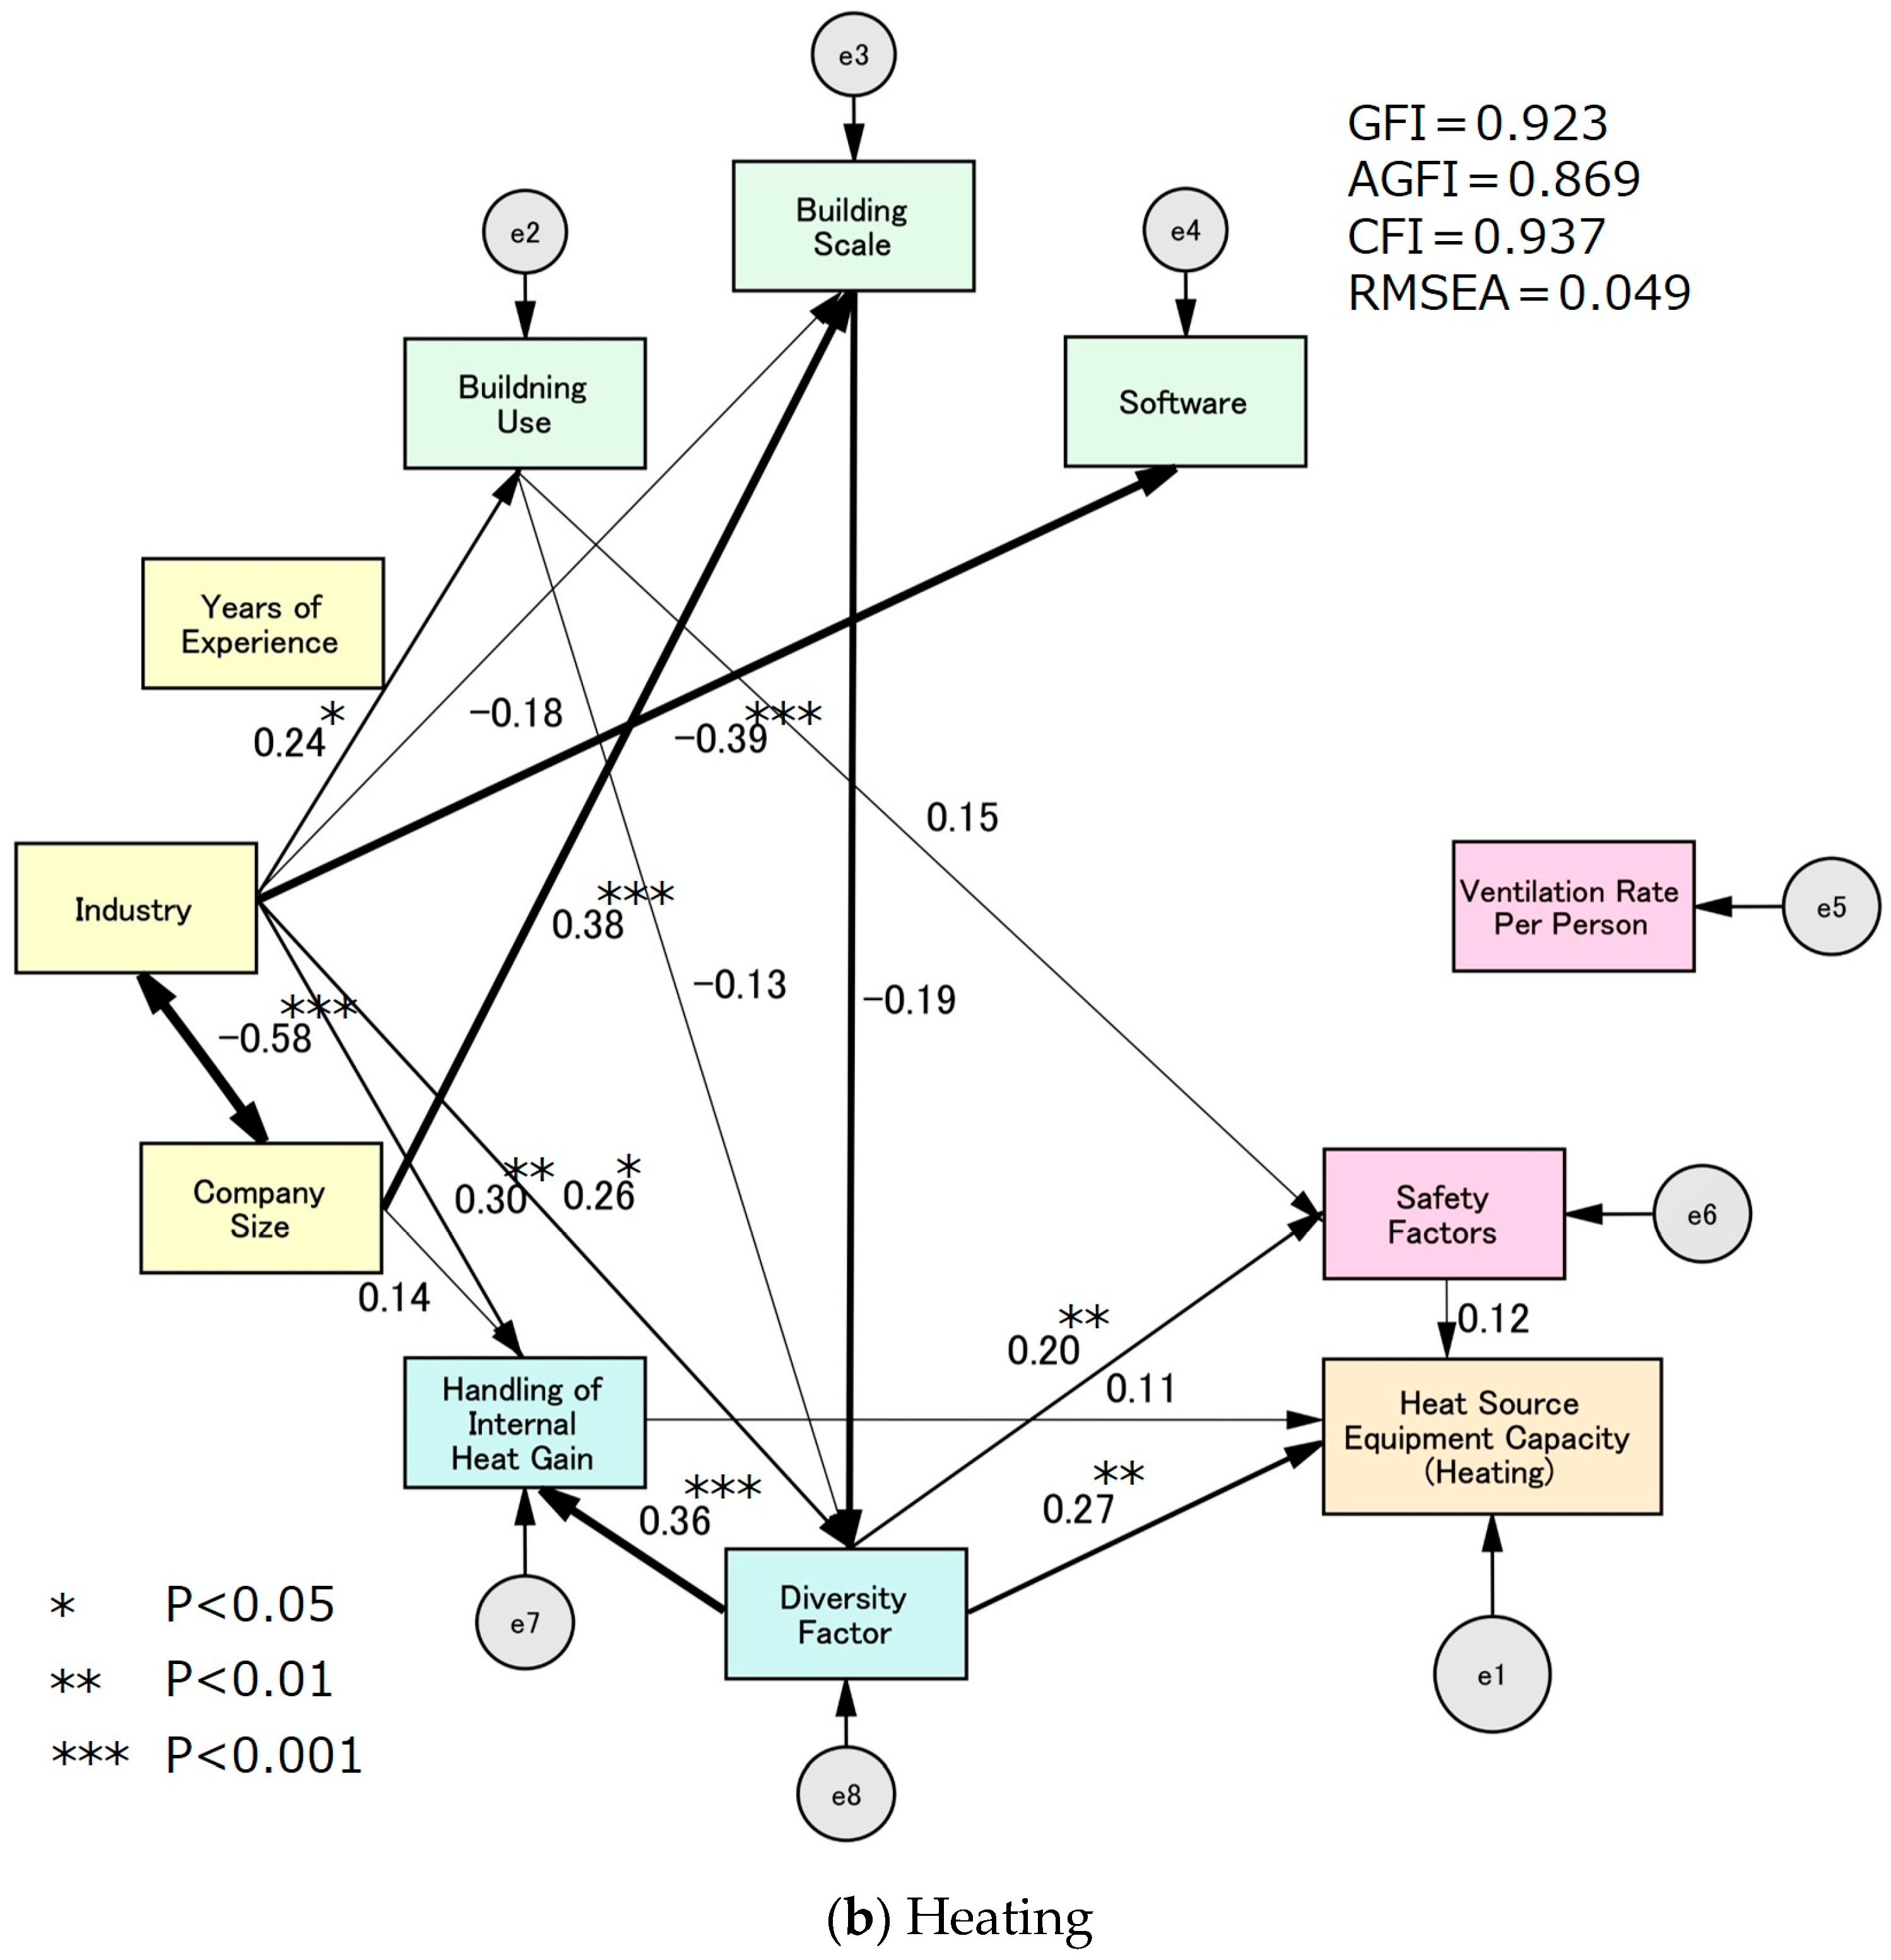
4.3.2. Path Analysis
| A relatively large impact | (|Total Effect| ≥ 0.200) |
| A little impact | (0.100 ≤ |Total Effect| < 0.200) |
| A slight impact | (0.050 ≤ |Total Effect| < 0.100) |
| Not particularly effective | (|Total Effect| < 0.050). |
5. Discussion
5.1. Total Effect of Each Design Factor on Heast Source Equipment Capacity
- A lower internal heat gain setting leads to a smaller heat source equipment capacity.
- A smaller safety factor setting results in a smaller heat source equipment capacity.
- Considering internal heat gain in heating load calculations reduces heat source equipment capacity.
- Incorporating the diversity factor into the design leads to a smaller heat source equipment capacity.
5.2. Total Effect of Personal Attribute, Design Conditions and Calculation Conditions on Design Methods
- General Contractors and Architectural Firms tend to consider internal heat gain in heating load calculations more than Mechanical and Electrical Contractors and Mechanical and Electrical Design Firms.
- The larger the building scale, the more likely the diversity factor is incorporated into the design.
5.3. Total Effect of Personal Attribute, Design Conditions, and Design Methods on Calculation Conditions
- Public buildings tend to have lower internal heat gain settings compared to private buildings.
- Designers using software that does not comply with Building Equipment Design Standards tend to set lower internal heat gain values.
- Designers who consider the diversity factor tend to set higher internal heat gain values.
- Designers who consider the diversity factor tend to set lower safety factors.
5.4. Total Effect of Personal Attributes on Design Conditions
- General Contractors and Architectural Firms handle larger-scale buildings, more private-sector projects, and tend to use software that does not comply with Building Equipment Design Standards, compared to Mechanical and Electrical Contractors and Mechanical and Electrical Design Firms.
- The larger the company size, the larger the building scale.
6. Limitation
7. Conclusions
- (1)
- It was clarified that considering the diversity factor is the most effective approach for optimizing heat source equipment capacity. By incorporating the diversity factor, the median capacity of cooling equipment can be reduced by 20%, while heating equipment capacity can be reduced by 33%. Additionally, the consideration of the diversity factor is significantly influenced by building scale, which varies depending on industry and company size.
- (2)
- It was demonstrated that accounting for internal heat gain in heating load calculations can reduce heating equipment capacity by 20%. Furthermore, industry and company size influence the handling of internal heat gain, leading to different approaches depending on these factors.
- (3)
- Internal heat gain and safety factors impact heat source equipment capacity, indicating that appropriate design based on actual building usage conditions is effective in optimizing heat source equipment capacity. Moreover, the intended building use (private or public) and software used for design influence internal heat gain, and these factors, in turn, vary depending on industry and company size.
Author Contributions
Funding
Data Availability Statement
Acknowledgments
Conflicts of Interest
References
- Global Status Report for Buildings and Construction. Available online: https://wedocs.unep.org/bitstream/handle/20.500.11822/45095/global_status_report_buildings_construction_2023.pdf?sequence=3&isAllowed=y (accessed on 6 November 2024).
- The Breakthrough Agenda Report 2024. Available online: https://www.iea.org/reports/breakthrough-agenda-report-2024 (accessed on 6 November 2024).
- Directive (EU) 2024/1275 of the European Parliament and of the Council of 24 April 2024 on the Energy Performance of Buildings (RECAST) (Text with EEA Relevance). Available online: http://data.europa.eu/eli/dir/2024/1275/oj (accessed on 6 November 2024).
- 2022 California Green Building Standards Code, Title 24, Part11 (CAL Green). Available online: https://codes.iccsafe.org/content/CAGBC2022P1 (accessed on 6 November 2024).
- Ministry of Economy, Trade and Industry. The Sixth Strategic Energy Plan. 21 October 2021. Available online: https://www.enecho.meti.go.jp/category/others/basic_plan/pdf/strategic_energy_plan.pdf (accessed on 19 October 2024).
- Awadh, O. Sustainability and green building rating systems: LEED, BREEAM, GSAS and Estidama critical analysis. J. Build. Eng. 2017, 11, 25–29. [Google Scholar] [CrossRef]
- Raising Energy Conservation Standards for Large Nonresidential Buildings. Available online: https://www.meti.go.jp/shingikai/enecho/shoene_shinene/sho_energy/kenchikubutsu_energy/pdf/016_05_00.pdf (accessed on 19 October 2024). (In Japanese).
- Djunaedy, E.; Van Den Wymelenberg, K.; Acker, B.; Thimmana, H. Oversizing of HVAC system: Signatures and penalties. Energy Build. 2011, 43, 468–475. [Google Scholar] [CrossRef]
- Kim, H.; Park, K.-s.; Kim, H.-y.; Song, Y.-h. A Study on the Changes in the Heat Source Capacity and Air-Conditioning Load due to Retrofit; Focusing on a Large Office Building in Korea. Energy 2019, 12, 835. [Google Scholar] [CrossRef]
- Wang, Y.H.; Zou, Z.H.; Lu, K.; Li, Q.; Hu, P.F.; Wang, D. Modeling for on-line monitoring of carbon burnout coefficient in boiler under partial load. Energy 2024, 288, 129859. [Google Scholar] [CrossRef]
- Gang, W.; Wang, S.; Shan, K.; Gao, D. Impacts of cooling load calculation uncertainties on the design optimization of building cooling systems. Energy Build. 2015, 94, 1–9. [Google Scholar] [CrossRef]
- Hao, Z.; Xie, J.; Zhang, X.; Liu, J. Simplified Model of Heat Load Prediction and Its Application in Estimation of Building Envelope Thermal Performance. Buildings 2023, 13, 1076. [Google Scholar] [CrossRef]
- Capozzoli, A.; Piscitelli, M.S.; Gorrino, A.; Ballarini, I.; Corrado, V. Data analytics for occupancy pattern learning to reduce the energy consumption of HVAC systems in office buildings. Sustain. Cities Soc. 2017, 35, 191–208. [Google Scholar] [CrossRef]
- Kialashaki, Y. Energy and economic analysis of model-based air dampers strategies on a VAV system. Int. J. Environ. Sci. Technol. 2018, 16, 4687–4696. [Google Scholar] [CrossRef]
- Alavy, M.; Li, T.; Siegel, J.A. Energy use in residential buildings: Analyses of high-efficiency filters and HVAC fans. Energy Build. 2020, 209, 109697. [Google Scholar] [CrossRef]
- Shamim, J.A.; Hsu, W.-L.; Paul, S.; Yu, L.; Daiguji, H. A review of solid desiccant dehumidifiers: Current status and near-term development goals in the context of net zero energy buildings. Renew. Sustain. Energy Rev. 2021, 137, 110456. [Google Scholar] [CrossRef]
- Wang, Y.W.; Cai, W.J.; Soh, Y.C.; Li, S.J.; Lu, L.; Xie, L. A simplified modeling of cooling coils for control and optimization of HVAC systems. Energy Convers. Manag. 2004, 45, 2915–2930. [Google Scholar] [CrossRef]
- Yildiz, A.; Ersöz, M.A. The effect of wind speed on the economical optimum insulation thickness for HVAC duct applications. Renew. Sustain. Energy Rev. 2016, 55, 1289–1300. [Google Scholar] [CrossRef]
- Tien, P.W.; Wei, S.; Calautit, J. A Computer Vision-Based Occupancy and Equipment Usage Detection Approach for Reducing Building Energy Demand. Energies 2021, 14, 156. [Google Scholar] [CrossRef]
- Tavakoli, S.; Loengbudnark, W.; Eklund, M.; Voinov, A.; Khalilpour, K. Impact of COVID-19 Pandemic on Energy Consumption in Office Buildings: A Case Study of an Australian University Campus. Sustainability 2023, 15, 4240. [Google Scholar] [CrossRef]
- Duarte, C.C.; Cortiços, N.D. The Energy Efficiency Post-COVID-19 in China’s Office Buildings. Clean Technol. 2022, 4, 174–233. [Google Scholar] [CrossRef]
- Kim, H.; Park, K.-s.; Kim, H.-y.; Song, Y.-h. Study on Variation of Internal Heat Gain in Office Buildings by Chronology. Energies 2018, 11, 1013. [Google Scholar] [CrossRef]
- Carlander, J.; Moshfegh, B.; Akander, J.; Karlsson, F. Effects on Energy Demand in an Office Building Considering Location, Orientation, Façade Design and Internal Heat Gains—A Parametric Study. Energies 2020, 13, 6170. [Google Scholar] [CrossRef]
- Urayama, S.; Akashi, Y.; Sumiyoshi, D.; Imai, S. A Study on the Allowance for Equipment Capacity in Air Conditioning System Design. Society of Heating; Air-Conditioning and Sanitary Engineers of Japan: Sapporo, Japan, 2012; pp. 2465–2468, (In Japanese). [Google Scholar] [CrossRef]
- Lapinskienė, V.; Motuzienė, V.; Džiugaitė-Tumėnienė, R.; Mikučionienė, R. Impact of Internal Heat Gains on Building’s Energy Performance. In Proceedings of the “Environmental Engineering” 10th International Conference, Vilnius, Lithuania, 27–28 April 2017. [Google Scholar] [CrossRef]
- Jenkins, D.P. The importance of office internal heat gains in reducing cooling loads in a changing climate. Int. J. Low-Carbon Technol. 2009, 4, 134–140. [Google Scholar] [CrossRef]
- Kikuta, K.; Abe, Y. A Simultaneous Usage Ratio Based on Occupant Behavior: A Case Study of Intermittent Heating in an Apartment Building in Japan. Buildings 2024, 14, 1518. [Google Scholar] [CrossRef]
- Yılmaz, İ.C.; Yılmaz, D.; Kandemir, O.; Tekin, H.; Atabay, Ş.; Bulut Karaca, Ü. Barriers to BIM Implementation in the HVAC Industry: An Exploratory Study. Buildings 2024, 14, 788. [Google Scholar] [CrossRef]
- Asim, N.; Badiei, M.; Mohammad, M.; Razali, H.; Rajabi, A.; Chin Haw, L.; Jameelah Ghazali, M. Sustainability of Heating, Ventilation and Air-Conditioning (HVAC) Systems in Buildings—An Overview. Int. J. Environ. Res. Public Heal 2022, 19, 1016. [Google Scholar] [CrossRef] [PubMed]
- Papadakis, N.; Katsaprakakis, D.A. A Review of Energy Efficiency Interventions in Public Buildings. Energies 2023, 16, 6329. [Google Scholar] [CrossRef]
- Munguia, N.; Esquer, J.; Guzman, H.; Herrera, J.; Gutierrez-Ruelas, J.; Velazquez, L. Energy Efficiency in Public Buildings: A Step toward the UN 2030 Agenda for Sustainable Development. Sustainability 2020, 12, 1212. [Google Scholar] [CrossRef]
- Abdel-Tawab, M.; Kineber, A.F.; Chileshe, N.; Abanda, H.; Ali, A.H.; Almukhtar, A. Building Information Modelling Implementation Model for Sustainable Building Projects in Developing Countries: A PLS-SEM Approach. Sustainability. 2023, 15, 9242. [Google Scholar] [CrossRef]
- Mardani, A.; Streimikiene, D.; Zavadskas, E.K.; Cavallaro, F.; Nilashi, M.; Jusoh, A.; Zare, H. Application of Structural Equation Modeling (SEM) to Solve Environmental Sustainability Problems: A Comprehensive Review and Meta-Analysis. Sustainability 2017, 9, 1814. [Google Scholar] [CrossRef]
- Ministry of Land, Infrastructure, Transport and Tourism, Bureau of Facilities and Environment, Supervising Editor. Building Equipment Design Standards, 2024 ed.; Public Buildings Association: Tokyo, Japan, 2024.
- Overview of New Area Classification. Available online: https://www.mlit.go.jp/jutakukentiku/house/content/001345409.pdf (accessed on 10 October 2024). (In Japanese)
- SHASE. Design Maximum Heat Load Calculation Method; The Society of Heating, Air-Conditioning and Sanitary Engineers of Japan: Tokyo, Japan, 1999. (In Japanese) [Google Scholar]
- Ishino, H.; Kohri, K.; Satoh, M.; Yagawa, A.; Aizawa, N.; Ishitani, N.; Edahiro, K.; Ohga, H.; Kikuta, K.; Konoshita, S.; et al. Research on Simplified Calculation Methods of Cooling and Heating Loads (Part1) The Concept of Simplified Calculation Methods of Cooling and Heating Loads. SHASE 2018, 5, 1–4. (In Japanese) [Google Scholar] [CrossRef]
- MICRO-PEAK/2010 Manual. (In Japanese). Available online: https://www.jabmee.or.jp/wp-content/uploads/2019/08/micro-peak2010_manual-1.pdf (accessed on 12 November 2024).
- Yuan, J.; Farnham, C.; Emura, K.; Alam, M. Proposal for optimum combination of reflectivity and insulation thickness of building exterior walls for annual thermal load in Japan. Build. Environ. 2016, 103, 228–237. [Google Scholar] [CrossRef]
- BEST(Building Energy Simulation Tool) Program. Available online: https://www.ibecs.or.jp/best/english.html (accessed on 12 November 2024).
- The Society of Heating, Air-Conditioning and Sanitary Engineers of Japan. Try and Learn Thermal Load HASPEE, 2nd ed.; SHASE: Tokyo, Japan, 2022. (In Japanese) [Google Scholar]
- Hamza, M.; Bafail, O.; Alidrisi, H. HVAC Systems Evaluation and Selection for Sustainable Office Buildings: An Integrated MCDM Approach. Buildings 2023, 13, 1847. [Google Scholar] [CrossRef]
- Izawa, H.; Saitoh, S.; Hayashi, T. Study on Benefits and Economic Value of Wellness Office (Part.1): Effects of Office Environment on Workers’ Workplace Productivity and Health. J. Environ. Eng. (Trans. AIJ) 2021, 86, 788,829–839. (In Japanese) [Google Scholar] [CrossRef]
- Abe, C.; Hayashi, T. Relationship between school environment and motivation to learn (Part3): Analysis of the influence structure of school environment on motivation to learn/mental health using structural equation modeling. J. Environ. Eng (Trans. AIJ) 2024, 89, 304–314. (In Japanese) [Google Scholar] [CrossRef]
- Gassar, A.A.A.; Koo, C.; Kim, T.W.; Cha, S.H. Performance Optimization Studies on Heating, Cooling and Lighting Energy Systems of Buildings during the Design Stage: A Review. Sustainability 2021, 13, 9815. [Google Scholar] [CrossRef]
- Han, T.; Huang, Q.; Zhang, A.; Zhang, Q. Simulation-Based Decision Support Tools in the Early Design Stages of a Green Building—A Review. Sustainability 2018, 10, 3696. [Google Scholar] [CrossRef]
- ASHRAE. Handbook of Fundamentals; American Society of Heating, Refrigerating and Air-Conditioning Engineers: Atlanta, GO, USA, 2021. [Google Scholar]
- He, Y.L.; Chen, Y.X.; Chen, Z.H.; Deng, Z.; Yuan, Y. Impacts of Occupant Behavior on Building Energy Consumption and Energy Savings Analysis of Upgrading ASHRAE 90.1 Energy Efficiency Standards. Buildings 2022, 12, 1108. [Google Scholar] [CrossRef]


| Safety Factors | Set Value | ||
|---|---|---|---|
| Cooling | Heating | ||
| Intermittent Operation Coefficient | A factor that accounts for the additional load required during the start-up period of cooling or heating when equipment is operated intermittently | 1.1 | 1.0~1.1 |
| Safety Factor | A factor to provide a margin for unforeseen loads or deviations from the intended operational conditions | 1.0~1.1 | 1.0~1.1 |
| Fan Load Coefficient | A factor that considers additional load due to airflow resistance and other loads impacting the fan | 1.05 | ― |
| Pump Load× Piping Loss× Equipment Load Coefficient | A factor that considers pressure loss and friction loss within pumps, piping, and equipment | 1.00~1.05 | ― |
| Piping Loss Coefficient | A factor that accounts for friction loss and thermal loss within the piping | ― | 1.00~1.05 |
| Equipment Load Coefficient | A factor that provides a buffer for operation exceeding the rated capacity of the equipment | ― | 1.00~1.05 |
| Aging Coefficient | A factor that considers reduced efficiency due to equipment degradation over time | 1.05 | 1.05 |
| Capacity Compensation Coefficient | A factor that compensates for differences between design conditions and actual operating conditions | 1.05 | 1.05 |
| Major Category | Sub-Category | Question Item | Options | |
|---|---|---|---|---|
| Cooling | Heating | |||
| Personal Attributes | Years of Experience | Years of practical experience in mechanical equipment design | Direct numerical input | |
| Industry | Current industry of employment | General Contractor | ||
| Architectural Firm | ||||
| Mechanical and Electrical Contractor | ||||
| Mechanical and Electrical Design Firm | ||||
| Others | ||||
| Company Size | Number of employees engaged in mechanical equipment design | Less than 10 | ||
| 10–50 | ||||
| 50–100 | ||||
| More than 100 | ||||
| Unknown | ||||
| Design Conditions | Building Use | Ratio of private (tenant) to public | Private 100% Public 0% | |
| Private 75% Public 25% | ||||
| Private 50% Public 50% | ||||
| Private 25% Public 75% | ||||
| Private 0% Public 100% | ||||
| Building Scale | Common building scale in design experience | Less than 2000 m2 | ||
| 2000–10,000 m2 | ||||
| More than 10,000 m2 | ||||
| Software | Current software or calculation method [34,36,37,38,39,40,41] | Building Equipment Design Standards | ||
| Design Maximum Heat Load Calculation Method | ||||
| Simplified Heating and Colling Load Calculation Method | ||||
| MICRO-PEAK2000 ver | ||||
| MICRO-PEAK2010 ver | ||||
| NewHASP | ||||
| BEST | ||||
| HASPEE | ||||
| Referencing similar properties | ||||
| Calculation Conditions | Internal Heat Gain | Person Density (people/m2) | Direct numerical input | |
| Lighting Heat (W/m2) | ||||
| Equipment Heat (W/m2) | ||||
| Ventilation Rate Per Person | Ventilation Rate Per Person (CMH/person) | Direct numerical input | ||
| Safety Factors | Intermittent Operation Coefficient | Aging Coefficient | Use less than set value | |
| Fan Load Coefficient | Use set value | |||
| Aging Coefficient | Capacity Compensation Coefficient | Use greater than set value | ||
| Capacity Compensation Coefficient | ||||
| Unknown | ||||
| Safety Factor | Safety Factor | Use less than minimum value | ||
| Intermittent Operation Coefficient | ||||
| Use minimum value | ||||
| Use Median value | ||||
| Pump Load× Piping Loss× Equipment Load Coefficient | Piping Loss Coefficient | Use maximum value | ||
| Use greater than maximum value | ||||
| Equipment Load Coefficient | ||||
| Unknown | ||||
| Design Methods | Handling of Internal Heat Gain | ― | Handling of Internal Heat Gain [25,26] | Should be considered |
| Should not be considered | ||||
| Diversity Factor | Practical handling of Diversity Factor [27] | Considered in design | ||
| Not considered but feels necessary | ||||
| Not considered | ||||
| Heat Source Equipment Capacity | Heat source equipment capacity per air-conditioning area (W/m2) | Direct numerical input | ||
| Question Item | Options | Converted Options | |
|---|---|---|---|
| Cooling | Heating | ||
| Years of practical experience in mechanical equipment design | Direct numerical input | Direct numerical input | |
| Current industry of employment | General Contractor | 0. General Contractor | |
| Architectural Design Office | 1. Architectural Firm | ||
| Mechanical and Electrical Contractor | 2. Mechanical and Electrical Contractor | ||
| Mechanical and Electrical Design Firm | 3. Mechanical and Electrical Design Firm | ||
| Others | |||
| Number of employees engaged in mechanical equipment design | Less than 10 | 0. Less than 10 | |
| 10–50 | 1. 10–50 | ||
| 50–100 | 2. 50–100 | ||
| More than 100 | 3. More than 100 | ||
| Unknown | |||
| Ratio of private (tenant) to public | Private 100% Public 0% | 0. Private | |
| Private 75% Public 25% | 1. Public | ||
| Private 50% Public 50% | * More than 50% private designed with private * | ||
| Private 25% Public 75% | |||
| Private 0% Public 100% | |||
| Common building scale in design experience | Less than 2000 m2 | 0. Less than 10,000 m2 | |
| 2000–10,000 m2 | 1. More than 10,000 m2 | ||
| More than 10,000 m2 | |||
| Current software or calculation method | Building Equipment Design Standards | 0. Only Building Equipment Design Standards | |
| Design Maximum Heat Load Calculation Method | |||
| 1. Combined Use of Building Equipment Design Standards | |||
| Simplified Heating and Colling Load Calculation Method | |||
| 2. Non-use of Building Equipment Design Standards | |||
| MICRO-PEAK2000 ver | |||
| MICRO-PEAK2010 ver | |||
| NewHASP | |||
| BEST | |||
| HASPEE | |||
| Referencing similar properties | |||
| Person Density Lighting Heat Equipment Heat | ― | Direct numerical input | Person Density (people/m2): |
| 0. Use less than 0.1 | |||
| 1. Use 0.1~0.15 | |||
| 2. Use 0.15 | |||
| 3. Use 0.15~0.3 | |||
| 4. Use greater than 0.3 | |||
| Lighting Heat (W/m2): | |||
| 0. Use less than 9.0 | |||
| 1. Use 9.0~10 | |||
| 2. Use 10 | |||
| 3. Use 10~11 | |||
| 4. Use greater than 11 | |||
| Equipment Heat (W/m2): | |||
| 0. Use less than 15 | |||
| 1. Use 15~22.5 | |||
| 2. Use 22.5 | |||
| 3. Use 22.5~30 | |||
| 4. Use greater than 30 | |||
| Ventilation Rate Per Person (CMH/person) | Direct numerical input | Direct numerical input | |
| Intermittent Operation Coefficient | Aging Coefficient | Use less than set value | 0. Use less than set value~ |
| Capacity Compensation Coefficient | Use set value | ||
| Fan Load Coefficient | Use greater than set value | 2. Use greater than set value | |
| Aging Coefficient | Unknown | ||
| Capacity Compensation Coefficient | |||
| Safety Factor | Safety Factor | Use less than minimum value | 0. Use less than minimum value ~ |
| Pump Load× Piping Loss× Equipment Load Coefficient | Intermittent Operation Coefficient | ||
| Use minimum value | 4. Use greater than maximum value | ||
| Piping Loss Coefficient | Use Median value | ||
| Use maximum value | |||
| Equipment Load Coefficient | Use greater than maximum value | ||
| Unknown | |||
| ― | Handling of Internal Heat Gain | Should be considered | 0. Should be considered |
| Should not be considered | 1. Should not be considered | ||
| Practical handling of Diversity Factor | considered in design | 0. Considered in design | |
| Not considered but feels necessary | 1. Not considered | ||
| Not considered | |||
| Heat Source Equipment Capacity (W/m2) | Direct numerical input | Direct numerical input | |
| Options | n | (%) | Options | n | (%) |
|---|---|---|---|---|---|
| Industry | Company Size | ||||
| General Contractor | 32 | 30 | Less than 10 | 12 | 11 |
| Architectural Firm | 24 | 23 | 10–50 | 19 | 18 |
| Mechanical and Electrical Contractor | 31 | 29 | 50–100 | 22 | 21 |
| Mechanical and Electrical Design Firm | 19 | 18 | More than 100 | 53 | 50 |
| Building Use | Building Scale | ||||
| Private | 96 | 91 | Less than 10,000 m2 | 25 | 24 |
| Public | 10 | 9 | More than 10,000 m2 | 81 | 76 |
| Software | Handling of Internal Heat Gain | ||||
| Only Building Equipment Design Standards | 51 | 48 | Should be considered | 29 | 28 |
| Combined Use of Building Equipment Design Standards | 39 | 37 | Should not be considered | 73 | 72 |
| Non-use of Building Equipment Design Standards | 16 | 15 | |||
| Diversity Factor | |||||
| Considered in design | 44 | 42 | - | - | - |
| Not considered | 62 | 58 | - | - | - |
| Options | Cooling | Heating | ||||||||
|---|---|---|---|---|---|---|---|---|---|---|
| n | Median (W/m2) | Mean ±SD (W/m2) | Mean Rank | p-Value | n | Median (W/m2) | Mean ±SD (W/m2) | Mean Rank | p-Value | |
| Industry | ||||||||||
| General Contractor | 32 | 150 | 143 ± 34 | 57.5 | p < 0.001 | 32 | 100 | 103 ± 39 | 49.4 | p < 0.001 |
| Architectural Firm | 24 | 100 | 114 ± 31 | 30.5 | 22 | 70 | 84 ± 32 | 33.6 | ||
| Mechanical and Electrical Contractor | 31 | 148 | 149 ± 37 | 59.5 | 31 | 100 | 110 ± 37 | 54.2 | ||
| Mechanical and Electrical Design Firm | 19 | 155 | 156 ± 38 | 66.1 | 19 | 150 | 146 ± 41 | 76.9 | ||
| Company Size | ||||||||||
| Less than 10 | 12 | 160 | 166 ± 35 | 73.5 | 0.107 | 12 | 150 | 160 ± 34 | 85.9 | p < 0.001 |
| 10–50 | 19 | 125 | 134 ± 36 | 48.5 | 17 | 100 | 115 ± 46 | 55.3 | ||
| 50–100 | 22 | 130 | 136 ± 36 | 49.4 | 22 | 85 | 94 ± 33 | 42.1 | ||
| More than 100 | 53 | 140 | 139 ± 38 | 52.4 | 53 | 100 | 102 ± 37 | 48.3 | ||
| Building Use | ||||||||||
| Private | 96 | 145 | 142 ± 37 | 55.0 | 0.123 | 94 | 100 | 109 ± 44 | 52.9 | 0.658 |
| Public | 10 | 120 | 125 ± 41 | 39.3 | 10 | 100 | 104 ± 48 | 48.5 | ||
| Building Scale | ||||||||||
| Less than 10,000 m2 | 25 | 150 | 148 ± 41 | 59.5 | 0.463 | 25 | 120 | 123 ± 47 | 61.9 | 0.071 |
| More than 10,000 m2 | 81 | 140 | 138 ± 37 | 51.7 | 79 | 100 | 104 ± 39 | 49.5 | ||
| Software | ||||||||||
| Only Building Equipment Design Standards | 51 | 148 | 147 ± 38 | 58.0 | 0.194 | 50 | 100 | 117 ± 41 | 58.9 | 0.103 |
| Combined Use of Building Equipment Design Standards | 39 | 123 | 132 ± 38 | 46.5 | 38 | 100 | 103 ± 45 | 47.3 | ||
| Non-use of Building Equipment Design Standards | 16 | 150 | 142 ± 32 | 56.3 | 16 | 100 | 96 ± 34 | 50.3 | ||
| Handling of Internal Heat Gain | ||||||||||
| Should be considered | - | - | - | - | - | 29 | 80 | 93 ± 38 | 39.8 | 0.006 ** |
| Should not be considered | - | - | - | - | 73 | 100 | 116 ± 42 | 57.6 | ||
| Diversity Factor | ||||||||||
| Considered in design | 44 | 120 | 127 ± 35 | 43.6 | 0.0051 ** | 43 | 80 | 92 ± 40 | 39.2 | p < 0.001 |
| Not considered | 62 | 150 | 150 ± 37 | 60.5 | 61 | 120 | 121 ± 40 | 61.9 | ||
| Power Analysis | ||
|---|---|---|
| Cooling | Heating | |
| Industry | 0.55 | 0.80 |
| Company Size | 0.67 | 0.77 |
| Building Use | 0.40 | 0.67 |
| Building Sacle | 0.68 | 0.52 |
| Software | 0.63 | 0.50 |
| Handling of Internal Heat Gain | - | 0.40 |
| Diversity Factor | 0.62 | 0.57 |
| (Cooling) | Personal Attributes | Design Conditions | |||||
| Years of Experience | Industry | Company Size | Building Scale | Building Use | Software | ||
| Heat Source Equipment Capacity | ― | ― | ― | △ | △ | ― | |
| Total Effect | ― | 0.03 | −0.03 | −0.098 | −0.05 | 0.047 | |
| Calculation Conditions | Design Methods | ||||||
| Internal Heat Gain | Ventilation Rate Per Person | Safety Factors | Handling of Internal Heat Gain | Diversity Factor | |||
| Heat Source Equipment Capacity | ○ | ― | ◎ | ◎ | |||
| Total Effect | 0.19 | ― | 0.30 | 0.29 | |||
| (Heating) | Personal Attributes | Design Conditions | |||||
| Years of Experience | Industry | Company Size | Building Scale | Building Use | Software | ||
| Heat Source Equipment Capacity | ― | ○ | ― | △ | ― | ― | |
| Total Effect | ― | 0.13 | −0.01 | −0.07 | −0.03 | ― | |
| Calculation Conditions | Design Methods | ||||||
| Internal Heat Gain | Ventilation Rate Per Person | Safety Factors | Handling of Internal Heat Gain | Diversity Factor | |||
| Heat Source Equipment Capacity | ― | ○ | ○ | ◎ | |||
| Total Effect | ― | 0.12 | 0.11 | 0.33 | |||
| (Cooling) | Personal Attributes | Design Conditions | |||||
| Years of Experience | Industry | Company Size | Building Scale | Building Use | Software | ||
| Handling of Internal Heat Gain | |||||||
| Total Effect | |||||||
| Diversity Factor | ― | ― | ○ | ◎ | ― | ― | |
| Total Effect | ― | 0.08 | −0.11 | −0.34 | ― | ― | |
| Calculation Conditions | Design Methods | ||||||
| Internal Heat Gain | Ventilation Rate Per Person | Safety Factors | Handling of Internal Heat Gain | Diversity Factor | |||
| Handling of Internal Heat Gain | |||||||
| Total Effect | |||||||
| Diversity Factor | ― | ― | ― | ||||
| Total Effect | ― | ― | ― | ||||
| (Heating) | Personal Attributes | Design Conditions | |||||
| Years of Experience | Industry | Company Size | Building Scale | Building Use | Software | ||
| Handling of Internal Heat Gain | ― | ◎ | ○ | △ | ― | ― | |
| Total Effect | ― | 0.40 | 0.12 | −0.07 | −0.048 | ― | |
| Diversity Factor | ― | ◎ | △ | ○ | ○ | ― | |
| Total Effect | ― | 0.27 | −0.07 | −0.19 | −0.13 | ― | |
| Calculation Conditions | Design Methods | ||||||
| Internal Heat Gain | Ventilation Rate Per Person | Safety Factors | Handling of Internal Heat Gain | Diversity Factor | |||
| Handling of Internal Heat Gain | ― | ― | |||||
| Total Effect | ― | ― | |||||
| Diversity Factor | ― | ― | |||||
| Total Effect | ― | ― | |||||
| (Cooling) | Personal Attributes | Design Conditions | |||||
| Years of Experience | Industry | Company Size | Building Scale | Building Use | Software | ||
| Internal Heat Gain | ― | ― | ― | △ | ◎ | ◎ | |
| Total Effect | ― | 0.02 | 0.03 | 0.09 | −0.27 | −0.24 | |
| Ventilation Rates Per Person | ― | ― | ― | ― | ― | ― | |
| Total Effect | ― | ― | ― | ― | ― | ― | |
| Safety Factors | ― | ― | ― | △ | ― | ― | |
| Total Effect | ― | 0.02 | −0.02 | −0.07 | ― | ― | |
| Calculation Conditions | Design Methods | ||||||
| Internal Heat Gain | Ventilation Rate Per Person | Safety Factors | Handling of Internal Heat Gain | Diversity Factor | |||
| Internal Heat Gain | ◎ | ||||||
| Total Effect | −0.28 | ||||||
| Ventilation Rates Per Person | ― | ||||||
| Total Effect | ― | ||||||
| Safety Factors | ◎ | ||||||
| Total Effect | 0.20 | ||||||
| (Heating) | Personal Attributes | Design Conditions | |||||
| Years of Experience | Industry | Company Size | Building Scale | Building Use | Software | ||
| Internal Heat Gain | |||||||
| Total Effect | |||||||
| Ventilation Rates Per Person | |||||||
| Total Effect | |||||||
| Safety Factors | ― | △ | ― | ― | ○ | ― | |
| Total Effect | ― | 0.09 | −0.02 | −0.04 | 0.12 | ― | |
| Calculation Conditions | Design Methods | ||||||
| Internal Heat Gain | Ventilation Rate Per Person | Safety Factors | Handling of Internal Heat Gain | Diversity Factor | |||
| Internal Heat Gain | |||||||
| Total Effect | |||||||
| Ventilation Rates Per Person | |||||||
| Total Effect | |||||||
| Safety Factors | ― | ◎ | |||||
| Total Effect | ― | 0.20 | |||||
| (Cooling) | Personal Attributes | Design Conditions | |||||
| Years of Experience | Industry | Company Size | Building Scale | Building Use | Software | ||
| Building Scale | ― | ◎ | ◎ | ||||
| Total Effect | ― | −0.23 | 0.31 | ||||
| Building Use | ― | ◎ | ― | ||||
| Total Effect | ― | 0.21 | ― | ||||
| Software | ― | ◎ | ― | ||||
| Total Effect | ― | −0.40 | ― | ||||
| Calculation Conditions | Design Methods | ||||||
| Internal Heat Gain | Ventilation Rate Per Person | Safety Factors | Handling of Internal Heat Gain | Diversity Factor | |||
| Building Scale | |||||||
| Total Effect | |||||||
| Building Use | |||||||
| Total Effect | |||||||
| Software | |||||||
| Total Effect | |||||||
| (Heating) | Personal Attributes | Design Conditions | |||||
| Years of Experience | Industry | Company Size | Building Scale | Building Use | Software | ||
| Building Scale | ― | ○ | ◎ | ||||
| Total Effect | ― | −0.18 | 0.38 | ||||
| Building Use | ― | ◎ | ― | ||||
| Total Effect | ― | 0.24 | ― | ||||
| Software | ― | ◎ | ― | ||||
| Total Effect | ― | 0.09 | −0.02 | ||||
| Calculation Conditions | Design Methods | ||||||
| Internal Heat Gain | Ventilation Rate Per Person | Safety Factors | Handling of Internal Heat Gain | Diversity Factor | |||
| Building Scale | |||||||
| Total Effect | |||||||
| Building Use | |||||||
| Total Effect | |||||||
| Software | |||||||
| Total Effect | |||||||
Disclaimer/Publisher’s Note: The statements, opinions and data contained in all publications are solely those of the individual author(s) and contributor(s) and not of MDPI and/or the editor(s). MDPI and/or the editor(s) disclaim responsibility for any injury to people or property resulting from any ideas, methods, instructions or products referred to in the content. |
© 2025 by the authors. Licensee MDPI, Basel, Switzerland. This article is an open access article distributed under the terms and conditions of the Creative Commons Attribution (CC BY) license (https://creativecommons.org/licenses/by/4.0/).
Share and Cite
Eto, Y.; Kikuta, K.; Abe, Y.; Sawachi, T. Analysis of the Influence Structure Between Design Factors and Heat Source Equipment Capacity: A Case Study on Office Building Design with a Central Heat Source System in Warm Regions of Japan. Buildings 2025, 15, 1022. https://doi.org/10.3390/buildings15071022
Eto Y, Kikuta K, Abe Y, Sawachi T. Analysis of the Influence Structure Between Design Factors and Heat Source Equipment Capacity: A Case Study on Office Building Design with a Central Heat Source System in Warm Regions of Japan. Buildings. 2025; 15(7):1022. https://doi.org/10.3390/buildings15071022
Chicago/Turabian StyleEto, Yuta, Koki Kikuta, Yuhei Abe, and Takao Sawachi. 2025. "Analysis of the Influence Structure Between Design Factors and Heat Source Equipment Capacity: A Case Study on Office Building Design with a Central Heat Source System in Warm Regions of Japan" Buildings 15, no. 7: 1022. https://doi.org/10.3390/buildings15071022
APA StyleEto, Y., Kikuta, K., Abe, Y., & Sawachi, T. (2025). Analysis of the Influence Structure Between Design Factors and Heat Source Equipment Capacity: A Case Study on Office Building Design with a Central Heat Source System in Warm Regions of Japan. Buildings, 15(7), 1022. https://doi.org/10.3390/buildings15071022