Abstract
With advancement in Unmanned Aerial Vehicle (UAV) photogrammetry, productivity in construction management can now be achieved with accuracy and is less labour-intensive. In the basement construction of buildings, prudent earthwork activities are often necessary, setting the basis of the building footprint. As such, monitoring earthwork volume estimation becomes important to avoid over- or under-cutting the earth. Conventional methods by means of land surveying are time-consuming, labour-intensive, and susceptible to varying degrees of accuracy. Moreover, earthwork sites often have multiple activities ongoing that increase the complexity of volume estimation through land surveying. This study explores the use of UAV photogrammetry to estimate earthwork excavation volume in a complex urban earthwork site in Singapore over time and discusses the feasibility, challenges and productivity enhancements of integrating the technology into the construction process. In this study, the earthwork site and controlled trials show that the models reconstructed with UAV photogrammetry data can produce volume measurements that fulfil the stakeholder’s accuracy tolerance of 5% between the estimated and actual volume. The filtering of unwanted objects in the model, such as columns, cranes and trucks, was successful but was insufficient for objects that occluded large areas of the soil surface. The integration of UAV photogrammetry with a highly automated acquisition and processing workflow for earthwork monitoring brings about productivity enhancements in time and labour efforts and improves the efficiency and consistency of models. Furthermore, the digitalisation of earthwork sites into point clouds and three-dimensional (3D) models increases data visualisation and accessibility, facilitates project team collaboration, and enables cross-platform compatibility into Building Information Modelling (BIM), which can significantly aid in reporting and decision-making processes.
1. Introduction
With a population density of 8207 people per square kilometre [1], Singapore is a heavily urbanised country where infrastructure is continuously built and re-developed to support its growing population. Construction in Singapore’s highly urbanised cityscape is challenging and complicated as projects often have to navigate the physical and temporal constraints of its dense infrastructure and packed timelines. Project sites are usually situated in built-up areas and often have multiple activities, such as land clearing and construction activities that are often carried out concurrently with earthwork excavation. To maximise productivity and support construction processes and safety improvements, the Building and Construction Authority of Singapore (BCA) has been encouraging the adoption of digital technologies that can be used to improve projects’ efficiency under the Construction Industry Transformation Map (ITM). However, even though many construction organisations have displayed a positive outlook in the adoption of digital technologies, the implementation rate has been moderately low in Singapore [2]. The use of digital technologies to monitor on-site activities to maximise productivity and minimise re-work had the lowest implementation rate [2]. Oesterreich and Teuteberg [3] attribute this to firms’ uncertainty of the benefits, unfamiliarity with the implementation, and the changes to work processes that are required to integrate the technologies into construction projects. This first-ever study of UAV photogrammetry for earthwork volume estimation in Singapore was conducted to encourage the industry and firms to adopt and integrate digital technologies into the earthwork monitoring process. This study evaluates UAV photogrammetry’s feasibility for earthwork volume calculation and provides the industry and future projects with knowledge and insights into the work processes, productivity gain, and challenges when using UAV photogrammetry on a complex urban earthwork site in Singapore. Specifically, this manuscript seeks to introduce the methodology, covering data acquisition, model processing, filtering, downsampling, and validation of UAV photogrammetry, to promote the efficient and accurate implementation of digitalisation in construction.
2. Background
2.1. Earthworks in Singapore
Earthwork is a component in a civil engineering project that reconfigures a construction site’s topography to meet design requirements through the movement and removal of large quantities of soil and unformed rock. As one of the major project cost items, an accurate estimation of earthwork volume enables stakeholders to have a better overview of the excavation progress for decision-making and ensure that appropriate payments are made to contractors. In Singapore, the volume of earth excavated during earthwork is estimated using conventional methods such as the counting of earthwork trucks and land surveying. The former approximates the total excavated volume by multiplying the number of trucks by either the estimated or pre-determined average volume of earth each truck can carry. The latter uses a total station or a Global Navigation Satellite System (GNSS) receiver to collect survey points across the site and then uses the grid method and Average-End-Area (AEA) methods to compute the volume. These methods are time-consuming and labour-intensive and carry a high safety risk for personnel as they traverse the earthwork site. The measurements made are also subjected to variable site conditions, may interrupt site work, and are susceptible to varying degrees of accuracy [4,5].
2.2. Digital Technologies and Earthworks in Singapore
2.2.1. UAV Photogrammetry
UAV photogrammetry has been gaining popularity in the civil engineering industry for its low cost and high quality, as well as the ease of use of drones and photogrammetry software to reconstruct accurate 3D models efficiently and safely to facilitate earthwork monitoring activities. Photogrammetry models have been used in a range of applications—from quantity take-off [6], landslide analysis [7], and ground settlement monitoring [8] to the crack monitoring of ageing infrastructure [9] and the defect detection and condition assessment of civil structures such as bridges, tunnels, pipes and asphalt pavements [10,11]. In addition to monitoring and inspection work, UAV photogrammetry is found to have the potential to revolutionise earthwork volume estimation. Studies on UAV photogrammetry for earthwork volume estimation have shown it to be feasible, and it brings about improvements in accuracy and productivity [5,12,13,14,15,16]. However, these studies were performed under controlled site conditions using stockpiles and earthwork-completed sites. Hence, an extension of these studies to an active earthwork site would greatly benefit the civil engineering community.
2.2.2. Photogrammetry Software
Pix4Dmapper is a highly versatile and low-cost software capable of processing a large number of photos; it allows the input of specific camera settings, produces detailed analysis outputs and 3D visuals, and computes the cut and fill volume between two 3D models. It is a stand-alone software that performs the photogrammetric processing of digital images and generates 3D spatial data, which can then be exported for use in 3D analytical applications as well as for indirect measurements of objects of various scales. The software is selected for its features that carry out 3D analysis with a user-friendly graphical user interface suitable for non-photogrammetry staff to use with a short, gentle learning curve. The wide range of features offered by this software—including the ability to evaluate camera parameters, generate point clouds from photographs, create digital terrain models, classify terrain for the easier filtering of unwanted objects, and provide the range of uncertainty or variation around the central volume measurement from the digital terrain model—has made it the preferred choice over other photogrammetry software packages.
2.2.3. Filtering of Unwanted Objects
Machines and human-made objects such as concrete structures, including beams and piles, and non-concrete objects that range from tyres to parasol tents can be cast or found across the site, even when earthwork excavation is ongoing. The presence of these structures and objects on site will lead to an inaccurate estimation of excavated earth when evaluating the 3D models created by UAV photogrammetry and should be removed to obtain the digital terrain model (DTM) for better volume computation accuracy.
While the photogrammetry software Pix4Dmapper v4.5 has an inbuilt classification tool for removing unwanted objects, it was deemed inadequate due to its inability to classify entire objects for removal, leaving residual terrain noise in the model. Alternative algorithms and tools such as the Medial Axis Transform (MAT) [17], 3D Modified Fisher Vectors (3DmFV) using convolutional neural networks [18], and the Cloth Simulation Filtering (CSF) [19] were found to be suitable for the removal of objects from the point clouds identified. Among the shortlisted methods, CSF was the most compatible for this study due to its accessibility as a plugin on the free-to-use software CloudCompare v2.11 and its ease of use, requiring only a few parameter settings. The filtering method was also validated [19] and found to yield an average total error of 4.58%, comparable to other state-of-the-art filtering algorithms. The approach simulates a rigid cloth to cover the inverted point cloud’s surface to approximate the ground surface, as illustrated in Figure 1.
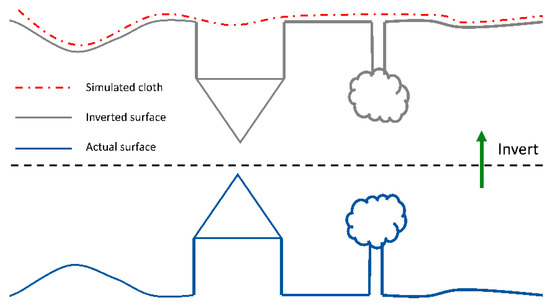
Figure 1.
Cloth Simulation Filter [19].
CSF was performed to isolate and remove the unwanted objects to obtain the DTM, providing a more accurate representation of the excavated earth volume. In this project site, the objects expected to affect accurate estimates of earthworks computations were the concrete beams, the protruding concrete piles, the silos, and stationary cranes and trucks.
3. Methodology
3.1. Data Acquisition
3.1.1. Excavation Site
The study was conducted at a depot extension construction site in Singapore with an estimated excavation area of about 47,025 m2 (285m × 165 m), located next to mid-rise industrial buildings and a flyover. Ground control points (GCPs) were distributed around the excavation area, and the coordinates were obtained from the site’s land surveyor.
3.1.2. UAV and Flight Plan
The primary UAV used for image acquisition at the excavation site was the DJI Phantom 4 RTK. The UAV has a take-off weight of 1.39 kg and a maximum flight time of approximately 30 min per set of batteries. The payload is a 1″ Complementary Metal-Oxide-Semiconductor (CMOS) sensor with a 24 mm lens with effective pixels of 20 megapixels (MPs). Flight plans were planned with the DJI GO 4 app, and missions were operated automatically. A second UAV, DJI Matrice 210 RTK V2, was primarily used for image acquisition at field trials. It has a take-off weight of 6.14 kg with a maximum flight time of approximately 24 min per set of batteries. It was mounted with the Zenmuse X7 camera with interchangeable lenses and effective pixels of 24 MP. Flight plans were planned with the DJI GO app, and missions were operated automatically.
The aerial images at the excavation site were captured with an 80% forward and 70% side overlap and flown in a grid pattern at an altitude of at least 45 m above ground level with a ground sampling distance (GSD) between 0.89 cm and 1.9 cm. A total of seven image acquisition sessions were conducted, which took over a year.
3.1.3. Earthworks Site Record
Site records of the excavated earth were obtained for direct comparison with the UAV photogrammetry results. The site records use earthwork trucks to approximate the excavated earth by multiplying the number of trucks by the average volume earthwork trucks can carry while taking the soil bulking effect into consideration.
3.1.4. Controlled Trials
Since the site records obtained from traditional land surveying and counting of trucks are also estimates of excavation volume, parallel trials were conducted to measure cylinders with known volume as an alternative means to validate the accuracy of volume measurement using photogrammetry. Two aluminium cylinder tanks with diameters of 0.5 m and 1 m were fabricated to simulate a shaft excavation with different “excavation volumes”. The 0.5 m tank was used as a volume control in controlled trials to evaluate the effect of altitude, overlap, and camera specification on model accuracy. The combination of flight parameters used is listed in Table 1. The 1 m tank was placed at the earthwork site for volume validation.

Table 1.
Combination of flight parameters used in controlled trials.
3.2. Model Processing
The Pix4Dmapper photogrammetry software, which will be referred to as “Pix4D”, was used to process the images and generate point clouds, the digital surface model (DSM), and volume measurement. Each model was processed with five GCPs to ensure a high absolute-accuracy reconstruction of the site.
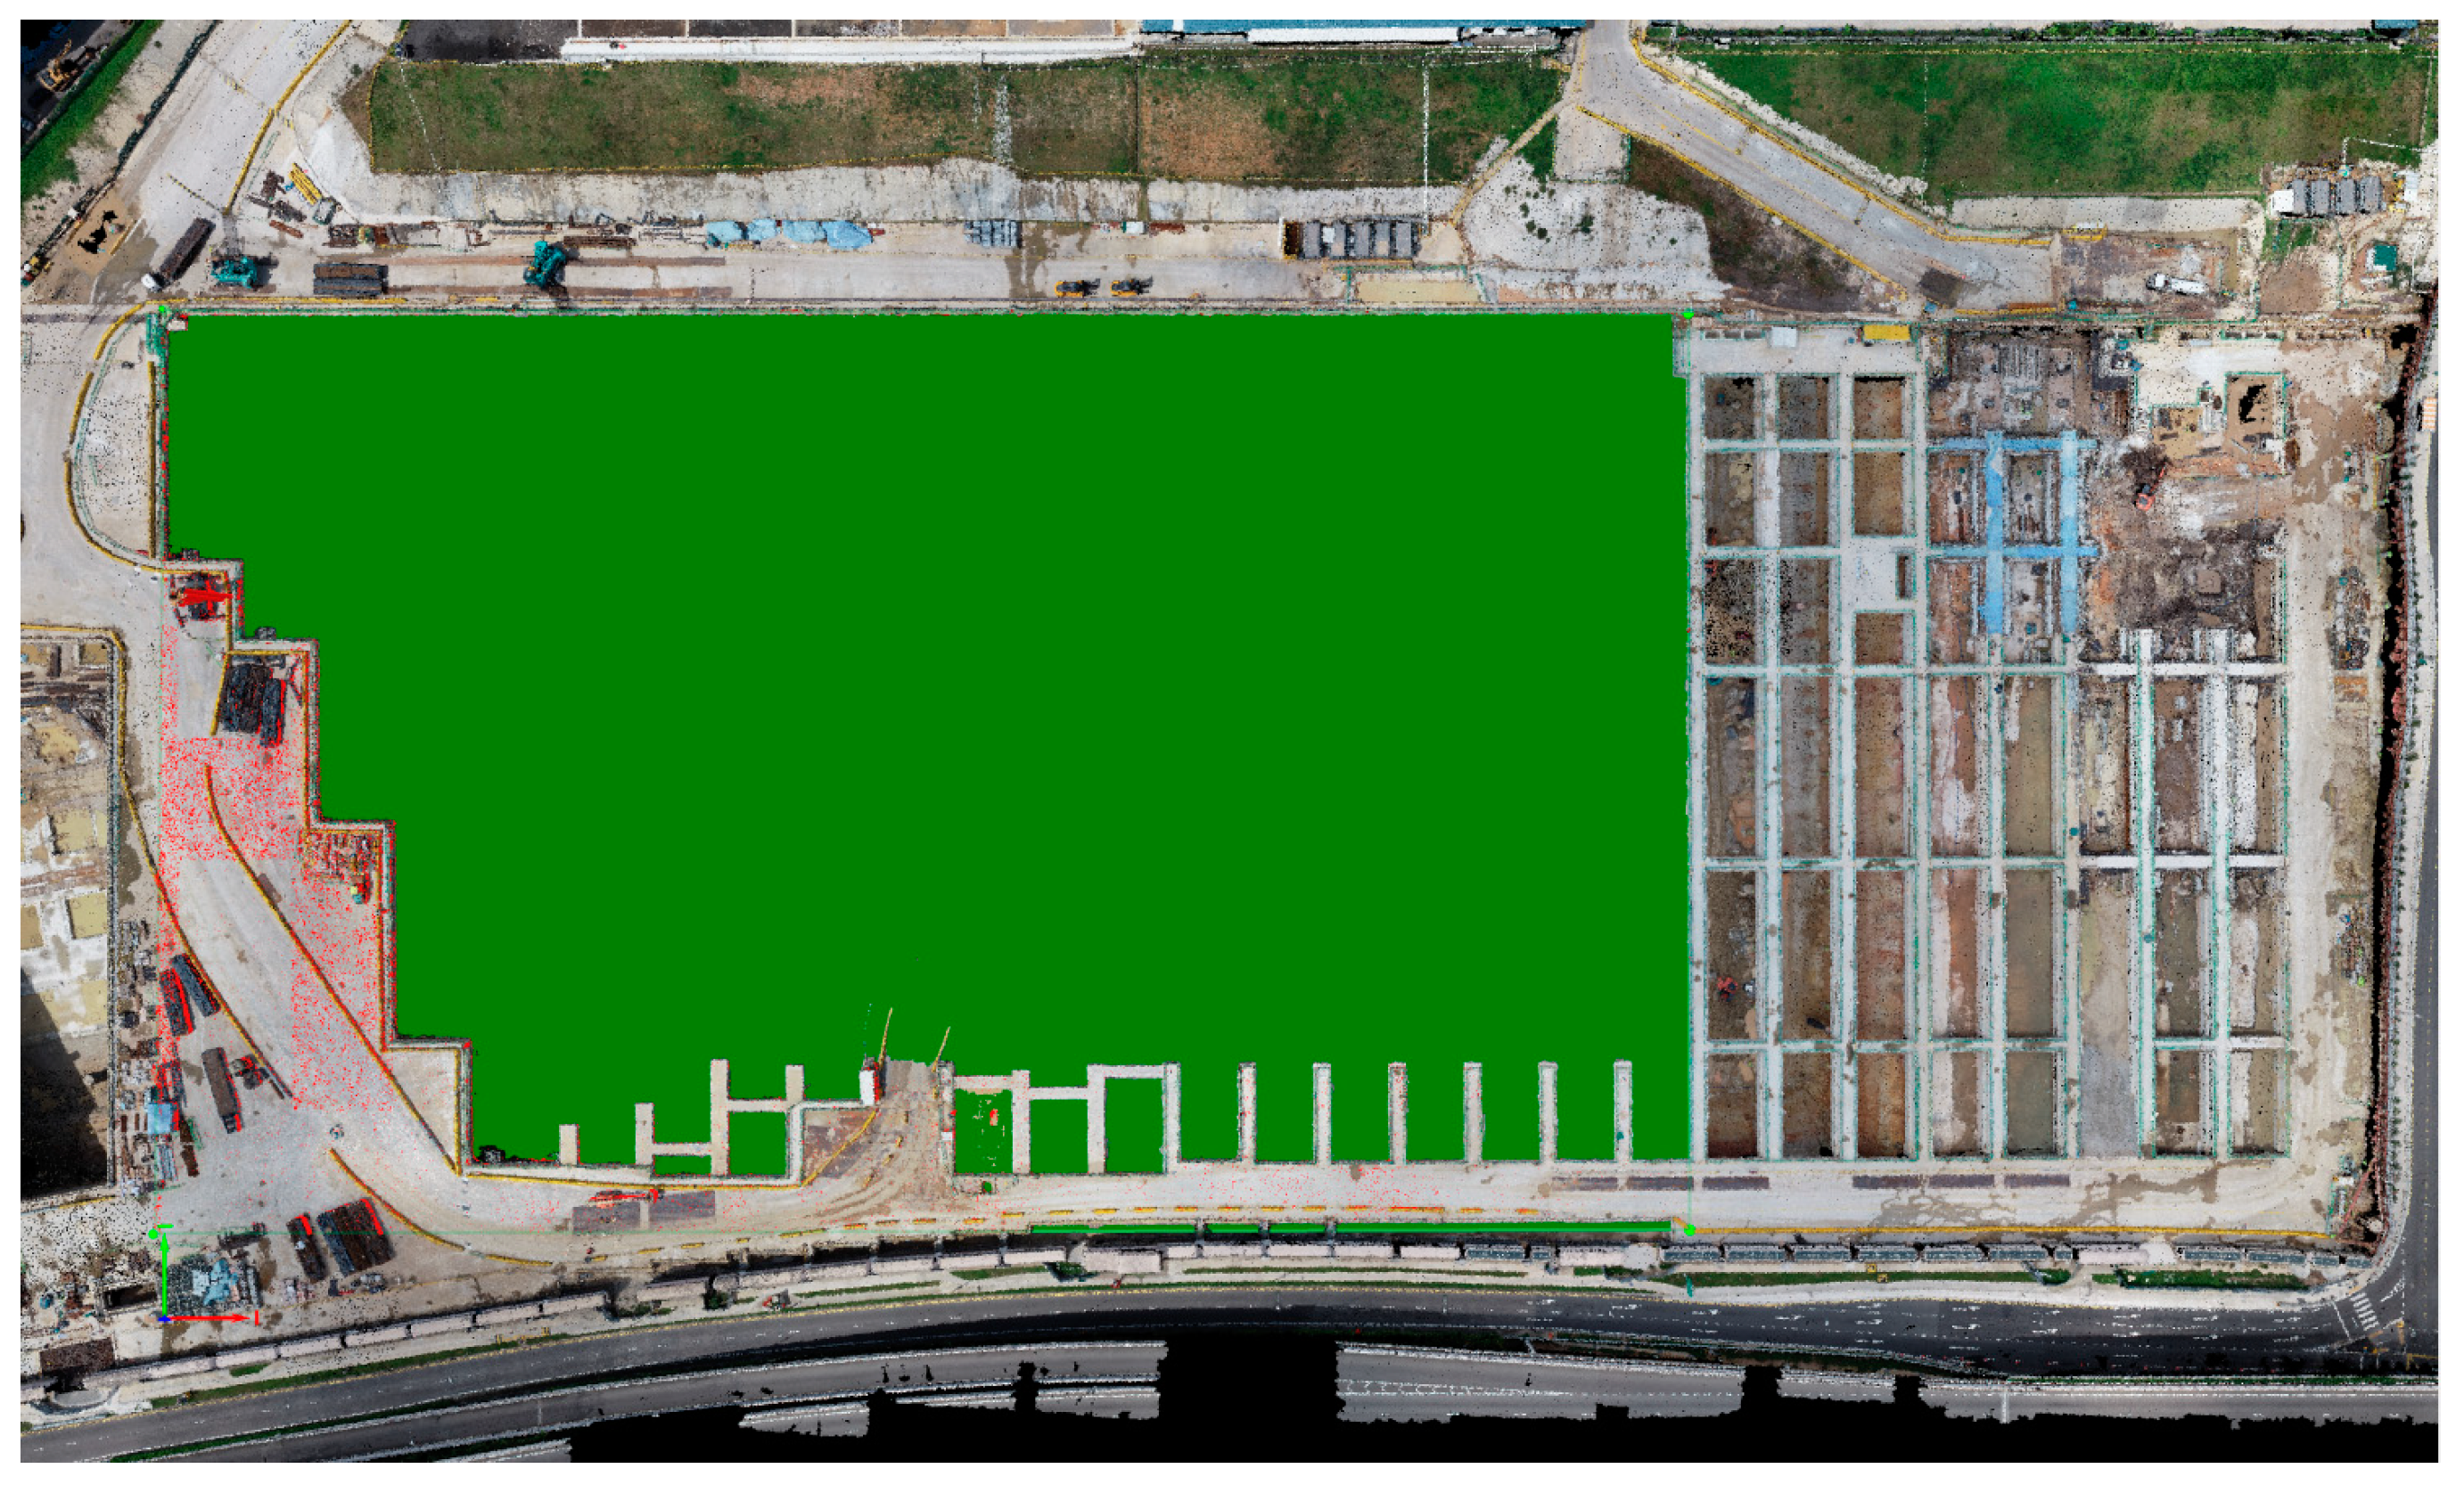
Base Surface for Volume Computation
The volume was calculated by drawing or importing the boundary of the area of interest (Figure 2) into the site model and specifying the volume base altitude for Pix4D to use as a base surface for volume calculation. A base surface of 9 m altitude was chosen from the pre-excavation model as the default reference plane for all models to maintain the consistency of volume measurement values. Pix4D then computed the volume by multiplying each pixel’s average height within the area of interest with the ground sampling distance (GSD) and presented it in the form of terrain 3D area, cut volume, fill volume, and total volume. The terrain 3D area is the area defined by the DSM in the volume base. The cut volume (positive value) is the volume above the base surface bound by the DSM, while the fill volume (negative value) is the volume below the base surface bound by the DSM, and the total volume is the sum of the cut and fill volumes. The change in volume between each model as then obtained using Equation (1).
where = cut volume after, = cut volume before, = fill volume after, = fill volume before, = total volume after, and = total volume before.

Figure 2.
Base surface for volume calculation overlaid over the area of interest.
4. Results
4.1. Reconstructed Models
A selection of the reconstructed 3D models of the earthwork site generated by Pix4D is shown in Figure 3.
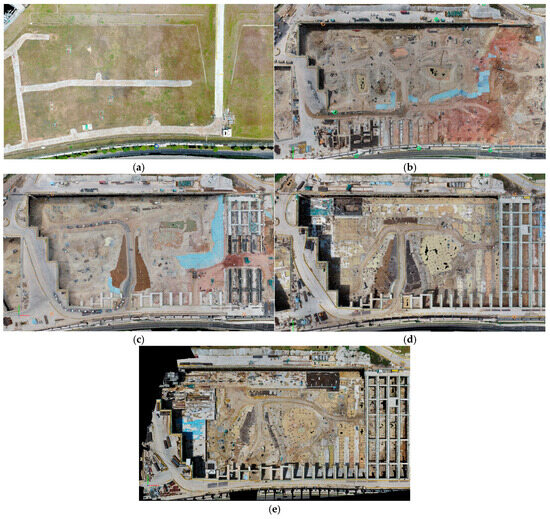
Figure 3.
Reconstructed models of site at different stages of earthworks: (a) Pre-excavation model; (b) Site model on Month-3; (c) Site model on Month-6; (d) Site model on Month-10; (e) Site model on Month-13.
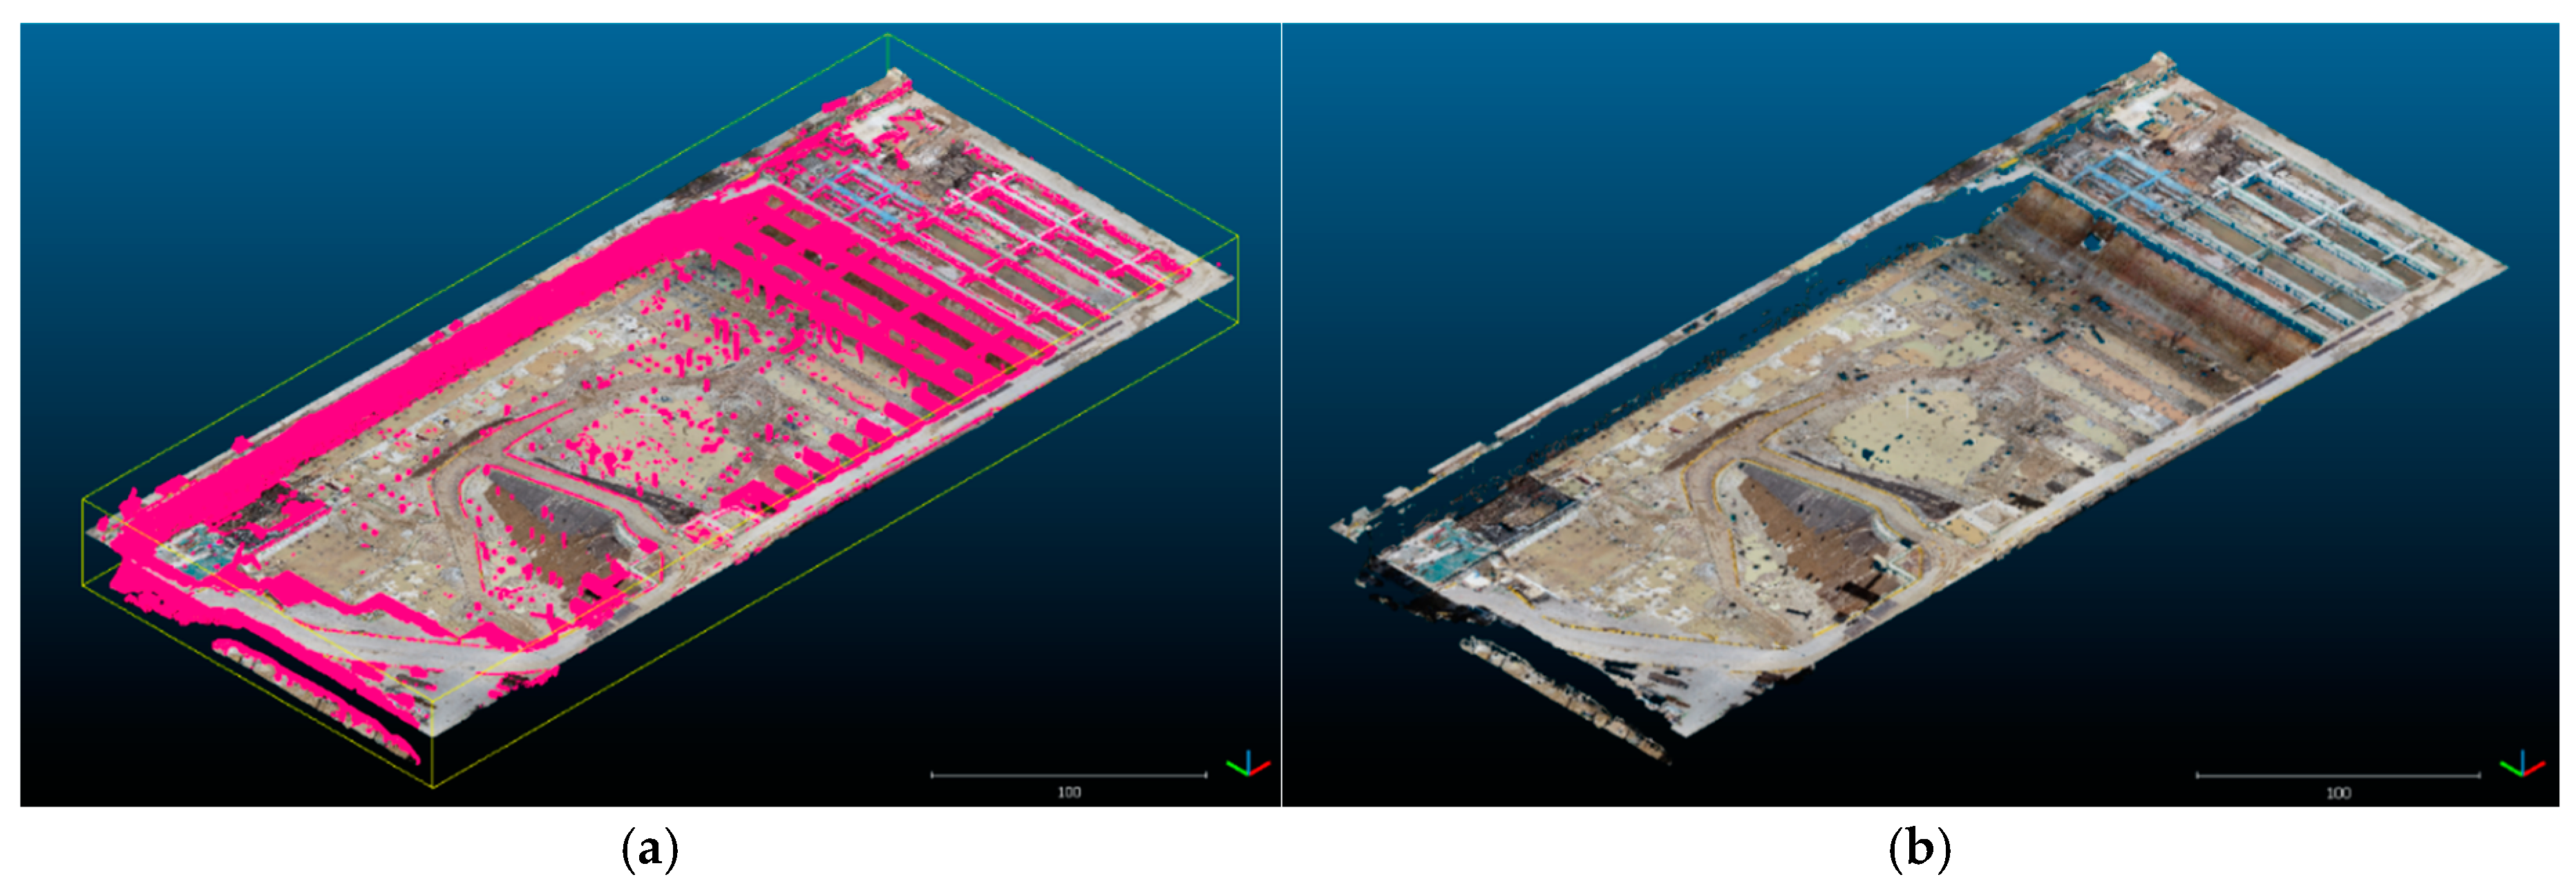
4.2. Post-CSF Model
The filtering of unwanted objects from the point cloud model was performed using the CSF plugin in CloudCompare. For this study site, the advanced parameters for cloth resolution and classification thresholds of 0.4 and 0.5, respectively, provided the best filtering results in removing machinery, vehicles, and small structures from the point cloud (Figure 4). While most objects were successfully removed, some of the larger beams and platforms remained. These objects tend to have more extensive planar surfaces covering the soil surface, leading to CSF misidentifying them as the ground surface. They were manually removed from the point cloud.
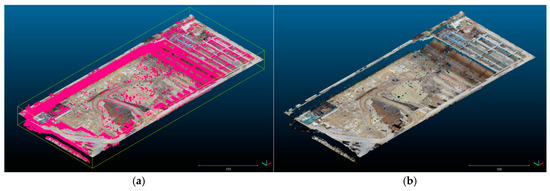
Figure 4.
Unwanted features such as: (a) human-made objects are highlighted in pink, and (b) removed through CSF to obtain the DTM.
4.3. Volume Results
Table 2 shows the volume computation results with adjustments after filtering unwanted objects using CSF, site records, and the volume difference between using photogrammetry and the conventional method using earthwork trucks. The results showed an average difference of about 4.34% between the photogrammetry measured and the reported site record, which is extremely encouraging. The recording stations that track the amount of earth removed by the earthwork trucks do not identify the trucks’ points of origin, which makes traceability challenging. This lack of distinction could result in slight discrepancies between the photogrammetry measurements and the truck counts, especially if the trucks are also transporting excavation spoil from other areas within the same site. Another factor contributing to these differences is soil swelling during excavation. For soils that are highly prone to swelling, photogrammetry provides a more accurate measurement of the in situ excavation volume, as it is based on the profile of the excavation face.
Table 2.
Extracted volume calculated from photogrammetry models and comparison with site records. Values in brackets are the volume of CSF filtered objects.
4.4. Cylinder Trial Results and Validation
The flight combinations in Table 1 were used to assess flight parameters and their impact on volume accuracy. Flights conducted between altitudes of 30 and 40 m did not significantly impact volume accuracy. Flights with an 80% overlap produced the lowest spread of difference: no more than 0.003 m3 than lower overlap percentages. When comparing different camera specifications, the M210 24 MP camera with a 24 mm lens and the Phantom 4 20 MP camera with a 24 mm lens had a similar mean difference in measurement between the photogrammetry and actual volume: the M210 24 MP produced a mean difference of 0.0020 m3 while the Phantom 4 20 MP produced a mean difference of 0.0027 m3. The controlled trials produced an overall average difference of 4.3% between the photogrammetry measurement and actual cylinder volume. The 1 m diameter cylinder was placed at the excavation site and used as a control. A difference of 0.0173 m3 or 3.67% of the cylinder’s actual volume was obtained—an accuracy value consistent with those conducted in controlled trials and within the 5% tolerance of accepted error required by site stakeholders.
4.5. Downsampling
Point clouds are known to be computationally intensive in terms of memory size requirements. For example, using a typical desktop computer using Windows 10 64 bit Enterprise with random-access memory (RAM) of 16 GB, point cloud files containing about 100,000 points can be comfortably imported into and browsed as a Toposurface in the BIM software Revit 2018. However, it was challenging when accessing larger files that had more than 400,000 points. Downsampling of the point cloud was attempted to obtain more manageably sized data to facilitate data transfer and performance.
CloudCompare’s Octree method was used to conduct and test the performance when downsampling (Table 3). The grid percentage and offset are key parameters that determine how the point cloud is downsampled based on the octree structure. The grid percentage refers to how much of the original point cloud is retained during downsampling, typically expressed as a percentage of the original points. The offset is a positional shift applied to the grid or octree cells in order to control the starting position for the subdivision of the grid. The offset helps in ensuring that the grid cells are aligned correctly in space and that the downsampling process is consistent across the entire dataset. The octree structure in CloudCompare (DgmOctree) is a list of numerical values encoding the absolute position of points across all subdivision levels, rather than a traditional tree. The code is formed by concatenating sets of 3 bits to represent the relative position of a cell at each subdivision level, with the most significant bits corresponding to the first level [20]. It was observed that between Octree levels 8 and 10, a narrow range can be pinpointed where the number of points dropped significantly from 2 million to about 400,000, 140,000 and 40,000, while still retaining about 99% accuracy compared to the original. At that number of points, the computational effort required to import into Autodesk Revit as a Toposurface is acceptable. At Octree levels 7 and below, the accuracy begins to drop off to 80% and below, which is not practical.
Table 3.
Comparison of parameters using octree downsampling.
5. Discussion
5.1. Feasibility
The 5% tolerance of acceptable error between the estimated and actual volumes was determined from the project’s stakeholder requirements. The earthwork site and controlled trials have shown that UAV photogrammetry can produce measurements that fulfil stakeholders’ accuracy requirements. The conventional method of using earthwork trucks to measure volume is highly variable due to estimation, which leads to higher uncertainties and the lower accountability of the acquired data. UAV photogrammetry circumvents these issues with its workflow and photogrammetry model. Once the acquisition and processing workflow for UAV photogrammetry has been established for an earthwork site, the generation of site models becomes more efficient and consistent through automation. Additionally, as measurements are taken of the reconstructed model, the accuracy of the volume estimates is more consistent than when using earthwork trucks, where accuracy is highly dependent on the assumption of the amount of earth in trucks and the soil swelling factor. With the reconstructed models, volume measurements can be made from any parts of the excavation model due to its spatial attribute, which would not have been possible with earthwork trucks as the trucks do not differentiate where the loaded earth was collected.
However, a bottleneck exists when attempting to filter the 3D point cloud to obtain the DTM for volume computation at this study site. While the CSF was successful in automatically removing objects such as columns, cranes, and trucks, objects that occluded large areas of the soil surface such as platforms and beams were misidentified as the ground and had to be manually removed. The development of a specialised filtering algorithm for use at construction sites that can remove structures with extensive planar surfaces would help reduce the effort required in the manual point cloud cleaning process. Future projects that use UAV photogrammetry for volume measurements can consider additional manoeuvring the UAV in-flight to capture the blocked corners and surfaces occluded by large permanent and temporary structures.
5.2. Productivity in Workflow
UAV photogrammetry to create 3D models for earthwork volume estimation brings about productivity enhancements in time and labour efforts. The site’s current truck-counting method, used to estimate earthwork volume, has high latency as the total volume estimation can only be computed at the end of the monitoring period by compiling the records of all truck movements. In contrast, with UAV photogrammetry, surveys are only needed at the start and end of the time frame to measure the volume difference. As a result, UAV photogrammetry takes a small fraction of the time compared to manual truck counting. UAV photogrammetry for this site took about 11 h, of which about three staff-hours were used for manual processes (for the acquisition, filtering and analysis of data) and about 8 h were used for automated model processing.
In contrast, with UAV photogrammetry, surveys are only needed at the start and end of the time frame to measure the volume difference. As a result, UAV photogrammetry takes a small fraction of the time compared to manual truck counting.
Table 4 compares other alternative methods of traditional surveying and laser scanning with truck counting and UAV photogrammetry for earthwork volume estimation. UAV-based photogrammetry provides greater scalability as the UAV platform allows for quick data acquisition with pre-planned flight plans, unlike traditional surveying and laser scanning, requiring staff to traverse the site to obtain measurements. Moreover, the UAV platform could potentially suffer from fewer occlusion issues on an earthworks site as obstructions on the ground pose less of a problem than the other methods that depend on their vantage point to overcome occlusions and obstructions, which may be impossible to circumvent on-site. The UAV platform also provides photo-documentation of the excavation site, which can be used to monitor and plan site operations and activities.
Table 4.
Comparison of methods for earthwork volume estimation.
5.3. Digitalisation
The digitalisation of earthwork sites into point clouds and 3D models increases data accessibility, facilitates project team collaboration and enables cross-platform compatibility. Point clouds created by photogrammetry software can be seamlessly integrated into BIM software as an as-built BIM model commonly used in civil engineering projects. The cross-platform compatibility increases the accessibility to codes and plugins developed for point cloud manipulation and filtering, such as the CSF, which can be used to perform additional analysis and simulations or even be used with machine learning applications. Additionally, digitalisation also enables stakeholders to visualise and interact with the 3D site models and aid in report and decision-making processes.
5.4. Limitations
Despite demonstrating that UAV photogrammetry-based volume calculations can be highly accurate and efficient, they can be influenced by various sources of errors. UAVs rely on GPS for georeferencing, and inaccuracies in GPS data due to poor satellite coverage or signal interference can lead to the misalignment of the images and 3D model, affecting the volume calculations. If the GCPs used to correct georeferencing are inaccurately placed or measured, this can introduce significant errors in the final volume estimates.
Inaccuracies in camera calibration, such as lens distortion, focal length misrepresentation, or sensor misalignment, can distort the images and negatively impact the resulting 3D model. Another factor that affects the quality of image acquired is lighting. Poor lighting (e.g., shadows, glare, or low light) and adverse weather conditions (e.g., wind, rain, or fog) can affect image quality, leading to distortions in the 3D model and impacting the volume calculation. Dense vegetation, moving objects, or physical obstacles can obscure the UAV’s view, leading to missing data in the point cloud and an incomplete model, resulting in volume errors. This was observed at this site, where construction activities are ongoing.
Surface characteristics and terrain complexity—such as reflective or transparent surfaces, rough or complex terrain, or a lack of surface texture or features—would also affect the quality of 3D reconstruction and volume calculations.
In order to minimise these errors, high-accuracy GPS systems with good satellite coverage or minimal signal interference are essential for the more accurate alignment of the images and 3D model. The camera should also be properly calibrated. Highly reflective or transparent surfaces, as well as ground areas lacking texture or features, can be mitigated by conducting the survey during less-sunny periods of the day or by adding more features or objects to the surveyed area. Sufficient ground control points are also necessary for better georeferencing and ensure accurate GCP measurement.
6. Conclusions
This study discusses the feasibility and improvements to productivity when using UAV photogrammetry for earthwork volume estimation in a complex urban earthwork site in Singapore. The models created with UAV photogrammetry are within the 5% tolerance of accepted error required by site stakeholders. With the establishment of a highly automated workflow for the acquisition and processing of UAV photogrammetry data, the generation of site models becomes more efficient and consistent, reducing variability that may arise from the assumptions made when using the truck-counting method. Such a method is also less susceptible to obstructions on-site and has fewer occlusion issues, less on-site man-hour requirements, and lower latency than other estimation methods. However, the filtering of unwanted objects on a complex earthwork site is still insufficient. The development of a specialised filtering algorithm for use at construction sites that can remove structures with extensive planar surfaces would help further reduce the effort required in the manual point-cloud cleaning process at this particular site. While the use of technologies like UAV photogrammetry requires staff with knowledge of the tools, the benefits they can bring about are immense. The adoption and integration of digital technologies will pave the way to better data accessibility, facilitating project team collaboration, cross-platform collaboration that enables the use of many analysis tools, and the improved monitoring and documentation of site progress for better accountability.
Author Contributions
Conceptualisation, S.C.C. and K.-W.Y.; methodology, S.C.C. and K.-W.Y.; software, S.C.C., J.Y., S.W. and A.T.B.S.; validation, S.C.C., J.Y., S.W. and A.T.B.S.; writing—original draft preparation, S.C.C. and S.W.; writing—review and editing, S.C.C.; supervision, S.C.C. and K.-W.Y.; project administration, S.C.C.; funding acquisition, S.C.C. and K.-W.Y. All authors have read and agreed to the published version of the manuscript.
Funding
This research was funded by the Singapore Land Transport Authority, through the Land Transport Innovation Fund FY18/24, under the project titled LTA Drone Trial (Phase 3)—Remote Sensing Photogrammetry for Excavation Volume Calculation, with Post-Building Information Modelling (BIM) Integration.
Data Availability Statement
The original contributions presented in this study are included in the article. Further inquiries can be directed to the corresponding author(s).
Conflicts of Interest
The authors declare no conflicts of interest. The funders had no role in the design of the study; in the collection, analyses, or interpretation of data; in the writing of the manuscript; or in the decision to publish the results.
References
- Department of Statistics (DoS). Population and Population Structure. 2024. Available online: https://www.singstat.gov.sg/find-data/search-by-theme/population/population-and-population-structure/latest-data (accessed on 22 February 2025).
- Hwang, B.-G.; Ngo, J.; Her, P.W.Y. Integrated Digital Delivery: Implementation status and project performance in the Singapore construction industry. J. Clean. Prod. 2020, 262, 121396. [Google Scholar] [CrossRef]
- Oesterreich, T.D.; Teuteberg, F. Understanding the implications of digitisation and automation in the context of Industry 4.0: A triangulation approach and elements of a research agenda for the construction industry. Comput. Ind. 2016, 83, 121–139. [Google Scholar] [CrossRef]
- Cheng, J.-c.; Jiang, L.-j. Accuracy comparison of roadway earthwork computation between 3D and 2D methods. Procedia-Soc. Behav. Sci. 2013, 96, 1277–1285. [Google Scholar] [CrossRef]
- Wang, X. Assessing the Application of the Unmanned Aerial Systems (UAS) in Earthwork Volume Measurement. Doctoral Dissertation, University of Kentucky, Lexington, KY, USA, 2018. [Google Scholar]
- Wang, X.; Al-Shabbani, Z.; Sturgill, R.; Kirk, A.; Dadi, G.B. Estimating Earthwork Volumes Through Use of Unmanned Aerial Systems. Transp. Res. Rec. 2017, 2630, 1–8. [Google Scholar] [CrossRef]
- Chen, Z.; Zhang, B.; Han, Y.; Zuo, Z.; Zhang, X. Modeling accumulated volume of landslides using remote sensing and DTM data. Remote Sens. 2014, 6, 1514–1537. [Google Scholar] [CrossRef]
- Chian, S.C.; Yang, J. Use of Photogrammetry for Ground Settlement Measurement. In Proceedings of the 19th International Conference on Soil Mechanics and Geotechnical Engineering (19ICSMGE), Seoul, Republic of Korea, 17–21 September 2017. [Google Scholar]
- Nishiyama, S.; Minakata, N.; Kikuchi, T.; Yano, T. Improved digital photogrammetry technique for crack monitoring. Adv. Eng. Inform. 2015, 29, 851–858. [Google Scholar] [CrossRef]
- Koch, C.; Georgieva, K.; Kasireddy, V.; Akinci, B.; Fieguth, P. A review on computer vision based defect detection and condition assessment of concrete and asphalt civil infrastructure. Adv. Eng. Inform. 2015, 29, 196–210. [Google Scholar]
- Radopoulou, S.C.; Brilakis, I. Patch detection for pavement assessment. Autom. Constr. 2015, 53, 95–104. [Google Scholar] [CrossRef]
- Arango, C.; Morales, C. Comparison between multicopter UAV and total station for estimating stockpile volumes. Remote Sens. Spat. Inf. Sci. 2015, 40, 131. [Google Scholar] [CrossRef]
- Fawzy, H. The accuracy of determining the volumes using close range photogrammetry. IOSR J. Mech. Civ. Eng. 2015, 12, 10–15. [Google Scholar]
- Hugenholtz, C.H.; Walker, J.; Brown, O.; Myshak, S. Earthwork volumetrics with an unmanned aerial vehicle and softcopy photogrammetry. J. Surv. Eng. 2015, 141, 06014003. [Google Scholar]
- Siebert, S.; Teizer, J. Mobile 3D mapping for surveying earthwork projects using an Unmanned Aerial Vehicle (UAV) system. Autom. Constr. 2014, 41, 1–14. [Google Scholar] [CrossRef]
- Yakar, M.; Yilmaz, H. Using in volume computing of digital close range photogrammetry. Remote Sens. Spat. Inf. Sci. 2008, 37, 119–124. [Google Scholar]
- Broersen, T.; Peters, R.; Ledoux, H. Automatic identification of watercourses in flat and engineered landscapes by computing the skeleton of a lidar point cloud. Comput. Geosci. 2017, 106, 171–180. [Google Scholar] [CrossRef]
- Ben-Shabat, Y.; Lindenbaum, M.; Fischer, A. 3DmFV: Three-dimensional point cloud classification in real-time using convolutional neural networks. IEEE Robot. Autom. Lett. 2018, 3, 3145–3152. [Google Scholar] [CrossRef]
- Zhang, W.; Qi, J.; Wan, P.; Wang, H.; Xie, D.; Wang, X.; Yan, G. An easy-to-use airborne LiDAR data filtering method based on cloth simulation. Remote Sens. 2016, 8, 501. [Google Scholar] [CrossRef]
- CloudCompare. User Manual Version 2.6.1 2015. Available online: https://www.cloudcompare.org/doc/qCC/CloudCompare%20v2.6.1%20-%20User%20manual.pdf (accessed on 15 March 2025).

Disclaimer/Publisher’s Note: The statements, opinions and data contained in all publications are solely those of the individual author(s) and contributor(s) and not of MDPI and/or the editor(s). MDPI and/or the editor(s) disclaim responsibility for any injury to people or property resulting from any ideas, methods, instructions or products referred to in the content. |
© 2025 by the authors. Licensee MDPI, Basel, Switzerland. This article is an open access article distributed under the terms and conditions of the Creative Commons Attribution (CC BY) license (https://creativecommons.org/licenses/by/4.0/).