Article

Seismic Response Analysis of Double-Layer Isolation Structures in High-Rise Buildings

1
College of Civil Engineering, Southwest Forestry University, Kunming 650024, China
2
International College, Krirk University, Bangkok 10220, Thailand
3
Reconnaissance and Design Institute, Qiantang River Administration, Hangzhou 310016, China
*
Authors to whom correspondence should be addressed.
Buildings 2025, 15(8), 1292; https://doi.org/10.3390/buildings15081292
Submission received: 9 March 2025 / Revised: 3 April 2025 / Accepted: 9 April 2025 / Published: 15 April 2025
(This article belongs to the Section Building Structures)

Abstract

:
(1) Research background: The aim of this study was to investigate the response patterns of double-layer isolation structures under seismic actions. (2) Methods: A numerical model of an 18-story reinforced concrete frame, with a core tube double-layer isolation structure designed using YJK (3.0), was established. Three seismic waves were inputted into the model, and numerical simulations were carried out using the finite element calculation software ABAQUS (2022). Additionally, the seismic responses of different double-layer isolation models were analyzed. (3) Results: The double-layer isolated structure had a significantly prolonged natural vibration period, and the seismic effects were reduced by adding an upper isolation layer. This layer decreased the maximum displacement of the isolation layer and reduced the acceleration response of the superstructure by 16.1% to 53.3%, effectively controlling story shear forces and overturning moments. Compared with inter-story isolation systems, the shear force below the isolation layer can be 1.3~3 times higher in double-layer isolation structures, thereby mitigating threats to equipment and personnel safety. (4) Conclusions: The double-layer isolation structure demonstrated optimal seismic performance when the upper isolation layer was positioned within the bottom one-third of the structure.

1. Introduction

Severe earthquakes worldwide have inflicted immeasurable suffering upon humanity [1,2,3]. Over millennia, humans have been trying to mitigate the damage caused by earthquakes and have created many miraculous structures based on the concept of seismic isolation. The Fogong Temple Pagoda [4], constructed in 1056 and situated in Jiangxi Province, China, stands as the world’s tallest wooden pagoda. It employs 54 varieties of dougong, which can deform and generate friction during an earthquake, thereby dissipating energy. Meanwhile, the columns in the wooden pagoda, which are not completely fixed, are placed directly under the beams, allowing energy to be displaced during seismic events. When an earthquake is too large, a second line of defense is formed by the mud wall in the wooden pagoda, and greater lateral stiffness is provided to resist the earthquake. Due to this fantastic design, the wooden pagoda is still standing. In earthquake-ridden Japan, the five-storied pagoda in Hōryū-ji Temple has remained intact for over 1300 years [5]. This should be attributed to its unique structural design; there is no connection between the adjacent layers in the tower, and when an earthquake occurs, the layers slide relative to each other to dissipate energy. Up to the present day, various seismic disaster prevention and mitigation measures have been developed, especially seismic isolation technology [6,7,8,9]. At present, base isolation technology finds extensive application in practical engineering. The structural isolation system has been proven to be effective in terms of earthquake hazard reduction, leading to a substantial decrease in human casualties.
In building seismic isolation systems, base isolation and inter-story isolation represent the two primary isolation configurations. Through the energy dissipation mechanism of the isolation layer, the transmission of seismic energy to the superstructure can be effectively attenuated, thereby significantly reducing the seismic response of the main structure [10]. However, with the trend in modern buildings moving towards taller structures and having larger height-to-width ratios, conventional single-layer isolation technology is facing increasingly prominent limitations. Firstly, this technology demonstrates inadequate performance in regard to controlling higher mode effects, struggling to effectively mitigate torsional vibrations and whipping effects exacerbated by the increase in the height of buildings. Secondly, research remains insufficient regarding the nonlinear seismic response characteristics of structures with a large height-to-width ratio and the collaborative working mechanisms of multiple isolation layers, with a notable lack of practical engineering validation. More specifically, single-layer isolation exhibits significant deficiencies in adapting to building dimensions; as the structural height of a building increases, the increase in the participation of higher-order modes often induces torsional and bending failures, potentially even leading to overall overturning risks. These technical bottlenecks severely constrain the further development and application of isolation technology in high-rise buildings.
To overcome the limitations of conventional isolation techniques, a dual-layer isolation system integrating the advantages of base isolation and inter-story isolation has emerged. This system adopts an innovative design philosophy based on “segmented isolation + collaborative energy dissipation.” Through the synergistic action of bottom and mid-level isolation layers, the structure is divided into multiple dynamic substructures that absorb long-period and short-period seismic wave energy, respectively. The theory of the double-layer isolation system was first introduced in the Mega-Sub Control method, proposed by Wen-Chyr Chai [11] from the University of California, USA. This theory’s principle involves segmenting the entire structure into multiple substructures. Each substructure, composed of seismic isolation bearings and connected frames, is equivalent to a conventional multi-layer base isolation structure. This approach effectively addresses the issues of torsion and overturning caused by a large height-to-width ratio in high-rise buildings. Later, the concept of segmented isolation, adopted in regard to both base and middle layer isolation, was applied in the seismic reduction control of high-rise buildings by Zhang Ying et al. [12], and some preliminary studies were carried out. Wang Xueqing et al. [13] developed a segmented LRB isolation system for high-rise buildings with large aspect ratios. Marco Zucca et al. analyzed the seismic performance of the Santa Maria Novella Basilica and the Santa Maria Maggiore Basilica using laser scanning and numerical simulations, identifying the main columns in the transept as critically vulnerable components [14], and proposed an optimized TMD design method to effectively enhance the seismic resistance of historic masonry structures [15]. Maurizio Acito and Avni Jain, through the use of finite element analysis, revealed the failure mechanisms of Italian historic buildings (the Finale Emilia Bell Tower and St. Francis Church in Amatrice) when subject to earthquakes, highlighting the key impacts of geometric defects, insufficient material resistance, and site amplification effects [16,17]. Ou Jinping [18] proposed a novel large-displacement friction pendulum structure. This structure uses the structural layer as the sliding surface, and makes the entire structure or a part of it act as the sliding block between the sliding surfaces. By changing the positions and quantities of the isolation layers, a structural system with bottom isolation and multiple isolation layers for the large-displacement friction pendulum has been established. Currently, research on double-layer isolation is in its early stages. The isolation mechanism and seismic response model of this approach significantly diverge from traditional base isolation and inter-layer isolation. Comprehensive exploration is necessary to scrutinize its seismic response model from diverse perspectives, identify novel isolation characteristics, and provide theoretical guidance for practical engineering applications.
Building upon the research process and findings of previous scholars, this paper employs YJK (3.0) for structural design and establishes a numerical model of an 18-story reinforced concrete frame-core tube double-layer isolation structure. The finite element software ABAQUS (2022) is utilized to input three seismic waves for the seismic response analysis of the structure.

2. Numerical Model

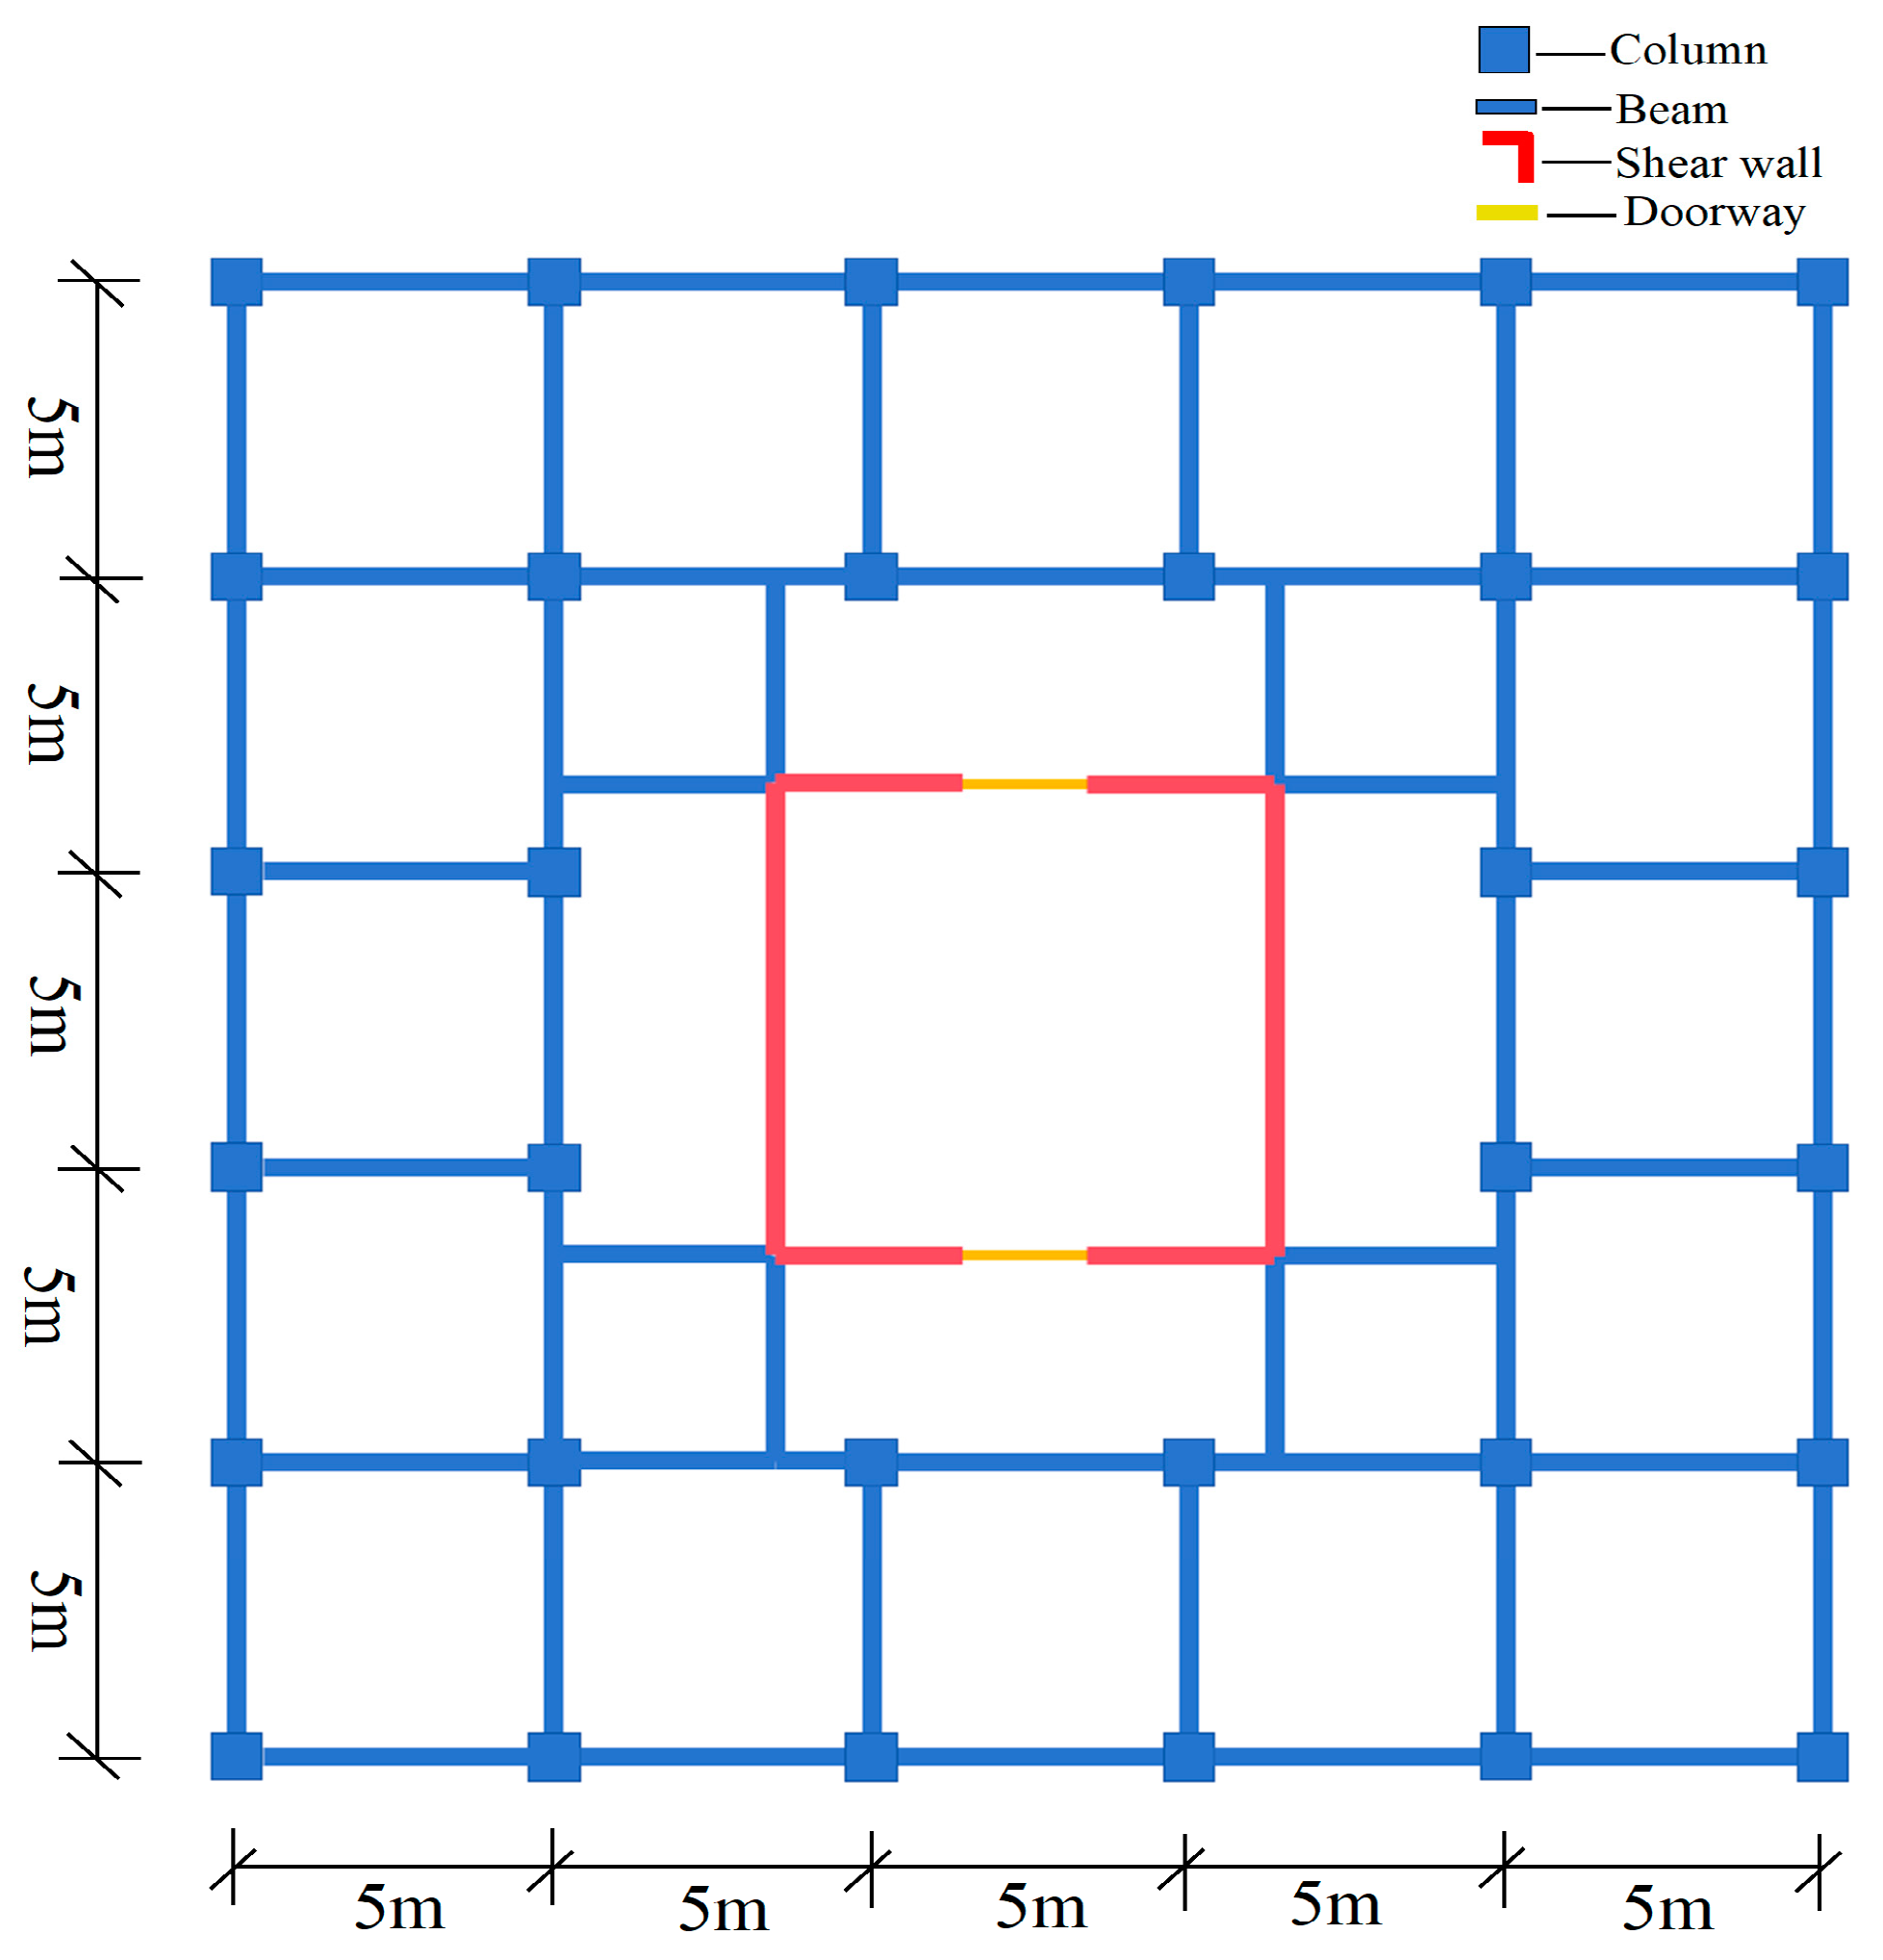
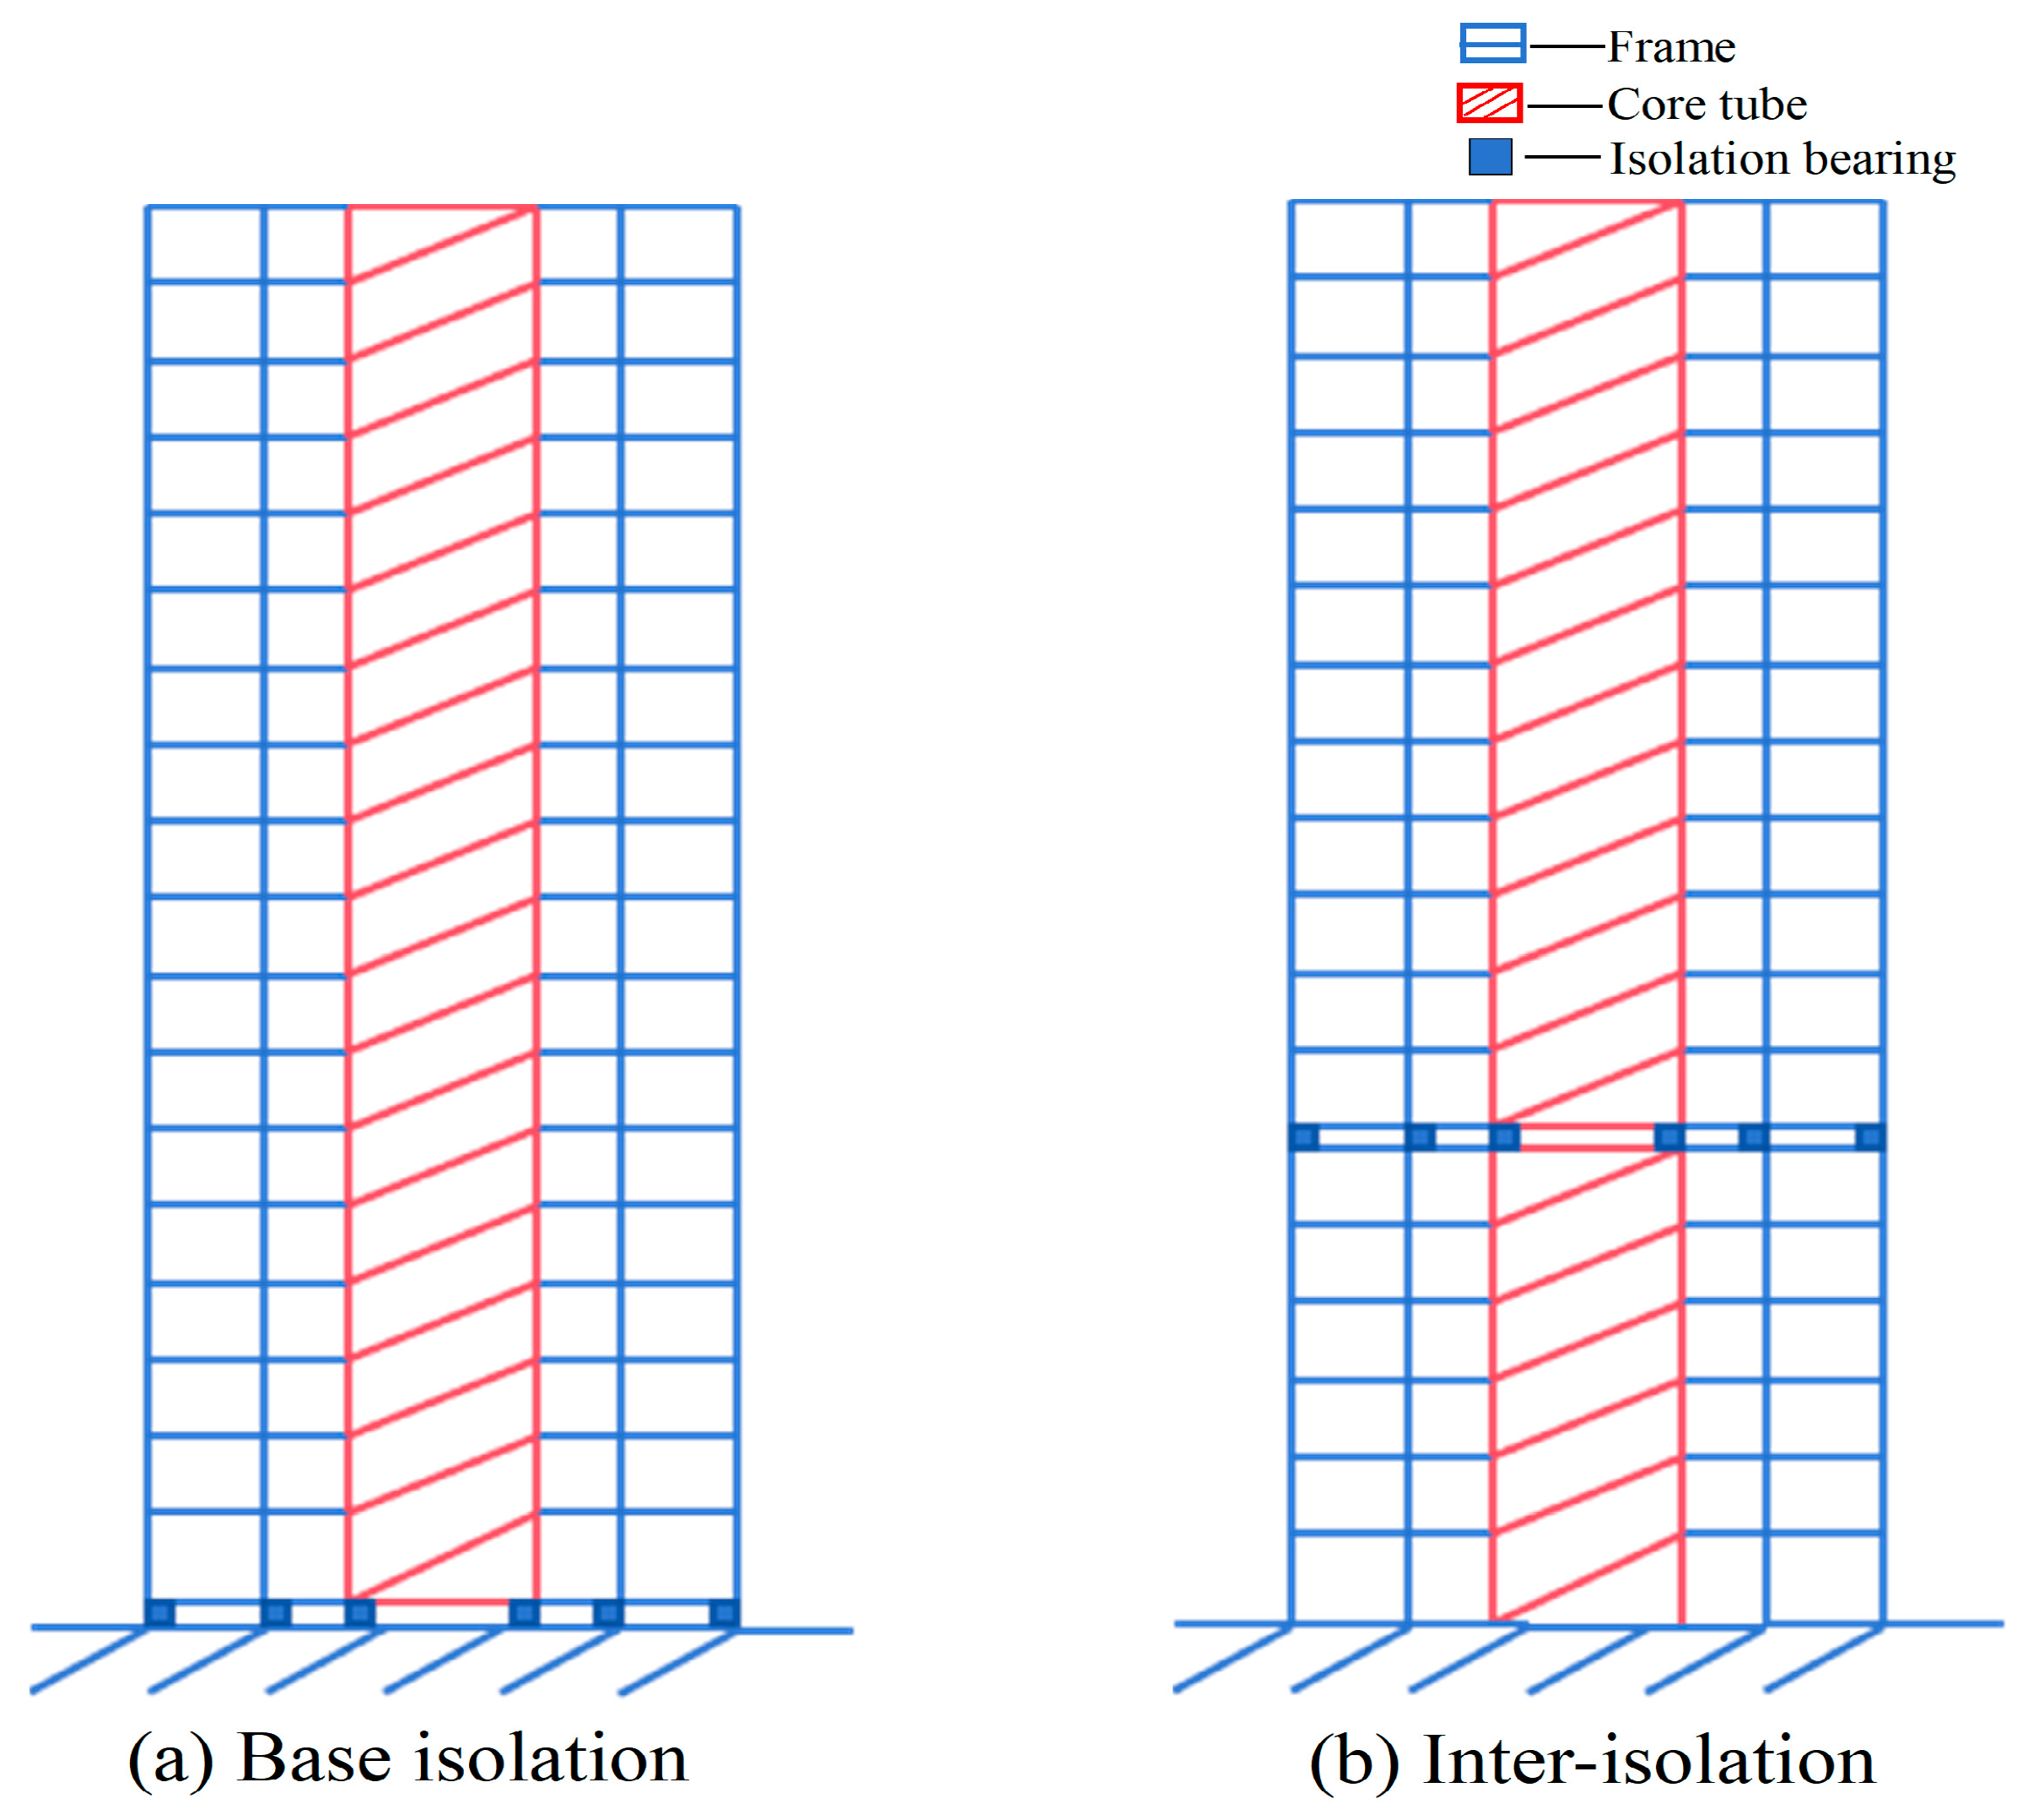
2.1. Engineering Overview

This study investigates an 18-story reinforced concrete frame-core tube structure designed in accordance with China’s Code for Seismic Design of Buildings: GB50011-2010 [19]. The structure has a seismic fortification intensity of 8 degrees, is located on a Class II site, and belongs to the second group in seismic design classification. The first-floor height is 4.2 m, the standard floor height is 3.6 m, and the isolation layer has a height of 1.8 m. The column cross-section measures 800 mm × 800 mm from the 1st to the 10th floor, and 700 mm × 700 mm from the 11th to the 18th floor. The main beams have a cross-section of 300 mm × 700 mm, while the secondary beams measure 300 mm × 500 mm. The thickness of the core tube’s shear wall is 300 mm. The concrete grade for the beams, columns, and walls is C40, while the slab uses C30 concrete. The main reinforcement and stirrups for the beams, columns, shear walls, and slabs are HRB400, with remaining reinforcements made of HPB300. The structural plan is shown in Figure 1.
For comparative analysis, the models in this study are classified into two groups based on the number of isolation layers. The first group consists of single-layer isolation models, which are further categorized into base isolation and inter-story isolation models, as shown in Figure 2. The second group includes double-layer isolation models, featuring isolation configurations at the first and sixth stories, the first and ninth stories, and the first and twelfth stories, as illustrated in Figure 3.

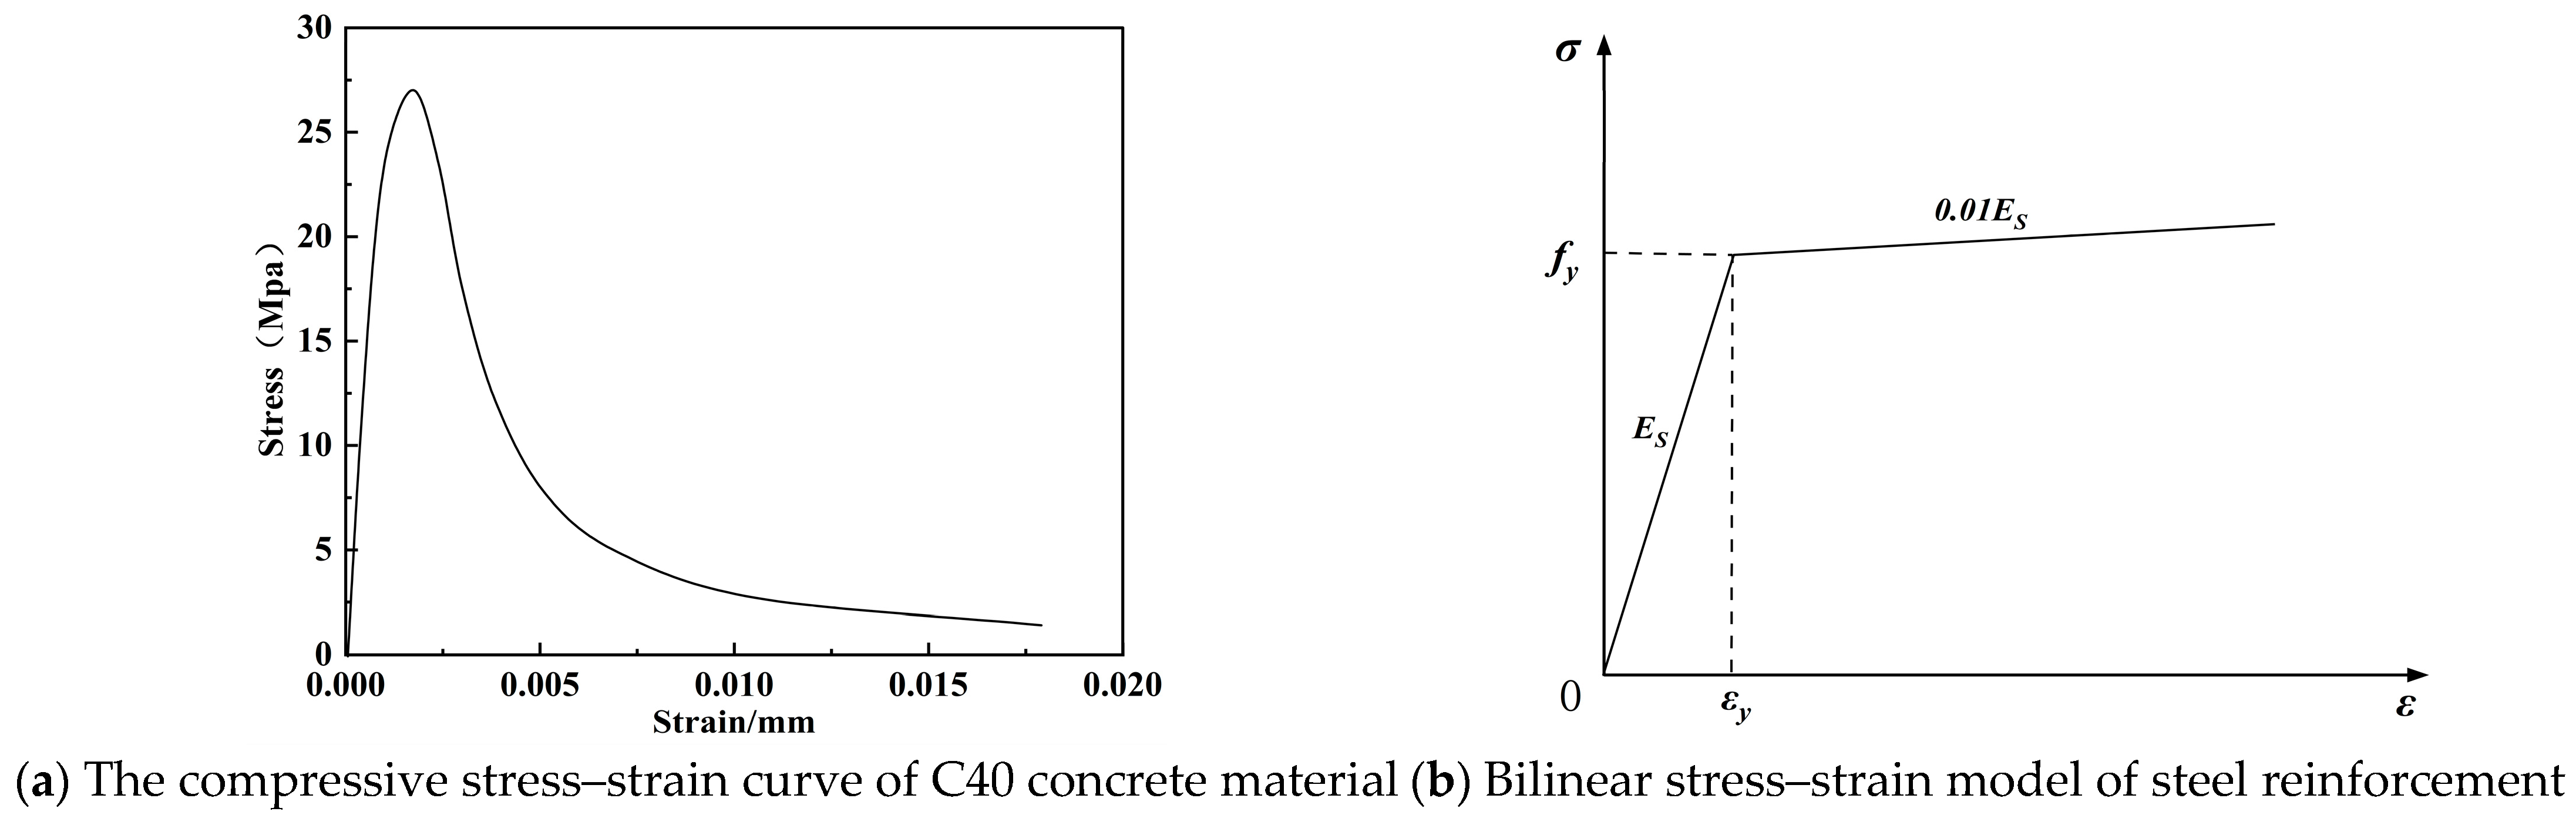
2.2. Numerical Simulation

This study adopts the following modeling approaches for the numerical simulation. In the non-isolated scenario, a fixed-base constraint is applied, while isolation bearings are modeled using a bilinear restoring force model. The effects of soil–structure interaction are neglected. For material constitutive modeling, C40 concrete is characterized using the concrete damaged plasticity (CDP) model in accordance with the Code for Design of Concrete Structures: GB50010-2010 [20], with its nonlinear behavior defined by tensile and compressive stress–strain curves. Reinforcement steel is represented using a bilinear hardening model to capture stiffness degradation and ductility characteristics. Shear walls are simulated using layered shell elements. These modeling strategies ensure both engineering rationality and the reliability of the numerical simulations. The specific material constitutive relationships are shown in Figure 4.

2.3. The Design of the Isolation Layer

This study employs two specifications of lead rubber bearings (LRB600 and LRB700) for the isolation layer design, with their mechanical parameters provided in Table 1. Specifically, LRB700 bearings are used in both base-isolated and inter-story isolated structures. In double-layer isolation systems, the lower isolation layer adopts the same LRB700 configuration as the single-layer systems, while the upper isolation layer utilizes LRB600 bearings. The arrangement of the seismic isolation bearings is illustrated in Figure 5.

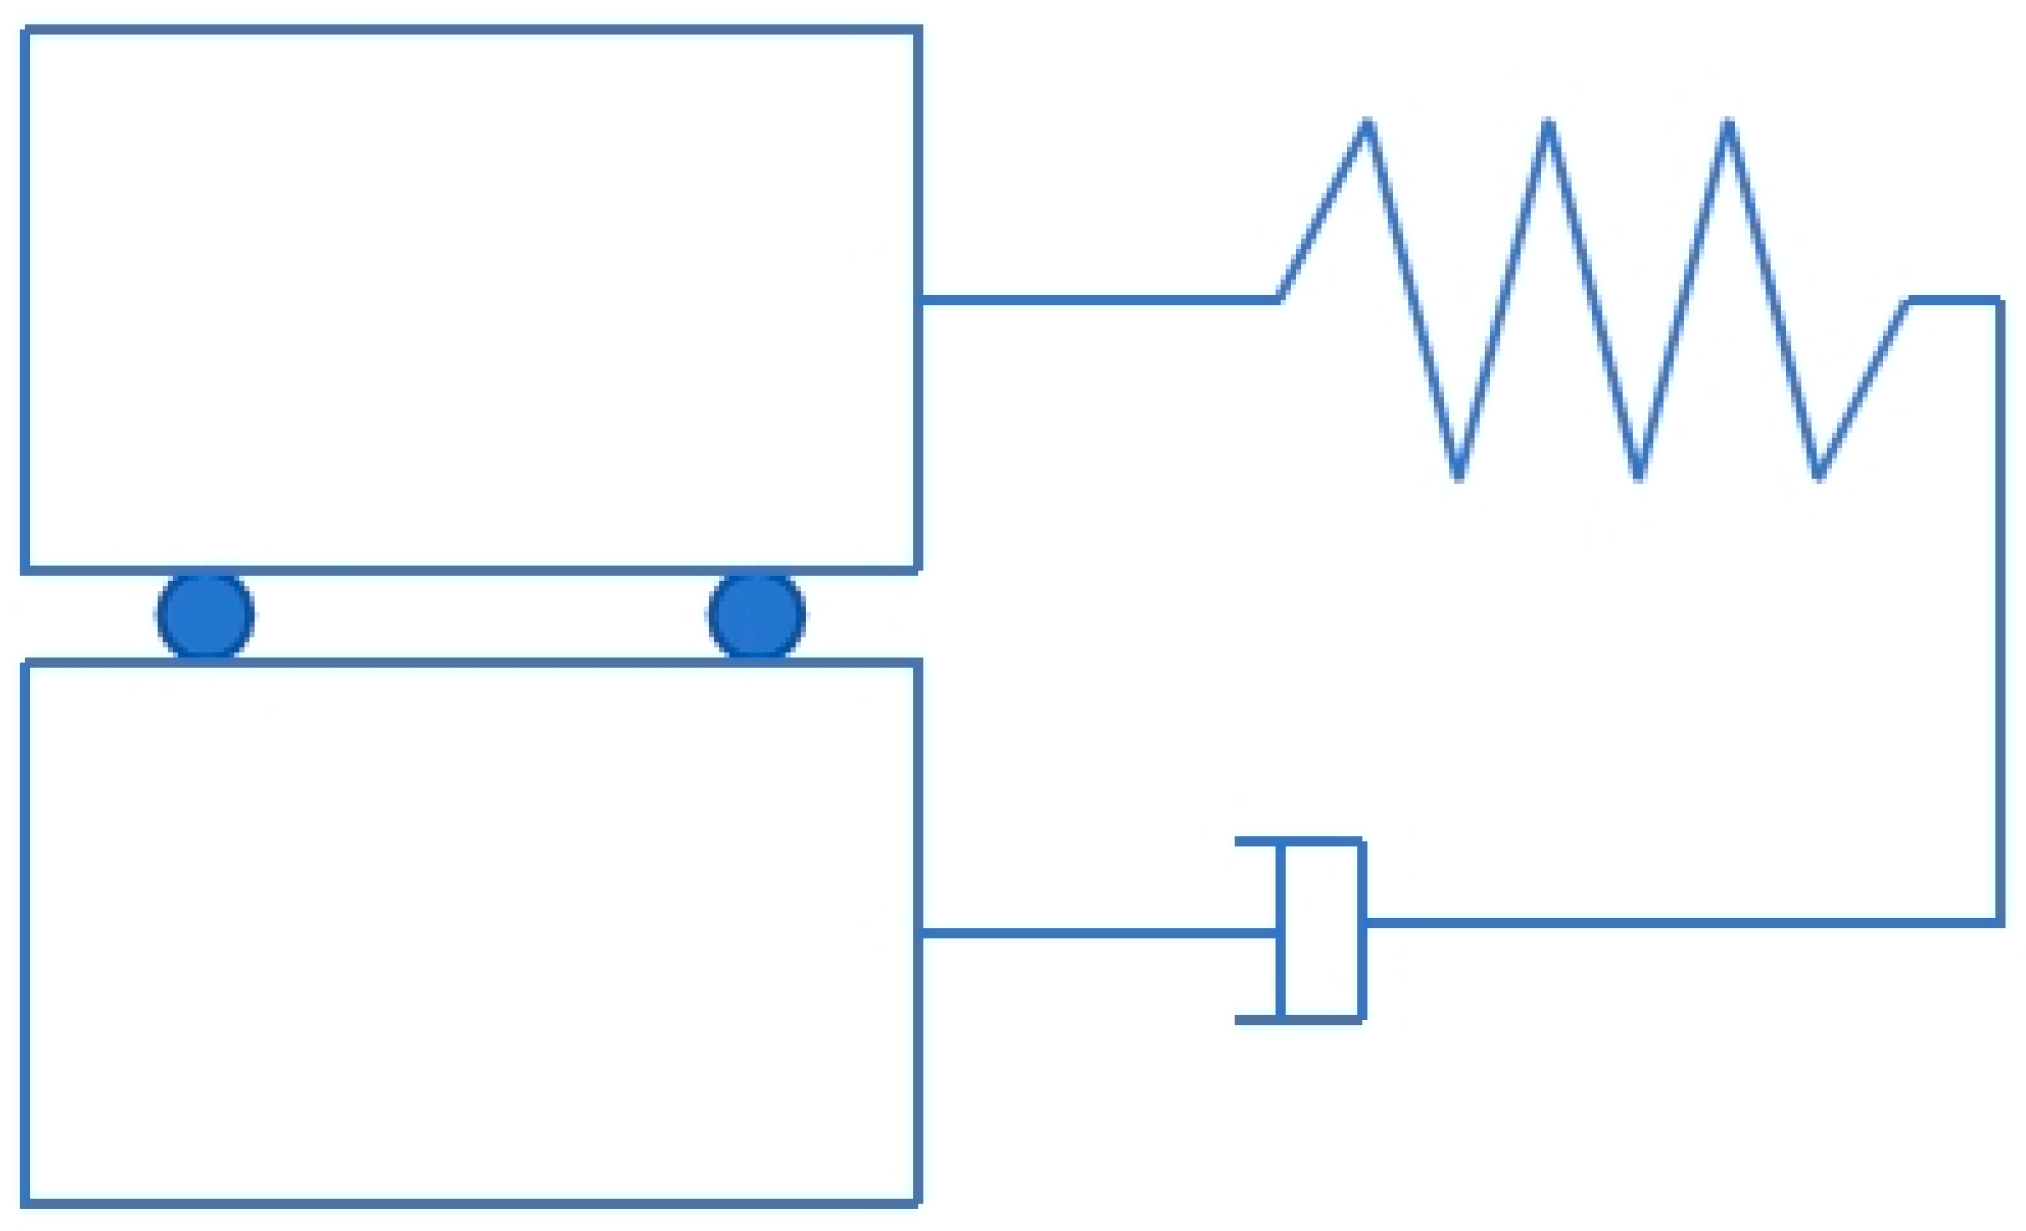
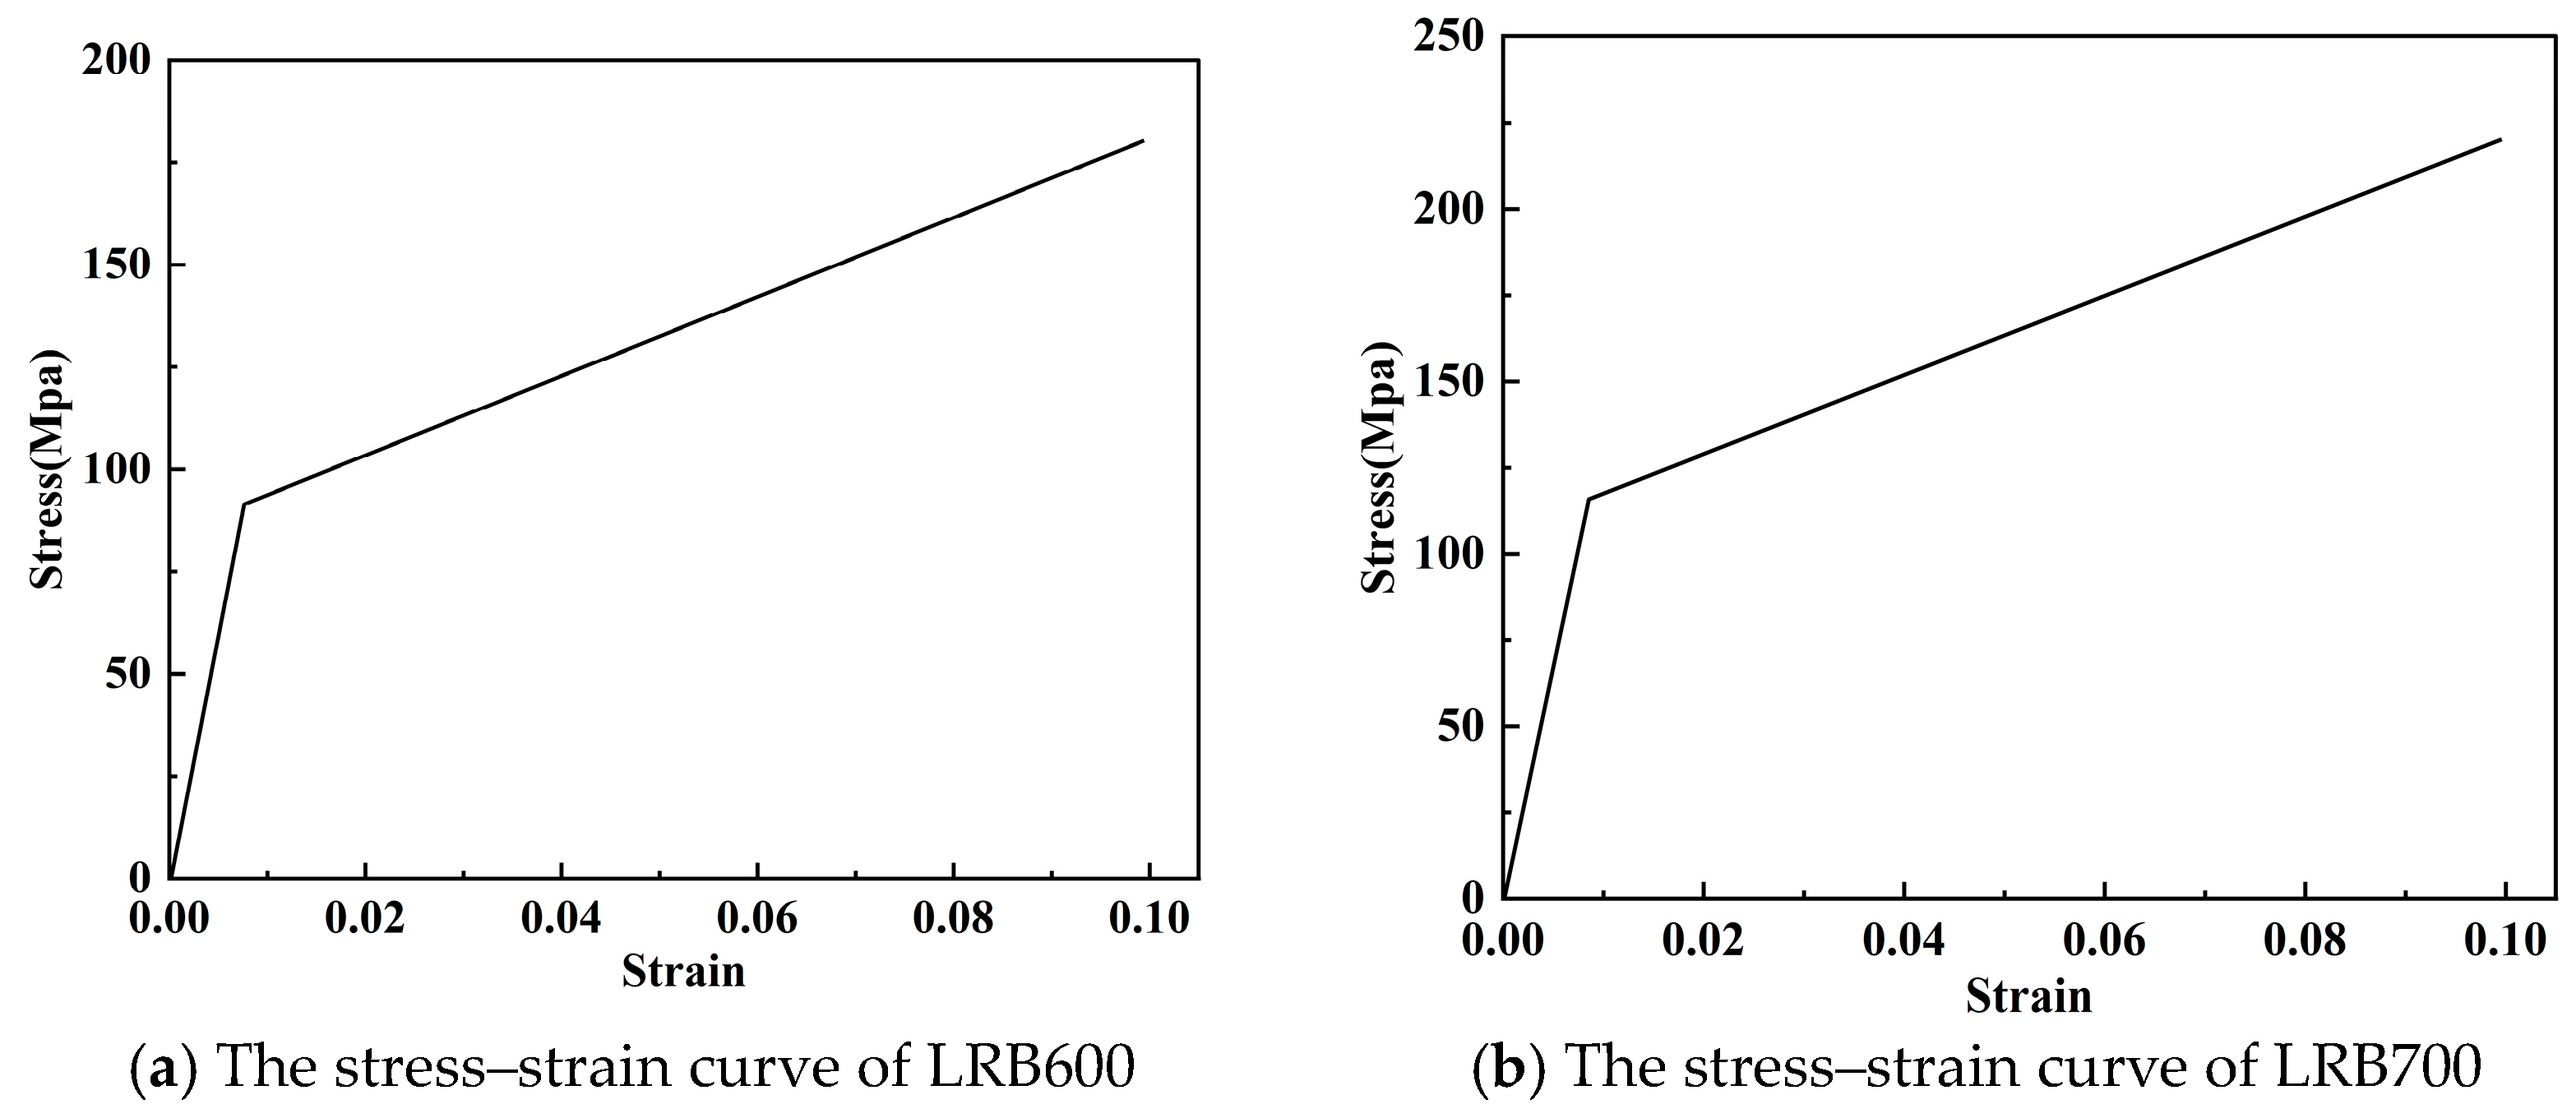
2.4. Simulation of the Seismic Isolation Bearings

Seismic isolation bearings provide lateral stiffness, thereby altering the overall stiffness of the structure. During earthquakes, they effectively dissipate seismic energy through hysteretic deformation. A simplified mechanical model of the isolation bearings is shown in Figure 6.
According to the forced vibration system of the single mass point system [21], the control equation of seismic isolation bearings is established as follows:
m u ¨ + c u ˙ + k u = F
where m denotes the equivalent mass of seismic isolation bearings, u ¨ represents the acceleration of seismic isolation bearings, c presents the equivalent damping coefficient of seismic isolation bearings, u ˙ denotes the velocity of seismic isolation bearings, k signifies the equivalent stiffness of seismic isolation bearings, u indicates the displacement of seismic isolation bearings, and F is the horizontal reaction force of seismic isolation bearings.
Given the minimal mass of seismic isolation bearings, the inertia force they generate is significantly less than the restoring and damping forces of the bearings. Consequently, the control equations for the computational model of seismic isolation bearings can be expressed in simplified form as:
c u ˙ + k u = F
During elasto-plastic time history analysis, the structures exhibit significant nonlinearity. To improve computational efficiency, this study introduces the concept of bearing plastic deformation to simulate the damping effects of seismic isolators. Based on the kinematic hardening rule [22], the mechanical behavior of the isolation bearings is simplified using a linear hardening model. The stress–strain relationship of the isolators is expressed as:
σ = E · ε                       ε ε y σ = α · E · ε + 1 α σ y                       ε > ε y
where α represents the ratio of the shear modulus after yielding to that before yielding, ε y denotes the yield strain, σ y represents the yield stress, and E presents the shear modulus before yielding.
The stress–strain curve of the simplified model of seismic isolation bearing is shown in Figure 7.

2.5. Modal Analysis

According to Zhao et al. [10], the modal period characteristics of seismic isolation structures are primarily defined by the translational motion of the superstructure relative to the ground, with deformation concentrated within the isolation layer. This configuration significantly lengthens the vibration period of the superstructure and markedly reduces acceleration responses, causing the structural behavior to resemble that under static loading. When the isolation layer functions as a separator, the base shear of the structure is largely governed by the restoring force generated through bearing deformation [23]. A comparative analysis of base isolation, inter-story isolation, and double-layer isolation systems (Table 2) reveals that the double-layer isolation configuration, by introducing two isolation layers within the main structure, achieves a further reduction in overall stiffness and a greater extension of the natural vibration period, thereby more effectively mitigating seismic effects. Notably, as the intermediate isolation layer shifts upward (e.g., from the 1&6 to the 1&12 configuration), the structure undergoes significant stiffness redistribution. The 1&12 system, with isolation layers located at both the bottom and near the top, spanning the widest range, not only retains the advantage of extended vibration periods but also substantially enhances overall flexural stiffness. This configuration more effectively suppresses higher-order modes, establishes a dual-path energy dissipation mechanism, and optimizes mass–stiffness matching, resulting in smaller displacement responses compared to the 1&6 and 1&9 systems.

2.6. Damping of the Upper Structure

2.6.1. Rayleigh Damping Model

Based on the Code for Seismic Design of Buildings: GB50011-2010 [19], this study adopts Rayleigh damping to calculate structural damping. In this approach, the damping matrix [C] is defined as a linear combination of the mass matrix [M] and the stiffness matrix [K]. During the solution process, the values of the damping matrix [C] remain constant and do not vary as the analysis progresses.
C = α M + β K
The mass damping coefficient α and the stiffness damping coefficient β can be calculated using the following two equations:
α = 2 ω i ω j ξ i ω j ξ j ω i ω j 2 ω i 2 β = 2 ξ i ω j ξ j ω i ω j 2 ω i 2
where ω i   a n d   ω j are the frequency values corresponding to the two periods, respectively; and ξ i and ξ j represent the damping ratios of these two corresponding periods, respectively.
To meet the requirements for damping coefficient parameters in this paper, the calculation equation for the simplified damping coefficient is introduced as follows:
α = 4 π f i f j ξ f i + f j β = ξ π f i + f j
where f i denotes the natural frequency of the i t h order type, f j indicates the natural frequency of the j t h order type, and ξ represents the damping ratio of the structure.
Beyond Rayleigh damping, structural systems also incorporate material hysteretic damping and joint frictional damping mechanisms.

2.6.2. Other Damping Mechanisms

In addition to Rayleigh damping, the structure contains the following significant damping mechanisms [24]:
  • Material Hysteretic Damping
Concrete Stiffness Degradation:
K ε = K 0 1 β ε ε 0 n
where K 0 denotes initial stiffness (KN/m); β represents stiffness degradation coefficient (typical range: 0.2–0.5); ε indicates instantaneous strain amplitude; ε 0 presents reference strain (conventionally taken as 60% of peak strain); and n denotes degradation exponent (recommended range: 1.5–2.5).
Steel Plastic Energy Dissipation:
W P = α σ y ε P
where α denotes cumulative plastic strain coefficient (recommended range: 0.12–0.18); σ y indicates yield stress (MPa); ε P represents accumulated plastic strain.
2.
Frictional Damping at Joints
Coulomb Friction Model:
F f = μ N · s g n ( ϑ )
where μ represents dynamic friction coefficient (steel-to-steel interface: 0.15–0.25, concrete-to-steel interface: 0.3–0.5); N represents normal contact force (KN); ϑ signifies sliding velocity (m/s); and s g n ( ϑ ) is signum function (it determines force direction relative to velocity vector).
Velocity-Dependent Friction:
F f = μ s μ k e c ϑ N · s g n ( ϑ )
where μ s denotes static friction coefficient; μ k represents kinetic friction coefficient, μ k μ s ; and c indicates velocity decay parameter (1–10 s/m).

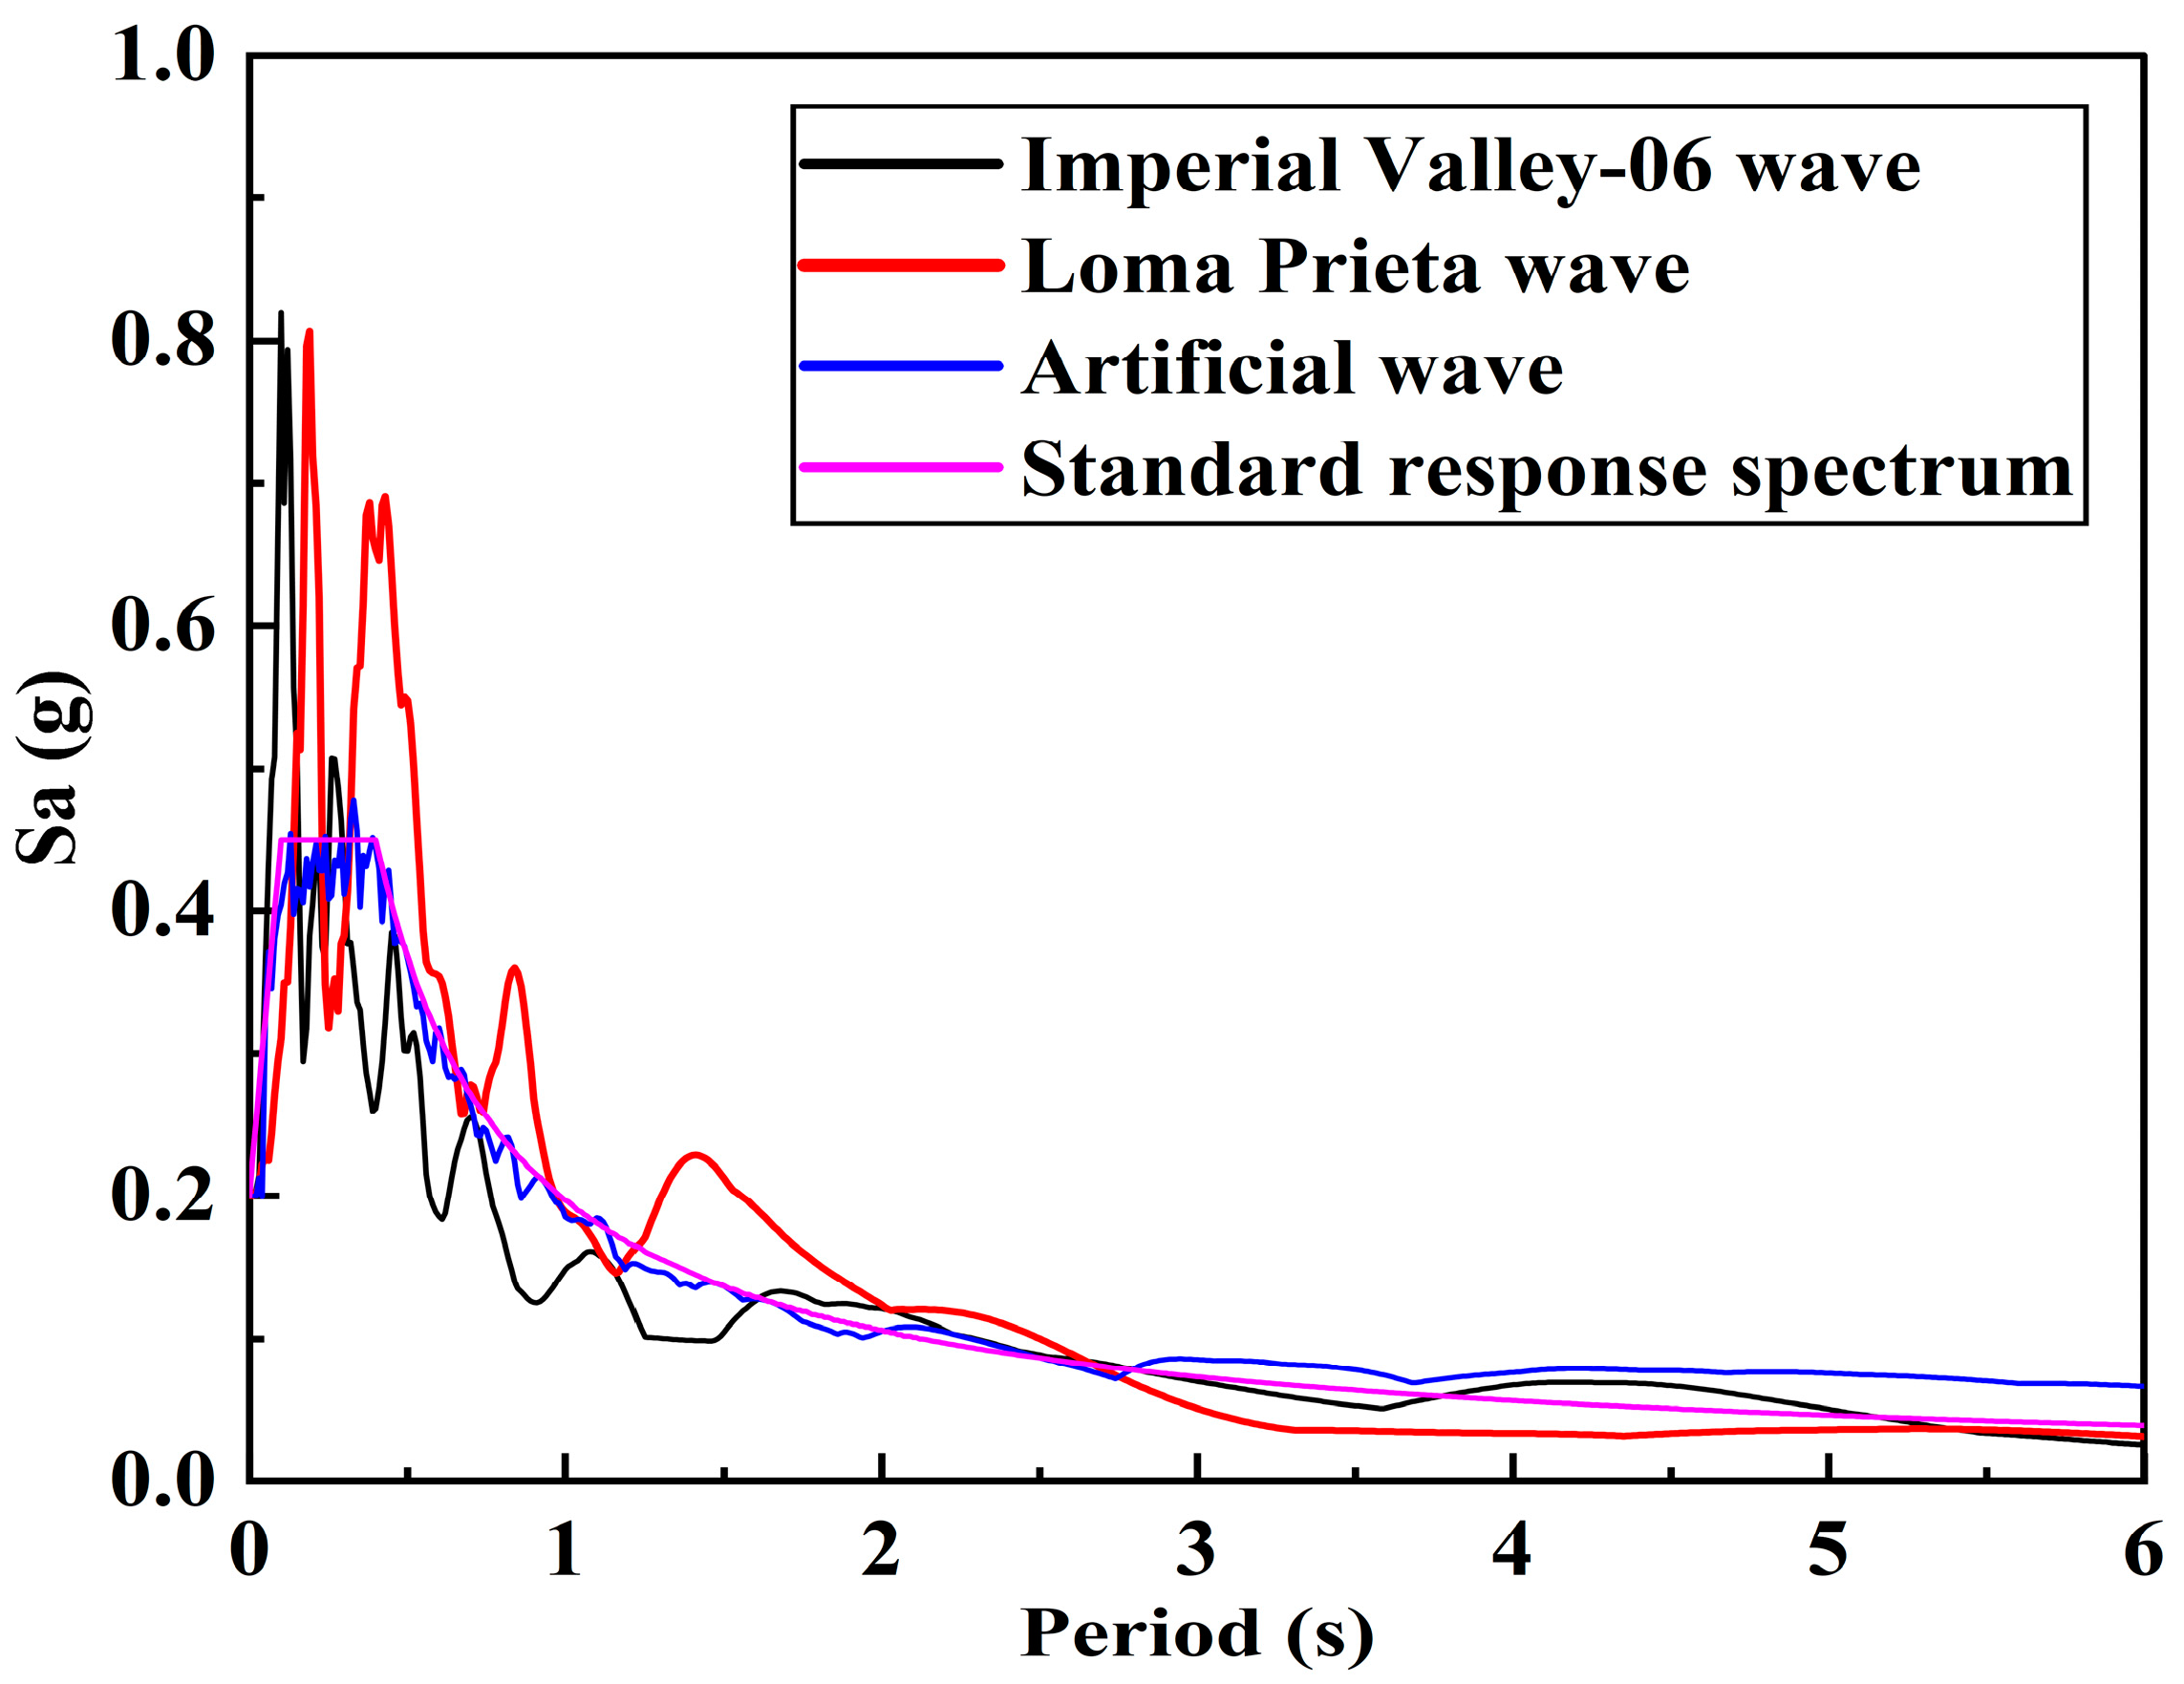
2.7. Selection of Seismic Waves

To ensure the rationality and engineering applicability of seismic wave selection, this study takes into account regional site characteristics (e.g., high-frequency components for hard soil/rock sites versus long-period components for soft soil/alluvial basins), the influence of epicentral distance (e.g., pulse-like motions for near-fault regions versus broad-frequency vibrations for far-field regions), and duration characteristics (e.g., long-duration waves for subduction zones versus short-duration, high-energy waves for strike-slip faults). Particular emphasis is placed on structural ductility, cumulative damage, and the shear resistance of non-structural components. In compliance with the Code for Seismic Design of Buildings: GB50011-2010 [19] and informed by recommendations from the Minimum Design Loads for Buildings and Other Structures [25], three seismic waves are selected: two natural waves and one artificial wave. Two natural seismic waves, which meet the requirements for the building’s main period and the predominant period of the site, are chosen from the seismic records collected by the Pacific Earthquake Engineering Research Center [26]. Additionally, an artificial wave is synthesized to match the target response spectrum based on the design spectrum. The basic details of the selected seismic records are shown in Table 3, and the corresponding acceleration response spectrum is presented in Figure 8. All three selected waves comply with the code requirements for spectral compatibility and statistical representativeness, effectively covering both real ground motion characteristics and design spectrum matching needs. This selection provides a reliable foundation for the seismic analysis of isolated structures.

3. Elasto-Plastic Time History Analysis of Different Isolation Models

In accordance with the Code for Seismic Design of Buildings: GB50011-2010 [19], the peak accelerations of the three seismic waves are adjusted to 400 gal, which corresponds to the peak acceleration for the basic seismic intensity of 8 degrees under rare earthquake conditions. The adjustment process begins by extracting the original PGA values from the seismic records (e.g., 341.7 gal for the El-Centro wave), followed by applying a scaling factor (target PGA/original PGA, e.g., 1.17 for the El-Centro wave) to linearly scale the entire time history, while preserving the waveform and spectral characteristics. Post-adjustment verification includes ensuring spectral compatibility (i.e., the response spectrum should envelope the code-specified spectrum within the structure’s fundamental period range) and energy conservation (the Arias intensity should change by the square of the scaling factor). In practice, the ABAQUS software is employed for amplitude processing, ensuring that all three seismic waves (e.g., the Imperial Valley-06 wave, with a scaled PGA of 400 gal and a 30% increase in Arias intensity) meet the 400 gal input requirement while maintaining compatibility with the elastoplastic model of the isolation bearings. Typical adjustment data indicate that natural waves with original PGAs of 350–380 gal require scaling factors of 1.05–1.14, while the artificial wave, designed at 400 gal, requires no adjustment.

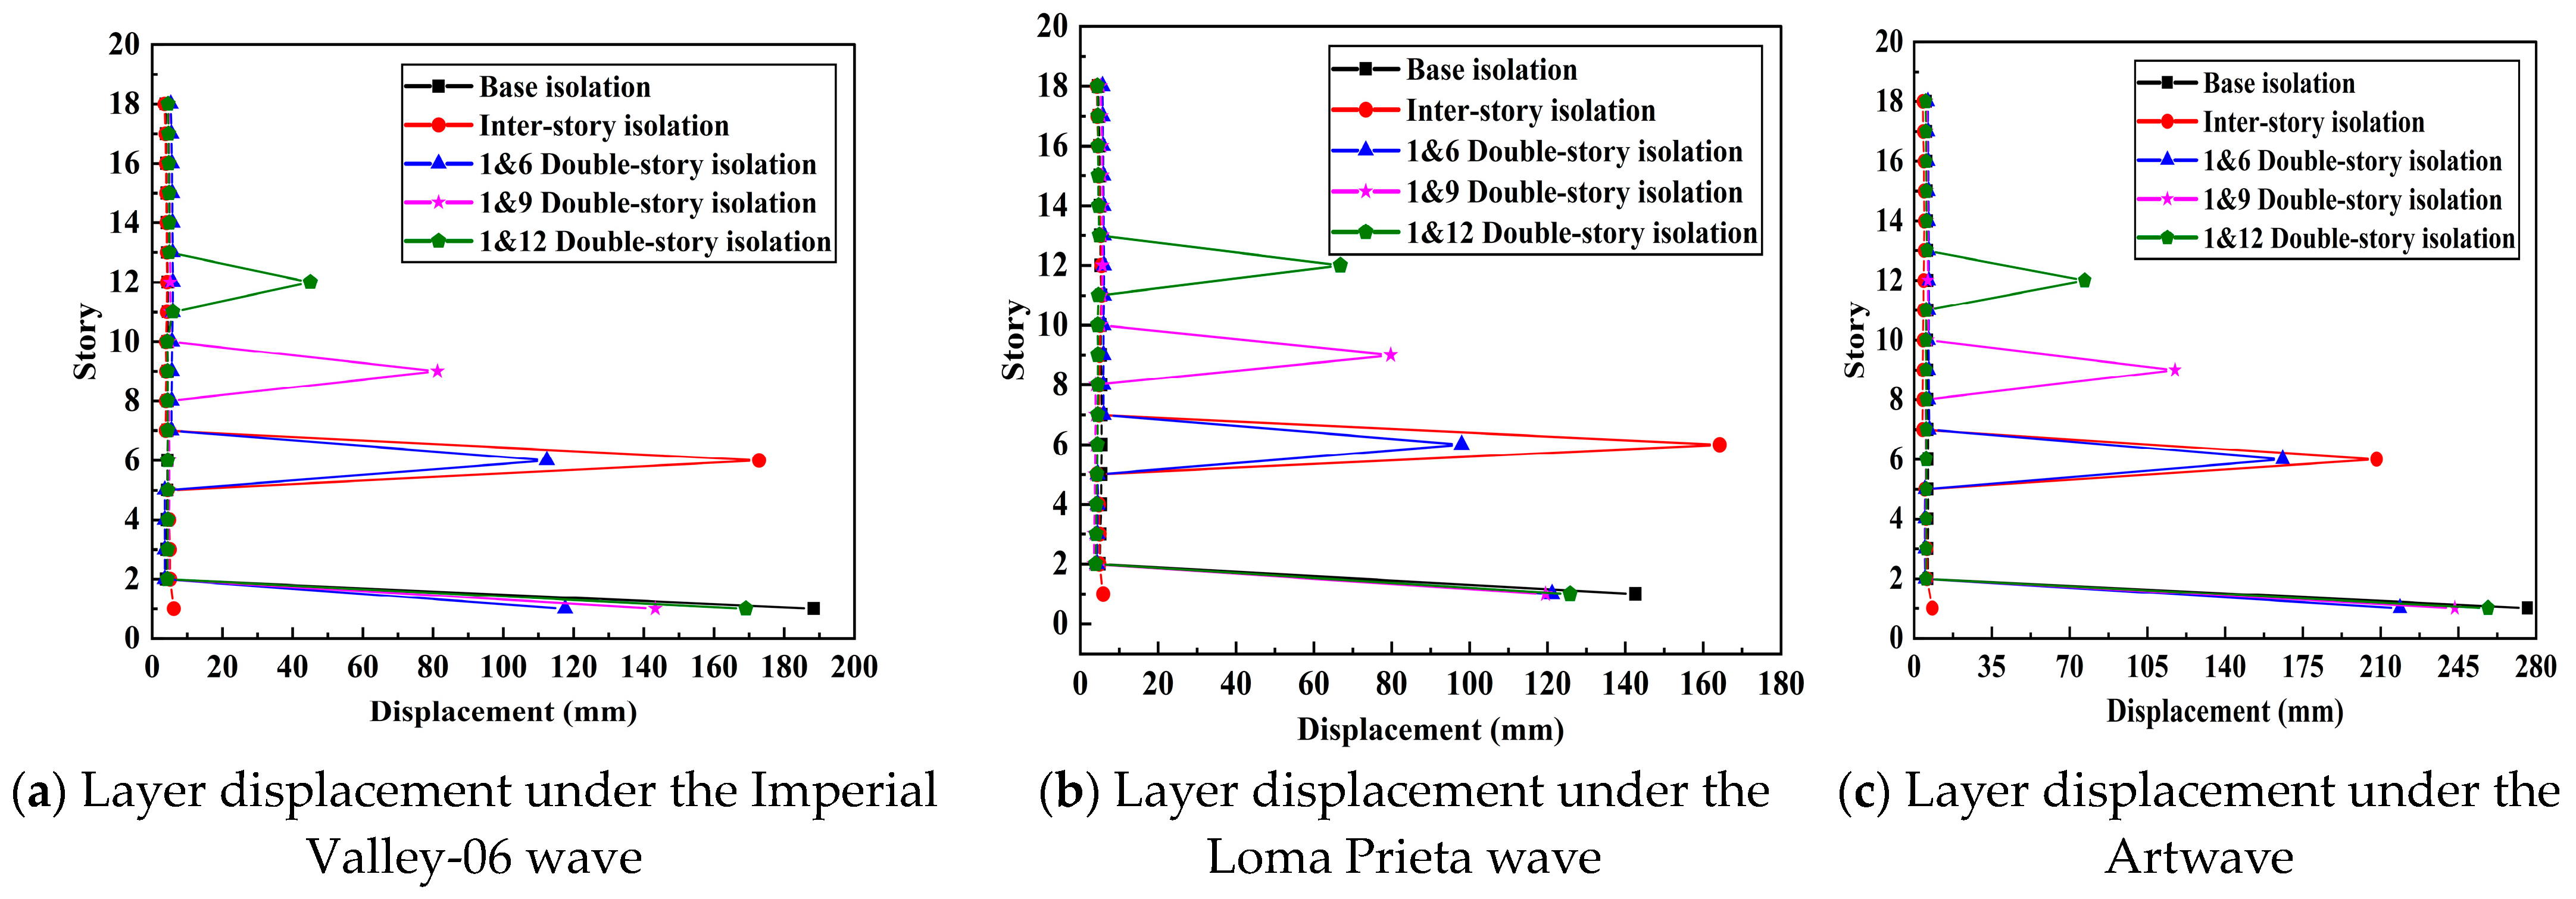
3.1. Inter-Story Displacement

As shown in Figure 9, under rare earthquake conditions, the displacements of non-isolated layers in various types of isolation structures remain within acceptable limits. This clearly demonstrates that the isolation layers effectively reduce seismic force transmission to superstructures during extreme seismic events [27]. Figure 10 illustrates that, among the different isolation schemes, inter-story isolation exhibits the most significant vibration reduction effect, achieving an average mitigation efficiency of 96.5%. Among dual-layer isolation systems, the 1&6 configuration provides the optimal seismic performance, reducing displacement response by 24.6% compared to base isolation.
Due to its relatively low stiffness, the isolation layer causes all structures to experience a sudden shift in inter-layer displacement, concentrating this displacement at the isolation layer. According to the Code for Seismic Design of Buildings: GB50011-2010 [19], the maximum horizontal displacement of each seismic isolation bearing in the isolation layer under rare earthquake conditions should be less than 0.55 times the effective diameter of the seismic isolation bearings, and less than 3 times the total thickness of the rubber layer. For the LRB700, this condition is specified as follows:
L m a x = 0.55 D , 3 T r = 385   mm
That is, for the LRB600:
L m a x = 0.55 D , 3 T r = 330   m m
where L m a x denotes the maximum permissible deformation of the isolation bearing, D characterizes the effective deformation diameter of the bearing, and T r represents the total thickness of the rubber isolation layers.
As shown in Table 4, the isolation layer displacements for all five structural configurations comply with the code requirements. Comparative analysis indicates that the displacements of the isolators in single-layer isolation systems, such as base isolation and inter-story isolation, are significantly larger than those in the three double-layer isolation configurations. In the double-layer isolation system, the introduction of the upper isolation layer modifies the displacement distribution, reducing the displacement of the lower isolation layer and, consequently, decreasing the risk of excessive deformation in the isolation bearings. It is important to note that as the position of the upper isolation layer moves higher, its effect on regulating displacement gradually diminishes.

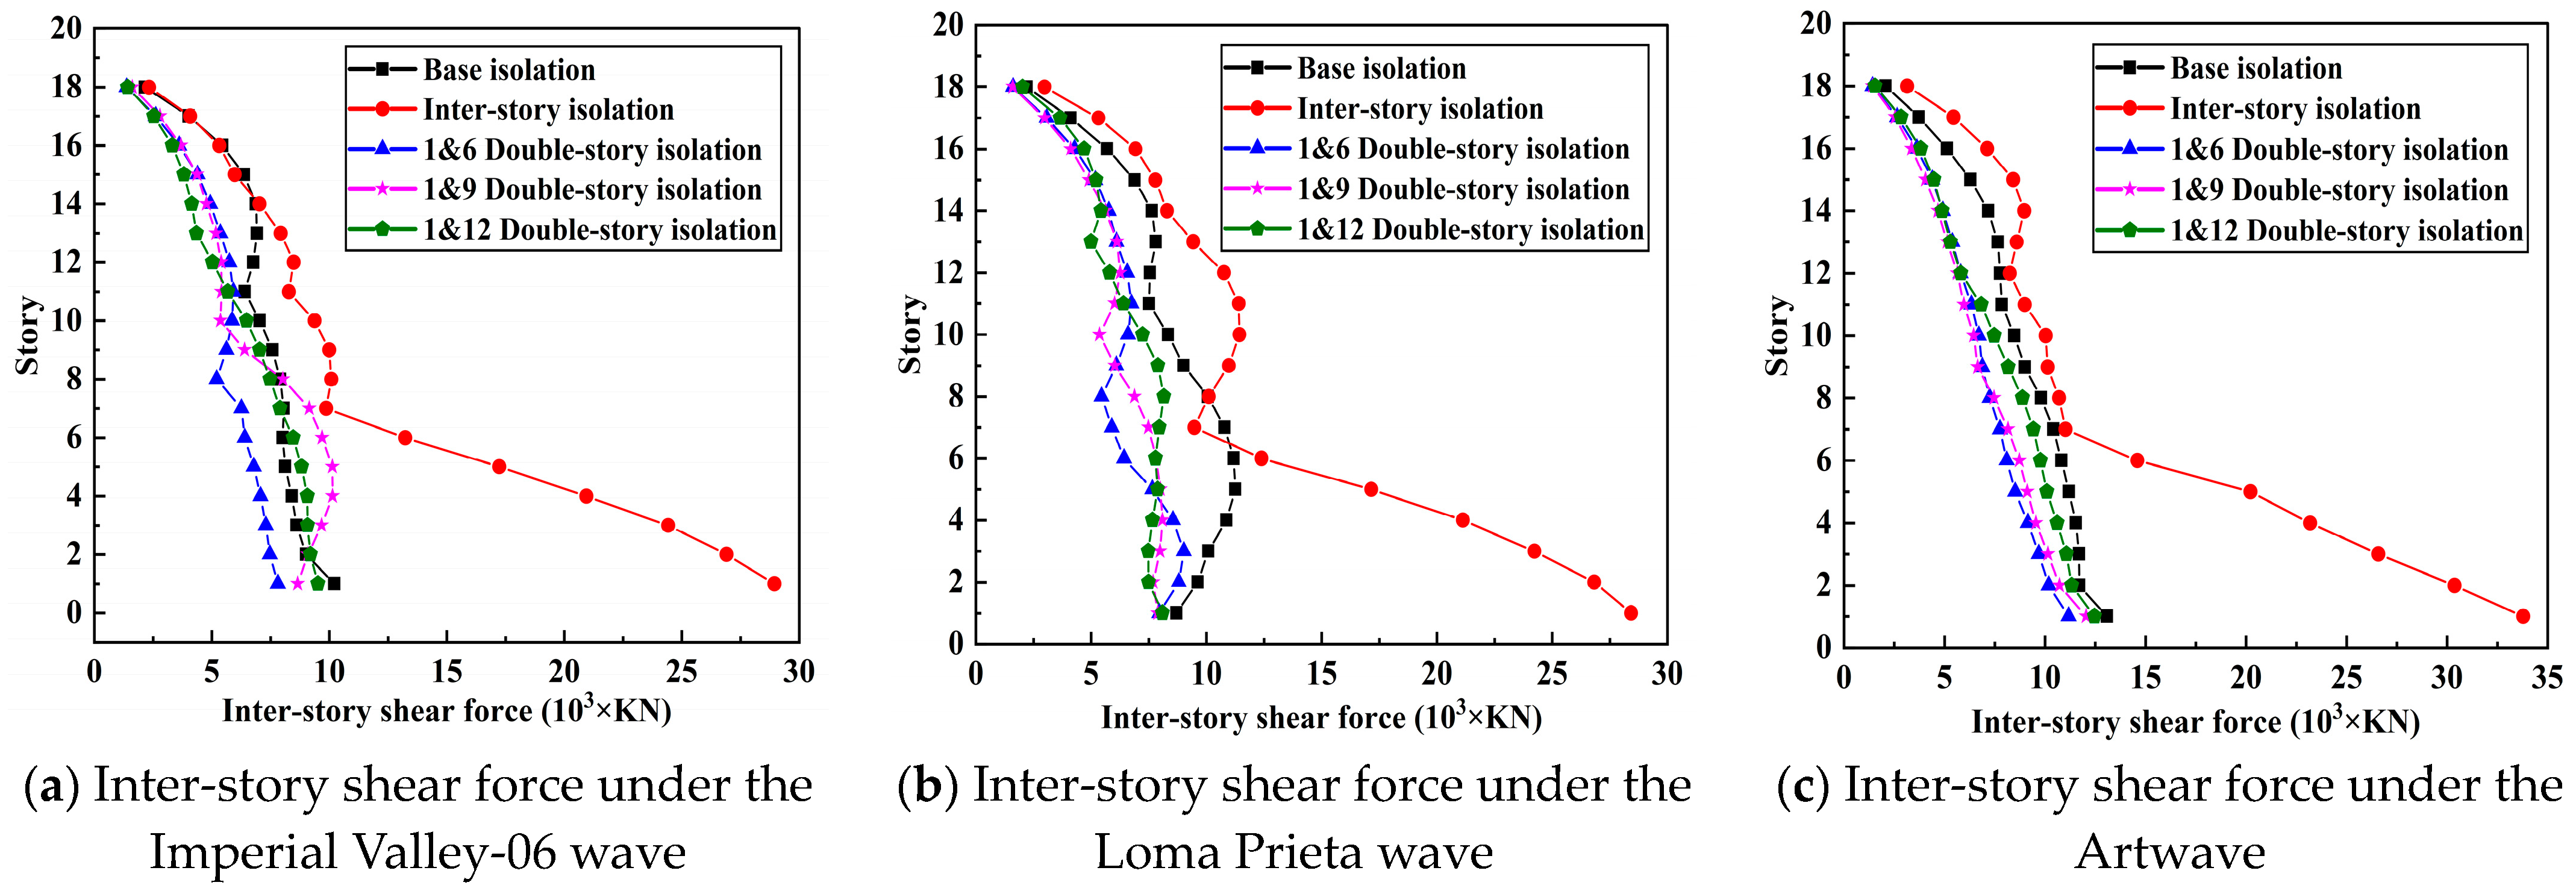
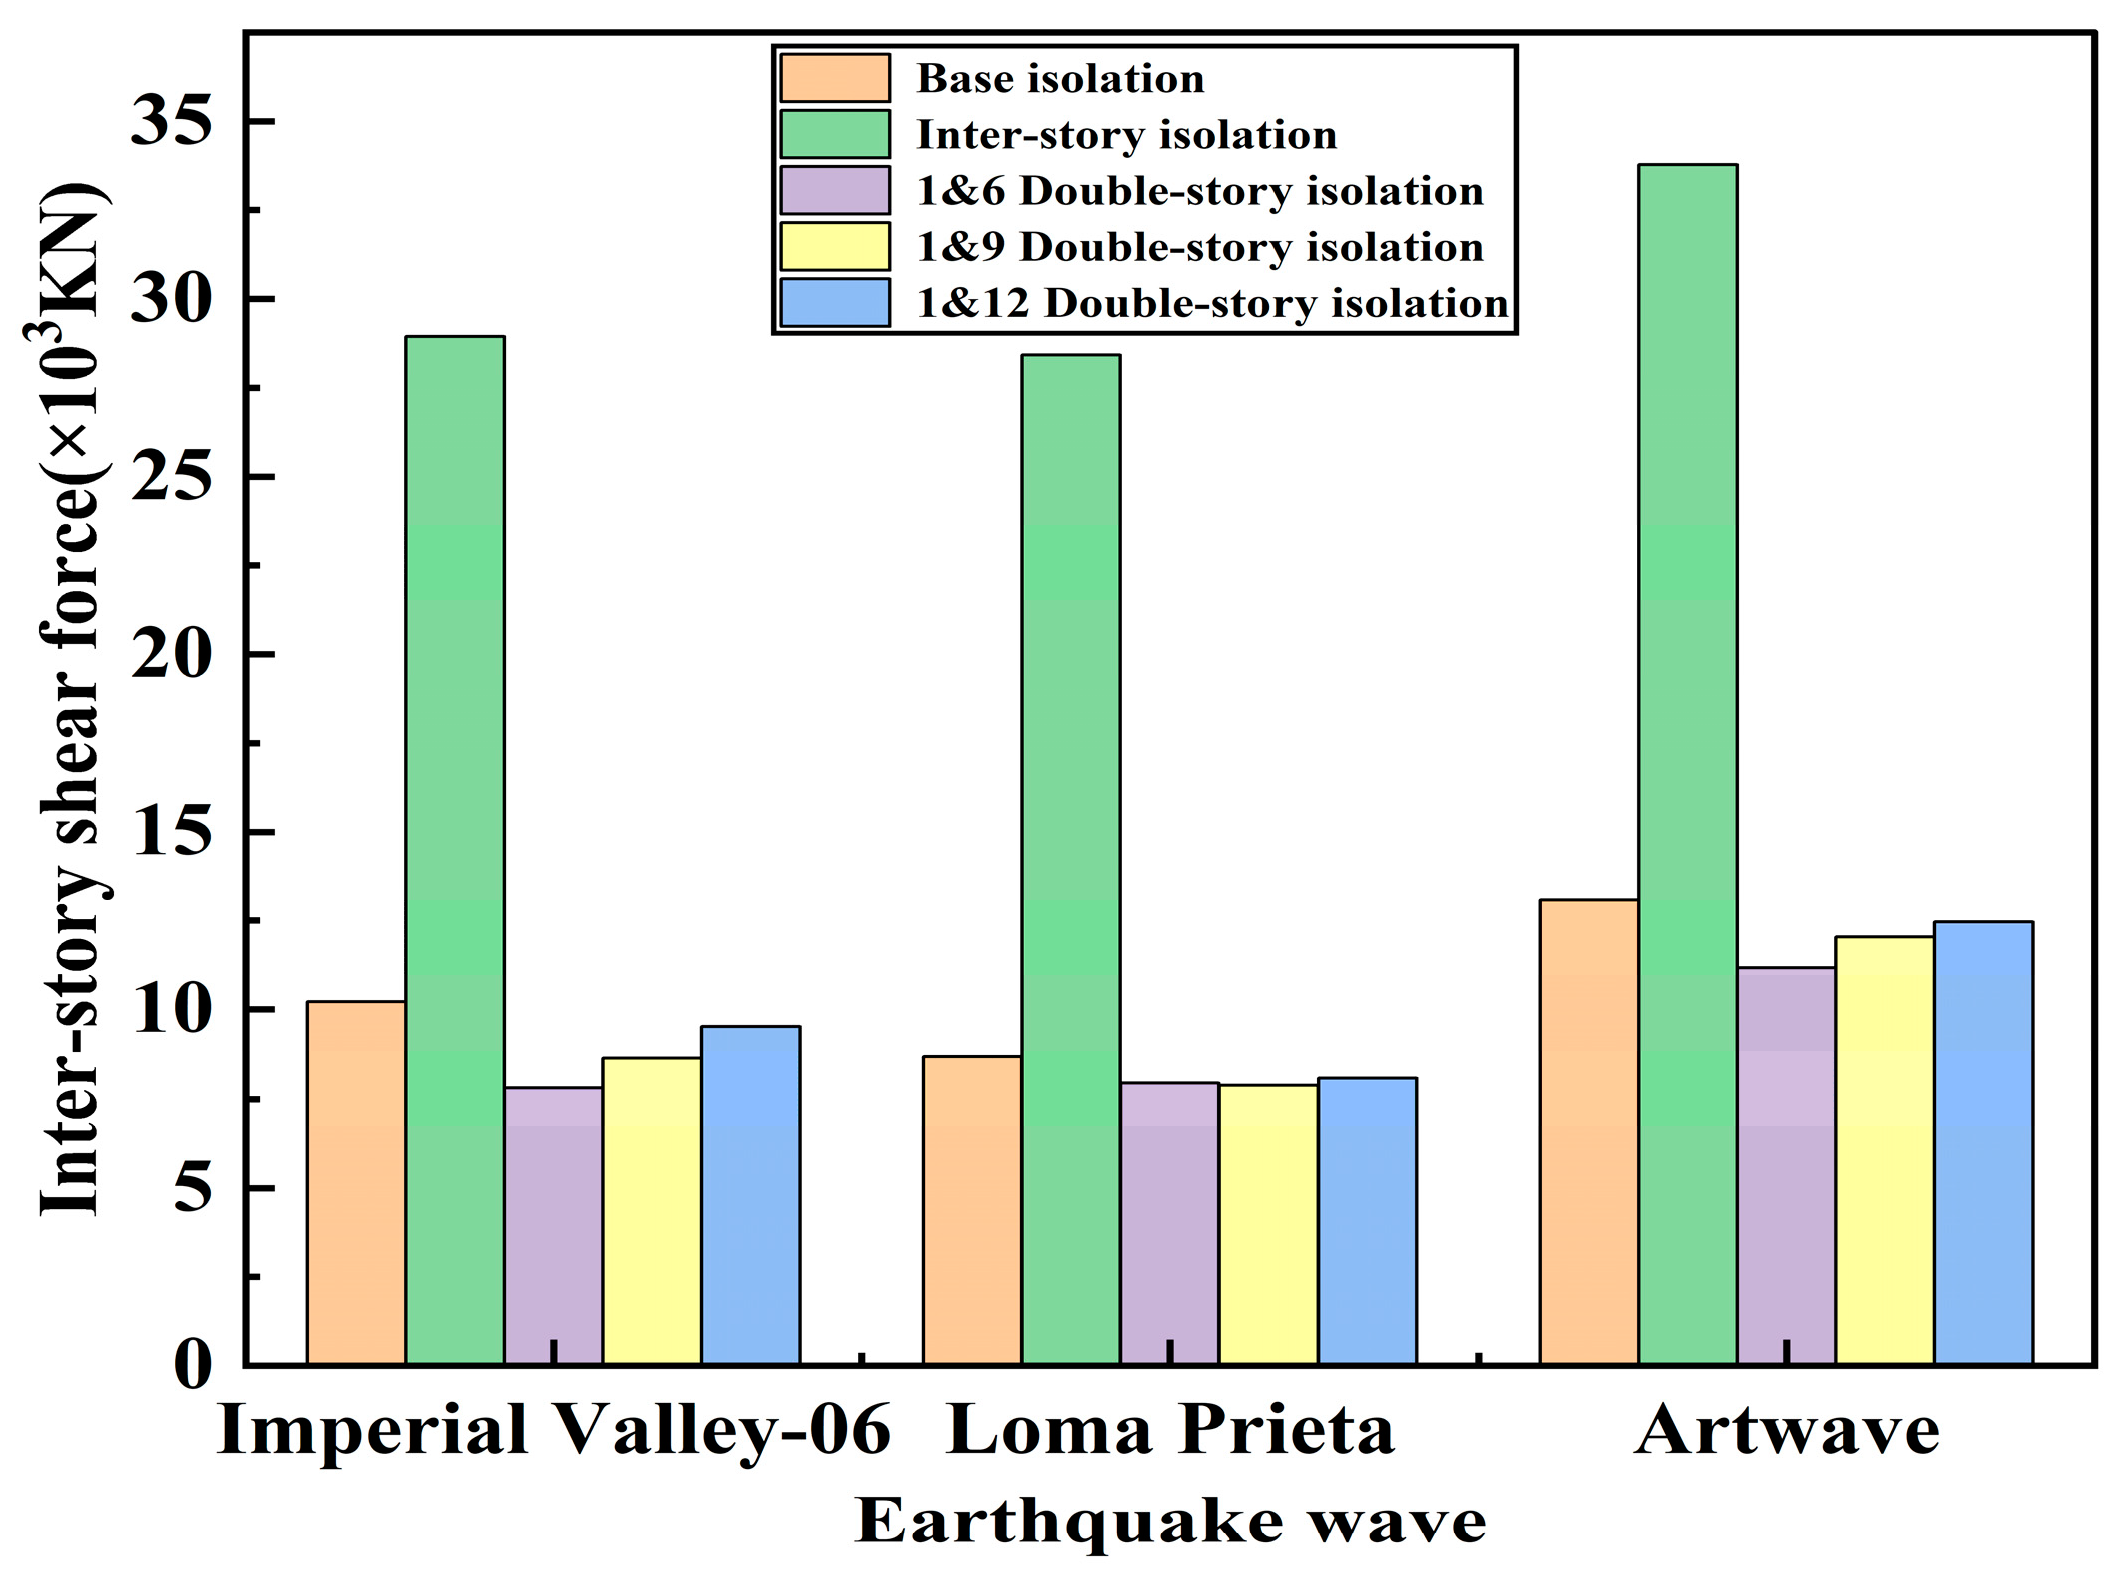
3.2. Inter-Story Shear Force

The comparative results shown in Figure 11 highlight significant differences in inter-story shear distribution across various isolation systems under rare earthquake conditions. In the inter-story isolation system with a mid-height isolation layer, the lower structural section lacks sufficient isolation protection, leading to suboptimal shear isolation effectiveness. Measured data indicate that the shear force in this section can be 1.3 to 3 times greater than in base isolation and double-layer isolation systems. Such a force distribution could substantially compromise structural safety under ultimate limit states. In contrast, both base isolation and double-layer isolation systems effectively suppress upward shear force transmission. Among these, the 1&6 double-layer configuration exhibits optimal performance, with a first-story shear force of 8978 kN, representing a 15.8% reduction compared to the base isolation system (Figure 12).
Structures employing a double-layer isolation system typically experience a minor sudden change in shear force near the upper isolation layer, a characteristic consistent with the inter-layer isolation mechanism. The further upward transmission of shear force is limited by the addition of a new isolation layer, which reduces the stress on the shear-resistant component section of the structure, thereby improving seismic performance. The absorption and distribution of structural shear force are significantly influenced by the upper isolation layer. Consequently, it is generally observed that the inter-layer shear force in structures with a double-layer isolation system is lower than in structures using inter-layer or base isolation. However, as the position of the upper isolation layer rises, this effect diminishes, and the isolation performance increasingly approximates that of a base isolation system with only one isolation layer. Specifically, under the Imperial Valley-06 wave, as the position of the upper seismic isolation layer moves upward, the inter-layer shear force distribution in the lower third of the structure becomes slightly larger than in the base isolation structure.

3.3. Top-Layer Acceleration

Seismic effects can be amplified in seismic-resistant structures, where the acceleration at the top of the structure can be significantly greater than the peak acceleration of the seismic wave. However, the addition of an isolation layer in an isolated structure notably alters the natural frequency of the structure, significantly improving its acceleration response and reducing the impact of inertia forces caused by acceleration.
As shown in Table 5, under the influence of the Imperial Valley-06 wave, the peak acceleration at the top layer of the double-layer isolation structure (with isolation at the first and sixth layers) decreased by 35.2% and 46.2%, respectively, compared to the base isolation and inter-layer isolation structures. Similarly, under the influence of the Loma Prieta wave, the peak acceleration was reduced by 16.1% and 34.9%, respectively. Under the ArtWave wave, the peak acceleration further decreased by 33.3% and 53.3%, respectively. The maximum acceleration at the top layer of the other two double-layer isolation models also experienced significant reductions compared to the base isolation and inter-layer isolation models, although the degree of reduction was not as pronounced as in the double-layer isolation structure with isolation at the first and sixth layers.
Figure 13 shows that during the time-history analysis, the peak acceleration response at the top layer of the double-layer isolation structure is significantly lower than that of the base isolation and inter-layer isolation structures for most of the duration. This characteristic is beneficial for the structure’s ability to withstand seismic events with large peaks and extended durations. Additionally, it helps minimize the inertia forces exerted on the building’s equipment, thereby reducing potential damage during an earthquake and lowering the risk of equipment causing harm to indoor personnel.

4. Stability Analysis

4.1. The Reaction Force of Isolation Bearings

According to the Code for Seismic Design of Buildings: GB50011-2010 [19], which specifies the conditions for seismic isolation bearings, the tensile stress in seismic isolation bearings shall not exceed 1 MPa, and the compressive stress shall not exceed 30 MPa under rare earthquake conditions. The maximum vertical stresses of isolation bearings in each isolated structure are presented in Figure 14, while the minimum values are shown in Figure 15. Under the three seismic waves, all isolation structures demonstrated that the maximum compressive stress in isolation bearings never exceeded 30 MPa, and no tensile stress occurred in any bearing. Furthermore, the base-isolated structure exhibited notably lower minimum compressive stresses in its isolation bearings compared to those in the lower isolation layer of the double-layer isolation system. This observation indicates that, when using a double-layer isolation system, the risk of tensile stress development in isolation bearings is significantly reduced. This characteristic not only enhances the seismic redundancy of the building but also plays a crucial role in mitigating the potential for progressive collapse under the design-basis rare earthquake scenario.

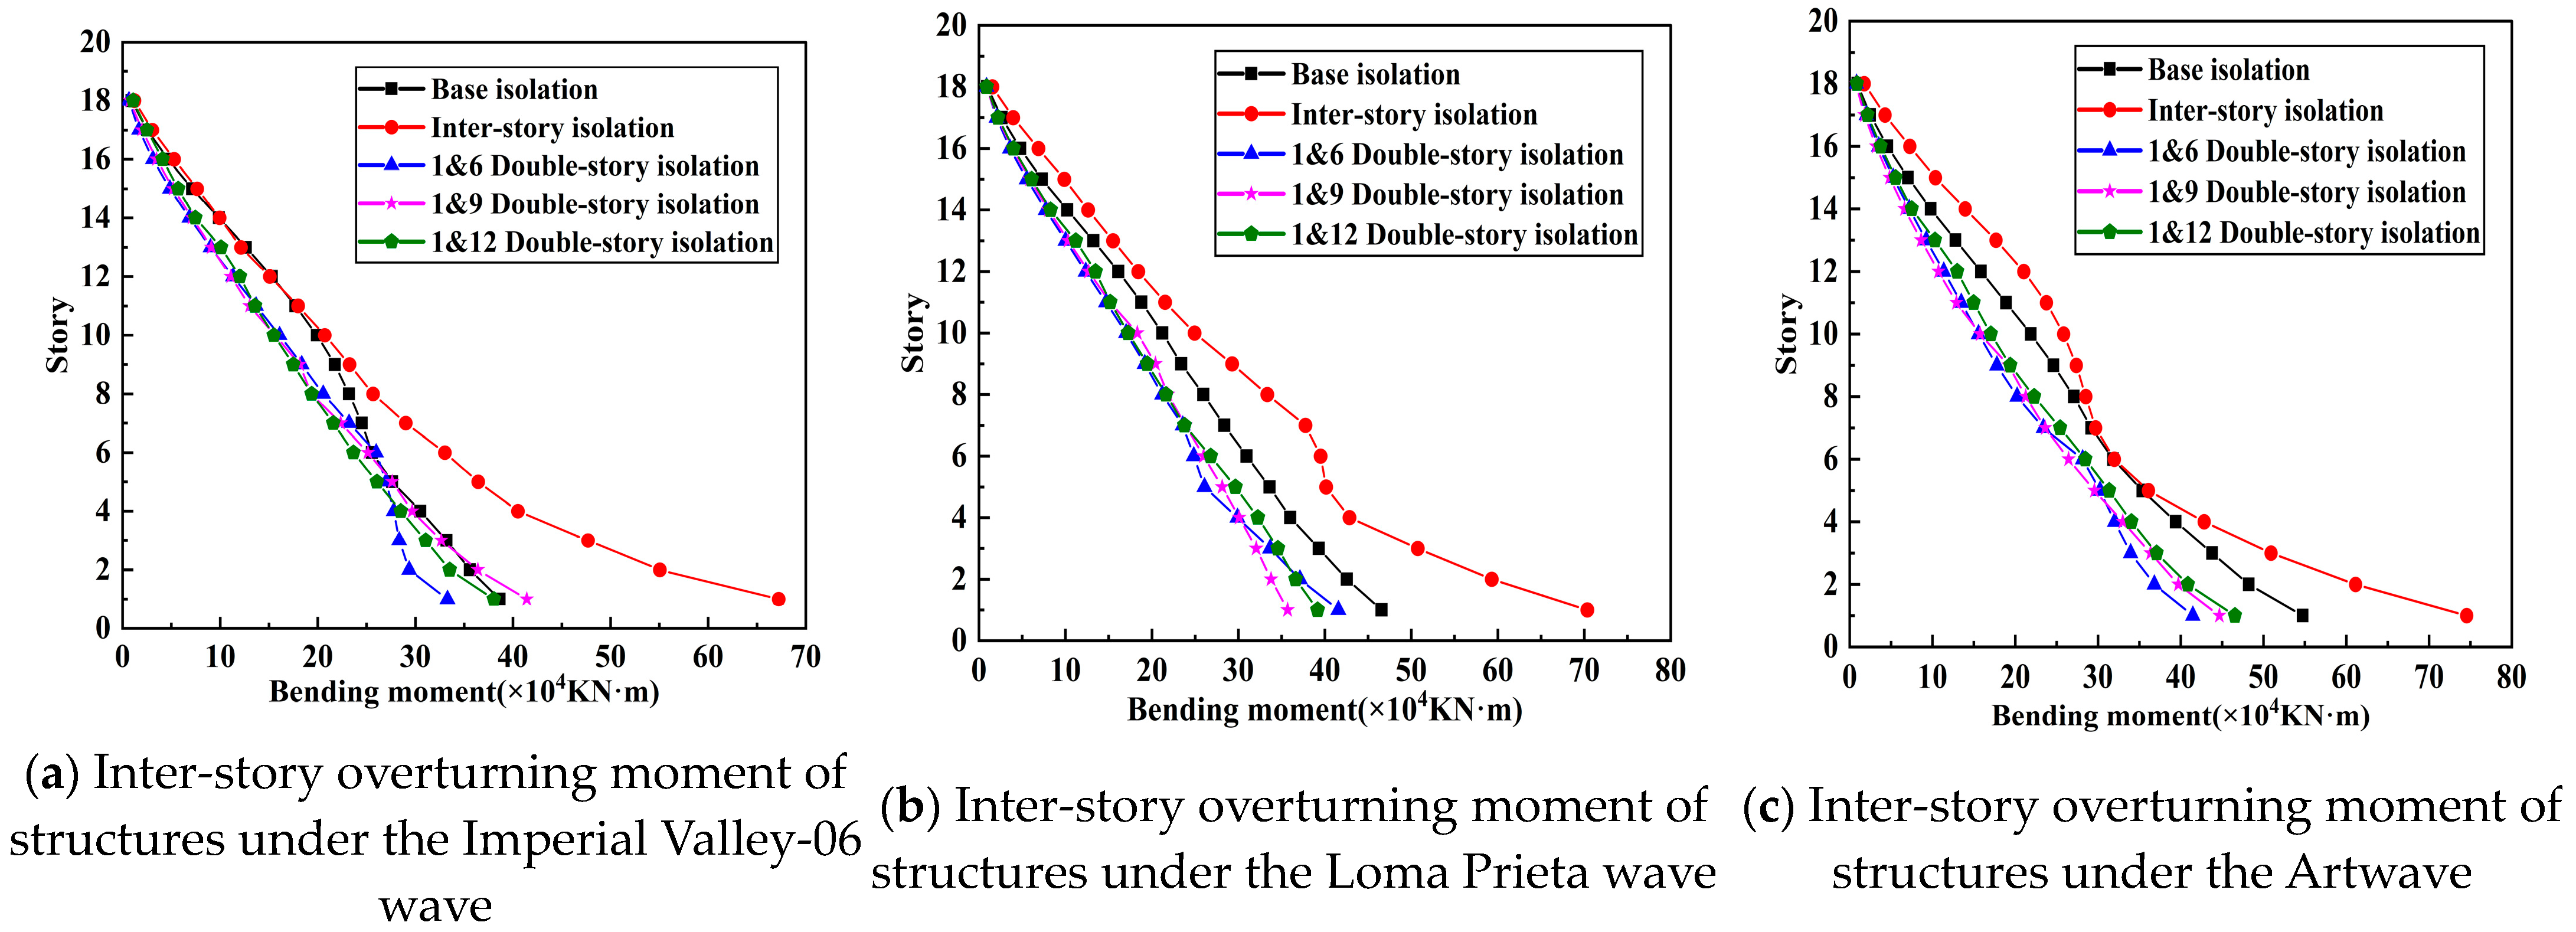
4.2. Overturning Moment of the Structure

To ensure the anti-overturning stability of seismically isolated structures under rare earthquake conditions, it is crucial to investigate their inter-story overturning moment characteristics. Based on the inter-story shear theory and in accordance with the provisions of China’s current Code for Seismic Design of Buildings: GB50011-2010 [19], the structural overturning moment can be calculated using the following standardized equation:
M c = i = 1 n j = 1 m V i j h i
where M c denotes the seismic overturning moment under the specified horizontal force;   n represents the number of columns in the i t h story of the frame; V i j indicates the calculated seismic shear force for the j t h column in the i t h story; and h i is the i t h layer height.
Figure 16 compares the inter-story overturning moments of various seismic isolation systems. Under the Imperial Valley-06 ground motion excitation, the 1&6 double-layer isolation system shows a significant reduction in inter-story overturning moments compared to conventional inter-story isolation and base isolation systems. However, in the 1&9 and 1&12 double-layer isolation configurations, the overturning moment in the lower third of the structure tends to be larger than that in base isolation systems. Under the excitation of the Loma Prieta and ArtWave seismic ground motions, structures with dual-layer isolation systems exhibit notably reduced inter-story overturning moments compared to those with inter-story isolation or base isolation. This reduction can substantially decrease the risk of overall overturning of the structure above the isolation layer due to bending deformation during rare earthquakes [28,29].

5. Conclusions

The study performed elastoplastic time-history analyses of various seismic isolation structures under rare earthquake events.
(1).
Modal analysis indicates that a double-layer isolated structure can effectively extend the natural vibration period by adding an inter-story isolation layer, thereby reducing the impact of seismic forces. However, it should be noted that the higher the position of the second isolation layer, the weaker the period-lengthening effect.
(2).
The isolation layer can effectively concentrate and absorb inter-story displacement. The installation of an intermediate isolation layer helps distribute the displacement of the base isolation layer, limiting the maximum absolute displacement of the structure under rare earthquakes and preventing the risk of overall overturning.
(3).
Compared to single-layer isolation, double-layer isolation significantly reduces the overturning moment of the structure, improving the global stability of super high-rise buildings caused by bending deformation. This is particularly suitable for structures with large height-to-width ratios.
(4).
Double-layer isolation can further reduce the acceleration of the upper structure, decreasing inertial force-induced damage while also mitigating the risk of damage to indoor equipment and injuries to occupants. The optimal effect is achieved when the second isolation layer is located in the lower one-third of the building.
(5).
Current research on double-layer isolation still has limitations in period control, displacement distribution, applicability, and cost-effectiveness. Future improvements should focus on parametric optimization, multi-hazard analysis, smart isolation technologies, and life-cycle assessment to enhance engineering reliability.

Author Contributions

Data curation, L.Z.; Formal analysis, G.Z.; Funding acquisition, D.L.; Investigation, G.Z.; Methodology, G.Z.; Project administration, K.S.; Resources, L.Z. and D.L.; Software, G.Z.; Supervision, D.L.; Validation, G.Z.; Visualization, G.Z.; Writing—original draft, G.Z.; Writing—review and editing, G.Z. All authors have read and agreed to the published version of the manuscript.

Funding

The research was funded by the National Natural Science Fund of China (Grant Nos. 52168072 and 51808467), High-level Talent Support Project of Yunnan Province, China (2020).

Data Availability Statement

The original contributions presented in the study are included in the article; further inquiries can be directed to the corresponding authors.

Conflicts of Interest

The authors declare no conflicts of interest.

References

  1. Mimura, N.; Yasuhara, K.; Kawagoe, S.; Yokoki, H.; Kazama, S. Damage from the Great East Japan Earthquake and Tsunami-a quick report. Mitig. Adapt. Strateg. Glob. Change 2011, 16, 803–818. [Google Scholar] [CrossRef]
  2. Su, Y.; Zhang, Y. Study on the distribution of earthquake damage in the Tangshan earthquake. Earthq. Eng. Eng. Vib. 2006, 26, 18–21. [Google Scholar] [CrossRef]
  3. Huang, Y.; Jiang, X. Field-observed phenomena of seismic liquefaction and subsidence during the 2008 Wenchuan earthquake in China. Nat. Hazards 2010, 54, 839–850. [Google Scholar] [CrossRef]
  4. Chen, M. Ying County Wooden Pagoda; Cultural Relics Publishing House: Beijing, China, 2001. [Google Scholar]
  5. Nakahara, K.O.J.I.; Hisatoku, T.; Nagase, T.; Takahashi, Y. Earthquake response of ancient five-story pagoda structure of Horyu-Ji temple in Japan. In Proceedings of the WCEE 2000, Auckland, New Zeland, 30 January–4 February 2020. [Google Scholar]
  6. Zhou, F.L. Progress of application and development in base isolation and passive energy dissipation for civil and industrial structures. In Proceedings of the International Post-SMiRT Conference Seminar, Cheju, Republic of Korea, 15–20 August 1999; Dongam Publishing: Seoul, Republic of Korea, 1999. [Google Scholar]
  7. Zhou, F.; Zhang, Y.; Tan, P. Theoretical study of inter layer isolation system. J. Civ. Eng. 2009, 42, 1–8. [Google Scholar]
  8. Nakai, A.; Sato, D.; Murakami, T.; Kasai, K. Evaluation of the stiffness of the seismic isolation layer and the upper structure based on the seismic observation records of super high-rise seismic isolation buildings. J. Archit. Build. Sci. 2018, 24, 571–576. [Google Scholar]
  9. Gupta, P.K.; Ghosh, G.; Pandey, D.K. Parametric study of effects of vertical ground motions on base isolated structures. J. Earthq. Eng. 2021, 25, 434–454. [Google Scholar] [CrossRef]
  10. Zhao, T.; Liu, D.; Guo, Z.; Shan, H.; Huo, Y.; Li, X.; Lei, M. Study on the overturning resistance of a new staggered story isolated structure. Structures 2024, 65, 106709. [Google Scholar] [CrossRef]
  11. Chai, W.C. Mega-Sub Control of High-Rise Buildings; University of California: Irvine, CA, USA, 1996. [Google Scholar]
  12. Zhang, Y.; Tan, P.; Zhou, F. Parameter design and seismic performance study of segmented isolation new system. J. Civ. Eng. 2010, 270–275. [Google Scholar]
  13. Wang, X. New Type of SMA-Laminated Rubber Bearing and Its Segmented Isolation Study in High-Rise Buildings. Ph.D. Thesis, Liaoning Technical University, Fuxin, China, 2006. [Google Scholar]
  14. Zucca, M.; Reccia, E.; Vecchi, E.; Pintus, V.; Dessì, A.; Cazzani, A. An Evaluation of the Structural Behaviour of Historic Buildings Under Seismic Action: A Multidisciplinary Approach Using Two Case Studies. Appl. Sci. 2024, 14, 10274. [Google Scholar] [CrossRef]
  15. Zucca, M.; Longarini, N.; Simoncelli, M.; Aly, A.M. Tuned Mass Damper Design for Slender Masonry Structures: A Framework for Linear and Nonlinear Analysis. Appl. Sci. 2021, 11, 3425. [Google Scholar] [CrossRef]
  16. Acito, M.; Bocciarelli, M.; Chesi, C.; Milani, G. Collapse of the clock tower in Finale Emilia after the May 2012 Emilia Romagna earthquake sequence: Numerical insight. Eng. Struct. 2014, 72, 70–91. [Google Scholar] [CrossRef]
  17. Jain, A.; Acito, M.; Chesi, C. Seismic sequence of 2016–2017: Linear and non-linear interpretation models for evolution of damage in San Francesco church, Amatrice. Eng. Struct. 2020, 211, 110418. [Google Scholar] [CrossRef]
  18. Ou, J.; Wu, P.; Guan, X. Large displacement friction pendulum base layer and multi-layer seismic resilience structure. J. Disaster Prev. Mitig. Eng. 2021, 41, 657. [Google Scholar] [CrossRef]
  19. GB50011-2010; Standard for Seismic Design of Buildings. Ministry of Housing and Urban-Rural Development of China: Beijing, China, 2016.
  20. GB50010-2010; Standard for Seismic Design of Buildings. Ministry of Housing and Urban-Rural Development of China: Beijing, China, 2010.
  21. Du, J.; Sun, M.; Jiang, W.; Zhou, Z.; Wang, X.; Fang, Q. Magneto-mechanical hysteresis damping mechanism in dual-phase iron-based alloy with zero magnetostriction. J. Alloys Compd. 2024, 1005, 176120. [Google Scholar] [CrossRef]
  22. Qiaopula, X.L.; Lu, D. Structural Dynamics: Theory and Its Application in Earthquake Engineering; Higher Education Press: Beijing, China, 2007. [Google Scholar]
  23. Yang, G. Introduction to Elastoplastic Mechanics; Tsinghua University Press: Beijing, China, 2004. [Google Scholar]
  24. Skinner, R.I.; Robinson, W.H.; McVerry, G.H. An Introduction to Seismic Isolation; Wiley: Hoboken, NJ, USA, 1993. [Google Scholar]
  25. American Society of Civil Engineers. Minimum Design Loads for Buildings and Other Structures; American Society of Civil Engineers: Reston, VA, USA, 2010. [Google Scholar]
  26. Zeng, D. Stiffness Characteristics of Rubber Isolation Bearings and Experimental Study on Seismic Performance of Isolated Buildings. Ph.D. Thesis, China Academy of Building Research, Beijing, China, 2007. [Google Scholar]
  27. Han, B.; Du, Y.; Hong, N.; Li, H.; Shi, C. Shaking Table Test Study on Dynamic Performance of a Base-Isolated Frame Structure under an Isolation Bearing Removal Scenario. Structures 2023, 48, 1141–1156. [Google Scholar] [CrossRef]
  28. Zhai, Z.; Liu, Y.; Guo, W.; Mercan, O.; Chen, H.; Zhou, F. A seismic resilient design method for structures equipped with two-level yielding dampers, accounting for extremely rare earthquakes. Eng. Struct. 2023, 294, 116797. [Google Scholar] [CrossRef]
  29. Sun, K.; Wang, L.; Su, H.; Geng, J.; Meng, B.; Wei, Z.; Wu, G. Damping properties and mechanism of aluminum matrix composites reinforced with glass cenospheres. Trans. Nonferrous Met. Soc. China 2024, 34, 2743–2755. [Google Scholar] [CrossRef]
Figure 1. Structural plan.
Buildings 15 01292 g001
Figure 2. Single-layer isolation models.
Buildings 15 01292 g002
Figure 3. Double-isolation models.
Buildings 15 01292 g003
Figure 4. Constitutive models of concrete and steel reinforcement.
Buildings 15 01292 g004
Figure 5. Arrangement of seismic isolation bearings.
Buildings 15 01292 g005
Figure 6. Simplified mechanical model of seismic isolation bearings.
Buildings 15 01292 g006
Figure 7. The stress–strain curve of the seismic isolation bearings.
Buildings 15 01292 g007
Figure 8. The acceleration response spectrum.
Buildings 15 01292 g008
Figure 9. Inter-layer displacement of structures under seismic action.
Buildings 15 01292 g009
Figure 10. Comparison chart of the inter-layer displacements of structures under seismic action.
Buildings 15 01292 g010
Figure 11. The inter-layer shear force of the structure under seismic action.
Buildings 15 01292 g011
Figure 12. Comparison chart of the inter-layer shear force of structures under seismic action.
Buildings 15 01292 g012
Figure 13. Maximum top-layer acceleration under the action of the seismic waves.
Buildings 15 01292 g013
Figure 14. Maximum stress of the seismic isolation bearing under the action of the seismic.
Buildings 15 01292 g014
Figure 15. Minimum stress of the seismic isolation bearing under the action of the seismic waves.
Buildings 15 01292 g015
Figure 16. Inter-story overturning moment of structures under the action of the seismic waves.
Buildings 15 01292 g016
Table 1. Mechanical properties of seismic isolation bearings.
TypeEffective
Diameter
(mm)
Total
Rubber
Thickness
(mm)
Vertical Tensile Stiffness (kN/mm)Vertical Compressive Stiffness
(kN/mm)
Horizontal Initial Stiffness
(kN/m)
Post-Yield Stiffness RatioYield Force
(kN)
LRB600600120158.11581115070.07791.4
LRB700700140189.41894134560.077116.8
Table 2. The periods of the first 6 modes of different seismic isolation structures (s).
OrderBase IsolationInter-Layer Isolation1&6 Double-Layer Isolation1&9 Double-Layer Isolation1&12 Double-Layer Isolation
13.7122.9254.4234.1283.915
23.6922.8844.4054.1083.893
33.2012.5373.8533.5713.372
40.9140.5691.1921.1440.942
50.8940.5681.1861.1260.927
60.6020.4161.1630.9950.551
Table 3. Basic information of the seismic waves.
EventTimeTg/gMagnitudeStationSoil TypeVs (m/s)Arias Intensity (m/s)Site Class
Imperial Valley-0619790.396.53El-Centro Array #1Dense soil2130.85II
Loma Prieta19890.426.93Coyote Lake Dam DownstRock6201.12I
ArtWave/0.40//Synthetic/0.75II
Table 4. Maximum displacement of the isolation layer (mm).
EventIsolation LayerBase IsolationInter-Layer Isolation1&6 Double-Layer Isolation1&9 Double-Layer Isolation1&12 Double-Layer Isolation
Imperial Valley-06Base isolation layer188.4/117.5143.2169.07
upper isolation layer/172.8112.381.245
Loma PrietaBase isolation layer142.6/121.1119.5125.8
upper isolation layer/164.297.979.766.8
ArtWaveBase isolation layer276.1/218.7243.4258.3
upper isolation layer/208.1165.9117.476.9
Table 5. The maximum top-layer acceleration of the structures (m/s2).
EventBase IsolationInter-Layer Isolation1&6 Double-Layer Isolation1&9 Double-Layer Isolation1&12Double-Layer Isolation
Imperial Valley-06
wave
2.412572.89821.560811.933221.67267
Loma Prieta wave2.604833.34932.179831.980092.12722
ArtWave2.407283.433191.603831.65271.56327
Disclaimer/Publisher’s Note: The statements, opinions and data contained in all publications are solely those of the individual author(s) and contributor(s) and not of MDPI and/or the editor(s). MDPI and/or the editor(s) disclaim responsibility for any injury to people or property resulting from any ideas, methods, instructions or products referred to in the content.

