Abstract
Few topics are currently as polarizing as the appropriate limits, and perceived dangers, of free speech on university campuses. A side effect of this polarized environment is that students themselves may be reluctant to speak publicly on politically sensitive topics. Indeed, recent surveys by the Heterodox Academy (HxA) revealed that a majority of American university students thought their campus was not conducive to the free expression of ideas, and a substantial minority were personally reluctant to discuss “hot topics” like politics or sexual orientation in class. To see whether these results are uniquely American phenomena, we reran the HxA’s survey on 791 students, recruited via advertisements, enrolled in New Zealand universities. As in the original survey, participants answered questions, administered online, about their comfort sharing their opinions on issues related to gender, politics, religion, and sexual orientation, as well as their estimates of other groups’ discomfort. Despite significant sociopolitical differences between the two countries, our results, generally speaking, bear out those in the United States. In both countries, politics elicited the most reluctance to speak, followed by religion, and then gender and sexual orientation (which were equivalent), and New Zealanders were more reluctant than Americans to speak on the latter two topics. Other similarities and differences between the two data sets are discussed, but it is clear that chilled campus speech is not confined to the United States.
1. Perceived Freedom of Expression at New Zealand Universities
Academic freedom and freedom of speech on university campuses are hot topics (e.g., Haidt and Lukianoff 2018; Matthews 2022). Concerns over the erosion of both principles (which are not identical) have produced an increasing volume and variety of scholarly, print, and online media content, alongside vitriolic debate on social media.
Some of the discussion focuses on these freedoms as they are upheld or lost by academics working in universities (Haller 2019; Reichman 2019), and some on students’ willingness to speak and listen to the views of others (Jackson 2021; Smeltzer and Hearn 2015). Either way, few topics are as polarizing: there seems to be little middle ground when conservative concerns about the rise of “woke brigades” on campus compete with progressive concerns about the rise of “fascism” (Hackett and Rivera 2020). Furious claims that conservative voices are being suppressed or “canceled” are offset by equally furious claims that these voices are promoting values that are incompatible with a more enlightened age.
Whatever one’s political leanings, a side effect of the emotion behind the debate is that university students and staff, left and right, may feel intimidated at the prospect of wading into it. Recent research bears out these concerns. The Heterodox Academy’s “Campus Expression Survey” of over 4000 American university students (Zhou and Zhou 2022) reported that about a quarter of students expressed reluctance to discuss gender, politics, race, religion, and/or sexual orientation, with a (small) increase over the three waves of the study (2019–2021). Reluctance was highest for discussions of politics (40% in 2021), with political orientation the strongest predictor. Democrats were substantially less reluctant to discuss controversial issues than students reporting other political affiliations. Moreover, a majority each year (64% in 2021) agreed that “the climate on my campus prevents some people from saying things they believe because others might find them offensive.” Even more (74% in 2021) thought this situation was unacceptable, agreeing that “colleges should encourage students and professors to share ideas and ask questions.” These numbers roughly align with other recent (self-published) research reports on campus attitudes in the United States (e.g., Foundation for Individual Rights and Expression 2017; Knight Foundation 2022).
If universities are to fulfill their roles as unique and vital crucibles of open intellectual debate, these trends are worrying, but how generalizable are they? Can American data be attributed to the polarized political environment of the United States, or are they an international phenomenon? (A 2019 survey by Grant et al. (2019) found less concern for free speech on U.K. campuses, although the many differences in the questions used make the surveys difficult to compare.) A 2020 Pew survey concluded that the United States was in fact the most politically divided of any of the 14 countries surveyed. The researchers attributed this to its two-party system, which “stands apart by collapsing a wide range of legitimate social and political debates into a singular battle line” (Dimock and Wike 2020). Moreover, reluctance to voice potentially controversial views is not confined to American universities. Even off campus, reluctance to engage is high, with 40% of survey participants admitting that they “try to avoid” discussing politics with family members, a figure that unsurprisingly grows as a function of family political disagreement (Oliphant 2018). In this context, is reticence on campus simply a manifestation of modern American life, unlikely to be evident in cultures that are more politically congenial?
To find out, we administered a version of Zhou and Zhou’s (2022) survey in New Zealand, a country with a very different profile of political malice and gridlock than of the United States. A generally progressive parliamentary democracy, the country is certainly not free of political disagreement, and grapples with many of the same issues—prejudice, gun laws, vaccination, taxation, climate change, etc.—that drive political divisions in the United States, yet on the whole does not display the deep partisan mistrust that characterizes American society. New Zealand ranks near the top, internationally, on measures of freedom, peacefulness, and lack of corruption (World Population Review 2022; Transparency International 2022). These values did not prevent the Christchurch mosque attacks in 2019, which were carried out by a lone gunman from Australia. They did, however, facilitate a near-immediate ban on the assault weapons used in the attack, with the support of most political parties. This example is illustrative of how different New Zealand is to the United States, reflecting both the rarity of serious political violence and a culture of conformity. How, then, in this very different political environment, do New Zealand university students perceive their freedom of expression on campus?
2. Method
2.1. Participants
A total of 791 New Zealand university students were surveyed online. A majority were enrolled in three of New Zealand’s eight universities (University of Otago, University of Auckland, and Victoria University of Wellington, ns = 436, 181, and 155 respectively), and 16 students from other institutions also took part (three students did not reveal their university affiliation). An additional 188 students began the survey, but did not complete it, and are not included in the dataset.
Students were invited to participate via posters, departmental emails, and a targeted Facebook advertisement, in exchange for entry into a draw to win one of 100 NZD100 Amazon gift cards (the Heterodox Academy provided funding for the cards, but had no input into the design, interpretation, or writeup of this work). The project was approved by the Human Ethics Committee at each institution, and all participants provided informed consent before taking part.
2.2. Materials and Procedure
Participants completed a modified version of the 2021 Heterodox Academy Campus Expression Survey (Zhou and Zhou 2022), adapted as necessary for the New Zealand context and in light of recent updates to the administration manual (Stevens et al. 2022), administered in the Qualtrics online survey environment. Of primary interest were responses on the “core” and “campus experience” modules of the survey. The “core” module asks questions regarding participants’ comfort sharing their opinions on issues related to gender, politics, religion, and sexual orientation (in the American version, these were described as “controversial” issues, and participants were also surveyed about race), and their concerns about the consequences of sharing their opinions (perceived consequences were not analyzed for this report). The “experience on campus” module asks participants to predict whether other students in particular groups (i.e., left-leaning/progressive, right-leaning/conservative, white/pakeha, Māori, Pasifika, Asian, female, male, transgender, gay/lesbian/bisexual, straight, Christian, Hindu, Muslim, and atheist) would be more, less, or as comfortable sharing their views in a classroom discussion “compared to the average student.” They were also asked to list any other groups not included in the list provided who might be uncomfortable sharing their views. This section also includes questions, not analyzed here, regarding how often participants feel they are “treated badly” as a consequence of various group memberships. Finally, participants were asked to report their political leanings, ethnicity, gender, sexual orientation, and religious beliefs, along with the university in which they were enrolled and the degree they were pursuing.
The full set of items administered in New Zealand appear in Appendix A, and the full dataset at [https://osf.io/mjz9c/, accessed on 20 October 2022]. The American version of the survey and resulting data can be found at https://heterodoxacademy.org/campus-expression-survey (accessed on 20 October 2022).
Chi-squared tests of association were used to compare distributions, and phi was used as an index of effect size.
3. Results
In sum, 513 participants identified as female, 227 as male and 35 as “another gender” (14 did not disclose their gender). Ethnically, 559 participants identified as “NZ European/pakeha” (pakeha being the Māori term for New Zealanders of European descent), 106 as Asian, 62 as Māori, 30 as Pasifika, and 74 as another ethnicity (10 did not disclose their ethnicity). In terms of sexual orientation, 557 identified as straight, 130 as bisexual, 29 as gay, and 53 with a sexuality not listed (22 did not disclose their sexual orientation). Most (498) identified as “not religious”, but of those who identified as religious, 165 were Christian, 16 Hindu, 8 Buddhist, and 69 a religion not listed (25 did not respond to the question).
Forty participants opted out of one or more questions (max = 15), resulting in slightly different samples in particular analyses.
3.1. Overall Reluctance to Speak
Participants’ responses were recoded into dichotomous variables indicating comfort (“Very”/“Somewhat”) or discomfort (“Not really”/“Not at all”) with “speaking up and giving your views” on gender, politics, religion, and sexual orientation. Percentages of “uncomfortable” respondents appear in Figure 1, alongside the Heterodox Academy’s 2021 American data. Both groups were most reluctant to discuss politics, followed by religion, gender, and sexual orientation (which were equivalent). New Zealanders were slightly more reluctant than Americans to discuss sexual orientation (28.0% versus 23.0%, Χ2(1) = 4.93, p < 0.05, phi = 0.06), but the two groups did not differ on any other topic.
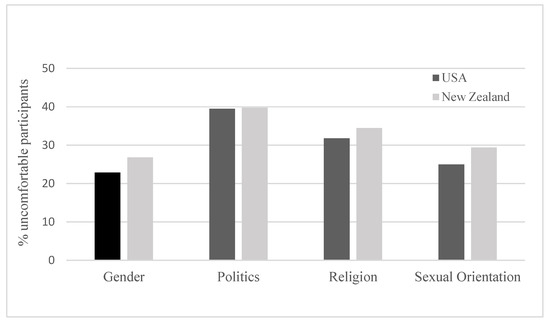
Figure 1.
Reluctance to speak as a function of topic and sample.
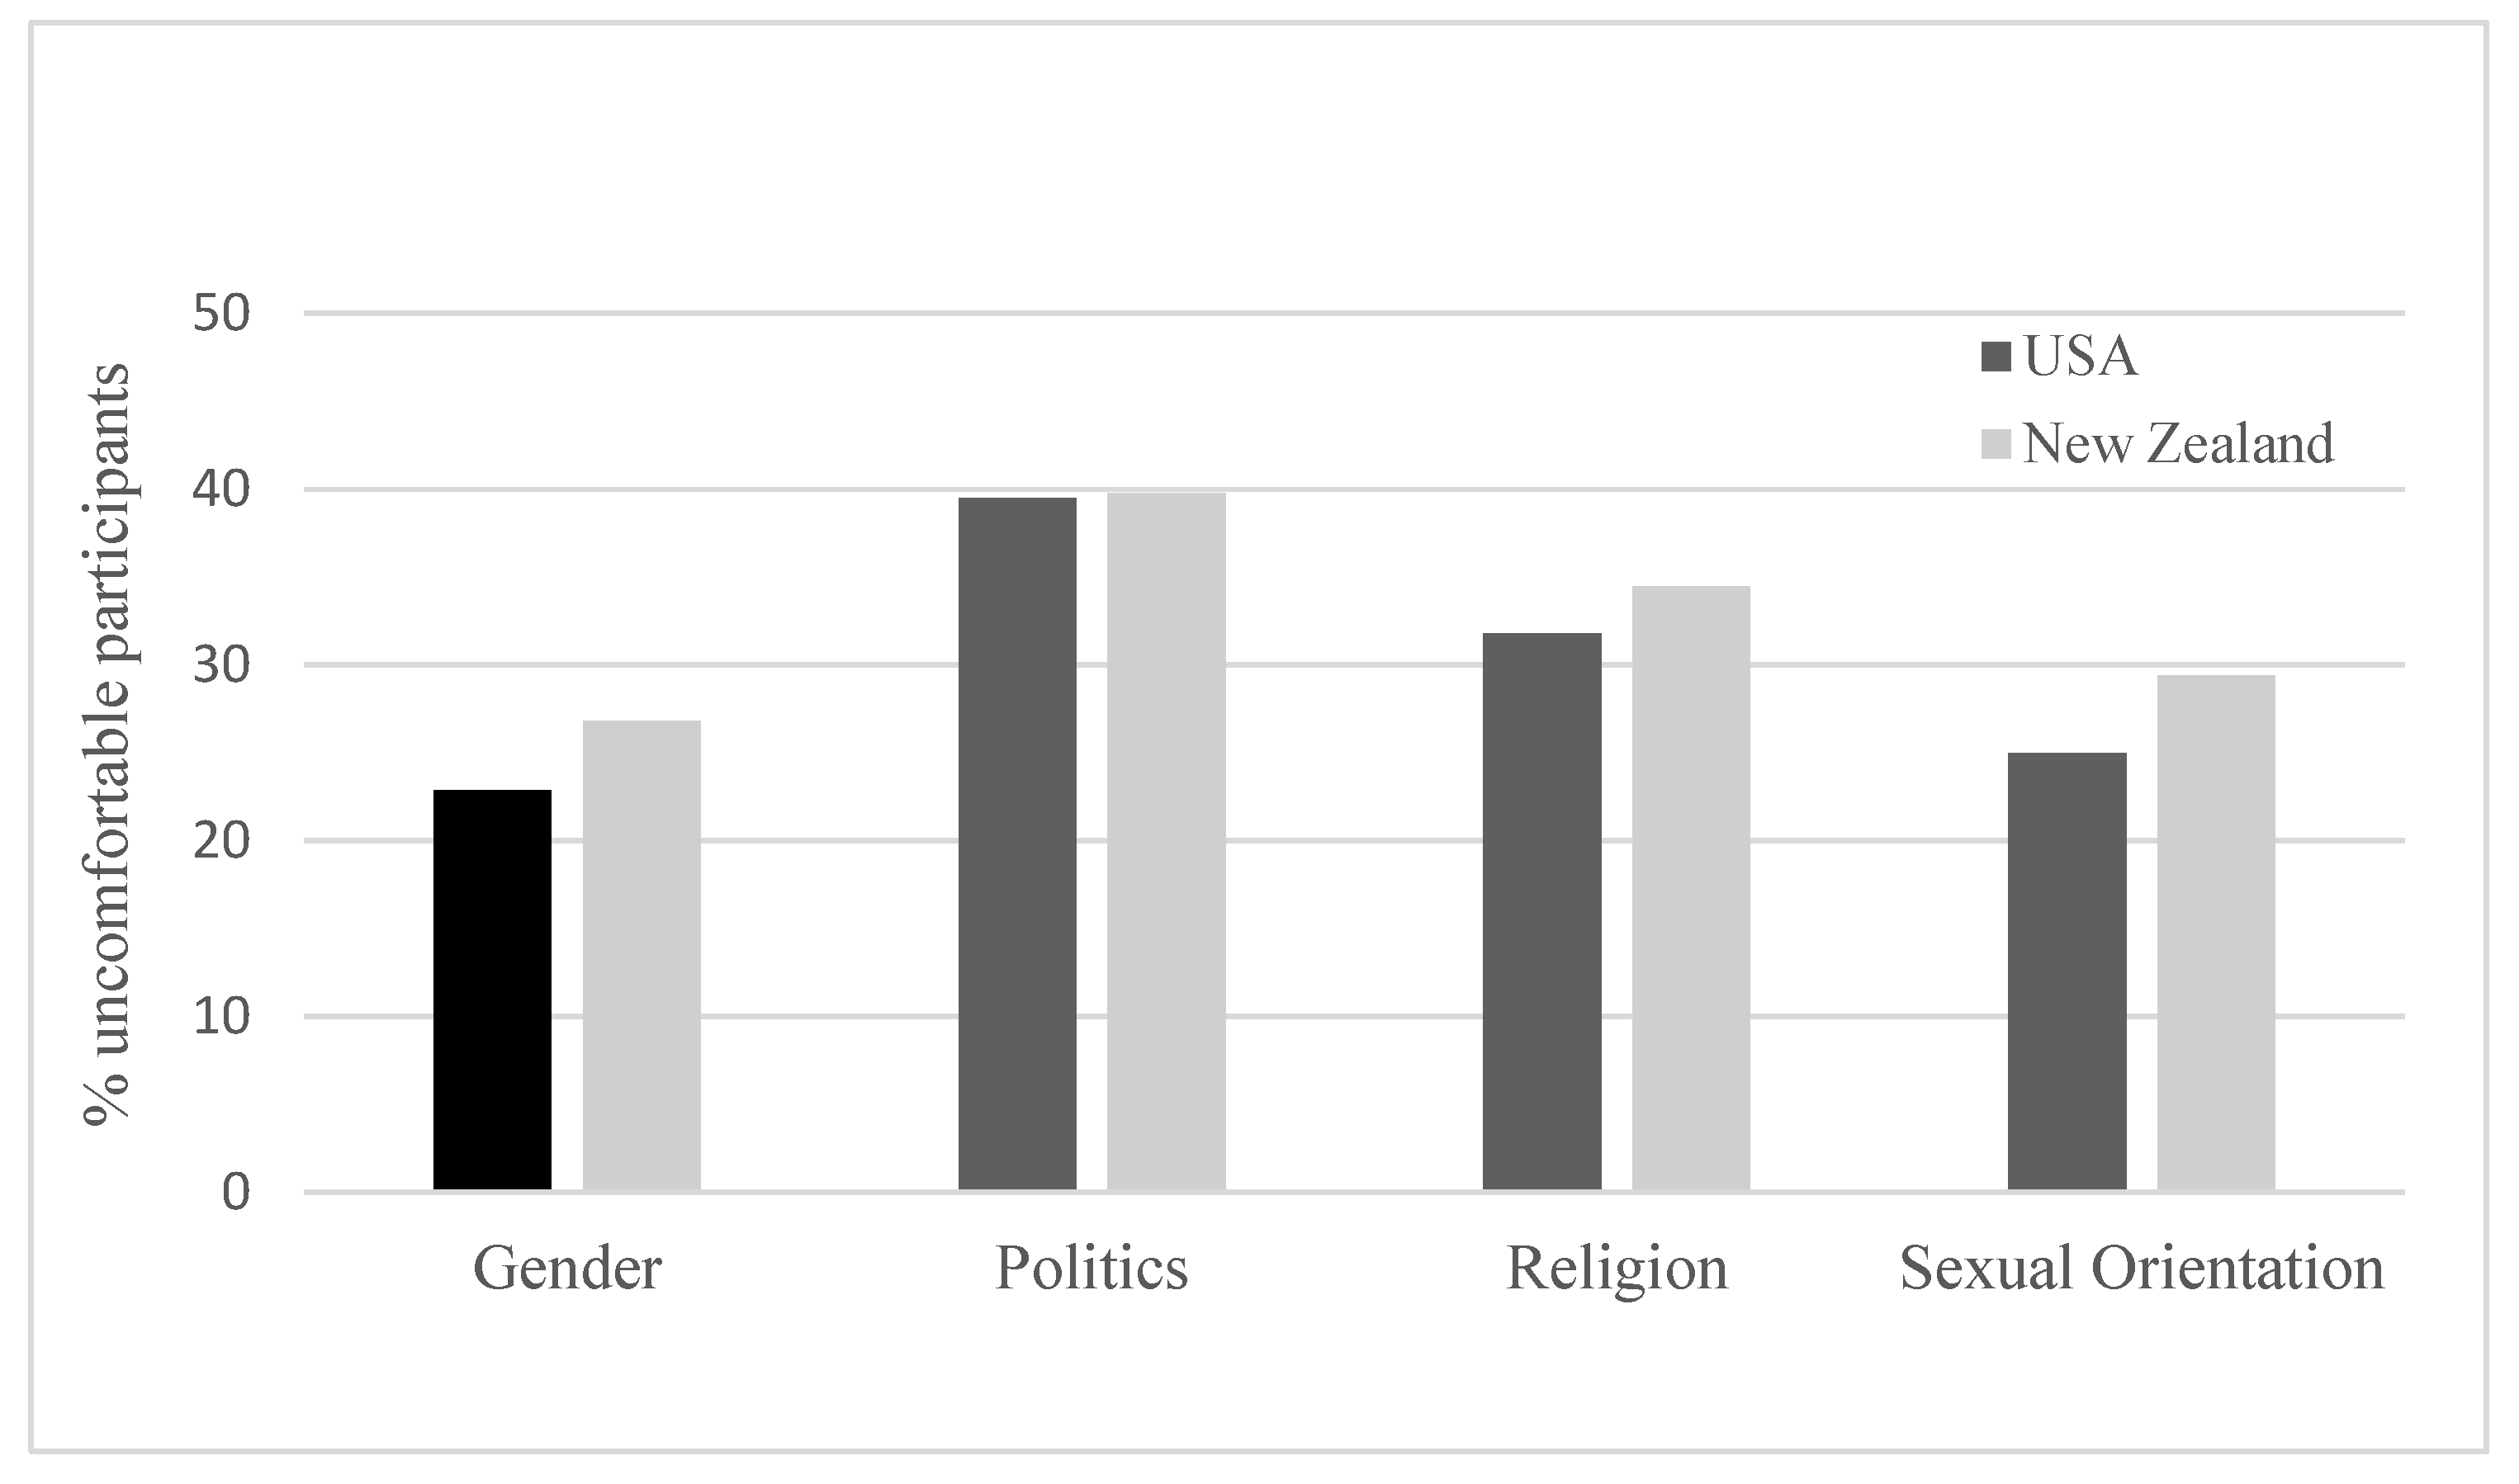
3.2. Gender Differences
Both the American and New Zealand samples skewed female to an equivalent extent (64.9% and 61.6% respectively). The small proportion of participants who defined themselves in terms other than “male” and “female”, or who chose not to answer (6.4% and 5.0% in the two samples, respectively), were not included in the analyses. As seen in Figure 2, women in both countries expressed significant, and equivalent, reluctance to speak about politics and religion, relative to men. On the other hand, men were more reluctant than women to speak about issues of gender and sexual orientation, but only in New Zealand, while Americans did not differ. Chi-squared tests appear in Table 1.
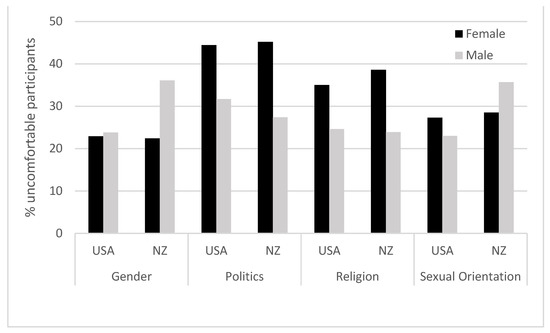
Figure 2.
Reluctance to speak as a function of participant sex, topic, and sample.

Table 1.
Results of all demographic comparisons.
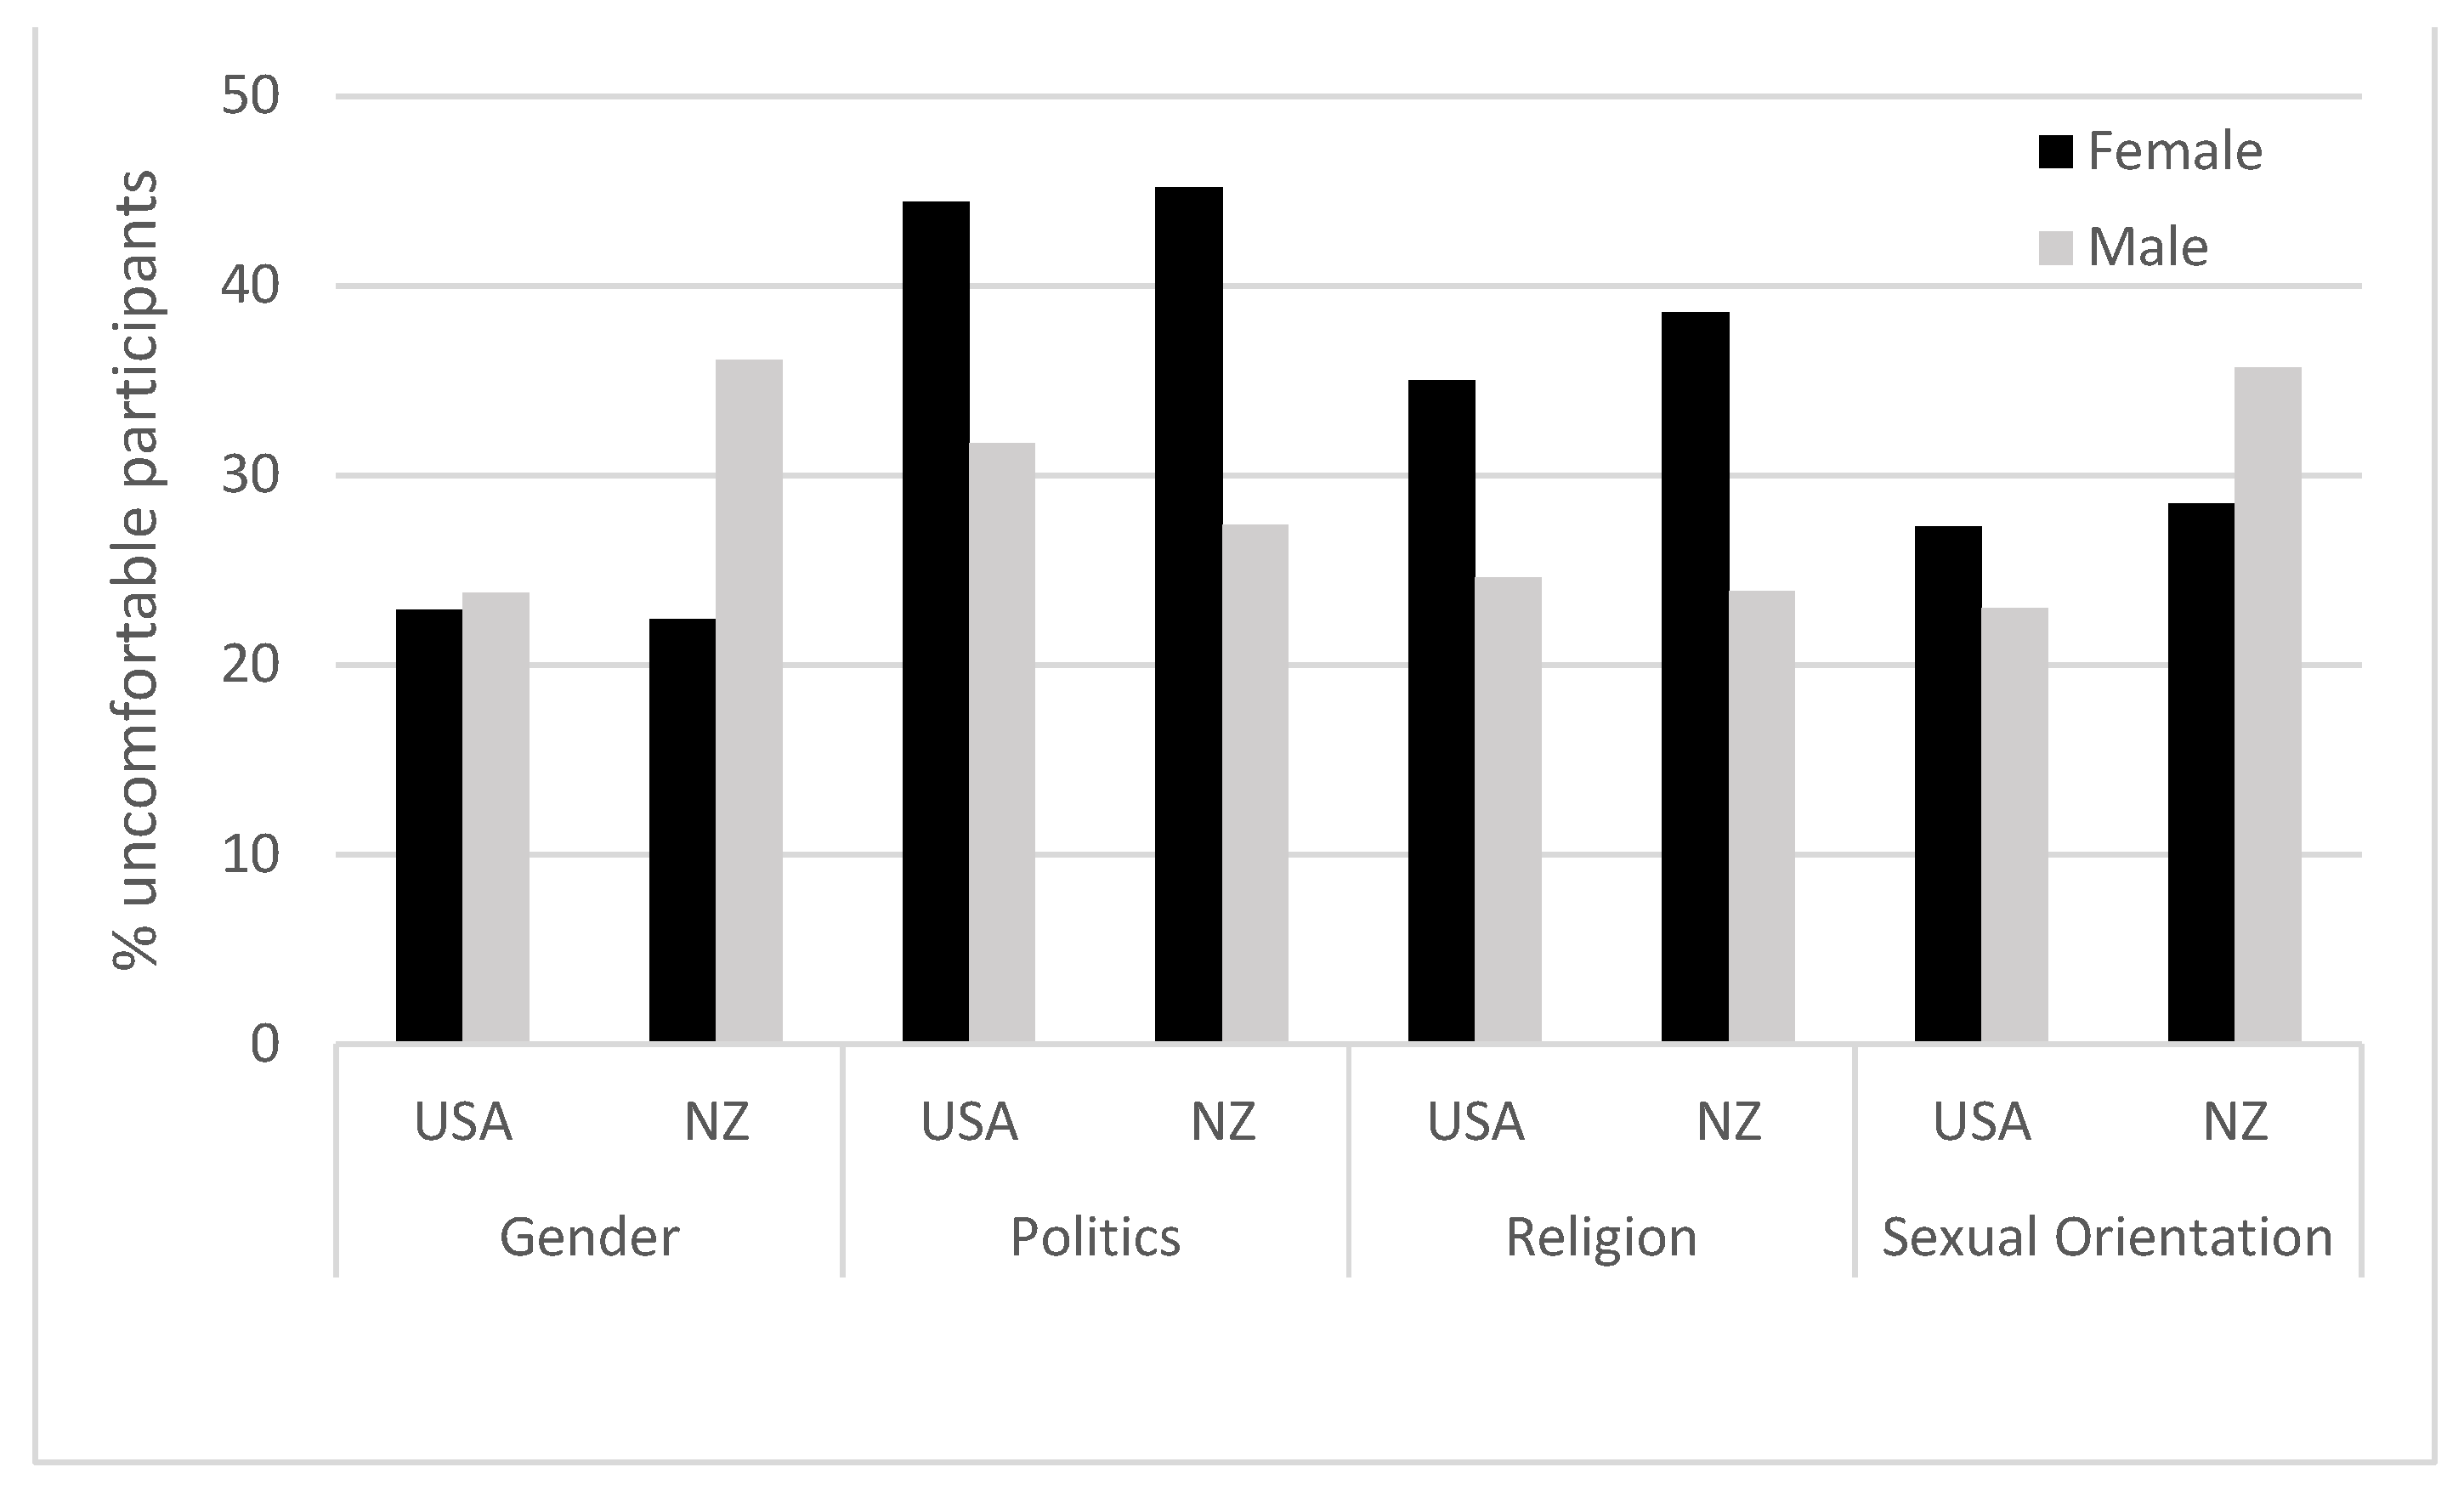
3.3. Political Differences
In order to compare the New Zealand to the American sample, participants were coded as either “left-leaning” (including “centrist/moderate”) or as “right-leaning” (this dichotomy was operationalized in the American sample as “thinking of yourself as” a Democrat or Republican, respectively). Other political identities that did not cleanly map on to a right–left political continuum (39.0% and 33.8% of the American and New Zealand samples, respectively) were not included in these analyses. Both samples leaned strongly left, although the difference was more extreme in New Zealand than in the United States (6.6% versus 16.1% right-leaning, respectively). The percentages of right- and left-leaning participants who reported reluctance to speak appear in Figure 3.
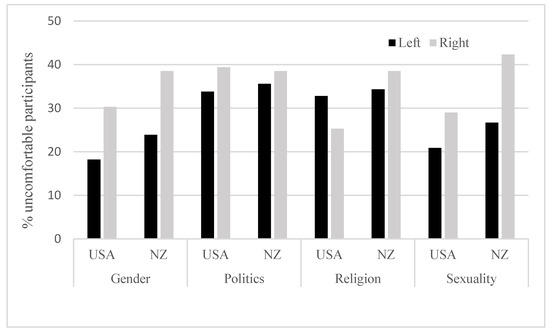
Figure 3.
Reluctance to speak by political leaning, topic, and sample.
As seen in the figure, right-leaning New Zealand students, like their American counterparts, were more reluctant to speak about issues of gender and sexuality than left-leaning students. Reluctance to speak about politics was equivalent, and relatively high, in both samples, regardless of political leanings, while left-leaning Americans were more reluctant than right-leaning Americans to discuss religion (there was no difference in New Zealand). Chi-squared tests appear in Table 1.
3.4. Religious Differences
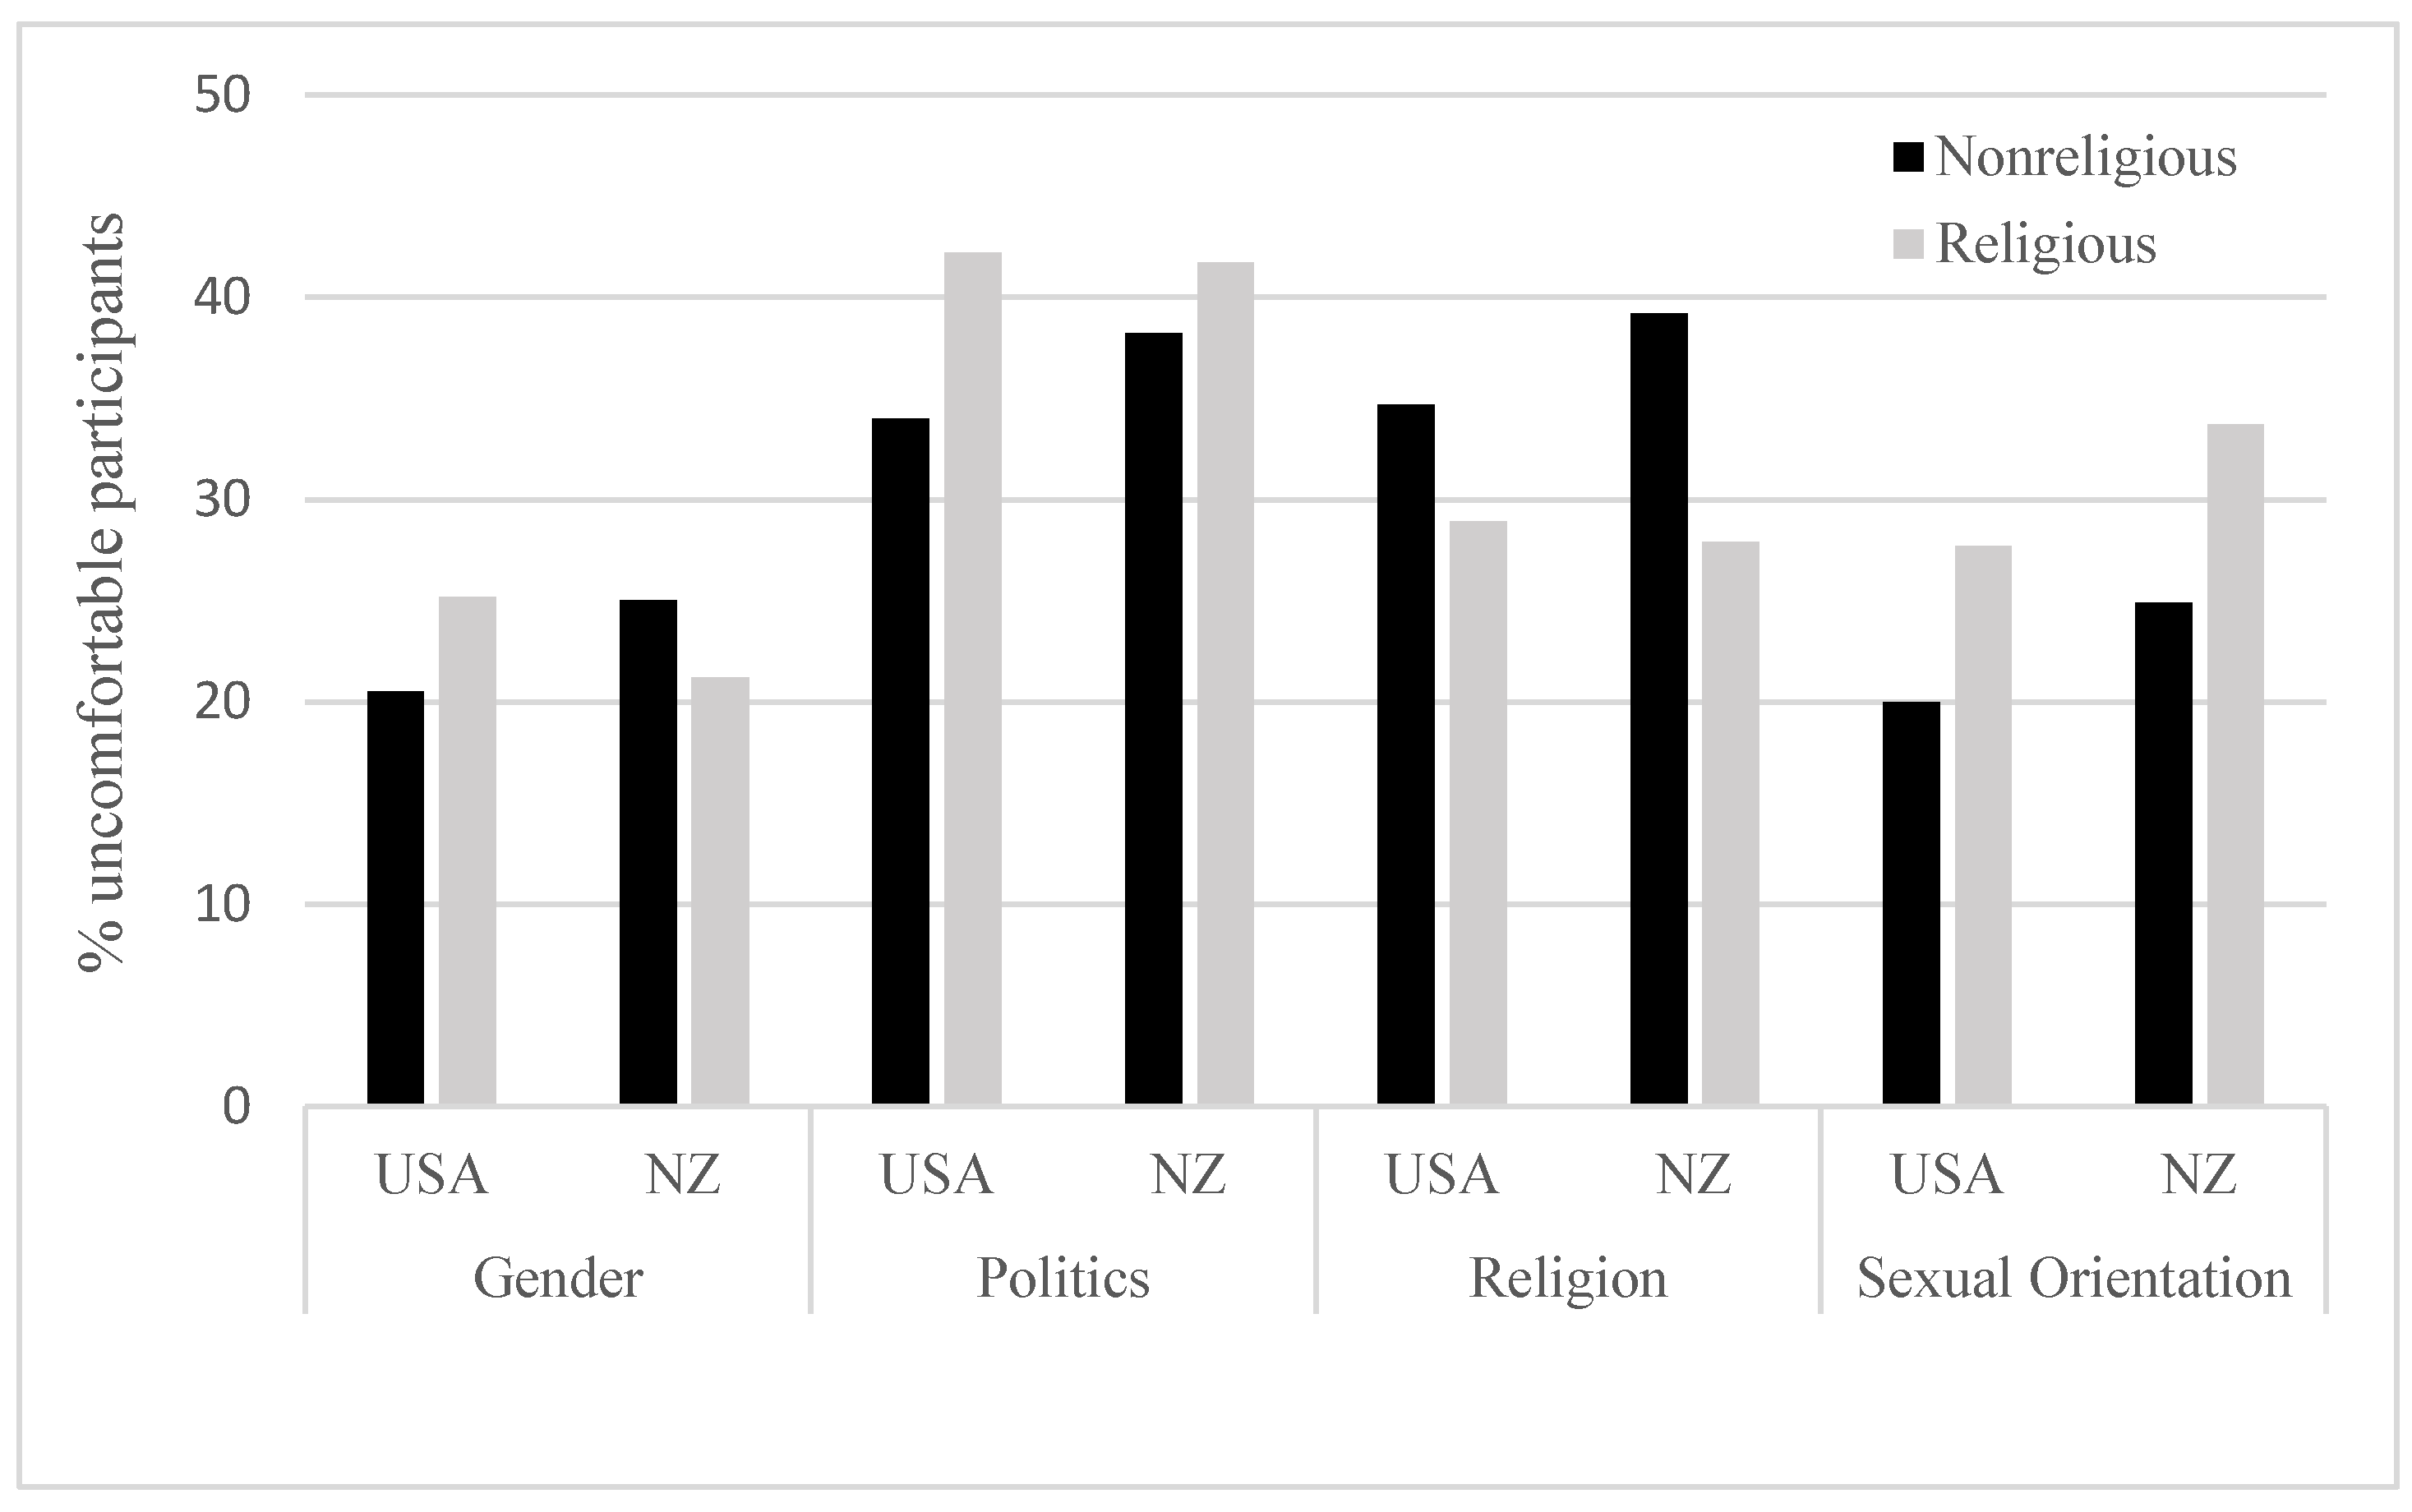
Participants were classified as religious if they specified a religious identification (e.g., Christian, Muslim), nonreligious if they described themselves as such (in the New Zealand sample), or as atheist or agnostic (in the American sample). Participants who described themselves in other terms or who chose not to answer (14.6% and 23.9% in the New Zealand and American samples, respectively) were excluded from these analyses. Consistently with national demographics, the American sample reported much greater religiosity than the New Zealand sample (56.3% versus 13.1%). The percentages of religious and nonreligious participants who reported reluctance to speak appear in Figure 4.
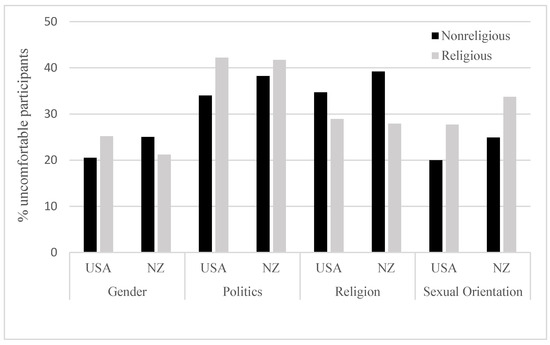
Figure 4.
Reluctance to speak by religiosity, topic, and sample.
As seen in the figure, religiosity predicted discomfort in largely the same way in the two countries: nonreligious people were more reluctant to discuss religion and less reluctant to discuss sexual orientation than religious people (results of chi-squared tests and effect sizes appear in Table 1). The one exception was in politics: religious Americans were more reluctant to discuss politics, but religiosity was unrelated to discomfort in New Zealand.
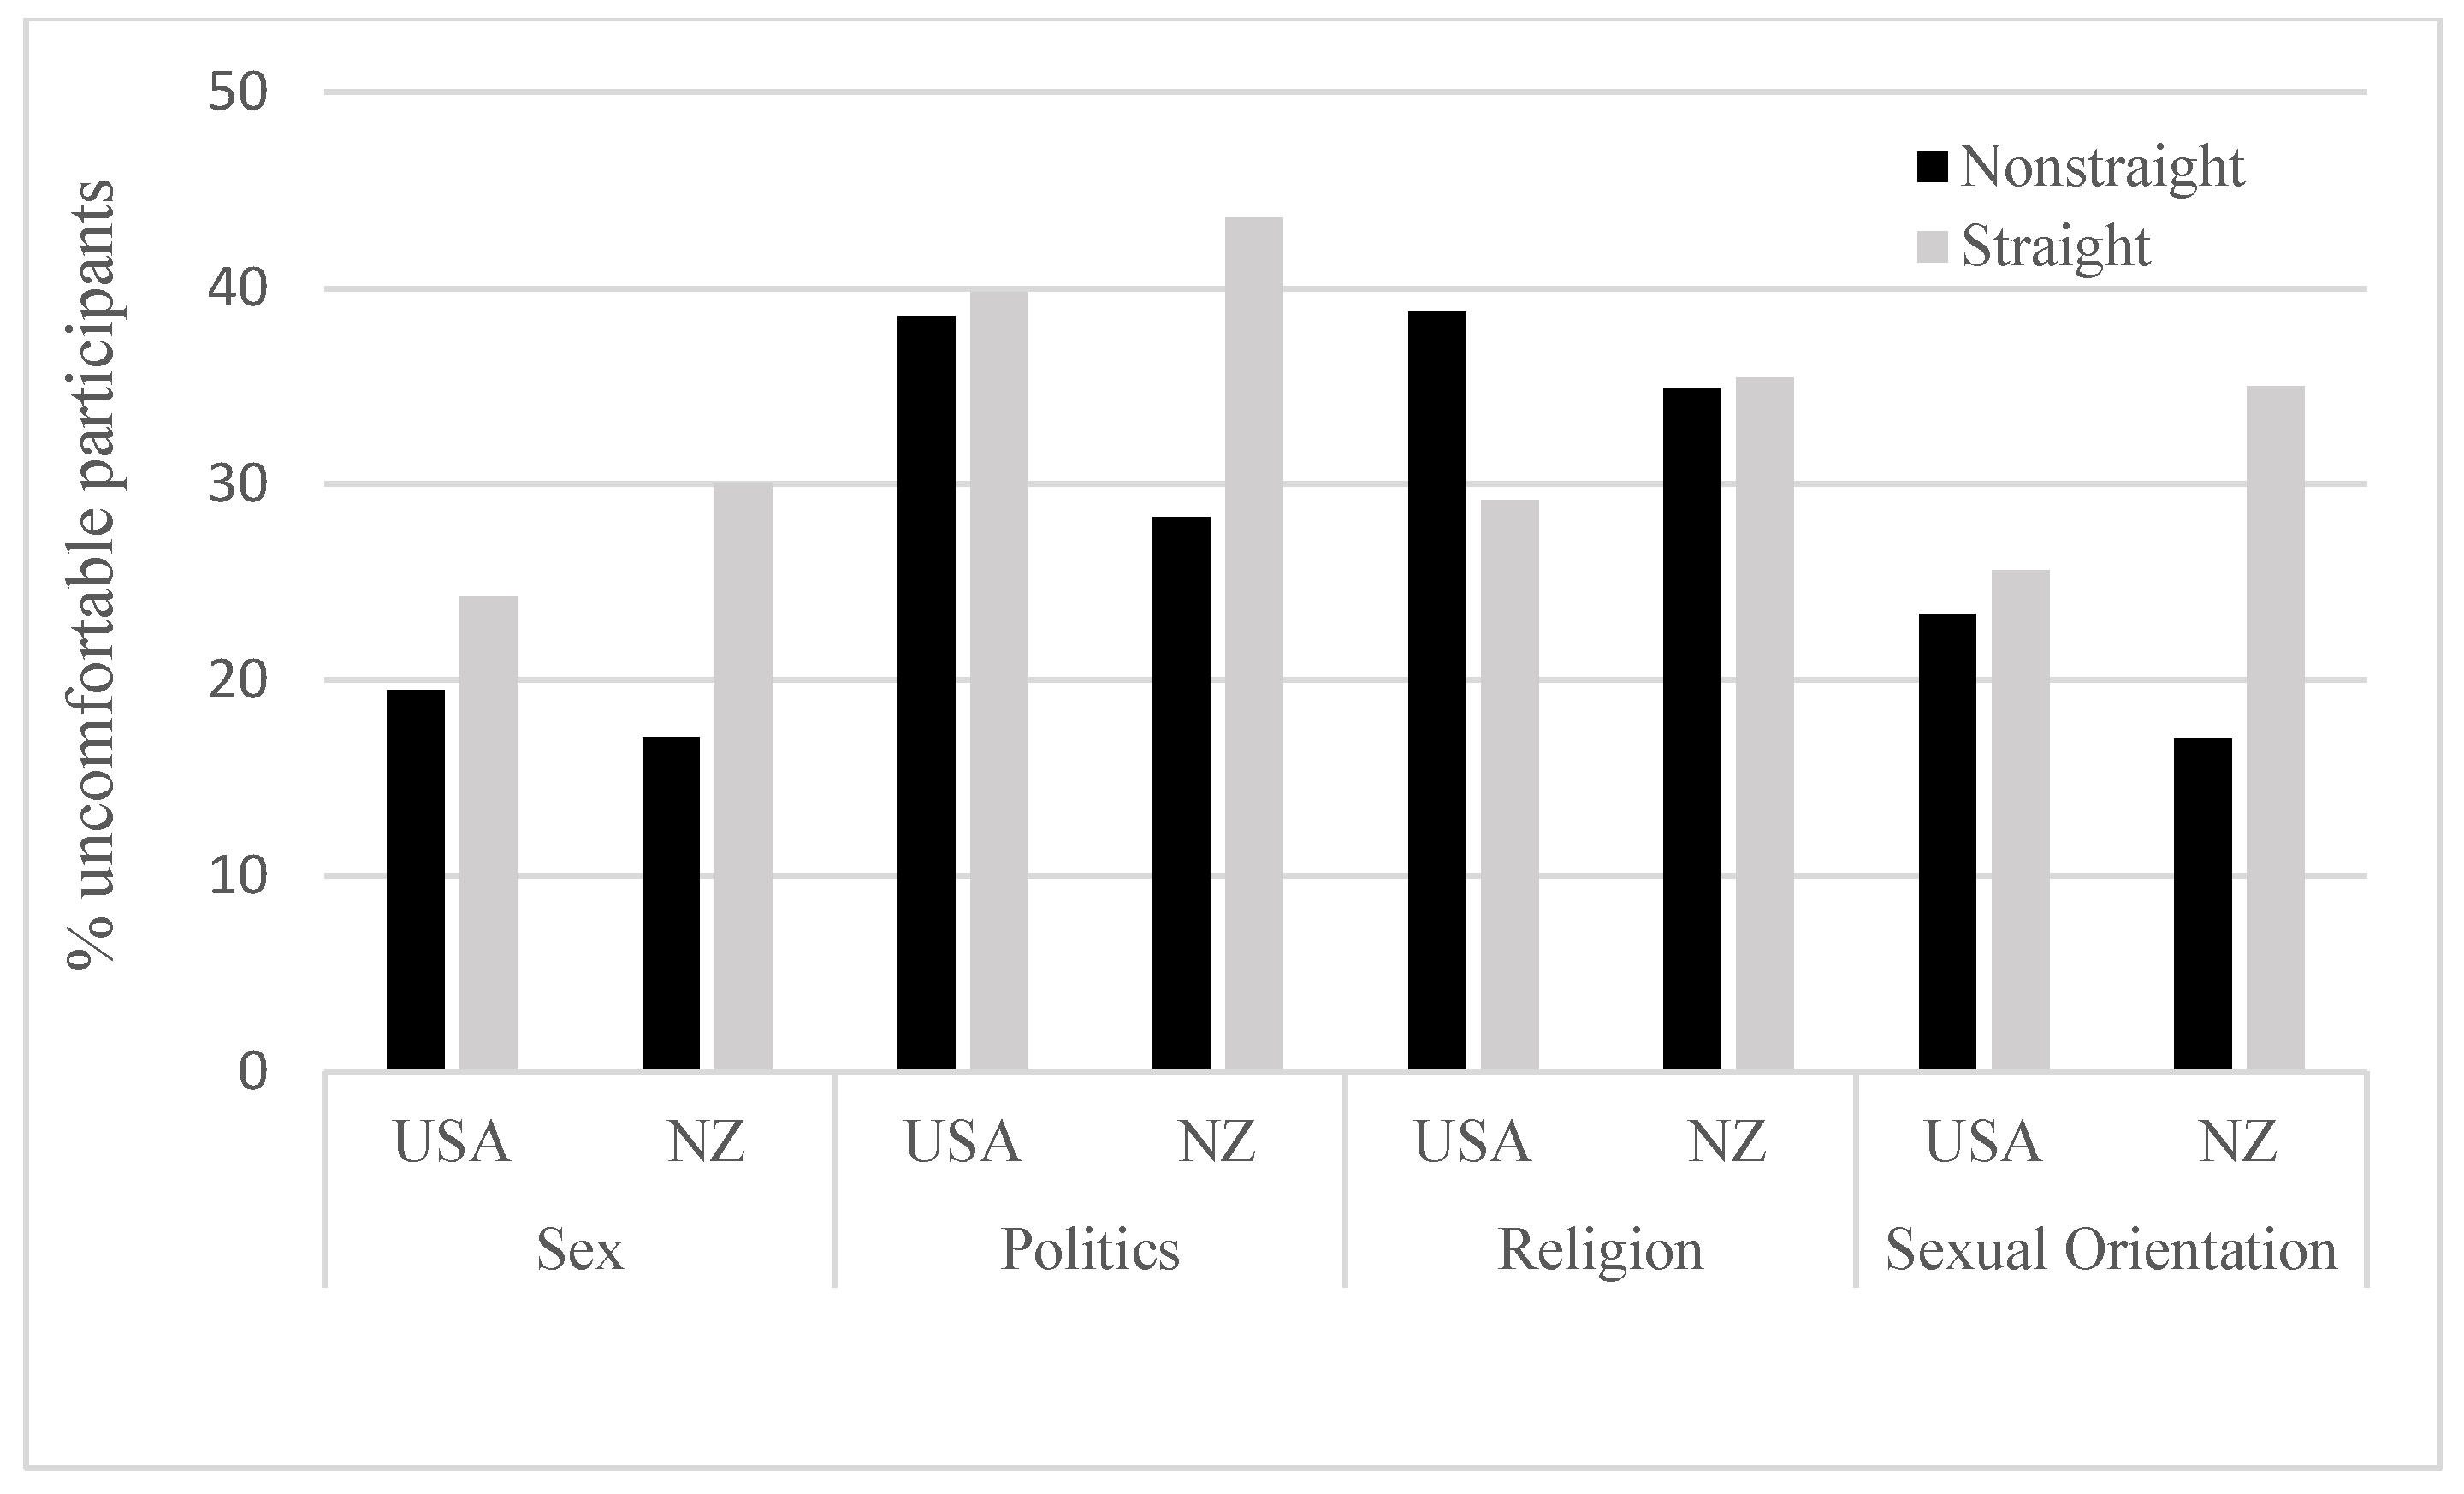
3.5. Sexual Orientation Differences
An equivalent majority of students identified as “straight” in both the American and New Zealand samples (72.2% and 70.4%, respectively). To maximize the number of analyzable participants and to accommodate the variety of self-identifications, all other participants were coded simply as “non-straight” for purposes of these analyses. The small number (2.8%) of New Zealanders who “preferred not to say” were not included.
Unlike other demographics, sexual orientation effects were markedly different in the two countries. In New Zealand, but not the United States, straight participants were more reluctant than non-straight participants to speak on sex, politics, and (especially) sexual orientation. In the United States, the two groups differed only on the topic of religion, with non-straight participants more reluctant (Americans also exhibited a small difference on sex). Percentages of reluctant participants appear in Figure 5, and chi-squared tests and effect sizes in Table 1.
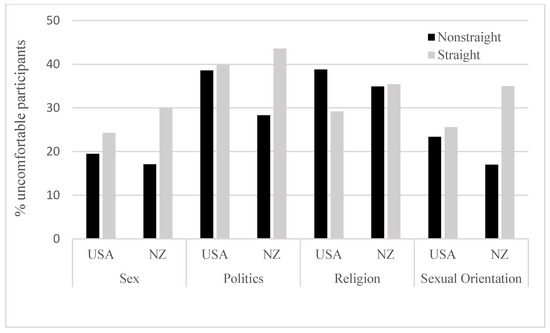
Figure 5.
Reluctance to speak by sexual orientation, topic, and sample.
3.6. Perception of Other Groups’ Discomfort
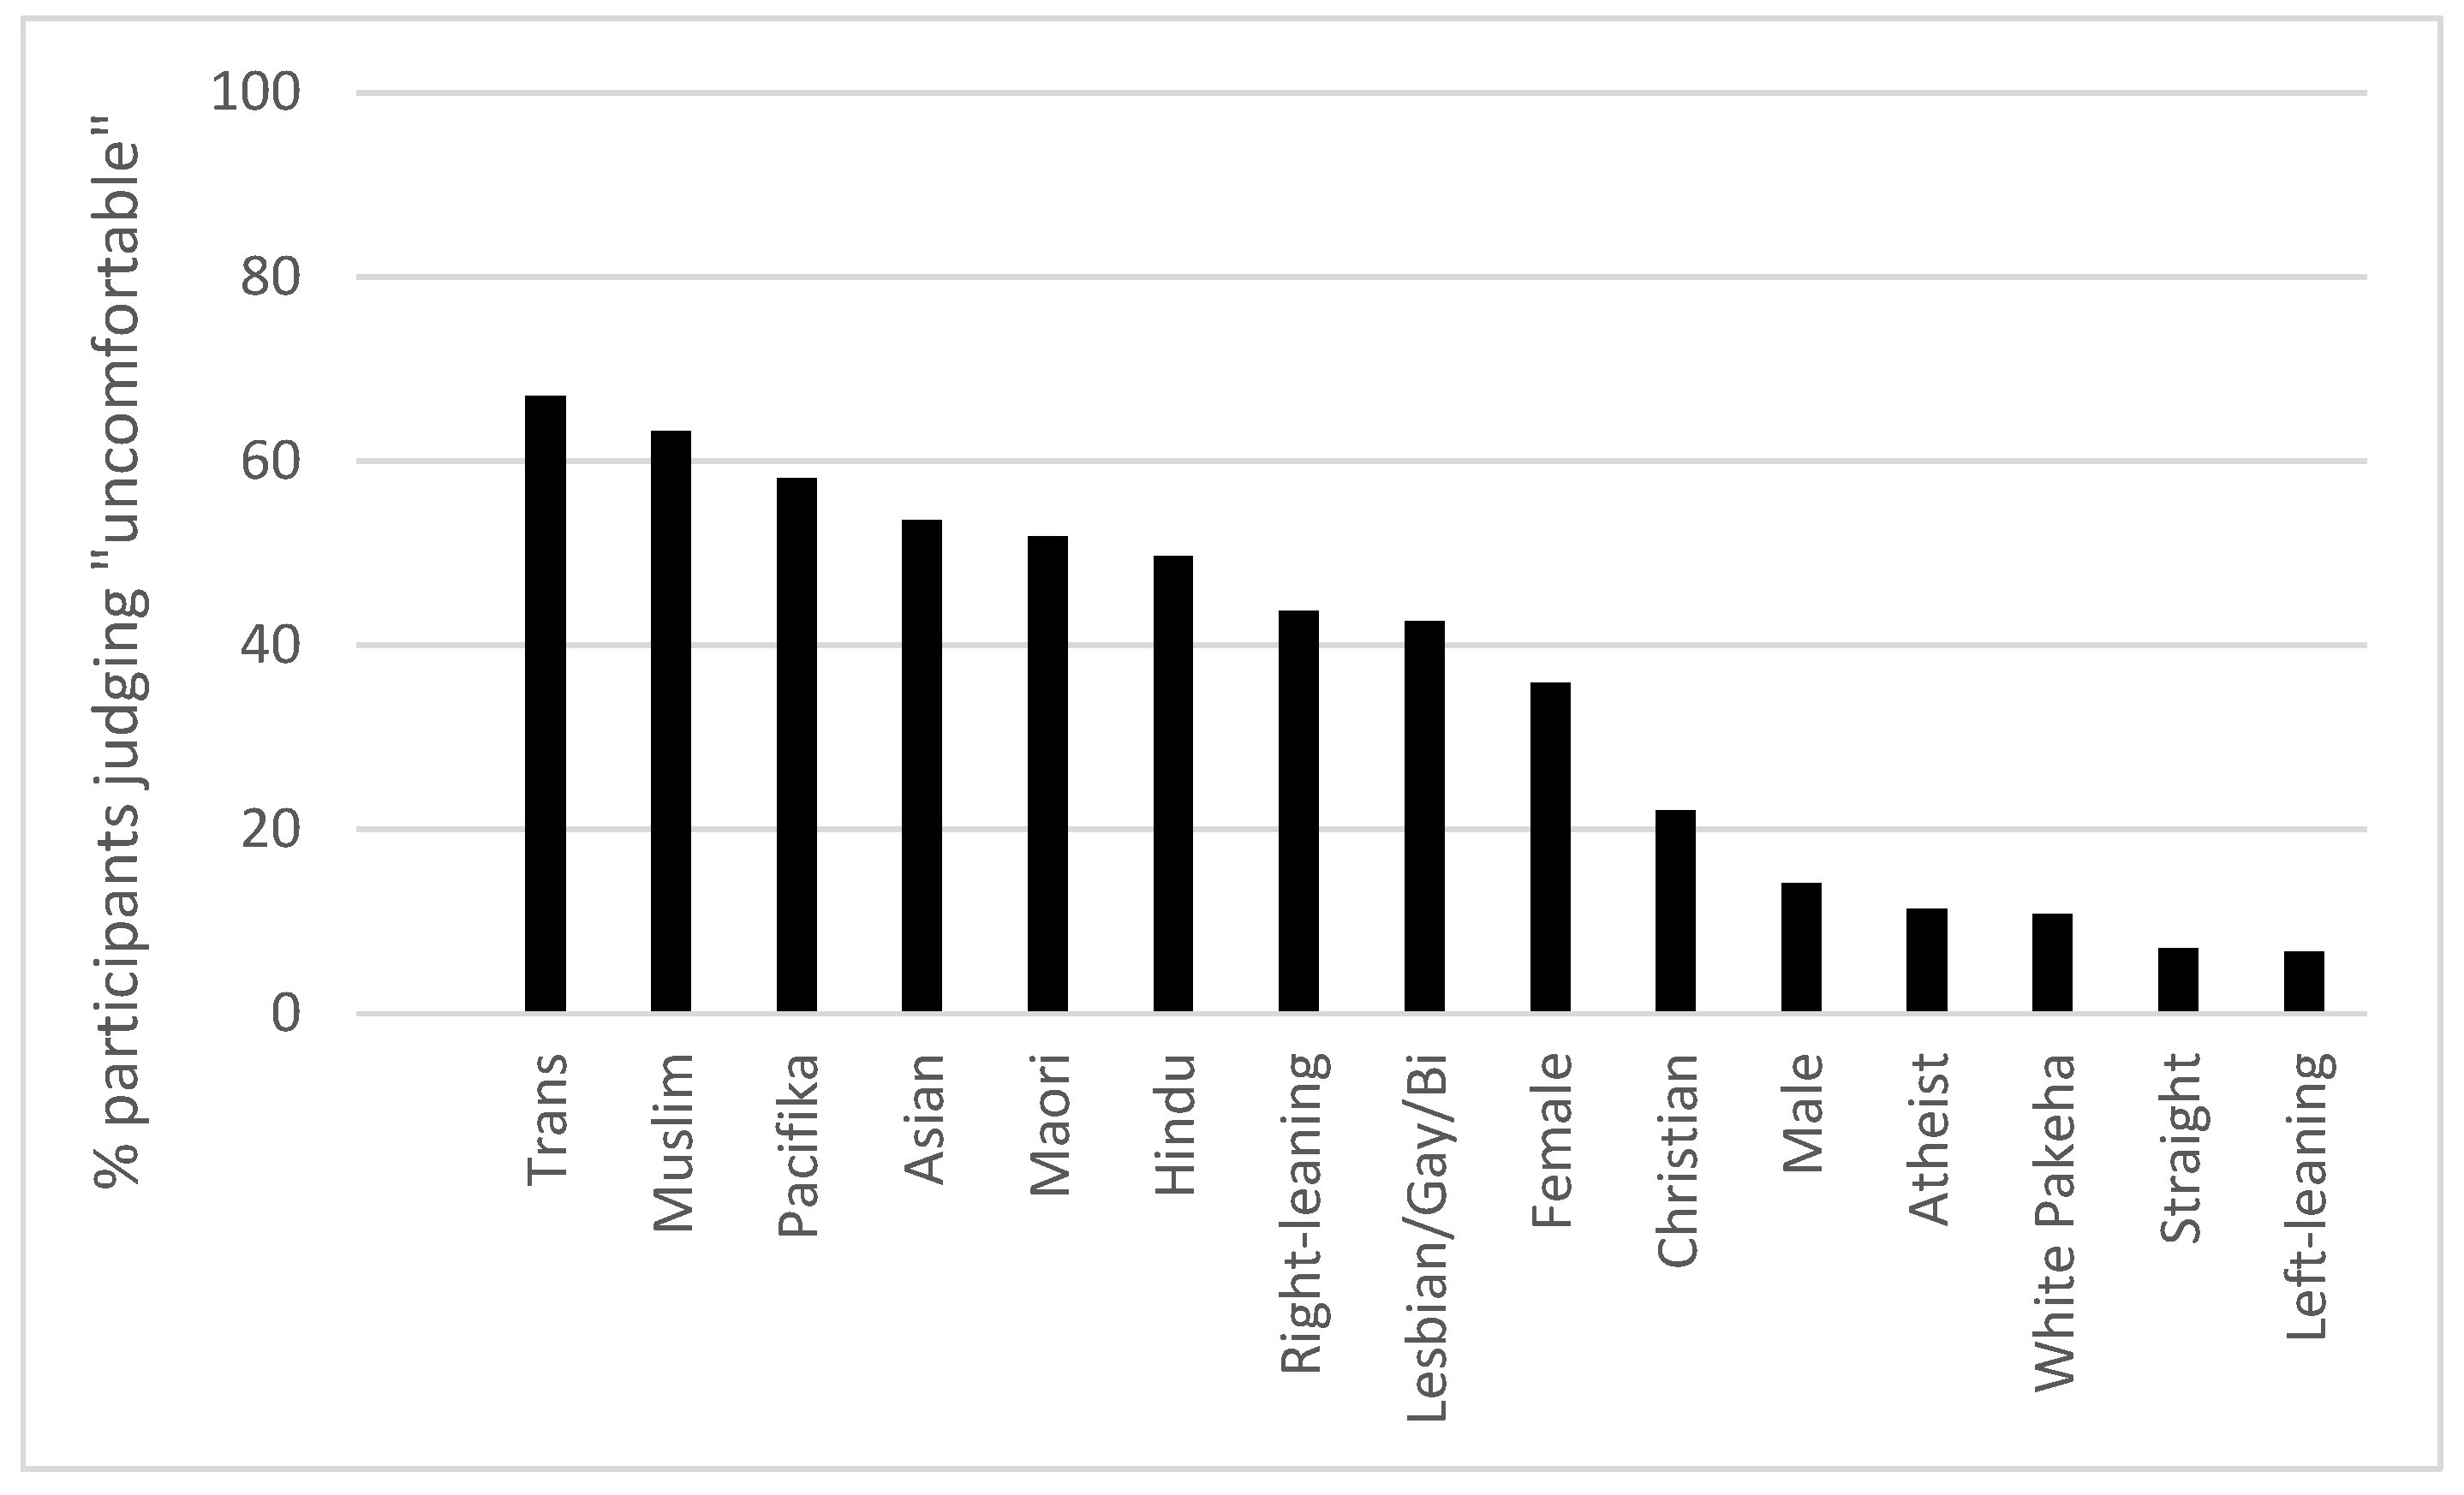
The percentages of participants who judged each of 15 political, gender-based, sex-based, and religious groups as “less comfortable sharing their views in a classroom discussion compared to the average student” appear in Figure 6. In general, perceptions mirror minority and/or social status in New Zealand culture, with female students judged to be less comfortable than male students, right-leaning less comfortable than left-leaning, non-Christian less comfortable than Christian, and LGBT (and particularly transgender) less comfortable than straight.

Figure 6.
Perceptions of 15 groups’ discomfort. Note: Values represent the proportion of participants who judged each group to be “less comfortable sharing their views in a classroom discussion compared to the average student.”
More interestingly, perceptions did not always conform to reality, though differences in the wording of the questions make direct comparisons difficult. As seen in Figure 2, Figure 3, Figure 4 and Figure 5, although the data for political leanings were largely consistent with perceptions, it was straight, not LGBT students, who were more reluctant to speak in class. Differences between sex and religious groups were more nuanced, with reluctance varying by topic.
Finally, it is worth examining participants’ open-ended reports of other groups, not on our list, that “may be especially uncomfortable sharing their views.” A qualitative analysis of the 182 listed groups revealed that the most commonly cited additional groups were students with special needs, including students with disabilities (32 responses), mental health issues, and behavioral or learning difficulties, as well as students who were neurodivergent, shy or introverted, or harassed or bullied. A number of other students offered alternative or subcategories of groups listed in the survey, particularly with regard to gender identity (e.g., nonbinary, gender-diverse), race (indigenous, African), and religiosity (Sikh, Buddhist). Only a small number of listed demographic categories were not considered in the study, including age, weight, socioeconomic status, and immigration status.
4. Discussion
It is clear from the Heterodox Academy’s recent data that many students are personally reluctant to air their views in an academic setting, the very context in which those views might best be tested. Even more students, a majority, believed that the climate on their campus was not conducive to free expression, and even more believed it should be (Zhou and Zhou 2022). However, it is also clear that such reticence is not limited to American campuses. Americans in general are polarized, reluctant to engage in debate, particularly political debate, with those who likely disagree. The causes and consequences of these trends are beyond the scope of this paper, but the distinctive (if not unique) situation in the United States raises the question of how (and whether) to address the situation on campus. Is the chill in campus expression simply a special, rarefied instantiation of American civic life, or is campus expression under threat more generally as a consequence of changing norms worldwide? An obvious first step to answering this question is to collect more data—ideally, as we have, in a very different sociopolitical context, such as New Zealand.
However, despite New Zealand’s differences in terms of demographics, political structures, and interpersonal animosity, our results, generally speaking, bear out those in the United States. Depending on the issue, between 20% and 40% of New Zealand students expressed reluctance to “speak up and give their views” in the classroom, and overall, 65.4% were reluctant to speak on at least one of the topics surveyed, significantly greater than the corresponding proportion (i.e., for the same four topics) in the American sample (56.6%). In both countries, politics elicited the most reluctance, followed by religion, and then gender and sexual orientation (which were equivalent), although there was some evidence for New Zealanders’ greater reluctance on the latter topics.
Other similarities emerged when results were broken down by specific topics and demographic groups. In both countries, women (versus men) were more reluctant to speak about politics and religion, while right- (versus left-) leaning students were more reluctant to speak about gender and sexual orientation. Religiosity crossed these topic pairings: perhaps unsurprisingly, religious (versus nonreligious) participants were more reluctant to talk about sexual orientation, but less reluctant to talk about religion itself. No topic was avoided by all groups and no group avoided all topics in either country, but with the exception of religiosity, there was also no evidence of demographic parochiality. From this perspective, the similarities across samples are remarkable. New Zealand students are, as a group, far more liberal and less religious than their American counterparts, yet for the most part express similar concerns about expressing their opinions about these and other topics on campus.
There were, however, notable exceptions to these consistencies. As noted, New Zealand (versus American) students were slightly more reluctant overall to discuss gender and sexual orientation, and this difference appears to be driven by straight males. Straight male New Zealanders were also particularly reluctant to talk about politics, perhaps reflecting the infusion of gender into politics in this country. Analogously, the distinctive reluctance of left-leaning Americans to discuss religion might be associated with the conflation of religion and politics in the United States. Both accounts are only speculative at this point, however.
While straight (and on some topics, male) students report being the least comfortable in New Zealand classrooms, they are estimated by participants to be among the most comfortable (see Figure 6). Other discrepancies did not emerge to the same extent: left- (versus right-) leaning students, for example, reported greater comfort on all topics, and were also estimated to be so. Discrepancies between “self” and “other” judgments are common in the social psychological literature (e.g., Bradley 1978; Kruger and Dunning 1999), although they are more typically the result of self-serving motives, with individuals reporting more positive behavior than they predict for others, and it is not clear whether or not “reluctance to speak” represents a similar phenomenon.
Another reason to be cautious about interpreting and comparing self-assessment of “reluctance” and “comfort” is that the meaning and cause of these states may differ between and within groups. It is not clear, for example, whether reported (or forecast) discomfort is due to fear of progressives’ reprisals for politically incorrect opinions, or due to progressives’ own concern about “unsafe” conditions in the classroom (the two interpretations support opposite conclusions about the value of unfettered speech), or indeed due to fear of institutional responses to perceived bias (e.g., “bias response teams”; Miller et al. 2018). Nevertheless, discrepancies between predicted and self-reported willingness to engage in classroom discussion are important. Whatever the cause of their reluctance, students who are fearful of contributing to class discussions, but who are not recognized as such, are likely to become further alienated.
It is important to acknowledge that the current study itself is necessarily an imperfect replication of the research on which it was based. In particular, demographic categories used in New Zealand do not map perfectly onto those in the United States (e.g., “atheist” versus “nonreligious”), adding some error to cross-national comparisons. Indeed, racial categories are so discrepant in the two countries that questions on this topic were largely omitted, leaving an unfortunate gap in the data. Even when the same wording was used, it is not clear that it refers to the same groups in both countries: “gender”, for example, increasingly refers to gender identity rather than biological sex, and participants likely had a mix of the two in mind in both studies. We also note that our data primarily come from three of New Zealand’s eight universities, and so are potentially limited in that regard.
5. Conclusions
The results are clear: chilled campus speech is not unique to the United States. The results do not, however, support a universal phenomenon. Like any country, New Zealand is quite distinct from the United States on some dimensions, but very similar on others. It is not possible from an analysis of New Zealand alone to tell which dimensions are relevant to campus expression or the extent to which results are the consequence of American cultural exportation. Our results ultimately represent just one, albeit significant, dataset, and we encourage other researchers to administer their own versions of the survey to their own students—and academic staff—to create a more accurate picture of the international situation on university campuses.
Author Contributions
J.H. analyzed data and wrote the first draft of the manuscript, but all authors contributed equally to conceptualization and implementation of the study. All authors have read and agreed to the published version of the manuscript.
Funding
This research was partially funded by a grant from the Heterodox Academy.
Institutional Review Board Statement
This study was approved by the institutional review boards at all participating institutions.
Informed Consent Statement
All participants provided written informed consent.
Data Availability Statement
Data are available at https://osf.io/mjz9c/ (accessed on 20 October 2022).
Conflicts of Interest
The authors declare no conflict of interest.
Appendix A. The 2021 New Zealand Campus Expression Survey
- (1)
- Think about being in a class that was discussing an issue to do with GENDER. How comfortable would you feel about speaking up and giving your views on this topic?
| Very | Somewhat | Not really | Not at all |
- (2)
- Think about being in a class that was discussing an issue to do with POLITICS. How comfortable would you feel about speaking up and giving your views on this topic?
| Very | Somewhat | Not really | Not at all |
- (3)
- Think about being in a class that was discussing an issue to do with RELIGION. How comfortable would you feel about speaking up and giving your views on this topic?
| Very | Somewhat | Not really | Not at all |
- (4)
- Think about being in a class that was discussing an issue to do with SEXUAL ORIENTATION. How comfortable would you feel about speaking up and giving your views on this topic?
| Very | Somewhat | Not really | Not at all |
- (5)
- If you were to speak up and give your views on a controversial issue during a class discussion, how concerned would you be that the following would occur: *
| Not at All Concerned | Slightly Concerned | Somewhat Concerned | Very Concerned | Extremely Concerned | |
| The professor would criticize my views as offensive. | |||||
| The professor would give me a lower grade because of my views. | |||||
| The professor would say my views are wrong. | |||||
| Other students would criticize my views as offensive. | |||||
| Someone would post critical comments about my views on social media. | |||||
| Someone would file a complaint claiming that my views violated a campus harassment policy or code of conduct. |
- (6)
- If you were to speak up and give your views about a non-controversial issue during a class discussion, how concerned would you be that the following would occur: *
| Not at All Concerned | Slightly Concerned | Somewhat Concerned | Very Concerned | Extremely Concerned | |
| The professor would criticize my views as offensive. | |||||
| The professor would give me a lower grade because of my views. | |||||
| The professor would say my views are wrong. | |||||
| Other students would criticize my views as offensive. | |||||
| Someone would post critical comments about my views on social media. | |||||
| Someone would file a complaint claiming that my views violated a campus harassment policy or code of conduct. |
- (7)
- Now that you have told us how comfortable YOU feel in classroom discussions, please tell us how you think members of various OTHER groups on campus feel in those classroom discussions. Think about each of the following categories of students at your university. Do you think that students in that category are more comfortable sharing their views in a classroom discussion compared to the average student, less comfortable compared to the average student, or about the same as the average student? *
| More Comfortable Sharing Their Views than the Average Student | Less Comfortable Sharing Their Views than the Average Student | About the Same as the Average Student | |
| Left-leaning or progressive students | |||
| Right-leaning or conservative students | |||
| White/Pākehā students | |||
| Māori students | |||
| Pasifika students | |||
| Asian students | |||
| Female students | |||
| Male students | |||
| Transgender students | |||
| Gay/lesbian/bisexual students | |||
| Straight students | |||
| Hindu students | |||
| Muslim students | |||
| Atheist students |
Is there any other group, not listed above, that you think may be especially uncomfortable sharing their views? [Free text box.]
- (8)
- The following questions are about your experiences ON CAMPUS IN GENERAL—including classroom activities, public events with speakers, meetings of student organizations, informal gatherings, and conversations with other students. *
| More than Once a Week | Every Few Weeks | A Few Times a Year | Once a Year or Less | It Never Happens | |
| How frequently are you treated badly or unfairly because of your GENDER? | |||||
| How frequently are you treated badly or unfairly because of your POLITICAL VIEWS? | |||||
| How frequently are you treated badly or unfairly because of your RACE OR ETHNICITY? | |||||
| How frequently are you treated badly or unfairly because of your RELIGIOUS BELIEFS? | |||||
| How frequently are you treated badly or unfairly because of your SEXUAL ORIENTATION? |
- (9)
- Thinking about STUDENTS at your college/university, would you say most are politically to the left of you or politically to the right of you?
- Most are to the left of me
- Most are to the right of me
- Most have positions close to mine
- About as many are to the left of me as to the right of me
- Don’t know
- (10)
- Thinking about TEACHING STAFF at your college/university, would you say most are politically to the left of you or politically to the right of you?
- Most are to the left of me
- Most are to the right of me
- Most have positions close to mine
- About as many are to the left of me as to the right of me
- Don’t know
- (11)
- Thinking about ADMINISTRATORS at your college/university, would you say most are politically to the left of you or politically to the right of you?
- Most are to the left of me
- Most are to the right of me
- Most have positions close to mine
- About as many are to the left of me as to the right of me
- Don’t know
- (12)
- How often does your college/university explicitly foster or defend viewpoint diversity?
- Very frequently
- Frequently
- Occasionally
- Rarely
- Very rarely
- Never
- (13)
- How would you describe your POLITICS?
- Left-wing
- Right-wing
- Centrist/moderate
- Prefer not to say
- Other [free text box]
- (14)
- How would you describe your ETHNICITY/RACE?
- NZ European/Pākehā
- Māori
- Pasifika
- Asian
- Prefer not to say
- Other
- (15)
- How would you describe your SEX/GENDER?
- Male
- Female
- Prefer not to say
- Other [free text box]
- (16)
- How would you describe your SEXUALITY?
- Straight
- Gay
- Bisexual
- Prefer not to say
- Other [free text box]
- (17)
- How would you describe your RELIGIOUS BELIEFS?
- Not religious
- Christian
- Hindu
- Muslim
- Buddhist
- Prefer not to say
- Other [free text box]
- (18)
- What degree are you studying towards? Bachelor of
- Arts
- Architectural Studies
- Biomedical Science
- Building Science
- Commerce
- Communication
- Design Innovation
- Education
- Engineering
- Health
- Laws
- Midwifery
- Music
- Science
- (19)
- What university are you enrolled in?
- Victoria University of Wellington
- University of Auckland
- Canterbury University
- University of Otago
- Waikato University
- Auckland University of Technology
- Lincoln University
- Massey University
* Questions marked with an asterisk were presented to participants one by one, but have been presented as matrix tables in this paper for brevity.
References
- Bradley, Gifford W. 1978. Self-serving biases in the attribution process: A reexamination of the fact or fiction question. Journal of Personality and Social Psychology 36: 56. [Google Scholar] [CrossRef]
- Dimock, Michael, and Richard Wike. 2020. America Is Exceptional in the Nature of Its Political Divide. Washington, DC: Pew Research Center, November 13, Available online: https://www.pewresearch.org/fact-tank/2020/11/13/america-is-exceptional-in-the-nature-of-its-political-divide/ (accessed on 20 October 2022).
- Foundation for Individual Rights and Expression. 2017. Speaking Freely: What Students Think about Expression at American Colleges. Available online: https://www.thefire.org/presentation/wp-content/uploads/2017/10/11091747/survey-2017-speaking-freely.pdf (accessed on 20 October 2022).
- Grant, Jonathan, Kirstie Anne Hewlett, Tamar Nir, and Bobby Duffy. 2019. Freedom of Expression in UK Universities. London: Kings College London. [Google Scholar] [CrossRef]
- Hackett, Robin, and Javier Rivera. 2020. Free Speech and Academic Freedom in the Era of the Alt-Right. Radical Teacher 118. [Google Scholar] [CrossRef]
- Haidt, Jonathan, and Greg Lukianoff. 2018. The Coddling of the American Mind: How Good Intentions and Bad Ideas Are Setting up a Generation for Failure. London: Penguin UK. [Google Scholar]
- Haller, Bruce L. 2019. Freedom of Speech in the Academic Workplace Academic Freedom to Microaggressions, Tenure, Contracts and the Courts. Journal of Higher Education Theory & Practice 18: 48–60. [Google Scholar]
- Jackson, Liz. 2021. Academic freedom of students. Educational Philosophy and Theory 53: 1108–15. [Google Scholar] [CrossRef]
- Knight Foundation. 2022. College Student View on Free Expression and Campus Speech 2022: A Look at Key Trends in Student Speech Views Since 2016. Available online: https://knightfoundation.org/wp-content/uploads/2022/01/KFX_College_2022.pdf (accessed on 20 October 2022).
- Kruger, Justin, and David Dunning. 1999. Unskilled and unaware of it: How difficulties in recognizing one’s own incompetence lead to inflated self-assessments. Journal of Personality and Social Psychology 77: 1121. [Google Scholar] [CrossRef] [PubMed]
- Matthews, Phillip. 2022. Permission to Speak Freely: Is Free Speech under Threat? Available online: https://www.stuff.co.nz/national/300575920/permission-to-speak-freely-is-free-speech-under-threat (accessed on 20 October 2022).
- Miller, Ryan A., Tonia Guida, Stella Smith, S. Kiersten Ferguson, and Elizabeth Medina. 2018. Free speech tensions: Responding to bias on college and university campuses. Journal of Student Affairs Research and Practice 55: 27–39. [Google Scholar] [CrossRef]
- Oliphant, J. Baxter. 2018. Most Say Their Family Is OK with Discussing Politics—But It Helps if the Family Agrees. Washington, DC: Pew Research Center, November 20, Available online: https://www.pewresearch.org/fact-tank/2018/11/20/most-say-their-family-is-ok-with-discussing-politics-but-it-helps-if-the-family-agrees/ (accessed on 20 October 2022).
- Reichman, Henry. 2019. The Future of Academic Freedom. Baltimore: JHU Press. [Google Scholar]
- Smeltzer, Sandra, and Alison Hearn. 2015. Student rights in an age of Austerity? “Security”, freedom of expression and the neoliberal university. Social Movement Studies 14: 352–58. [Google Scholar] [CrossRef]
- Stevens, S. T., P. Quirk, L. Jussim, and J. Haidt. 2022. The Campus Expression Survey: Student Version. New York: Heterodox Academy. Available online: https://heterodoxacademy.org/wp-content/uploads/2022/02/Campus-Expression-Survey-Administration-Manual-updated-February-2022.pdf (accessed on 20 October 2022).
- Transparency International. 2022. Country Data. Available online: https://www.transparency.org/en/countries/new-zealand (accessed on 20 October 2022).
- World Population Review. 2022. Freest Countries 2022. Available online: https://worldpopulationreview.com/country-rankings/freest-countries (accessed on 20 October 2022).
- Zhou, S., and S. C. Zhou. 2022. Understanding the Campus Expression Climate: A Research Report from 2019, 2020, and 2021. New York: Heterodox Academy. [Google Scholar]
Publisher’s Note: MDPI stays neutral with regard to jurisdictional claims in published maps and institutional affiliations. |
© 2022 by the authors. Licensee MDPI, Basel, Switzerland. This article is an open access article distributed under the terms and conditions of the Creative Commons Attribution (CC BY) license (https://creativecommons.org/licenses/by/4.0/).