Article

Fabrication and Characterization of Pneumatic Unit Cell Actuators

by
Krishna Dheeraj Kommuri
*,
Femke E. Van Beek
and
Irene A. Kuling
Reshape Lab, Dynamics and Control Group, Department of Mechanical Engineering, Eindhoven University of Technology, 5600 MB Eindhoven, The Netherlands
*
Author to whom correspondence should be addressed.
Actuators 2024, 13(2), 45; https://doi.org/10.3390/act13020045
Submission received: 12 December 2023 / Revised: 12 January 2024 / Accepted: 16 January 2024 / Published: 23 January 2024

Abstract

:
In the realm of virtual and augmented reality (VR/AR) and teleoperation applications, haptic feedback plays a role in enhancing task performance. One of the main goals of this study is to simplify haptic device hardware while improving its capacity to provide various stimuli at different intensities. In response to these challenges, this research introduces the Pneumatic Unit Cell (PUC), a soft pneumatically driven device—a hollow silicone cylinder with the ability to provide both static-pressure and vibrotactile feedback. Furthermore, the Pneumatic Unit Cell’s design simplicity has the potential for scalability, modularity, and the flexibility to mount the device on any part of the human body. The focus of the current paper is to study PUCs as actuators and lay the foundation for future perceptual studies. The characterization studies encompass the fabrication and verification of the fabrication accuracy through dimensional measurements, characterizing PUCs under static-pressure conditions (measuring the free deflection and blocking force) and frequency conditions (measuring the free deflection). In the static-pressure conditions, we applied pressures ranging from 0 to 40 kPa to measure the free deflection and from 0 to 30 kPa to measure the blocking force. In the frequency conditions, we applied pressures of 10, 20, and 30 kPa with inflation/deflation rates varying between 0.5 Hz and 100 Hz. The measurements of free deflection under static-pressure conditions revealed that 0.9 mm and 1.2 mm PUCs exhibit a linear increase in free deflection with an increase in inflation pressure. The results of free-deflection measurements under the frequency conditions indicate a direct relationship between the free-deflection magnitude and applied pressure. The results also demonstrate an inverse relationship to the frequency of inflation/deflation. The characterization results demonstrate a broad range of free deflection observed under both static-pressure and frequency conditions, encouraging the potential application of Pneumatic Unit Cell actuators as haptic devices.

1. Introduction

Efforts to integrate haptic feedback into virtual reality/augmented reality (VR/AR) [1] and teleoperation applications [2] aim to expand sensory perception beyond the visual and auditory realms. Such integration of haptic feedback seeks to create an immersive experience. Haptic feedback comprises two distinct modalities: kinesthetic feedback and tactile feedback. Kinesthetic feedback engages muscular and skeletal components to sense forces and torques, while tactile feedback employs the skin to perceive various attributes such as roughness, hardness, temperature, and friction [3,4,5]. Among the multitude of haptic sensations, this paper narrows its focus to two specific types: static-pressure and vibrotactile feedback.
Static-pressure and vibrotactile feedback are among the haptic feedback mechanisms used in VR/AR applications [6]. The soft thimble actuator, as proposed by Talhan et al. in [7], has demonstrated its capability in augmenting reality. This is achieved by delivering multiple forms of feedback by using the soft thimble actuator, including static-pressure and vibrotactile feedback. However, one limitation acknowledged by Talhan is that the design of the soft thimble actuator confines its wearability to fingertip applications.
In the broader landscape of haptic research, recent research on the use of static-pressure feedback [8] and vibrotactile feedback [9] as alternatives to kinesthetic force feedback has reported control stability benefits without a significant impact on task performance in teleoperation tasks. Additionally, Pacchierotti et al. [10] observed the advantages of providing both static-pressure and vibrotactile feedback to accommodate the diverse subjective exploration strategies employed by humans in teleoperation tasks.
The proposed design by Pacchierotti et al. [10] addressed the need for both static and vibrotactile feedback by using an individual servo motor and vibrotactile motor. This solution offered the desired feedback but was limited by its wearability due to size and weight, as recommended by Pacchierotti et al. in [11].
Recent work on elastomeric actuators has shown potential in addressing these challenges [6]. Dielectric elastomeric actuators [6,12,13,14,15] and pneumatic actuators [6,7,16,17,18,19,20] have demonstrated their capacity to offer both static-pressure and vibrotactile feedback at a relatively smaller form factor and weight. Despite their compactness, dielectric elastomeric actuators often demand high operating voltages and can require intricate fabrication procedures [12,13,14,15]. This could limit the extent of the availability of dielectric elastomeric actuators for adaptation as a haptic actuator.
In the case of pneumatically driven actuators, the evolution of these actuators initially began with static-pressure feedback; primarily, the use of pin arrays [21,22], air jets [23,24], and inflatable structures [25,26,27,28,29,30], with the latter accommodating more actuator design freedom. In line with this topic, research by King et al. [30,31] explored the use of inflatable soft pneumatic actuators for static-pressure feedback while incorporating modularity and scalability into the design.
Inflatable soft pneumatic actuators have demonstrated a wide range of performance, reporting a maximum deformation of up to 6 mm [26] and a blocking force of up to 12.5 N [17]. Recent investigations into soft pneumatic actuators have also revealed the potential of inflatable actuators for vibrotactile feedback, achieving frequencies of up to 250 Hz [7,16,17,18,19,20].
Within pneumatic actuator designs, the primary objective is to localize deformation during inflation–deflation cycles by introducing contrast in the stiffness. The literature offers a range of solutions, with the most notable design approaches involving the use of fabric and silicone [7,16,17,19,20], the bonding or laminating of soft elastomers to relatively rigid substrates [18,27,28,29], and the integration of elastomers between rigid components [26].
In this paper, we are inspired to approach the design of soft pneumatic actuators that are further simplified and eliminate the need for fabric to introduce structural stiffness. The proposed actuator should be functionally capable of delivering both static-pressure and vibrotactile feedback while maintaining wearability and maintaining a performance level comparable to the existing literature. Additionally, our focus extends to designing an actuator with a broad scope of application—one that is mountable on any surface.
Addressing these objectives, we designed a Pneumatic Unit Cell (PUC) (Figure 1) (Supplementary Video S1). PUCs are entirely manufactured by using silicone. The inherent simplicity of the PUC design makes it conducive to scalability while maintaining the generation of both static-pressure and vibrotactile feedback. In addition, recent work presented in [32] highlights the preference for PUC actuators as a haptic feedback option over traditional electromechanical vibration motors, particularly in simulating virtual button clicks.
The main objective of this paper is to characterize the performance of a single Pneumatic Unit Cell (PUC). This study focuses on investigating the influence of the top-layer thickness of the PUC on the stiffness along with the influence of pressure and frequency on the performance of the PUC actuator. This study involves three distinct PUC designs with varying top-layer thicknesses: 0.6 mm, 0.9 mm, and 1.2 mm, which influence the stiffness. These different PUC designs are tested for manufacturing accuracy and evaluated for their performance under both static-pressure and frequency conditions.
In the static-pressure condition, all PUC designs are assessed for their top-layer free-deflection and blocking-force performance. The results of these tests provide insights into the linear free-deflection operating range of PUCs for a given PUC design. The frequency condition and the free deflection of the top layer of the PUCs are studied. This offers insights into the effects of varying degrees of inflation–deflation cycles on free deflection.
The structure of this paper is as follows: Section 2 details the fabrication procedure, followed by an overview of the dimensional measurements, discussions, and results related to the fabrication process. Section 3 outlines the characterization of the PUC, with an overview of the hardware setup, methods used in the characterization study of PUCs under static-pressure and frequency conditions, along with discussions and results. Section 4 presents the general discussions, and Section 5 presents the final conclusion.

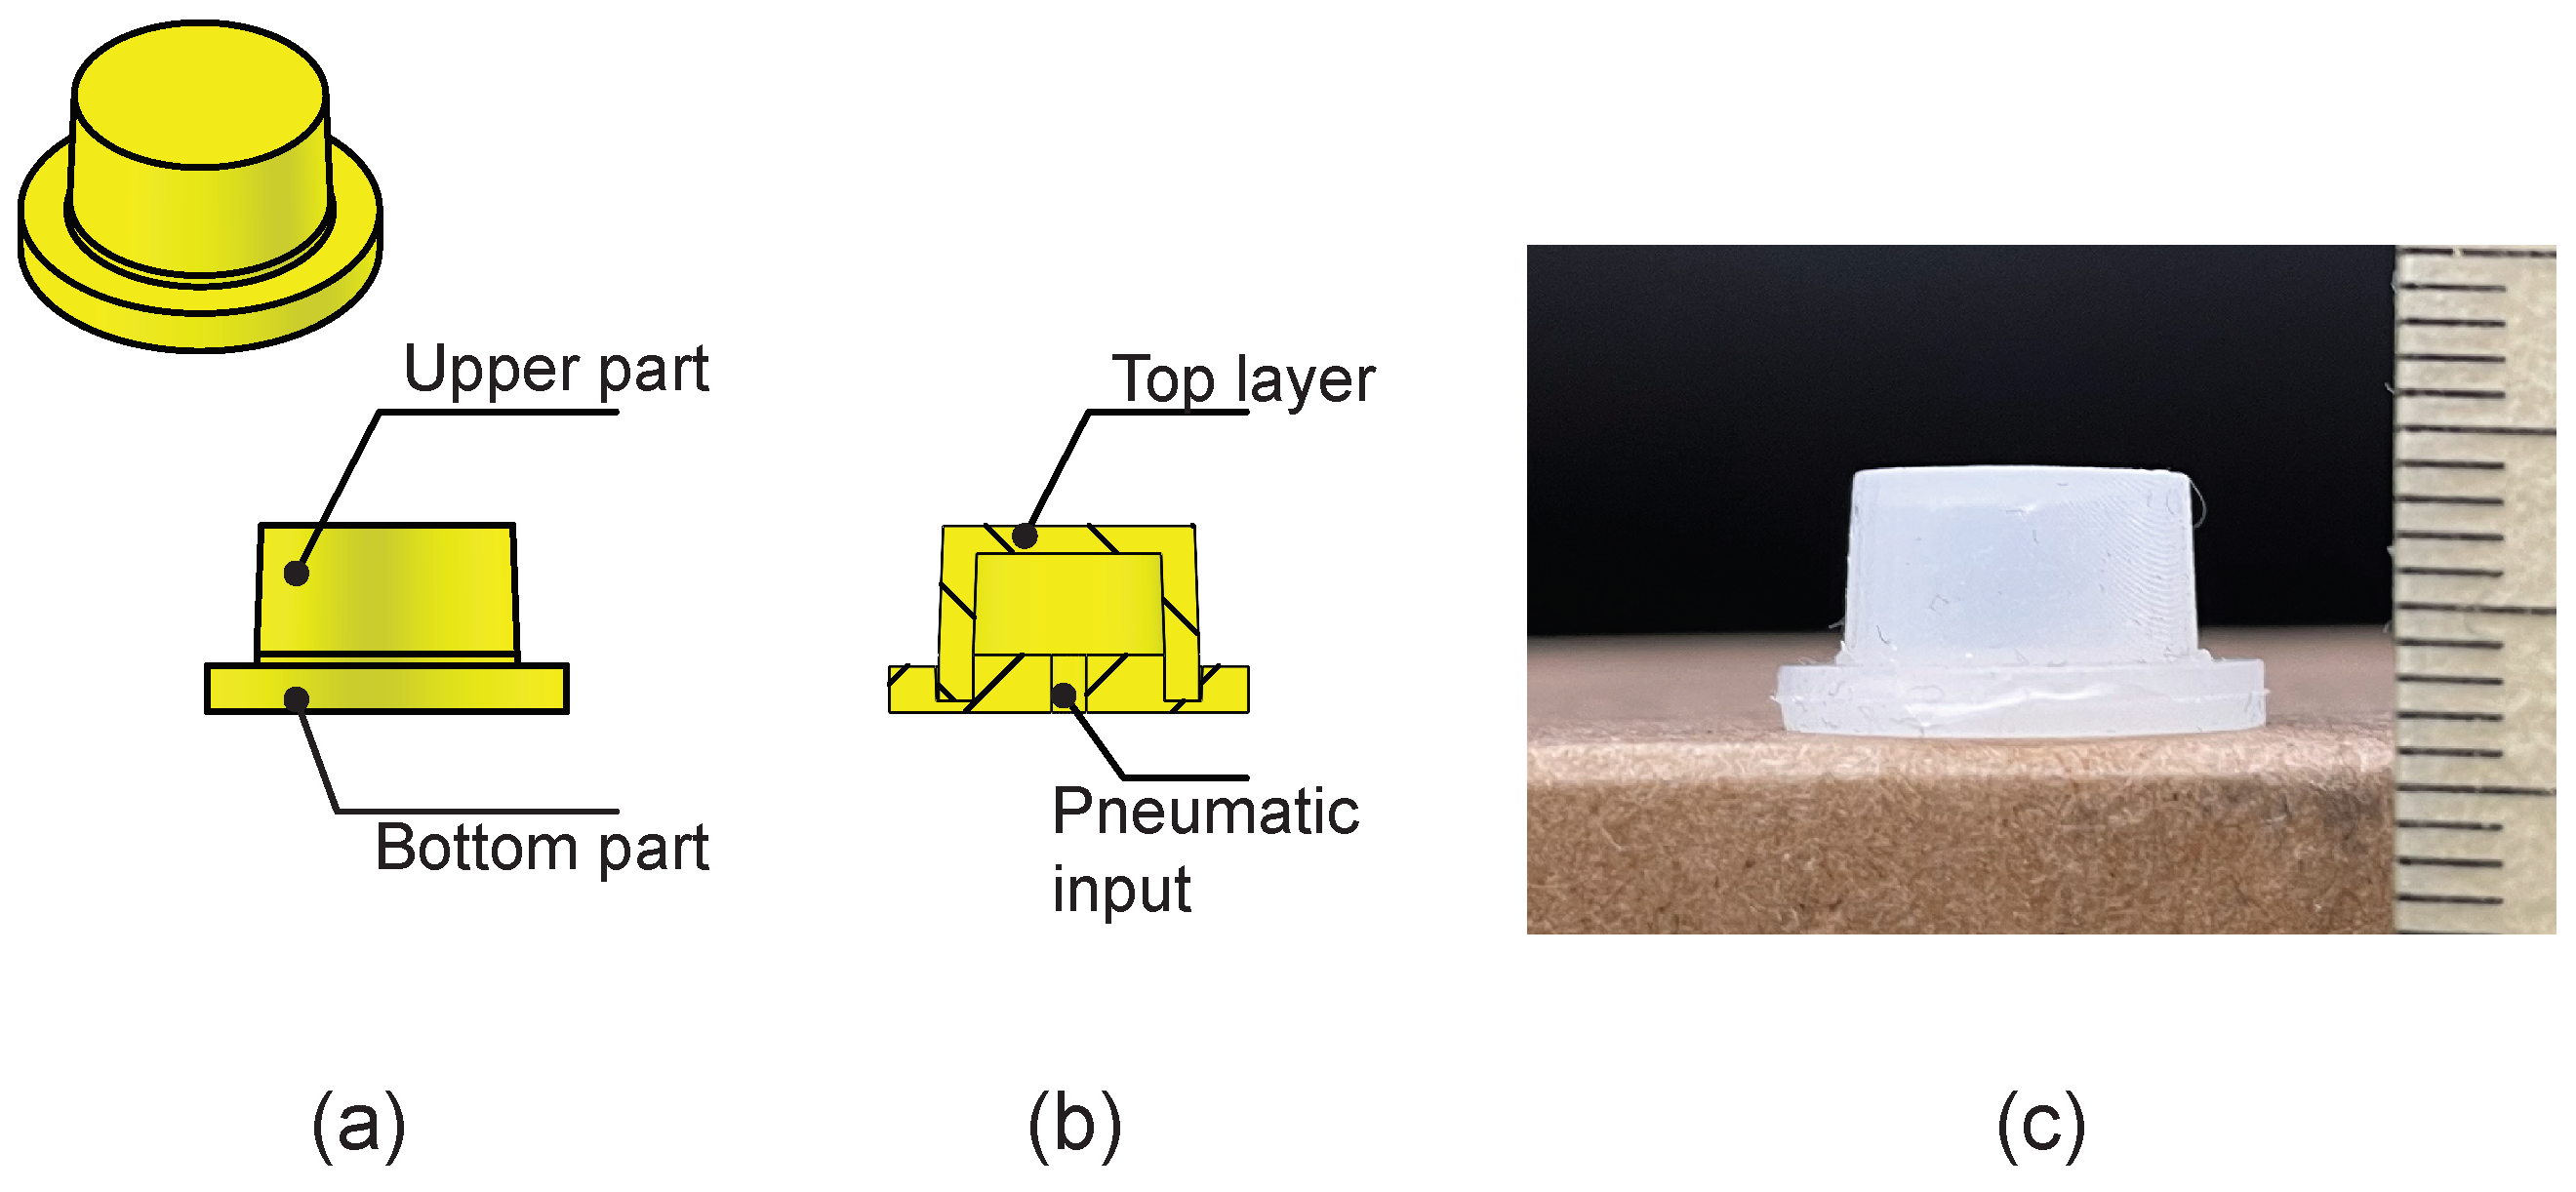
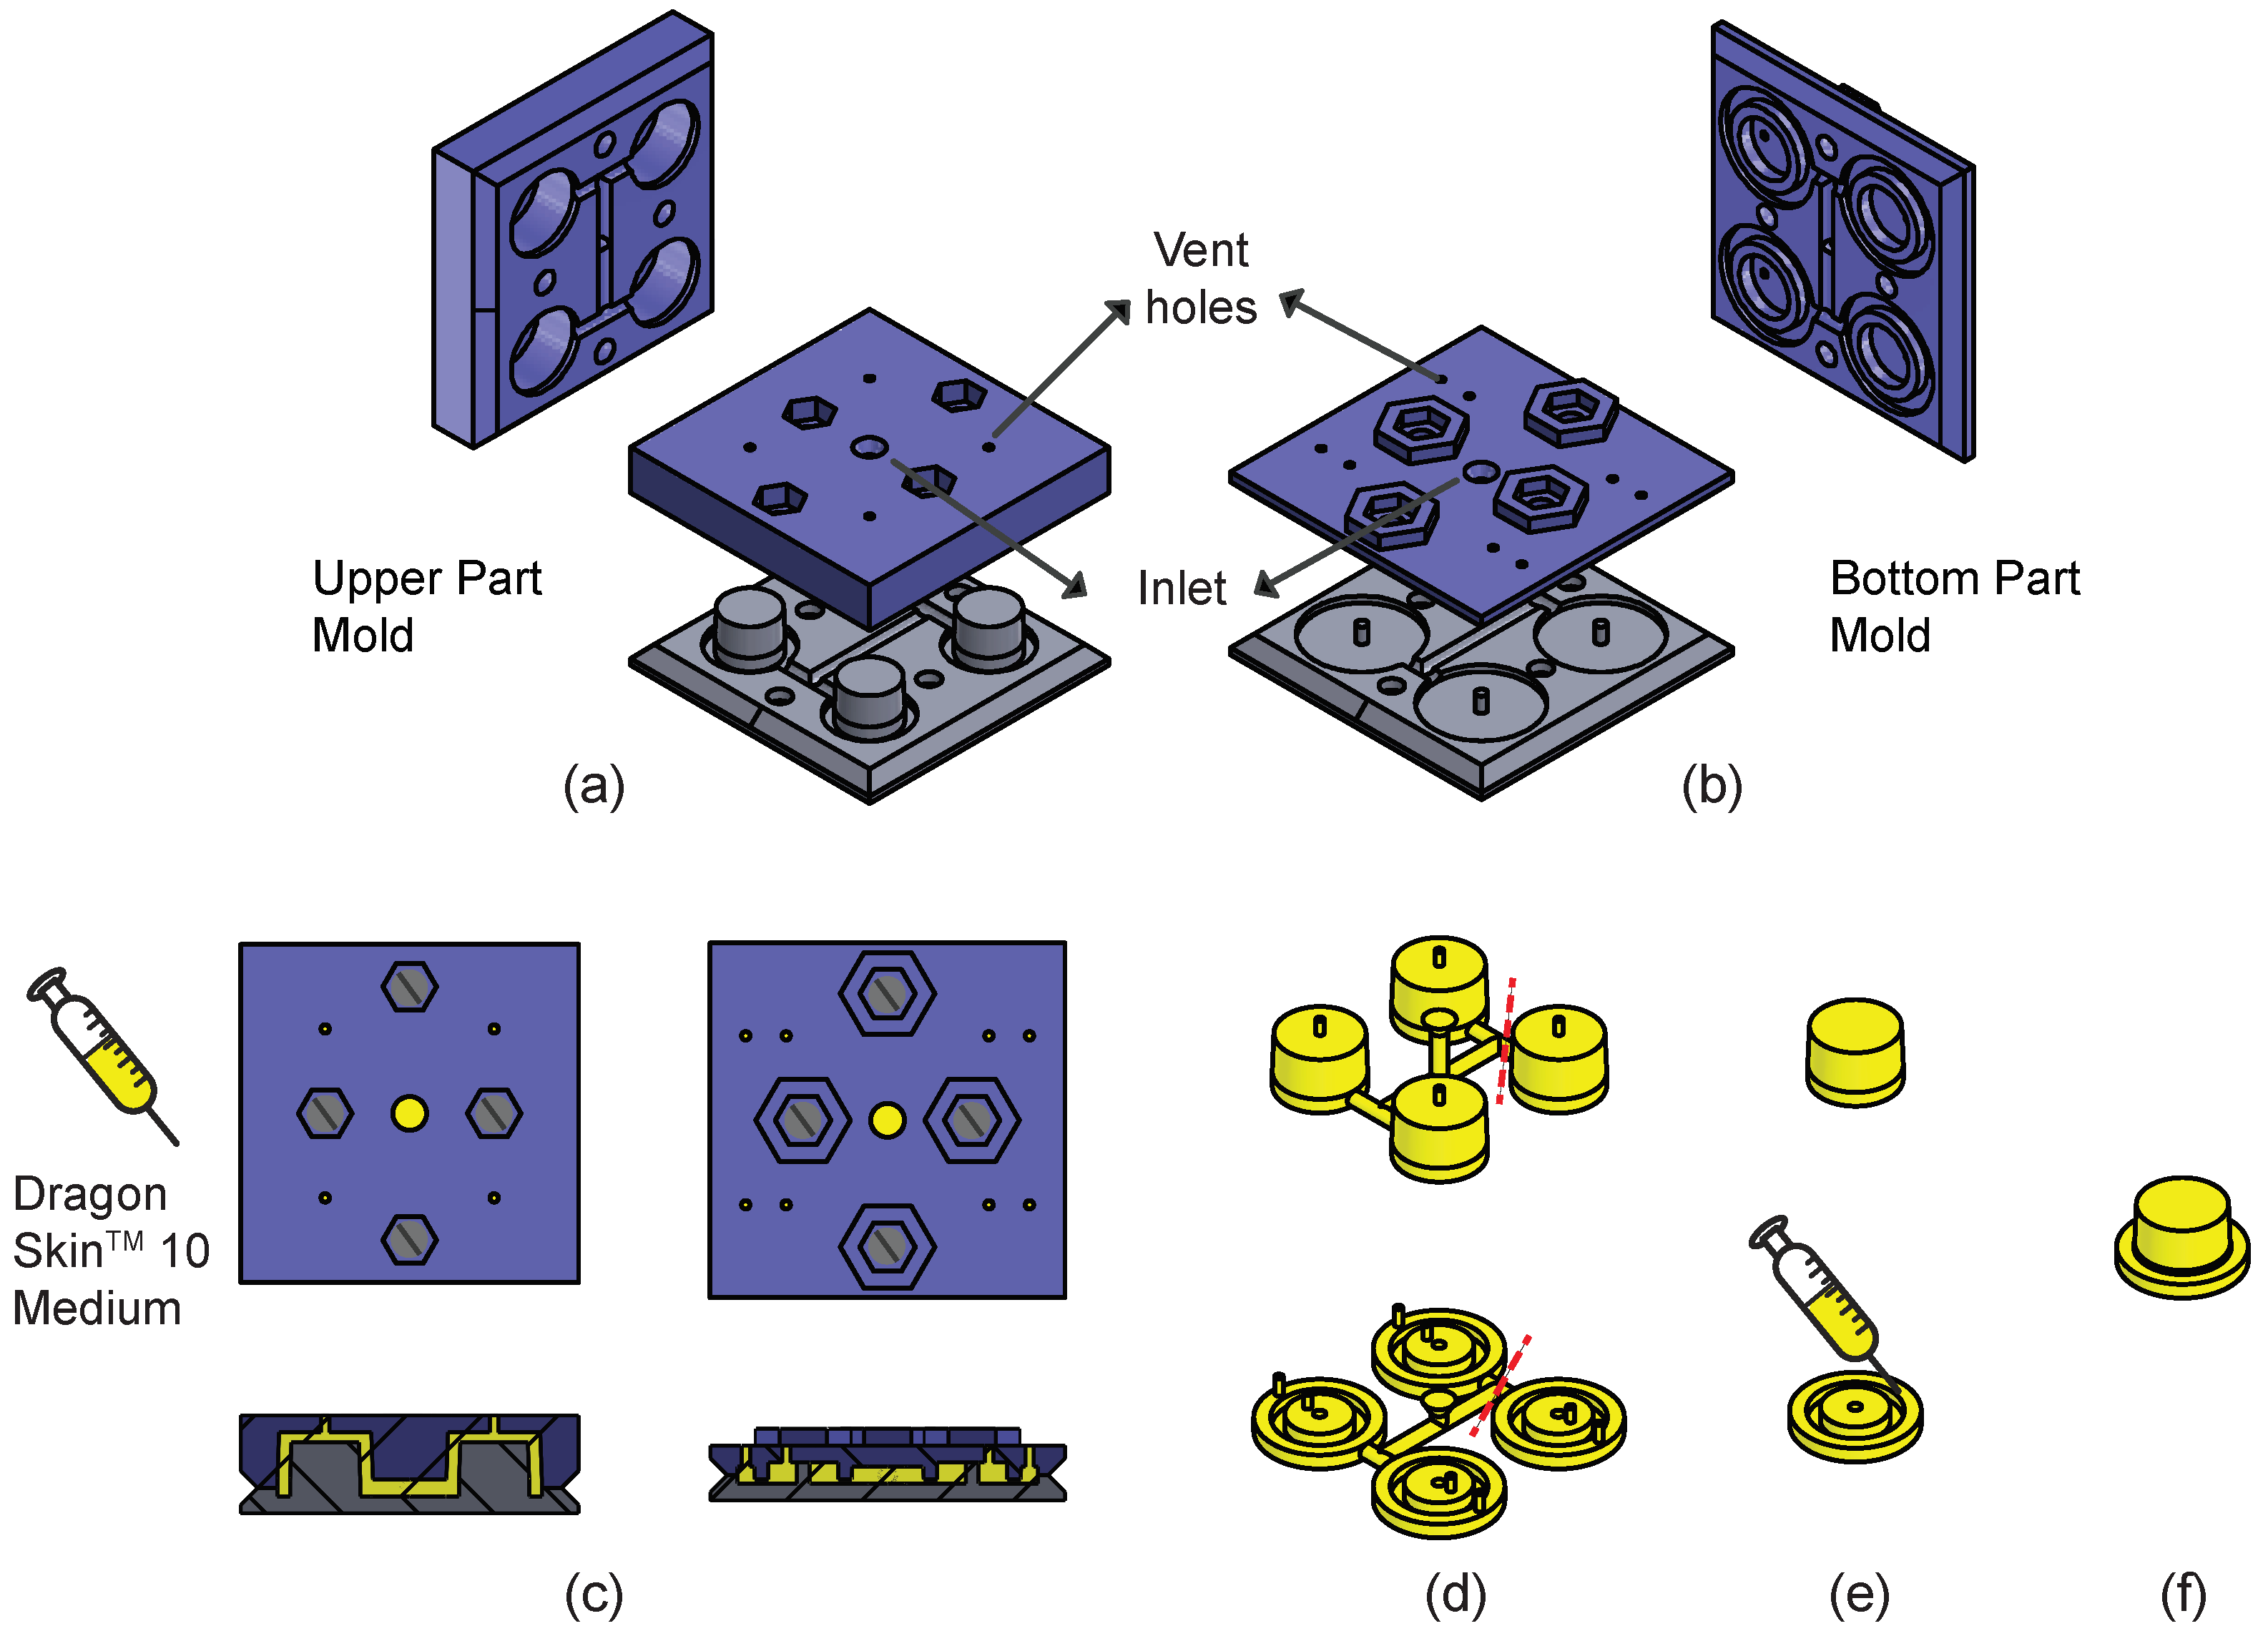
2. Fabrication of Pneumatic Unit Cells

This section describes the PUC fabrication, the dimensional evaluation of the top-layer thickness, and the statistical analysis of the measured data.

2.1. Design and Fabrication Steps

PUCs are cylindrical hollow structures with an 8 mm diameter and pneumatic inputs located at the bottom of the structure. They were fabricated by using the Dragon SkinTM 10 Medium (Smooth-On, Macungie, PA, USA) silicone. To localize the deformation to the top layer, the thickness of the top layer was kept relatively low compared to the rest of the PUC structure. For the scope of the current paper, PUCs with top-layer thicknesses of 0.6 mm, 0.9 mm, and 1.2 mm were designed, while the side walls of the PUC were maintained at 1.5 mm.
The PUCs were fabricated by using the closed-mold method. This method was chosen over the open-mold method for its fabrication consistency. The PUCs were produced in two halves: the upper and bottom parts (Figure 2a,b). The molds necessary for PUC fabrication were created by using Formlab’s Stereolithography (SLA) printers (Formlabs, Somerville, MA, USA), utilizing Rigid 10K resin. The molds were prepared and assembled for the injection of the Dragon SkinTM 10 Medium. Resin mixers (DM2X 400-01-60 manual dispenser, SAF-400-01-10-0 cartridge, and MFH-06-24T static mixer, procured from Siko BV, Hengelo, The Netherlands) were employed to ensure consistent mixing (Figure 2c). The molds were filled through injection and then placed in an oven and cured at 60 C for one hour. After curing, the parts were extracted from the molds and joined together by using the Dragon SkinTM 10 Medium (Figure 2d–f). The assembled PUC was returned to the oven for an additional hour at 60 C for curing.

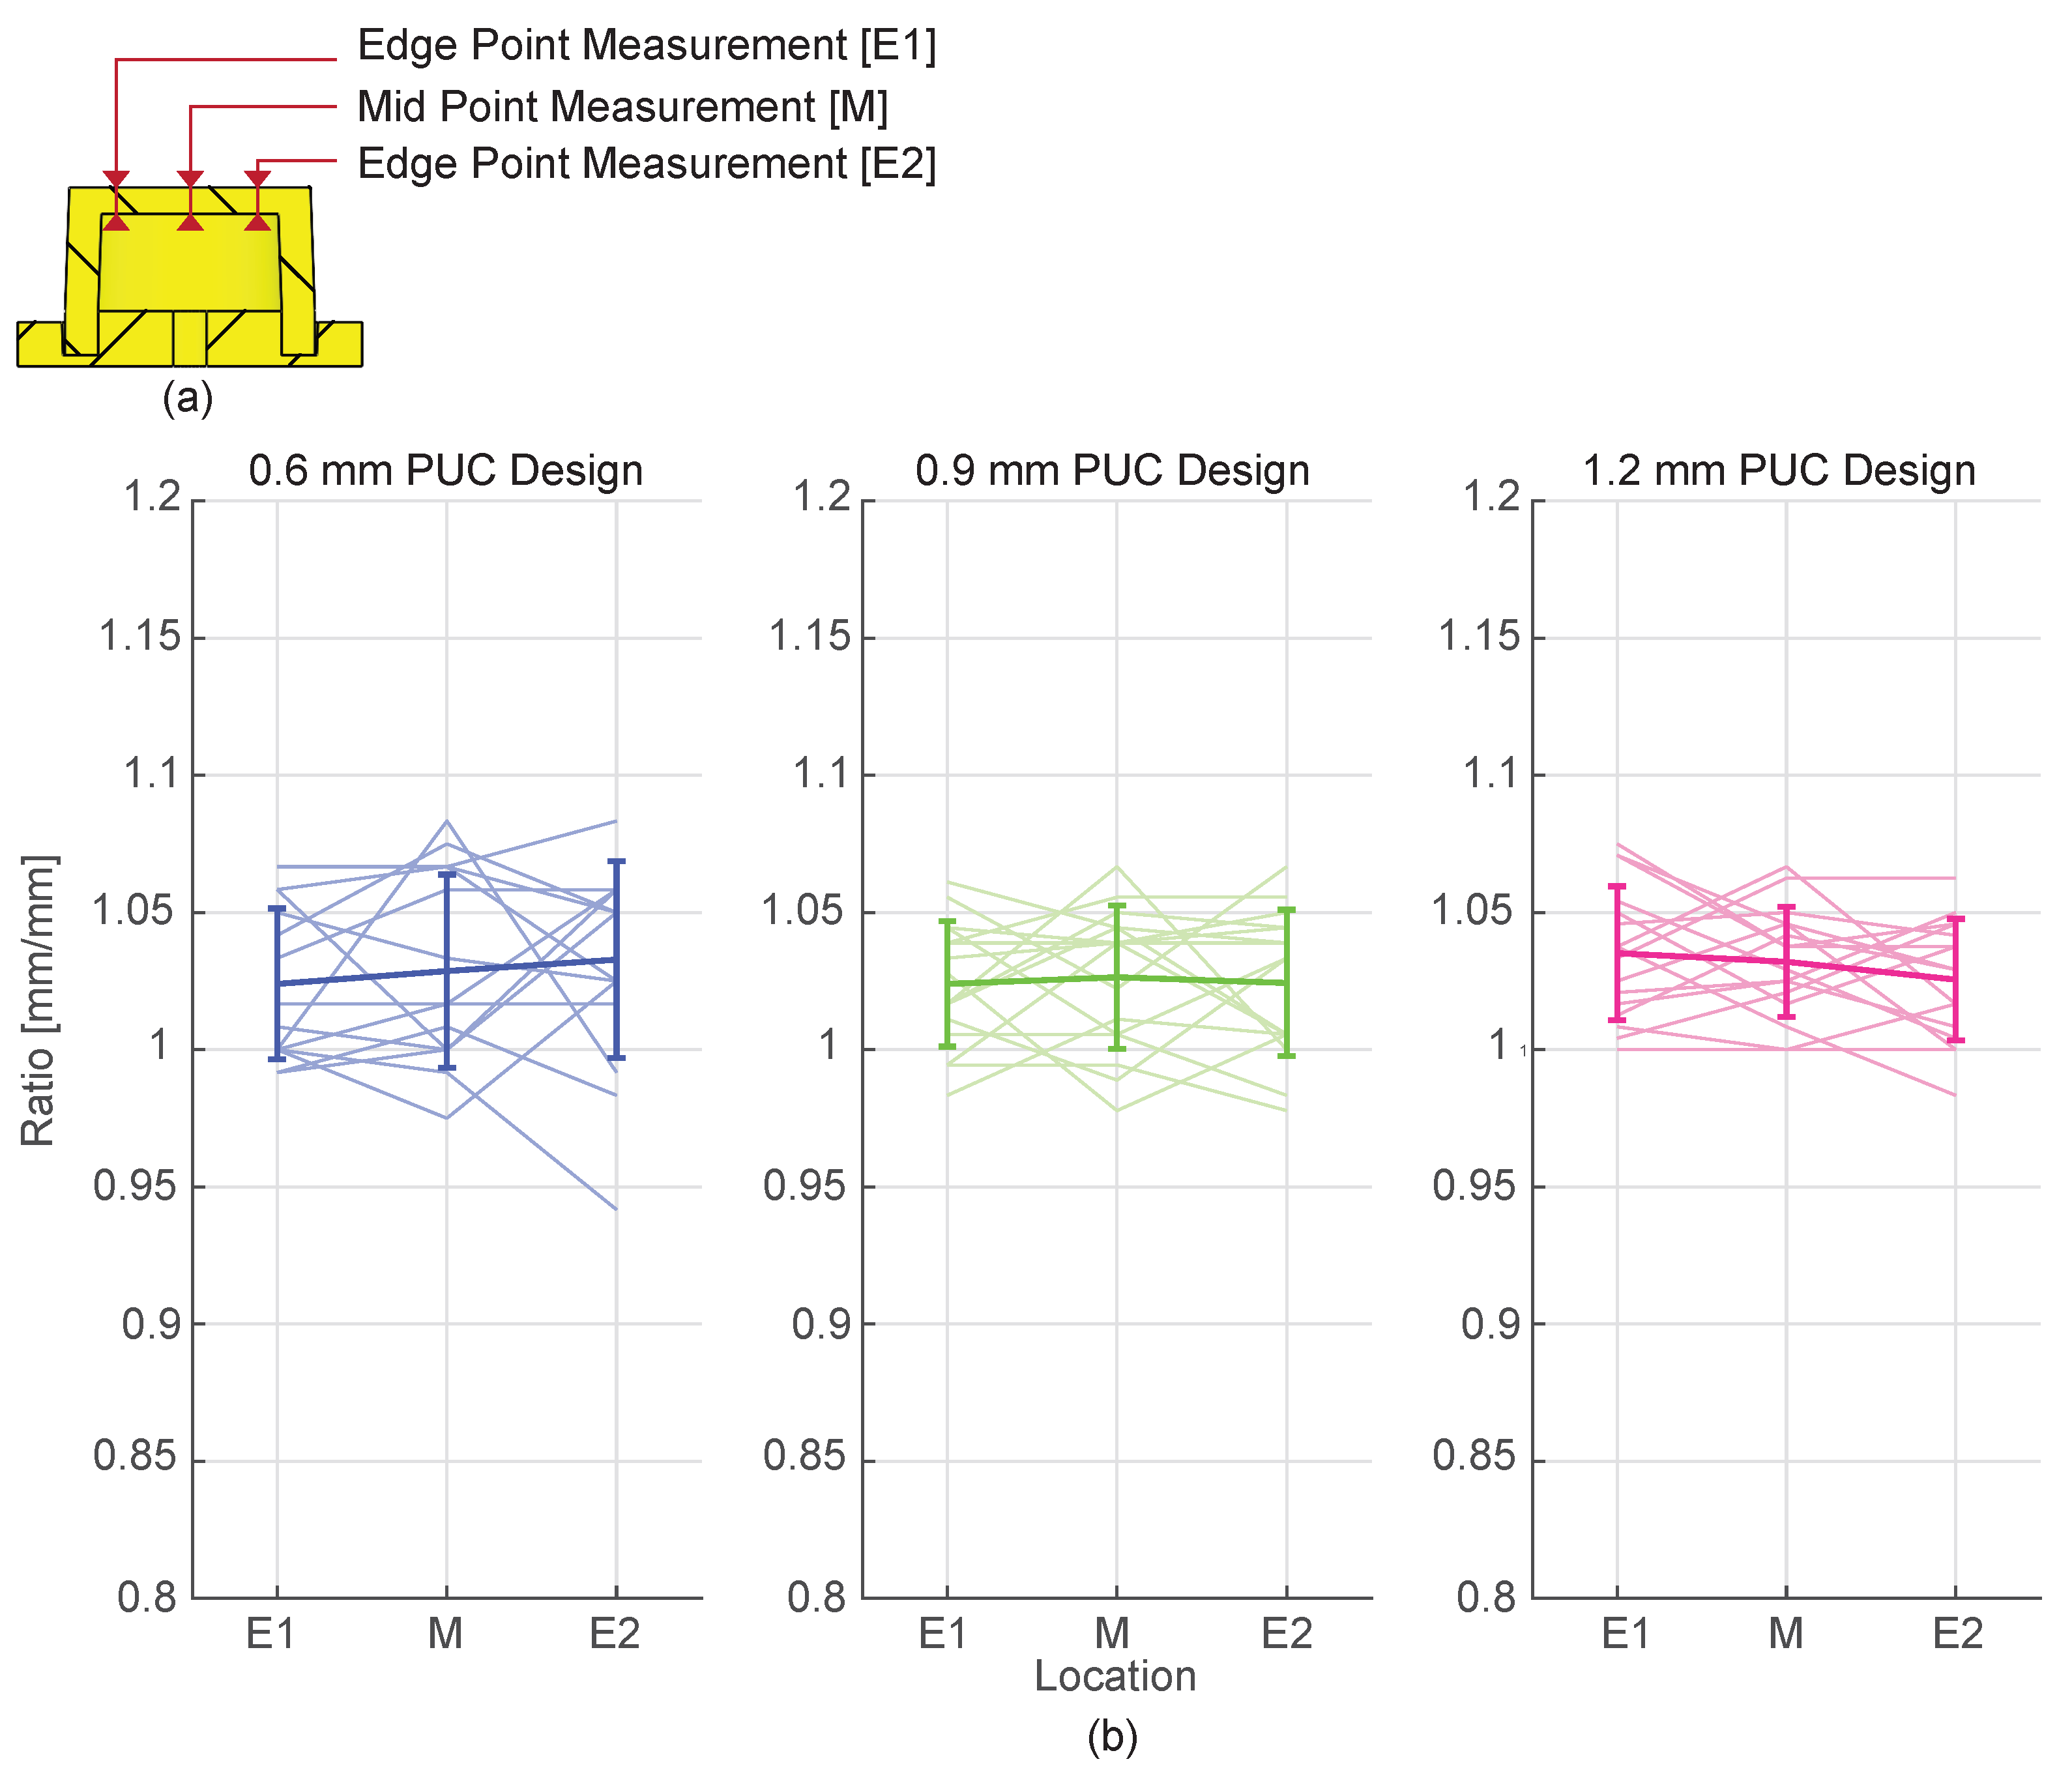
2.2. Method for Dimensional Measurements

The top-layer thickness of the fabricated PUCs was measured by using an ISOMA Bienne Suisse microscope mounted on a calibrated Fehlmann’s Picomax 54 CNC machine (FEHLMANN AG Maschinenfabrik, Seon, Switzerland) with an XY axis translation resolution of 0.005 mm. Four batches of PUCs were fabricated for each design (0.6 mm, 0.9 mm, and 1.2 mm), with each batch producing four individual PUCs. To ensure a representative sample, two PUCs were randomly selected from each batch and sectioned along the coronal plane. The resulting halves of each PUC were used for thickness measurements. To assess the uniformity of the thickness, measurements were taken at three locations: E1, M, and E2, as shown in Figure 3a. Locations E1 and E2 represent the measurements close to the edge, while location M represents the measurement at the middle of the cross-section. This resulted in 16 data points for each combination of measurement location and PUC design. Thickness ratios were calculated to compare the measured thickness to the target thickness. A two-way 3 × 3 ANOVA (PUC design x measurement location) was performed on the thickness ratios to study the uniformity of the thickness.

2.3. Results

Figure 3b presents the results of the dimensional measurement of the top-layer thickness, categorized by measurement location and design. For the 0.6 mm PUC design, the mean and standard deviation of the thickness-ratio values between the PUC samples at locations E1, M, and E2 are 1.024 ± 0.028 mm/mm, 1.029 ± 0.035 mm/mm, and 1.033 ± 0.036 mm/mm, respectively. For the 0.9 mm PUC design, the mean and standard deviation of the thickness-ratio values between the PUC samples at locations E1, M, and E2 are 1.024 ± 0.023 mm/mm, 1.026 ± 0.026 mm/mm, and 1.024 ± 0.027 mm/mm, respectively. For the 1.2 mm PUC design, the mean and standard deviation of the thickness-ratio values between the PUC samples at locations E1, M, and E2 are 1.035 ± 0.024 mm/mm, 1.032 ± 0.020 mm/mm, and 1.026 ± 0.022 mm/mm, respectively. A 3 × 3 ANOVA analysis revealed no significant main effect of the measurement location (F(2,135) = 0.04, p = 0.96) or the design (F(2,135) = 0.59, p = 0.55) on the thickness ratio.

2.4. Discussion

The results of the dimensional measurement show that the mean thickness ratios do not differ significantly between PUC designs. The results of a two-way ANOVA comparing the thickness ratio between PUC designs also revealed no significant main effect among the designs. This indicates that the closed-mold fabrication process results in a consistent thickness ratio. Furthermore, the two-way ANOVA shows no significant main effect of measurement location on the thickness ratio. This suggests that the closed-mold-fabricated PUCs also result in a uniform thickness ratio across the cross-section.
The proposed fabrication process produces PUCs that are approximately 2 % to 3 % thicker than the target thickness. This consistent deviation in the thickness ratio could be attributed to two factors: (a) the mating tolerance between the two pieces of the upper-part mold, resulting in increased separation between both pieces of the upper-part mold. (b) The proposed fabrication process consists of two stages of oven curing. In the first stage, the silicone is cured inside the mold, while in the second stage, both parts of the PUC are extracted from the molds and assembled. During the second stage of curing, the PUC has the freedom to expand and form new cross-links, likely resulting in a permanent but consistent deviation in the thickness ratio across different PUC designs.

3. Characterization of PUCs
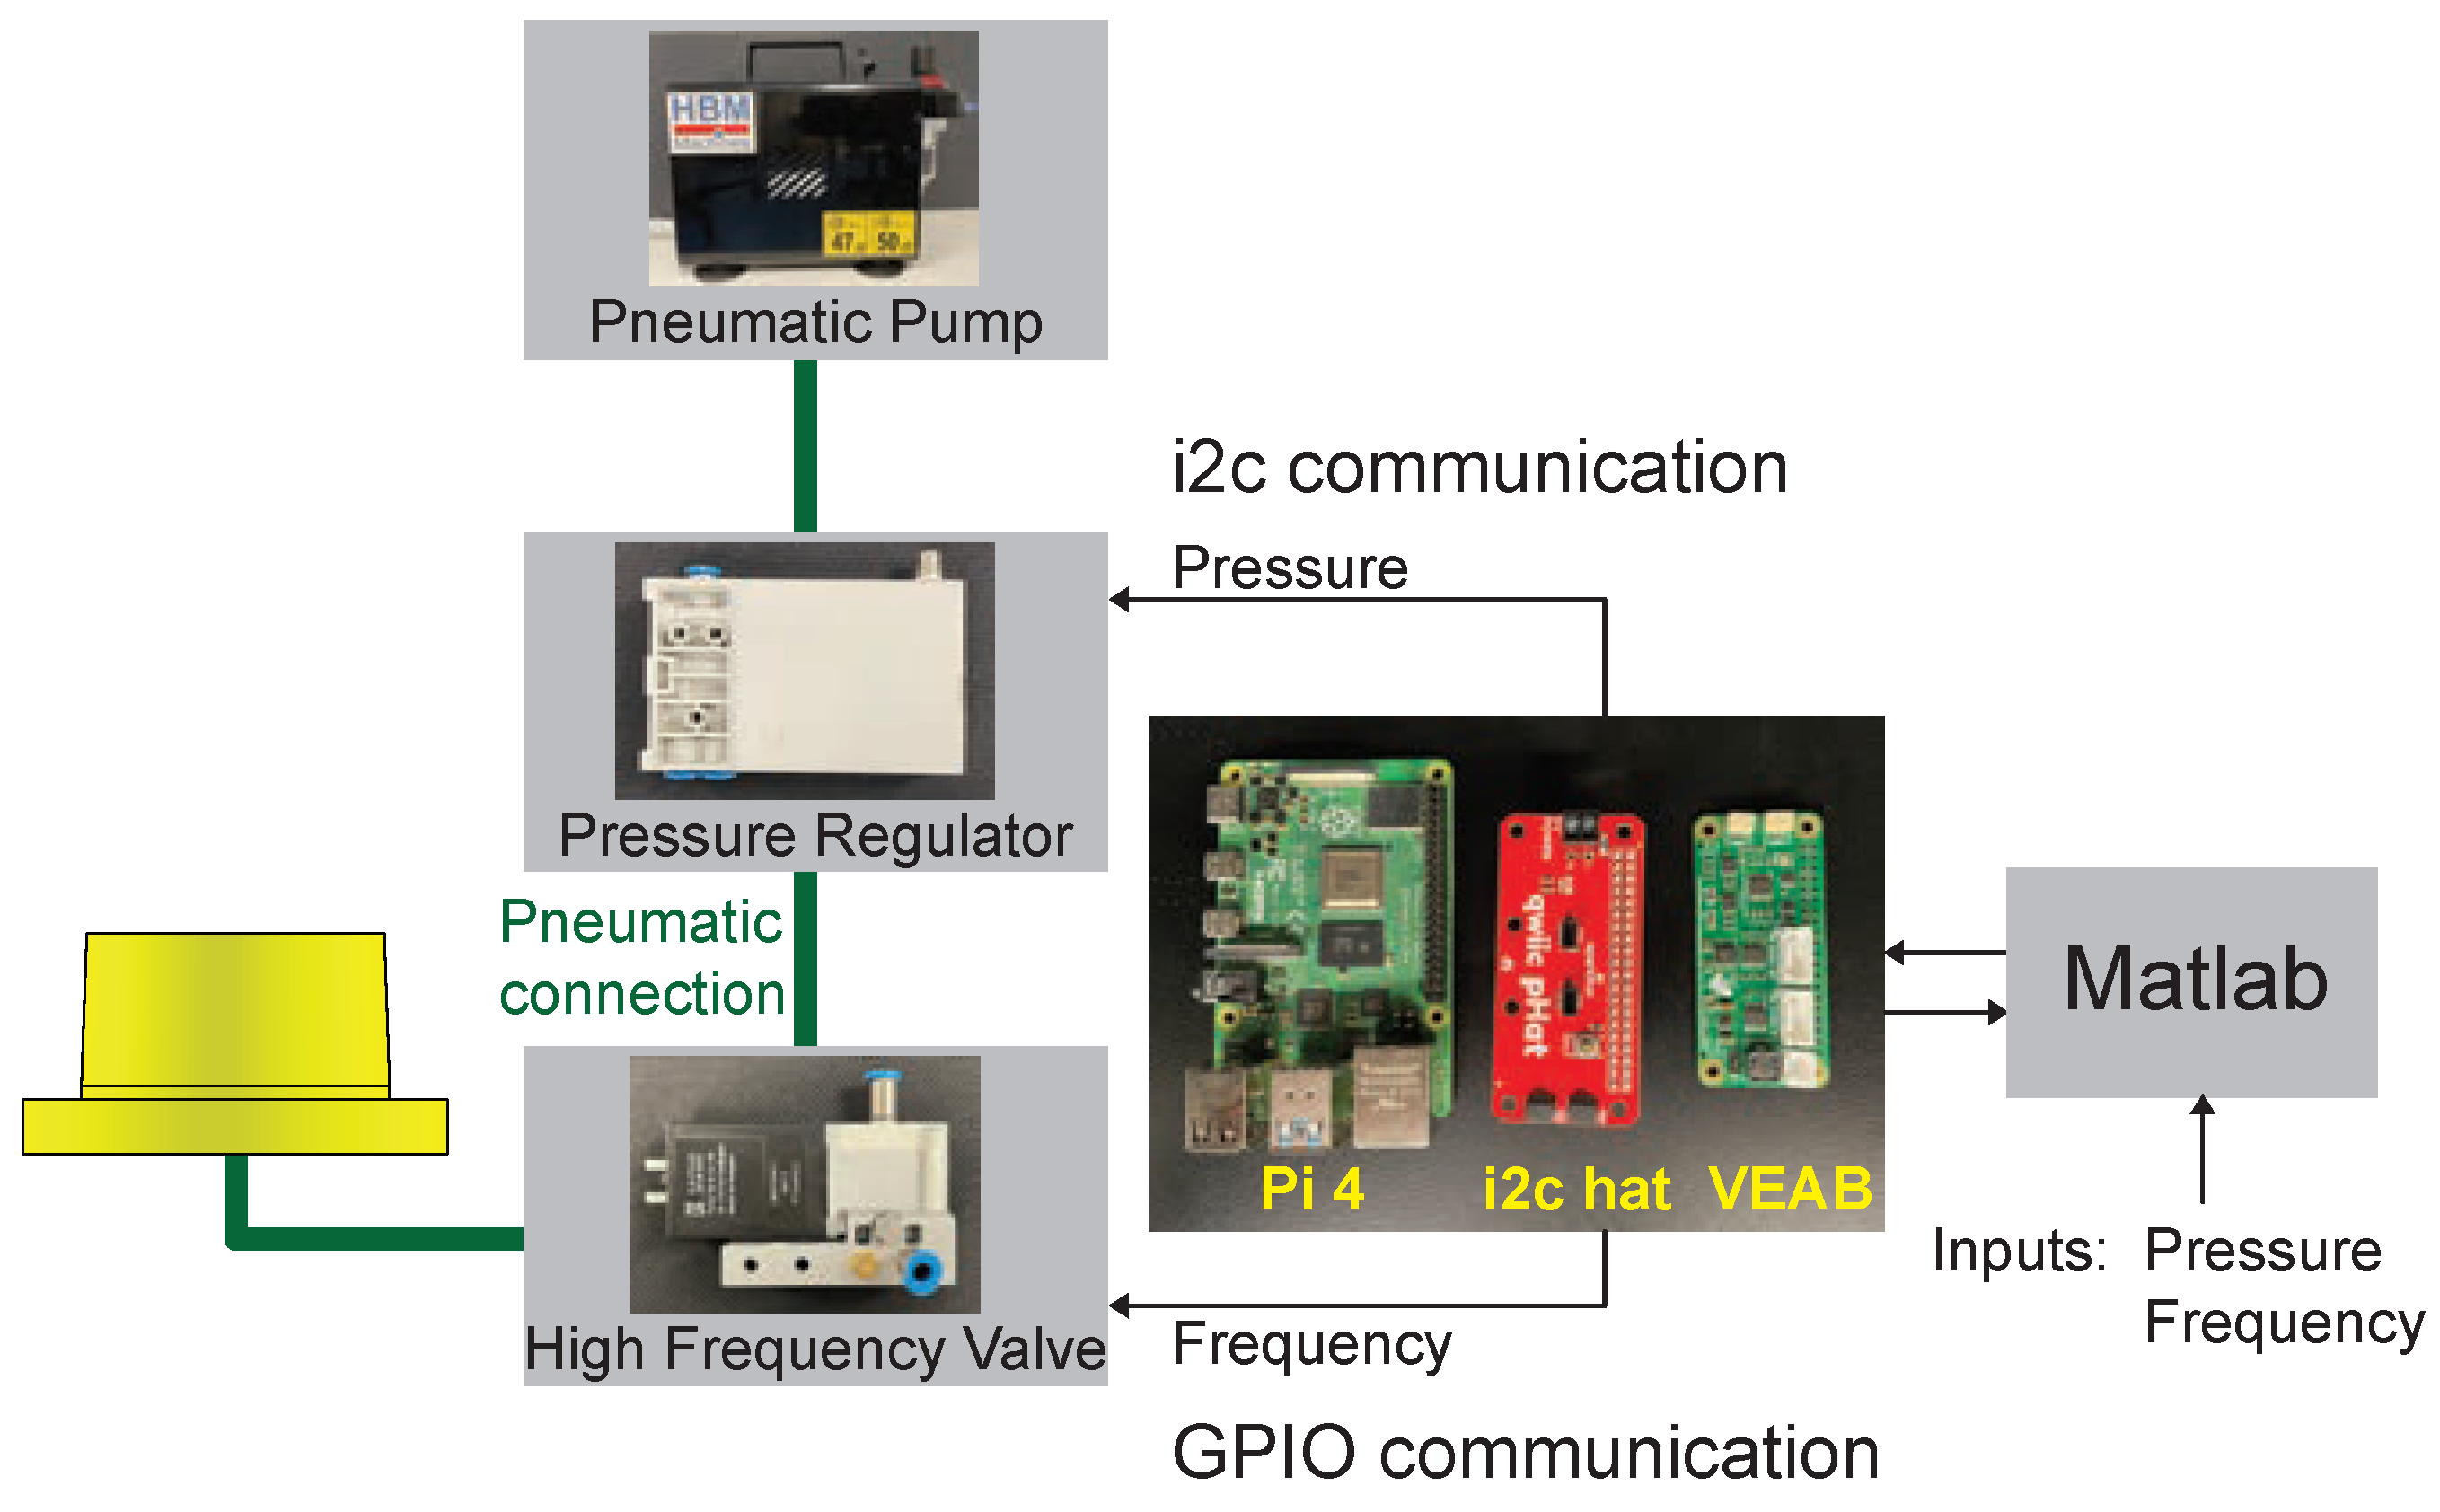
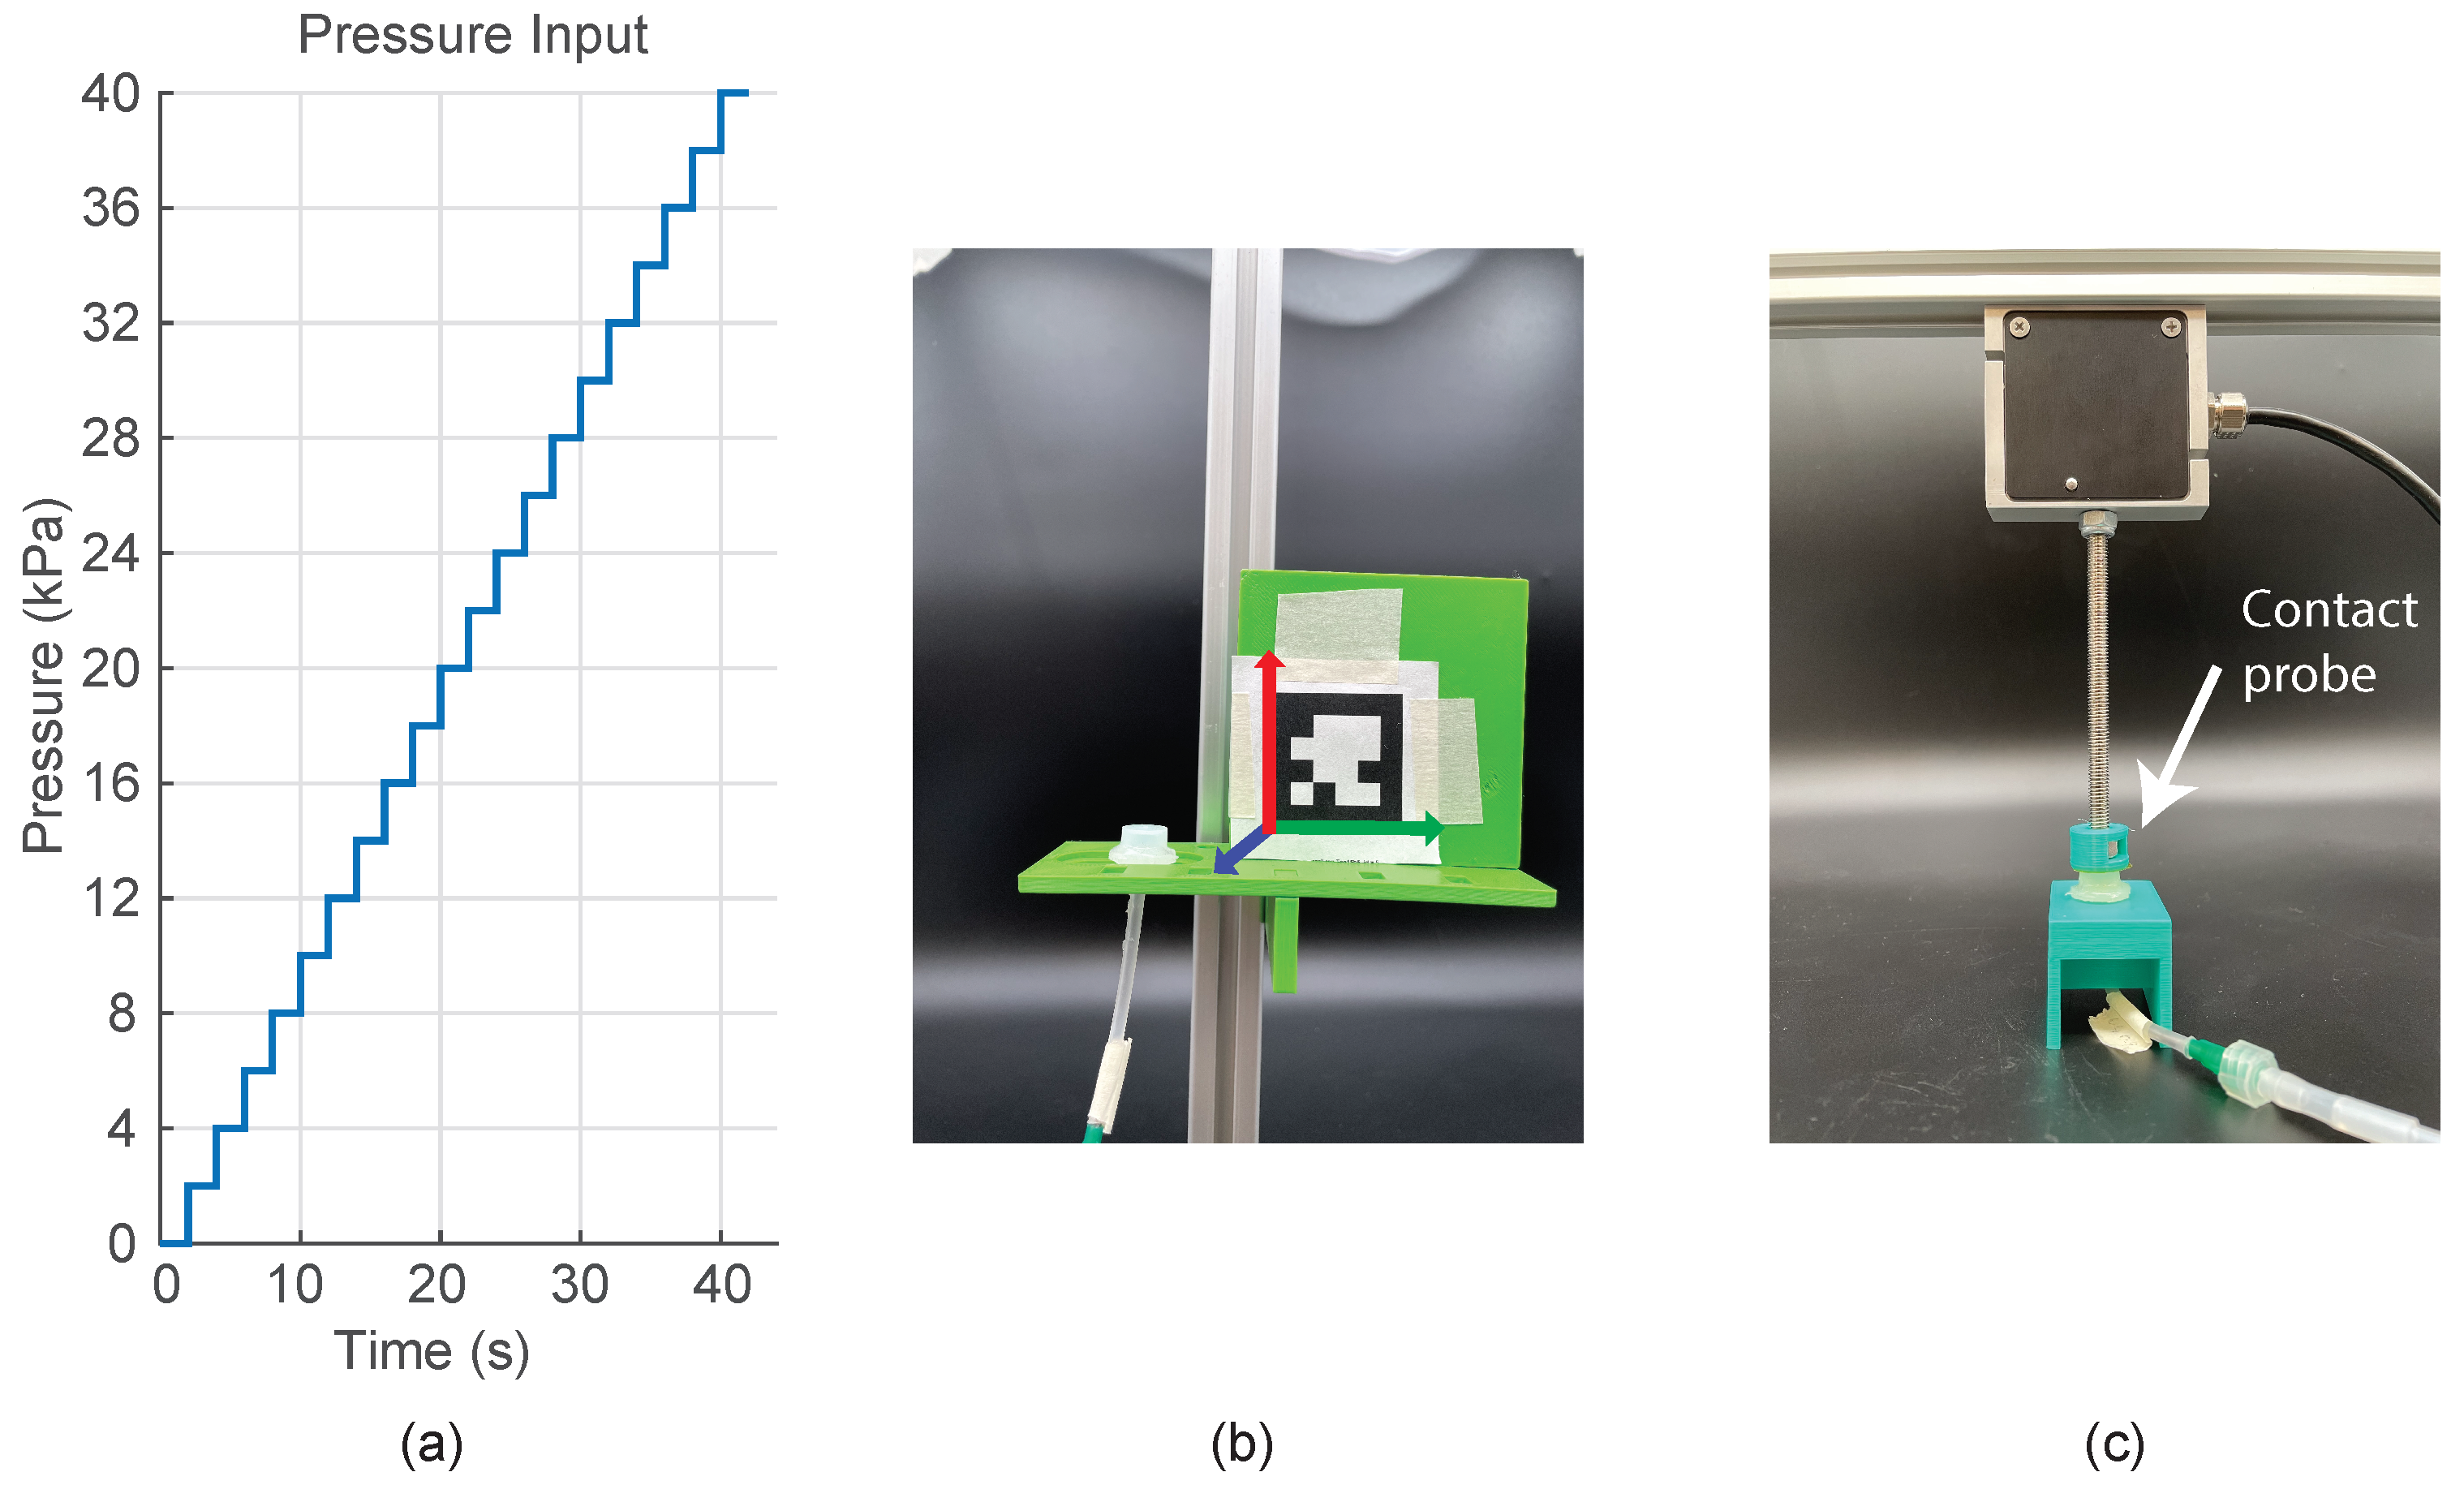
This section begins with an overview of the hardware setup, followed by a detailed description of PUC tests under static-pressure conditions, results, and discussion. Subsequent subsections address the PUC tests under frequency conditions, the results, and discussions.

3.1. Hardware Setup

The control of pneumatic pressure and inflation–deflation frequencies was achieved by using a customized desktop-sized platform powered by Raspberry Pi, as described in Figure 4. The hardware setup comprises two types of peripherals: a proportional pressure-control valve (VEAB-L-26-D13-Q4-V1-1R1, Festo, Esslingen, Germany) for regulating the pneumatic pressure, and a high-frequency valve (MHP2-MS1H-3/2G-M5, Festo, Germany) for controlling the inflation–deflation rates. The desired pressure and frequencies were configured through Matlab and communicated to Raspberry Pi, which then initiated parallel processes to control the individual peripherals. For further details about the setup, see [33].
In the static-pressure condition, PUCs were inflated to a maximum pressure of 40 kPa to measure free deflection and 30 kPa to measure the blocking force, respectively. In the frequency condition, the PUCs were inflated to a maximum pressure of 30 kPa, and the inflation–deflation rates ranged from 0.5 Hz to 100 Hz, including 1, 2, 2.5, 3, 4, 5, 6, 7.8, 10, 12.5, 15, 25, 30, 31, 50, 55, 62, 71, and 83 Hz [7,20] at a 30% duty cycle. See Table 1 for an overview of the static-pressure and frequency condition.

3.2. Static-Pressure Condition—Free-Deflection Measurement

In this test, we investigated the free-deflection behavior of the top layer of the Pneumatic Unit Cell (PUC) under varying inflation pressures for the three designs. The inflation pressures were increased from 0 kPa to 40 kPa in 2 kPa increments, with each increment maintained for 2 s. The input signal used during the measurement is illustrated in Figure 5a. We employed the hardware setup described in Section 3.1.
To capture the free-deflection behavior, PUC samples were positioned within a desktop photo studio next to an April tag (Figure 5b), marking the coronal plane of the PUC. An Exilim Ex-F1 camera (CASIO COMPUTER Co., Ltd., Tokyo, Japan) recorded the free-deflection behavior at a frame rate of 600 frames per second and 432 × 192 pixels/frame. Prior to the experiment, we measured the intrinsic characteristics of the Exilim Ex-F1 camera by using the OpenCV toolkit [34]. The autofocus feature of the Exilim Ex-F1 camera was disabled to prevent changes to the measured intrinsic characteristics. Extrinsic characteristics, such as the relative position of the camera with respect to the April tag, were measured for every experiment.
The recorded data from the Exilim Ex-F1 camera were analyzed frame by frame to measure free deflection. For each frame, the edge information of the PUC was extracted, as illustrated in Figure 6a. Specifically, the middle nine pixels corresponding to the top layer of the PUC were identified and highlighted in red, as shown in Figure 6a. In this paper, the mean vertical position of these red pixels was used to determine the top layer’s position. The vertical position information in pixels was converted into millimeters by using the intrinsic and extrinsic characteristics of the camera and the April tag.
To calculate the mean free deflection for a given pressure, we excluded the initial and final half a second of the data points (Figure 6b). This exclusion ensured that we considered only data points representing the fully deformed state of the PUC while avoiding capturing any dynamic transition responses. The mean free deflection of a PUC at the specific pressure was then calculated by using the remaining one-second-long data.

3.2.1. Results

Figure 7 presents the free-deflection behavior of Pneumatic Unit Cells (PUCs) under static-pressure conditions. In this experiment, three newly fabricated PUC samples per design were used to measure the free deflection. The measurements revealed that PUCs with top-layer thicknesses of 0.6 mm, 0.9 mm, and 1.2 mm exhibited free deflections (mean ± standard deviation across samples) of 13.66 ± 1.71 mm, 7.63 ± 0.37 mm, and 3.11 ± 0.31 mm, respectively, under a maximum pressure of 40 kPa. To examine the linear relationship between free deflection and pressure, the data were fitted to Equation (1):
F r e e D e f l e c t i o n = a s F D × P r e s s u r e ,
The term ‘Pressure’ represents the inflation pressure and the term ‘Free Deflection’ represents the resulting motion of the top layer. The term ‘ a s F D ’ is the coefficient in the linear relation between free deflection and pressure.
Two curve fits were performed to identify the pressure range that describes the relation between inflation pressure and free deflection by using Equation (1) with the least root mean square error. The fits consisted of one that covered free-deflection measurements for pressures between 4 and 40 kPa (not shown in Figure 7) and another that covered measurements for pressures between 4 and 30 kPa (shown in Figure 7). The results, including the slope ‘ a s F D ’ and root mean square error from all the fits, are presented in Table 2.
To note, we excluded the free-deflection data at 0 kPa and 2 kPa due to limitations in the hardware setup’s ability to deliver consistent 2 kPa pressure.

3.2.2. Discussion

Within the scope of the current paper and based on the free-deflection behavior presented in Figure 7, we decided to operate within the linear range of PUC actuators to avoid undesired plastic deformation. These cautionary conditions were not met by the 0.6 mm PUCs within the early stages of inflation and by the 0.9 mm PUCs for pressures close to 30 kPa. As a result, for all further experiments, the 0.6 mm PUCs were excluded from consideration and the maximum inflation pressure was capped at 30 kPa. Due to the limitations of the proportional pressure-control valve (VEAB-L-26-D13-Q4-V1-1R1, Festo, Germany) in generating a consistent 2 kPa pressure, the free-deflection data for the pressure 2 kPa is also excluded and not considered for the linear curve fit.
The coefficient ‘ a s F D ’ dimensionally represents the ratio of mm to kPa, indicating the deformation characteristics of the PUC’s top layer. Essentially, the coefficient a s F D serves as a measure of the PUC’s top-layer compliance, which inversely relates to its stiffness. The stiffness of the top layer is influenced by various factors, including the span, thickness, and material. Given that the top-layer thickness is the sole variable between PUC designs, it is expected to be the primary factor affecting the magnitude of the coefficient ‘ a s F D ’. With an increase in thickness, the stiffness is expected to increase. The results of the linear curve fitting, based on free-deflection measurements, estimate the value of the coefficient a s F D as 0.094 mm/kPa for the 0.9 mm PUC design and 0.065 mm/kPa for the 1.2 mm PUC design. These findings affirm our expectations, illustrating that PUCs with a greater top-layer thickness are less compliant (stiffer) compared to PUCs with a thinner top-layer thickness.

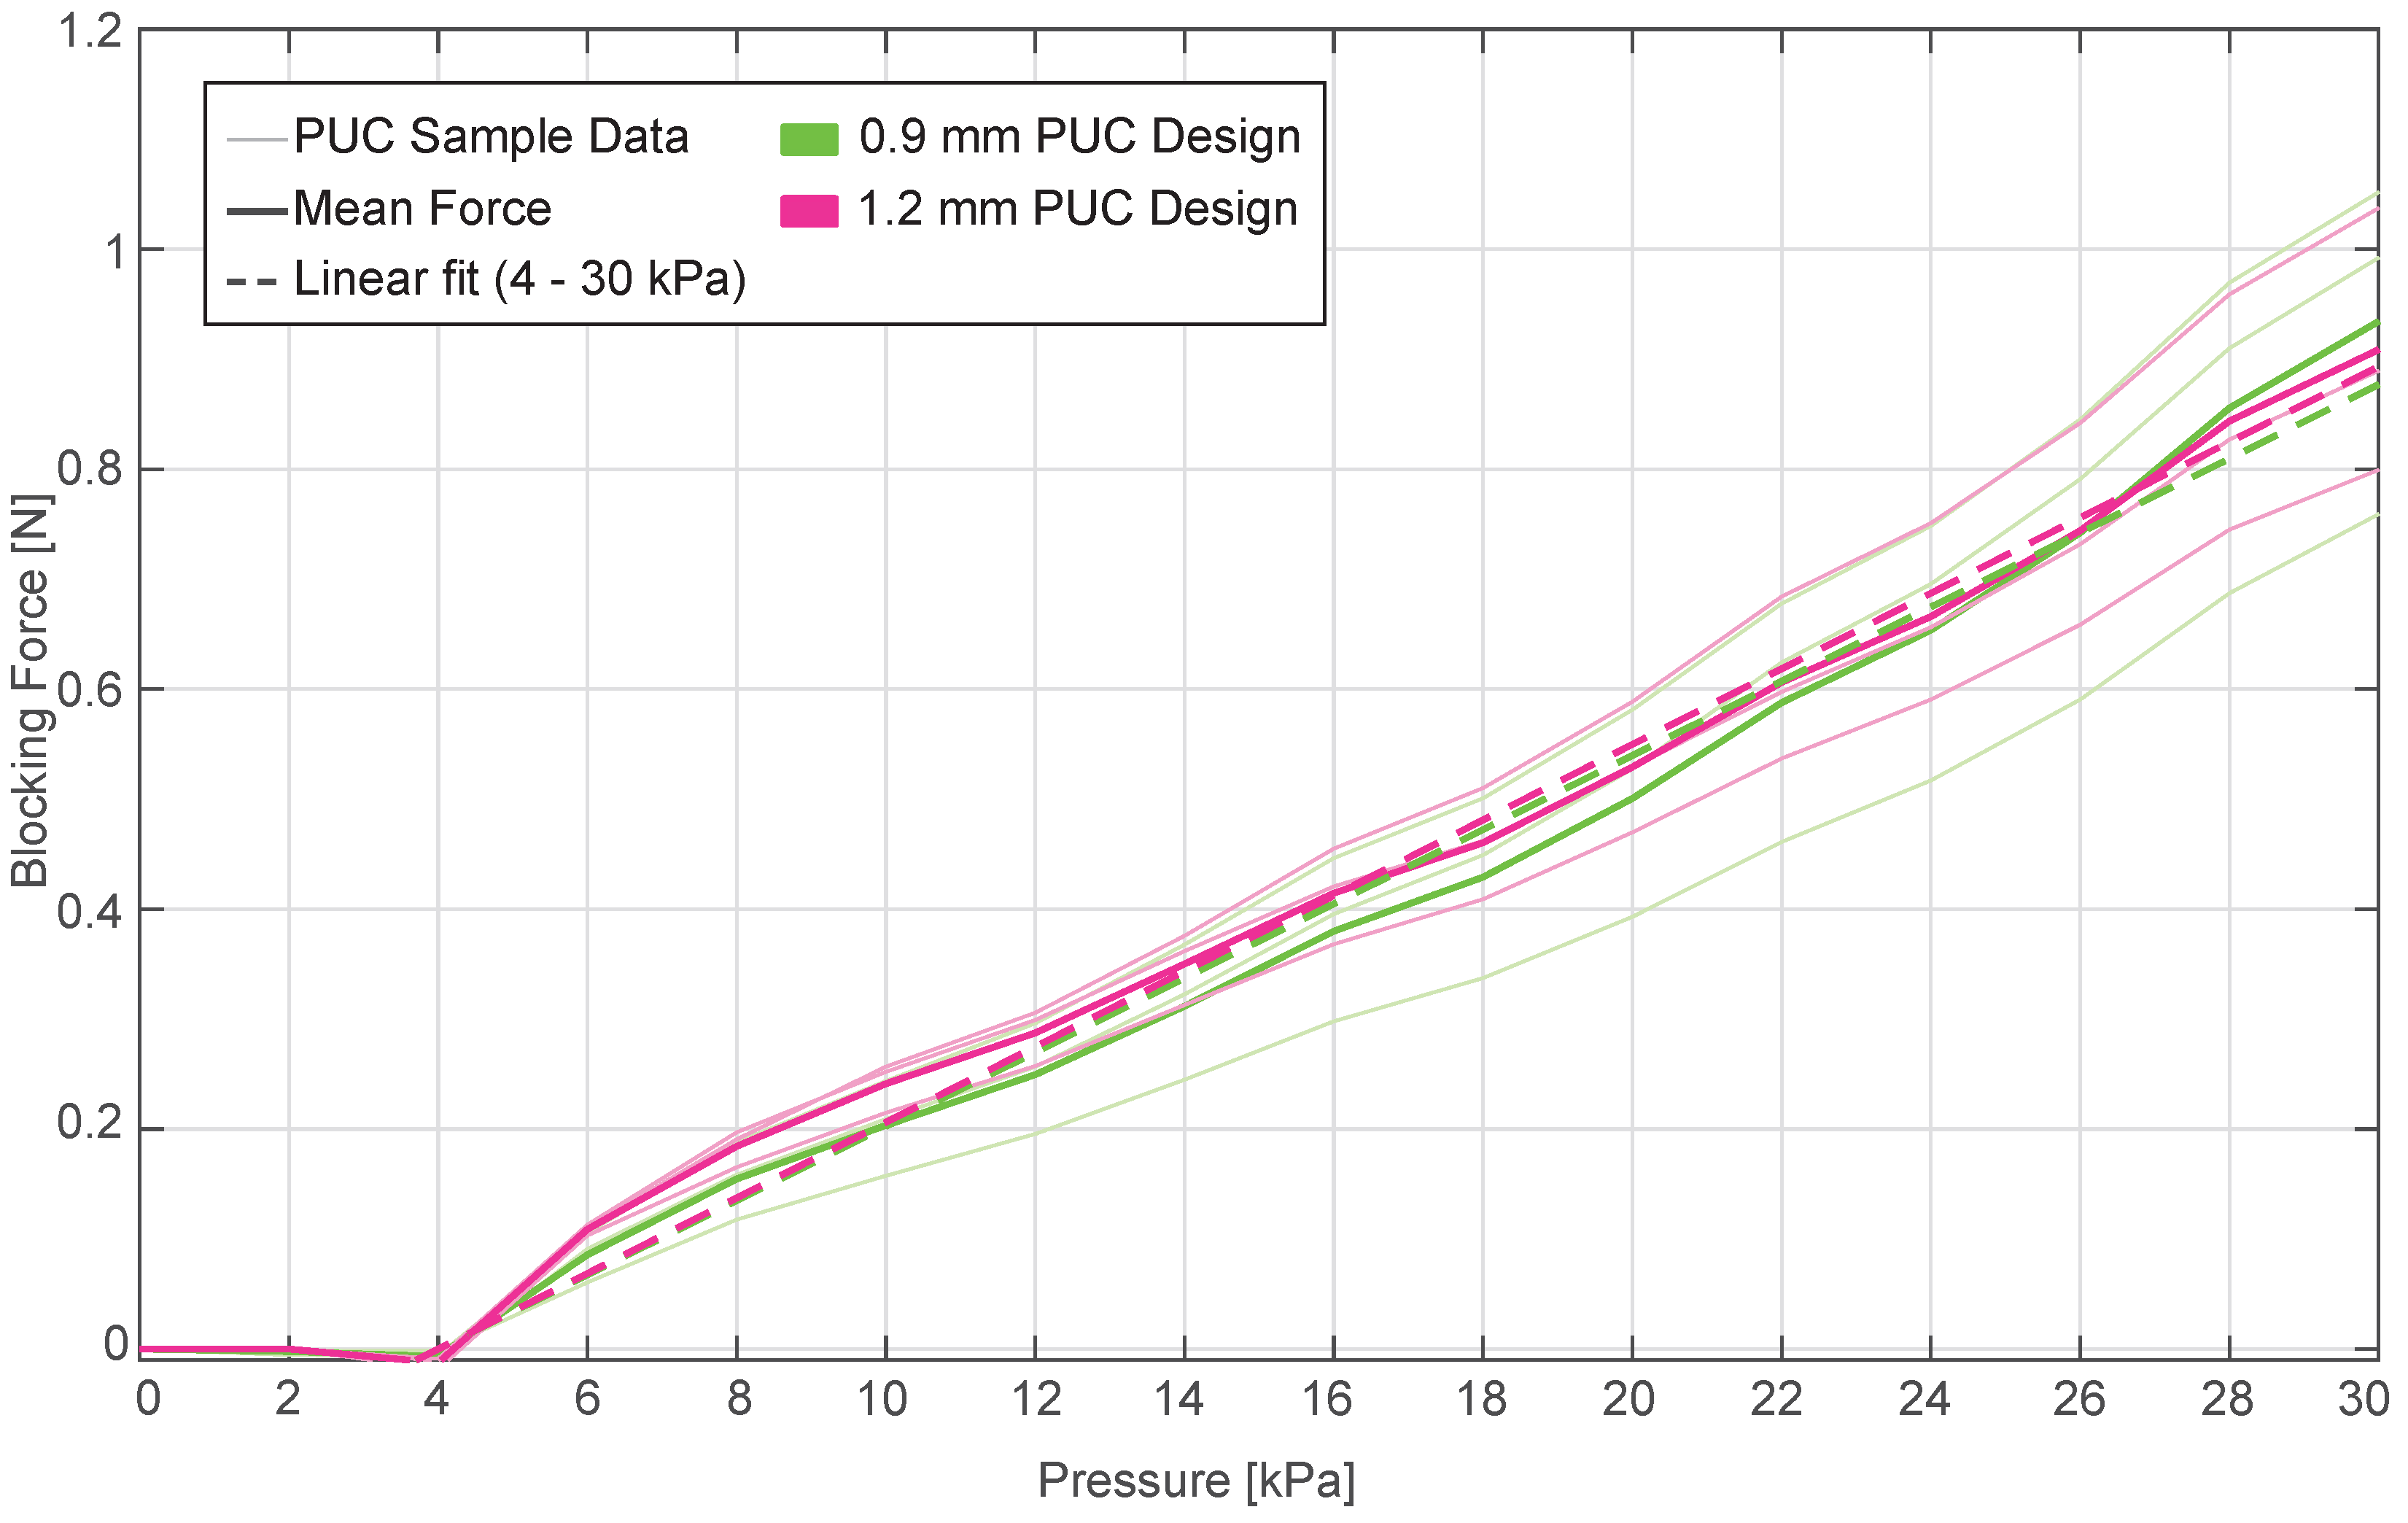
3.3. Static-Pressure Condition—Blocking-Force Measurement

The aim of the blocking-force test was to measure the maximum force exerted by a PUC for a given inflation pressure. The blocking-force behavior of the PUC was characterized by using the setup described in Figure 5c. The test setup involved placing a PUC on a rigid mounting platform while a force transducer (KAP-E 20 N-0.2, Angewandte System Technik GmbH, Dresden, Germany) with a rigid contact probe was positioned directly above the PUC’s top layer. Before inflating the PUC samples, the force transducer zeroed.
The PUCs were inflated in steps of 2 kPa from 0 to 30 kPa (Figure 5a). The pressure inside the PUCs was maintained for two seconds, and force data from the transducer were recorded at a sampling rate of 20 Hz. Within this time frame, we excluded the initial and final half a second of force data, calculating the mean of the remaining measured force data to determine the effective blocking force for the specific constant inflation pressure. Figure 6b shows the input–output response and data points used for the mean blocking-force calculation.

3.3.1. Results

Figure 8 presents the blocking-force performance of 0.9 mm and 1.2 mm PUC designs under static-pressure conditions. In this experiment, three newly fabricated PUC samples per design were used for the blocking-force measurements. The results revealed that the mean and standard deviation of the blocking force between the PUC samples for the 0.9 mm PUC design were 0.93 ± 0.15 N and the mean and standard deviation of the blocking force between the PUC samples for the 1.2 mm PUC design were 0.90 ± 0.12 N under a maximum pressure of 30 kPa:
B l o c k i n g F o r c e = a s B F × P r e s s u r e ,
To examine the linear relationship between force and pressure, the blocking-force data were fitted to Equation (2). The term ‘Blocking Force’ and ‘Pressure’ represent the measured mean blocking force for an inflation pressure and the inflation pressure, respectively. The term ‘ a s B F ’ represents the slope of the linear relationship. The fits are performed per PUC design. The results, including the slope ‘ a s B F ’ and root mean square error from all the fits, are presented in Table 3.

3.3.2. Discussion

The blocking-force measurement showed a similar blocking force–pressure relation for both the 0.9 mm and 1.2 mm PUC designs, implying that there is no noticeable effect of the top-layer thickness. This is also reinforced in the linear-curve-fit results, where the slope term a s B F resulted in similar magnitudes for both the 0.9 mm and 1.2 mm PUC designs.
Similar to the observation in Section 3.2.2, the measured blocking-force data for 2 kPa pressure are excluded for curve fitting due to the limitations of the proportional pressure-control valve. It is also observed that the considered force transducer (KAP-E 20 N-0.2, Angewandte System Technik GmbH, Dresden, Germany) is not sensitive enough to measure the blocking force at 4 kPa pressure. To avoid the underestimation of the pressure–blocking force relation, the pressure term in Equation (2) is offset by 4 kPa.
Dimensionally, the term a s B F represents the effective contact area of the PUC with the force sensor. Considering a PUC with an 8 mm diameter, this effective contact area is expected to correspond to the top layer’s surface area, which is approximately 50.27 mm 2 . However, the results from the linear curve fit reveal that the magnitude of a s B F for the 0.9 mm and 1.2 mm PUCs is approximately 33.7 mm 2 and 34.4 mm 2 , respectively.
This discrepancy can be attributed to two contributing factors. First, the nonuniform distribution of force applied by the PUC onto the force transducer. In the case of PUCs, the force magnitude increases from zero at the edge, where there is no force applied in the normal direction, to its maximum at the center. This gradient in force significantly impacts the effective contact area. Second, PUCs are fabricated by using the Dragon SkinTM 10 Medium, a viscoelastic material, which introduces an element of energy loss.

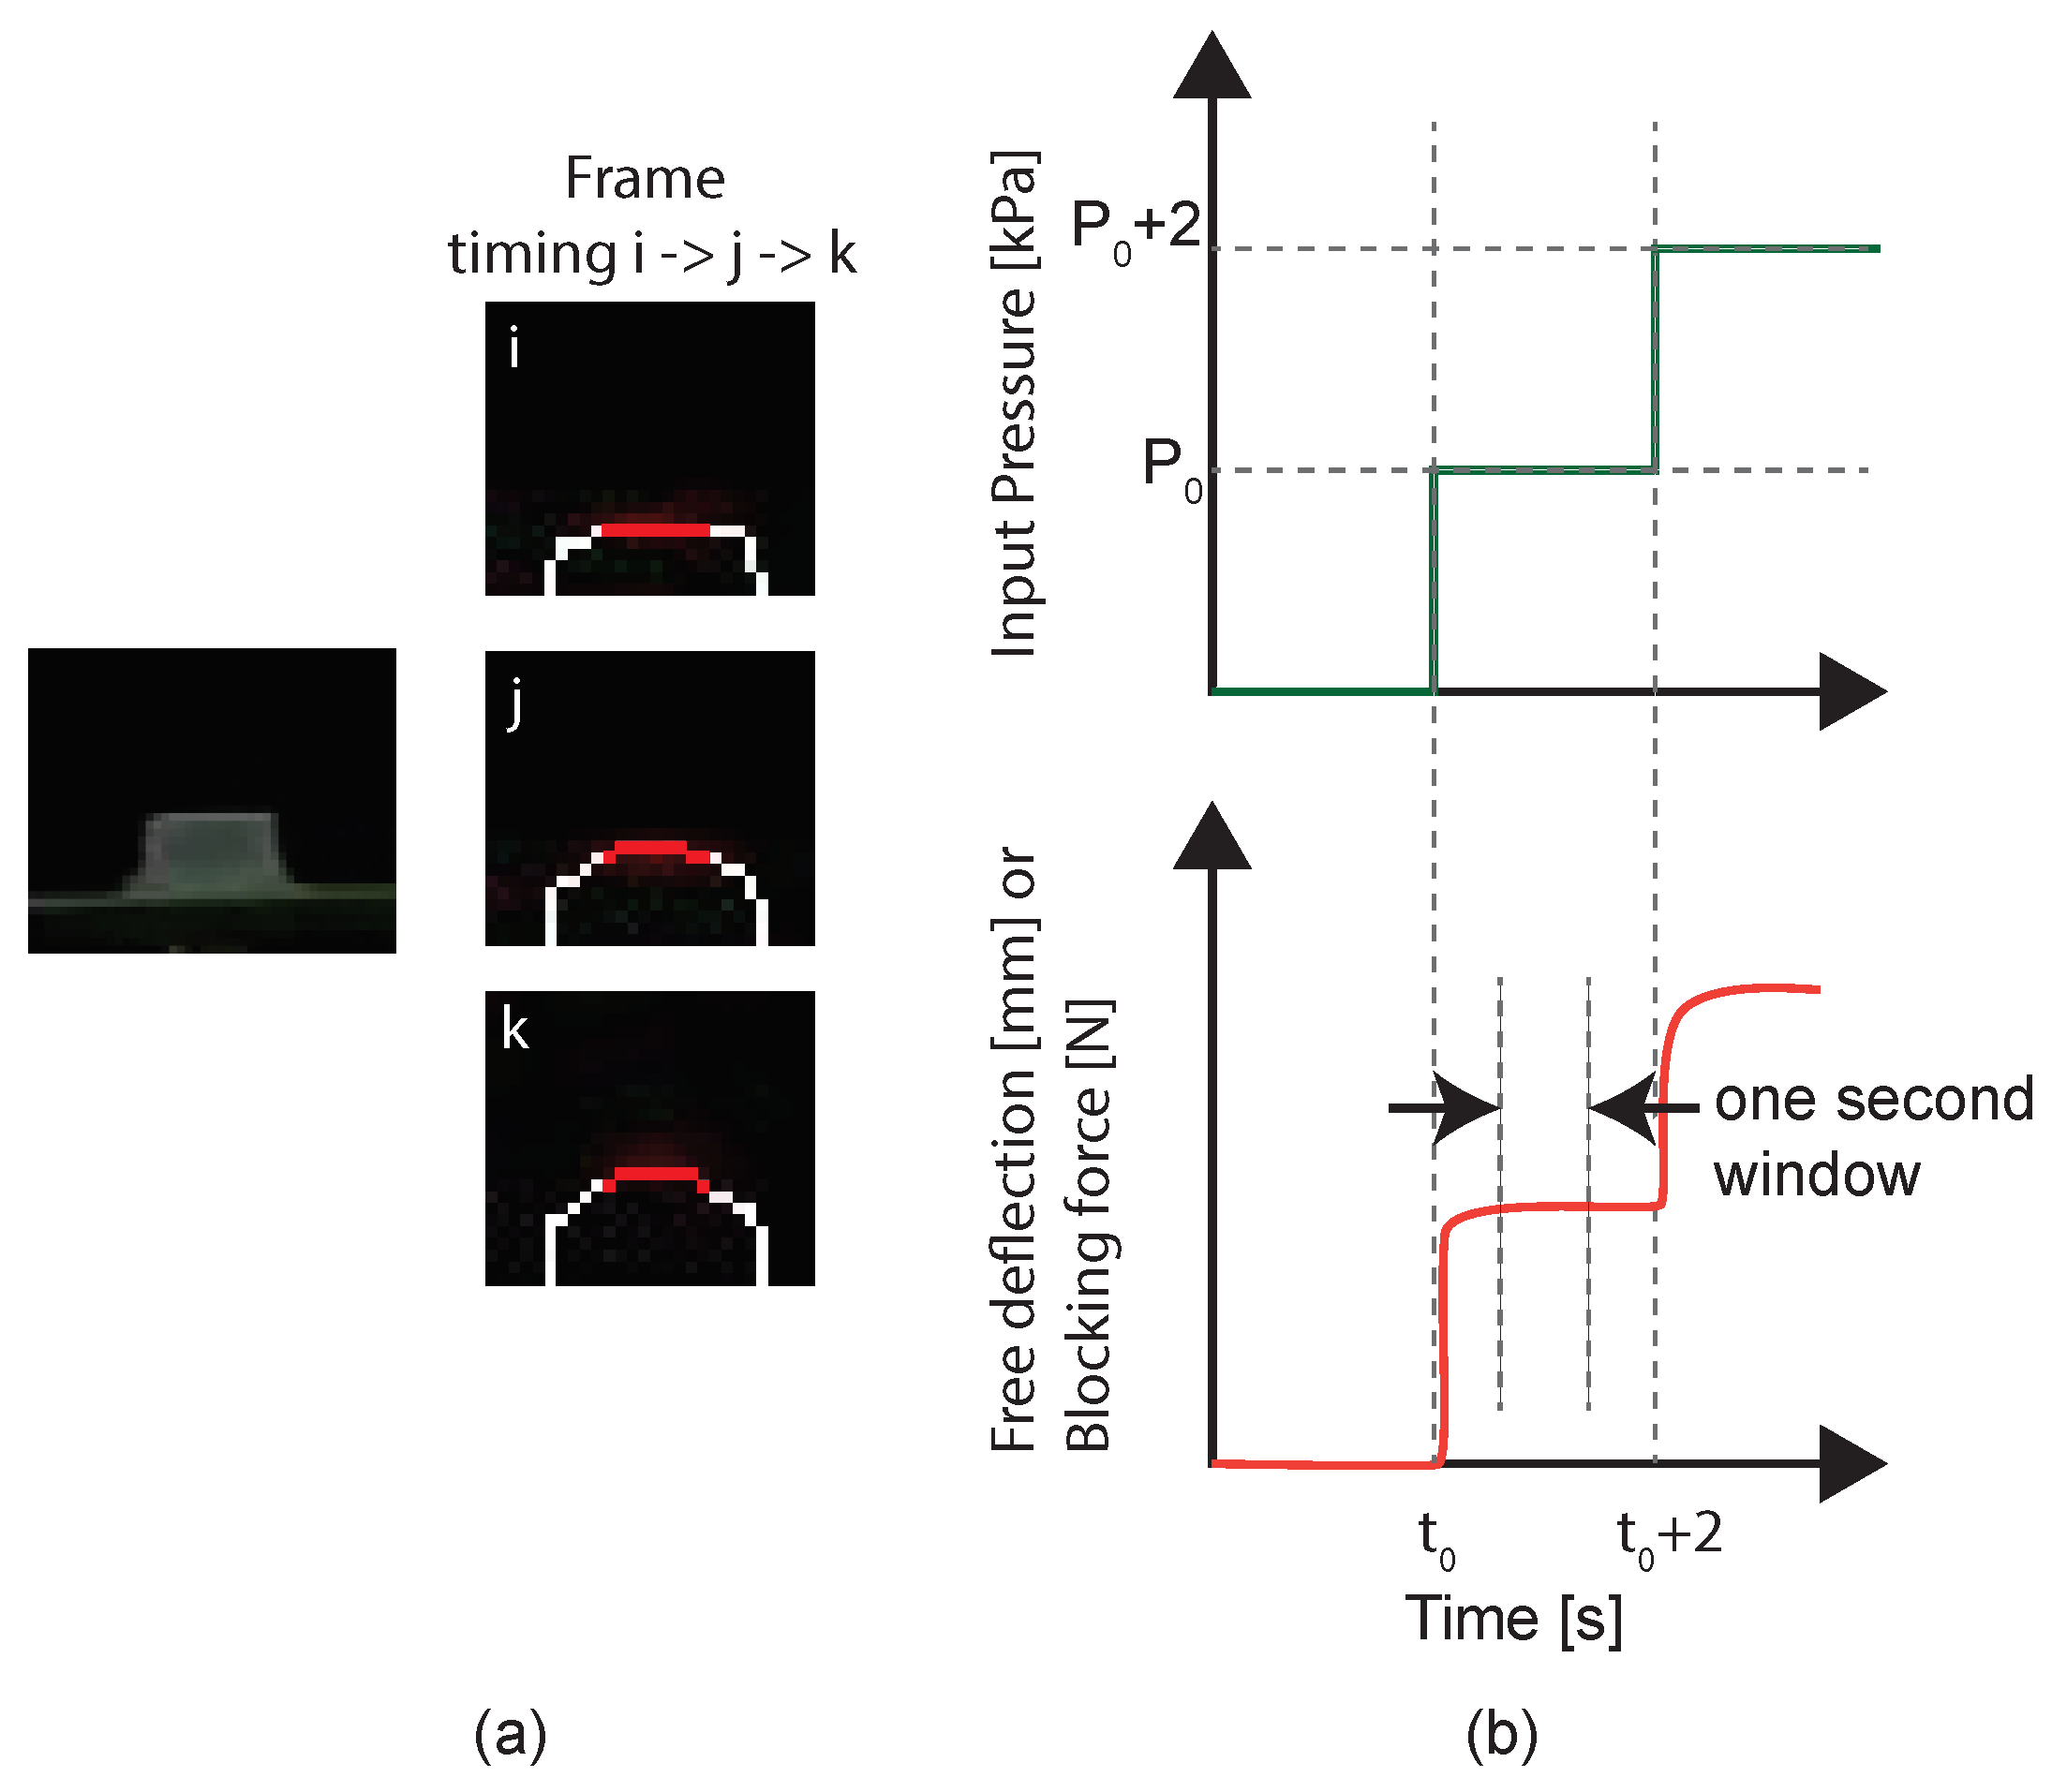
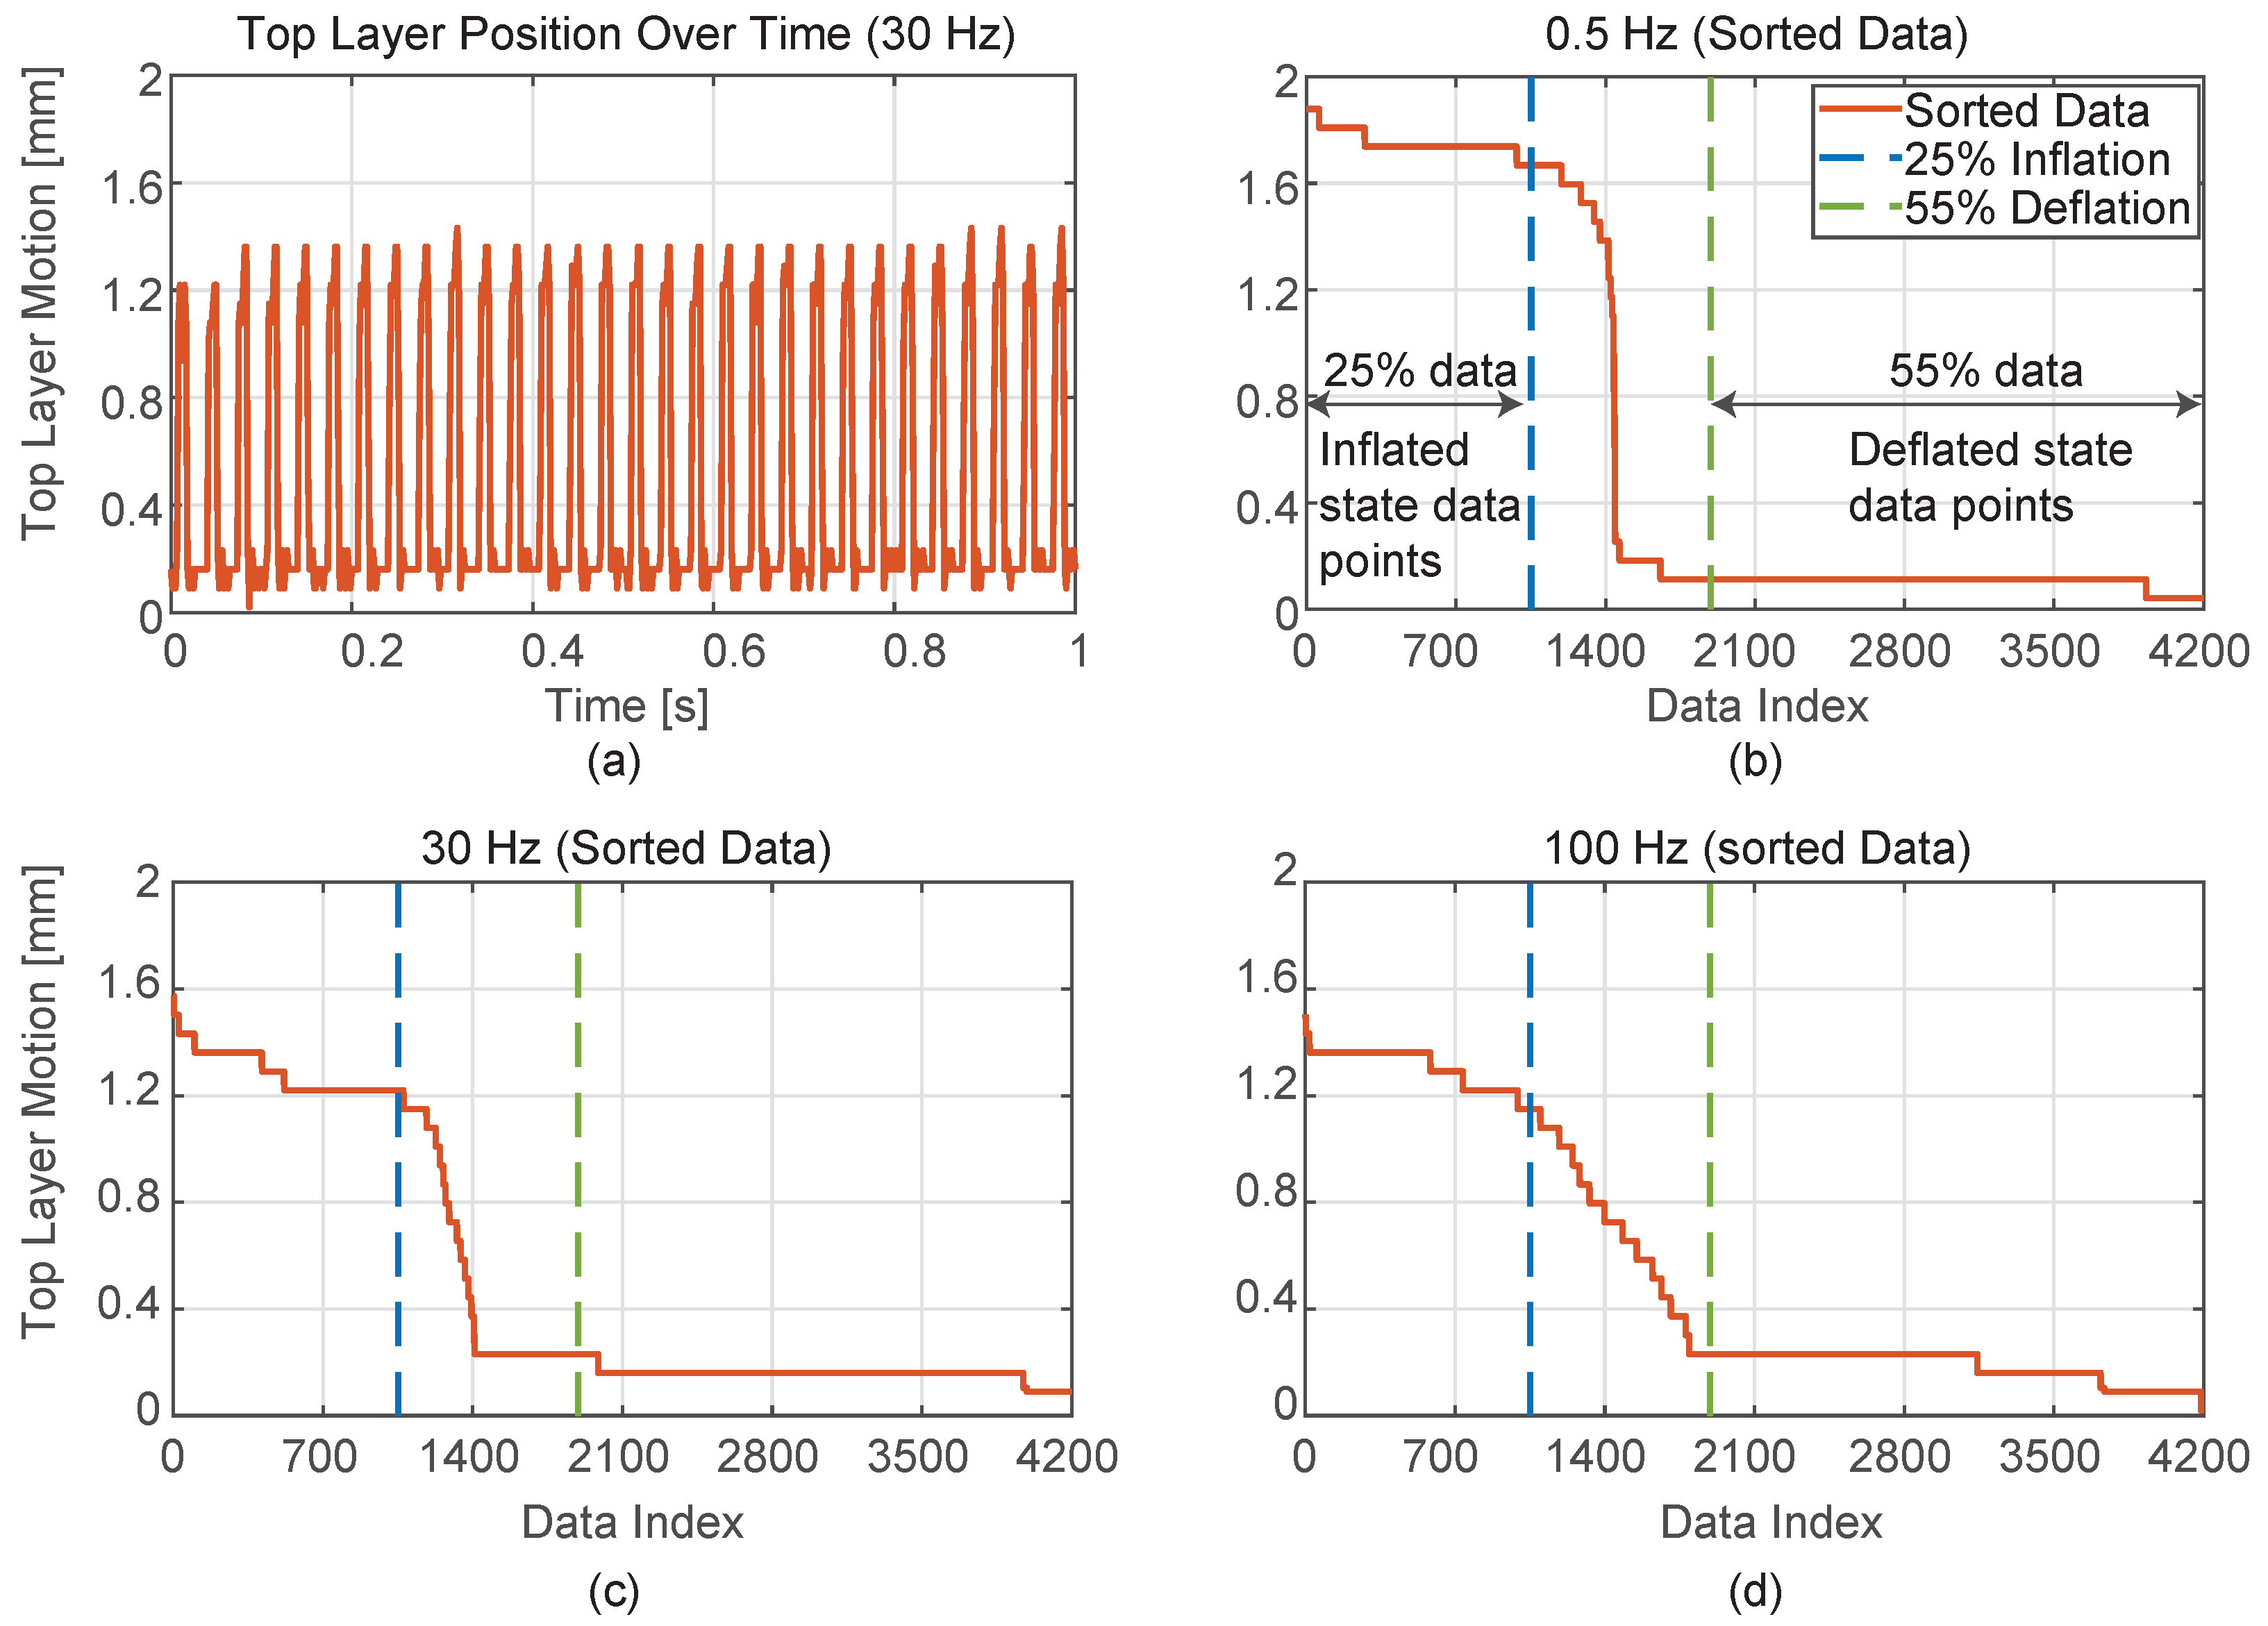
3.4. Frequency Condition—Free-Deflection Measurement

The frequency condition aimed to examine the PUC’s free-deflection behavior under various inflation and deflation rates. PUC samples were exposed to a range of frequencies (inflation–deflation rates) spanning from 0.5 Hz to 100 Hz with variations in pressure. Specifically, the frequency sweep covered inflation–deflation cycles at 10 kPa, followed by 20 kPa and then 30 kPa pressures. Each frequency was evaluated for its free-deflection behavior during a 7 s measurement period, followed by a 3 s resting period. For this condition, three newly fabricated PUCs per design were used for the free-deflection measurements.
The same hardware setup as described in Section 3.2 was employed for the frequency test. However, additional steps were implemented to extract the free-deflection magnitude during the frequency condition. Initially, the mean position of the top layer for a given frame was determined (Figure 9a) following the steps described in Section 3.2. The extracted position data per frame were then sorted in descending order, as shown in Figure 9b–d.
The initial 25% of the sorted positions were regarded as representing the inflated state of the PUC, while the final 55% of the sorted positions were treated as the deflated state. These specific percentages were chosen to account for the 30% duty cycle. To accommodate data points capturing the inflation–deflation transition states, percentages of 25% and 55% were used for the inflated and deflated states, respectively. The free deflection for each frequency and pressure was determined by taking the difference between the means of the data points corresponding to the inflated and deflated states.

3.4.1. Results

Figure 10 presents the mean free deflection of 0.9 mm and 1.2 mm PUC designs across inflation–deflation frequencies ranging from 0.5 Hz to 100 Hz at pressures of 10 kPa, 20 kPa, and 30 kPa. For this condition, three newly fabricated PUCs per design were tested for their free-deflection behavior.
All the tested PUC samples exhibited their maximum mean free deflection at 30 kPa and 0.5 Hz, with 0.9 mm PUC measuring 2.85 ± 0.16 mm and 1.2 mm PUC measuring 1.57 ± 0.19 mm. The minimum mean free deflection for all the PUCs occurred at 10 kPa and 100 Hz, with the 0.9 mm PUC measuring 0.62 ± 0.12 mm and the 1.2 mm PUC measuring 0.6 ± 0.15 mm.
At a given pressure, the free-deflection magnitude decreased with increasing frequency, with a more significant drop as pressure increased. For 0.9 mm PUCs, at 10 kPa pressure, the mean free deflection decreased by 28 % , while at 30 kPa pressure, it dropped by 47 % . In the case of 1.2 mm PUCs, at 10 kPa and 30 kPa pressures, the mean free deflection decreased by 17 % and 36 % , respectively.
Similar to the static-pressure condition discussed in Section 3.2, the free-deflection magnitude is influenced by the applied pressure, with the extent of influence varying with frequency. For the 0.9 mm PUC design, free deflection increased by 239 % at 0.5 Hz and 148 % at 100 Hz when pressure increased from 10 kPa to 30 kPa. In the case of the 1.2 mm PUC design, free deflection increased by 121 % at 0.5 Hz and 69 % at 100 Hz for the same increase in pressure. We further analyzed the measured free-deflection data by fitting it to Equation (3):
F r e e D e f l e c t i o n = a f F D × P r e s s u r e b f F D × P r e s s u r e × F r e q u e n c y
The terms ‘Pressure’ and ‘Frequency’ represent the pressure and rate of inflation and deflation applied to a PUC, while the term ‘Free Deflection’ represents the measured motion of the top layer of the PUC. The terms ‘ a f F D ’ and ‘ b f F D ’ are fitted coefficients defined in the Equation (3). Separate fits were performed for the 0.9 mm and 1.2 mm PUC designs, and the results are reported in Table 4.

3.4.2. Discussion

Under the frequency condition, the free deflection is influenced by both pressure and frequency. The observed behavior suggests an inverse relation between free deflection and frequency. The reduction in free deflection from 0.5 Hz to 100 Hz becomes more pronounced with an increase in pressure. This observation may be attributed to challenges related to fluid flow inherent in pneumatically driven actuators. The extent of this fluid flow challenge is expected to increase as we transition from low-pressure and low-frequency conditions to high-pressure and high-frequency conditions. In such cases, the PUCs may not reach the intended pressure, potentially causing a reduced free-deflection performance. For a clear understanding of the behavior of PUCs during frequency conditions, an investigation that includes the real-time sensing of pressure inside the PUCs is considered for future work.
The second term, b f F D , in Equation (3) accounts for fluid flow limitations, which can be viewed as a penalty term. This penalty is affected by both frequency and pressure, with a higher frequency and high pressure imposing a greater penalty on the free deflection. The estimated magnitudes of b f F D for the 0.9 mm and 1.2 mm PUC designs are in the order of 0.36 ×   10 3 mm × S / kPa and 0.17 × 10 3 mm × S / kPa .
Accounting for the similar internal volume of the 0.9 mm and 1.2 mm PUC designs and the identical operating conditions, curve fitting to Equation (3) should result in the coefficient term b f F D with identical magnitudes. However, this is not observed. The estimated magnitudes of b f F D differ between the designs and fall within distinct confidence bounds. This suggests the influence of an unaccounted parameter on b f F D . Since both PUC designs only differ by the compliance of their top layer, it is recommended to repeat the fitting with the introduction of a compliance term to the penalty term.
The root mean square errors (RMSEs) of the curve fits for the 0.9 mm and 1.2 mm PUC designs are approximately 0.22 mm and 0.20 mm, respectively. Notably, in the case of the 0.9 mm PUC design at 30 kPa, a significant deviation between the measured free deflection and curve fit contributes to the RMSE. This deviation can be attributed to the 0.9 mm PUC design’s operation at the threshold of nonlinear deformation. This characteristic is also observable in the free-deflection behavior under static-pressure conditions (Figure 7). Given that the a f F D term in Equation (3) accounts solely for the linear free-deflection behavior, the deviation between the curve-fit expectation and the measured free deflection can be justified.
Two instances of PUC behavior are also noteworthy contributors to the RMSE: one in a 0.9 mm PUC at a 10 kPa pressure (Figure 10a) and the other in a 1.2 mm PUC sample at a 20 kPa pressure (Figure 10b). In both cases, the PUCs faced challenges in exhausting and taking in air input, possibly due to airflow obstructions caused by dust particles or tubing kinks. While the exact cause remains uncertain, we are considering a thorough inspection of the test setup and the potential implementation of rapid exhaust valves in future studies to prevent similar issues.

4. General Discussion

The primary focus of this research paper is to report on the manufacturing and behavior of Pneumatic Unit Cell (PUC) actuators. This study demonstrates that the closed-mold fabrication method consistently produces PUC actuators with a uniform top-layer thickness, with an overshoot of approximately 2% to 3% compared to the target thickness.
The characterization of different PUC designs with varying top-layer thicknesses reveals their performance under both static-pressure and frequency conditions. Under static-pressure conditions, PUC designs with top-layer thicknesses of 0.9 mm and 1.2 mm exhibit a linear relationship between input pressure and free deflection. Notably, the 0.9 mm PUC design shows a greater range of free deflection compared to the 1.2 mm design. Blocking-force tests under similar static-pressure conditions (up to 30 kPa) demonstrate an identical force performance for both the 0.9 mm and 1.2 mm PUC designs.
In the frequency-condition characterization, this study shows that PUCs exhibit free deflection at inflation–deflation frequencies of up to 100 Hz at 30 kPa pressure. Specifically, the 0.9 mm PUCs demonstrate a wider range of free deflection compared to the 1.2 mm PUCs under identical input conditions.
The measured free-deflection behavior of the PUCs under the static-pressure condition and frequency condition was fitted to Equation (1) and Equation (3), respectively. Both equations were selected to relate the input conditions to the free deflection. As discussed in Section 3.2.2, the coefficient a s F D in Equation (1) is influenced by the compliance of the PUC’s top layer. Similarly, in Equation (3), the coefficient a f F D is expected to exhibit similar characteristics to a s F D from Equation (1). Despite the similarity of the coefficients a s F D and a f F D , the curve fits reported in Table 2 and Table 4 show estimates of the coefficients with confidence bounds (intervals) that do not overlap.
The difference in the estimation of the coefficients can be attributed to the nature of the data used during curve fitting. For coefficient a s F D , the free-deflection magnitude is measured by maintaining a constant pressure for a duration of two seconds. In contrast, coefficient a f F D is determined under dynamic conditions with a maximum duration of 0.6 s for inflation at 0.5 Hz and a 30% duty cycle.
The characterization study presented in this paper is based on experimental observations. A numerical model of the PUC behavior would help in extrapolating the PUC behavior to conditions outside of those discussed in this paper. This would require a well-defined material model that captures the viscoelastic behavior of silicone materials. In future work, an exploration into quantifying the material properties and conducting comparative studies between the numerical and experimental results will be considered.
Due to the viscoelastic material properties of the Dragon SkinTM 10 Medium, the PUC behavior could depend on the loading history, indicating the need for an investigation into the hysteresis characterization of the PUC actuators. This necessitates an updated measurement setup with a higher sampling rate for both free-deflection and blocking-force tests under static and frequency conditions. Therefore, in future studies, we plan to explore the hysteresis characterization of the PUC actuators to obtain a more comprehensive understanding of PUCs’ behavior.

5. Conclusions

In this paper, we test the physical performance of Pneumatic Unit Cells (PUCs) as potential soft actuators for applications in the field of haptics, primarily due to their capacity to generate static-pressure and vibrotactile feedback. The design we introduce is selected for its simplicity in design and wearability [11].
This paper presents a comprehensive account of the fabrication methods for PUCs. A particular focus is placed on investigating the top-layer thickness, revealing that close-mold fabrication effectively produces soft actuators with uniform thickness.
Within the paper’s scope, PUCs with top-layer thicknesses of 0.9 mm and 1.2 mm were tested for free deflection under both static-pressure and frequency conditions, as well as blocking force under static-pressure conditions. The experimental outcomes highlighted that the PUC’s exhibit a linear relationship between the input pressure and output free deflection and blocking force under static-pressure conditions. The results also demonstrate that PUCs can rapidly inflate and deflate at 30 kPa pressure up to 100 Hz, making them desirable as haptic actuators capable of generating multiple forms of feedback.
This research lays a foundational groundwork for the integration of PUCs into haptic devices, with initial investigations already showing encouraging results [32]. In the future, the exploration will expand to encompass PUCs of diverse forms and sizes, enabling the examination of their distinct characteristics and their potential to evoke varying degrees and forms of human perception.
In conclusion, this study establishes Pneumatic Unit Cells as promising soft actuators for haptic applications, showcasing their fabrication flexibility and capacity to generate both static-pressure and vibrotactile feedback.

Supplementary Materials

The following supporting information can be downloaded at https://www.mdpi.com/article/10.3390/act13020045/s1. Video S1: Free deflection dehaviour of PUC actuators under static pressure conditions.

Author Contributions

Conceptualization, F.E.V.B. and I.A.K.; methodology, K.D.K., F.E.V.B. and I.A.K.; Software, K.D.K., F.E.V.B.; Validation, K.D.K., F.E.V.B. and I.A.K.; Formal Analysis, K.D.K.; Investigation, K.D.K.; Resources, K.D.K. and I.A.K.; Data curation, K.D.K.; Writing—original draft preparation, K.D.K.; Writing—review and editing, K.D.K., F.E.V.B. and I.A.K.; Visualization, K.D.K., F.E.V.B. and I.A.K.; Supervision, F.E.V.B. and I.A.K.; Project administration, F.E.V.B. and I.A.K.; Funding acquisition, I.A.K. All authors have read and agreed to the published version of the manuscript.

Funding

This research received no external funding.

Data Availability Statement

The data presented in this study are openly available in Github at DOI https://doi.org/10.4121/7bcaf963-327a-42c9-b085-6af958cdd669.

Conflicts of Interest

The authors declare no conflicts of interest.

References

  1. Escobar-Castillejos, D.; Noguez, J.; Neri, L.; Magana, A.J.; Benes, B. A Review of Simulators with Haptic Devices for Medical Training. J. Med. Syst. 2016, 40, 104. [Google Scholar] [CrossRef] [PubMed]
  2. Enayati, N.; De Momi, E.; Ferrigno, G. Haptics in Robot-Assisted Surgery: Challenges and Benefits. IEEE Rev. Biomed. Eng. 2016, 9, 49–65. [Google Scholar] [CrossRef] [PubMed]
  3. Lederman, S.J.; Klatzky, R.L. Haptic perception: A tutorial. Atten. Percept. Psychophys. 2009, 71, 1439–1459. [Google Scholar] [CrossRef] [PubMed]
  4. Okamoto, S.; Nagano, H.; Yamada, Y. Psychophysical Dimensions of Tactile Perception of Textures. IEEE Trans. Haptics 2013, 6, 81–93. [Google Scholar] [CrossRef] [PubMed]
  5. Wang, D.; Ohnishi, K.; Xu, W. Multimodal Haptic Display for Virtual Reality: A Survey. IEEE Trans. Ind. Electron. 2020, 67, 610–623. [Google Scholar] [CrossRef]
  6. Bai, H.; Li, S.; Shepherd, R. Elastomeric Haptic Devices for Virtual and Augmented Reality. Adv. Funct. Mater. 2021, 31, 2009364. [Google Scholar] [CrossRef]
  7. Talhan, A.; Kumar, S.; Kim, H.; Hassan, W.; Jeon, S. Multi-mode soft haptic thimble for haptic augmented reality based application of texture overlaying. Displays 2022, 74, 102272. [Google Scholar] [CrossRef]
  8. Prattichizzo, D.; Pacchierotti, C.; Rosati, G. Cutaneous Force Feedback as a Sensory Subtraction Technique in Haptics. IEEE Trans. Haptics 2012, 5, 289–300. [Google Scholar] [CrossRef]
  9. Massimino, M.; Sheridan, T. Sensory Substitution for Force Feedback in Teleoperation. IFAC Proc. Vol. 1992, 25, 109–114. [Google Scholar] [CrossRef]
  10. Pacchierotti, C.; Prattichizzo, D.; Kuchenbecker, K.J. Cutaneous Feedback of Fingertip Deformation and Vibration for Palpation in Robotic Surgery. IEEE Trans. Biomed. Eng. 2016, 63, 278–287. [Google Scholar] [CrossRef]
  11. Pacchierotti, C.; Sinclair, S.; Solazzi, M.; Frisoli, A.; Hayward, V.; Prattichizzo, D. Wearable Haptic Systems for the Fingertip and the Hand: Taxonomy, Review, and Perspectives. IEEE Trans. Haptics 2017, 10, 580–600. [Google Scholar] [CrossRef] [PubMed]
  12. Leroy, E.; Hinchet, R.; Shea, H. Multimode Hydraulically Amplified Electrostatic Actuators for Wearable Haptics. Adv. Mater. 2020, 32, 2002564. [Google Scholar] [CrossRef] [PubMed]
  13. Leroy, E.; Shea, H. Hydraulically Amplified Electrostatic Taxels (HAXELs) for Full Body Haptics. Adv. Mater. Technol. 2023, 8, 2300242. [Google Scholar] [CrossRef]
  14. Grasso, G.; Rosset, S.; Shea, H. Fully 3D-Printed, Stretchable, and Conformable Haptic Interfaces. Adv. Funct. Mater. 2023, 33, 2213821. [Google Scholar] [CrossRef]
  15. Youn, J.H.; Mun, H.; Kyung, K.U. A Wearable Soft Tactile Actuator with High Output Force for Fingertip Interaction. IEEE Access 2021, 9, 30206–30215. [Google Scholar] [CrossRef]
  16. Hassan, W.; Kim, H.; Talhan, A.; Jeon, S. A Pneumatically-Actuated Mouse for Delivering Multimodal Haptic Feedback. Appl. Sci. 2020, 10, 5611. [Google Scholar] [CrossRef]
  17. Huaroto, J.J.; Suarez, E.; Krebs, H.; Marasco, P.; Vela, E. A Soft Pneumatic Actuator as a Haptic Wearable Device for Upper Limb Amputees: Toward a Soft Robotic Liner. IEEE Robot. Autom. Lett. 2019, 4, 17–24. [Google Scholar] [CrossRef]
  18. Sonar, H.; Gerratt, A.P.; Lacour, S.; Paik, J. Closed-Loop Haptic Feedback Control Using a Self-Sensing Soft Pneumatic Actuator Skin. Soft Robot. 2020, 7, 22–29. [Google Scholar] [CrossRef]
  19. Hashem, M.S.; Joolee, J.B.; Hassan, W.; Jeon, S. Soft Pneumatic Fingertip Actuator Incorporating a Dual Air Chamber to Generate Multi-Mode Simultaneous Tactile Feedback. Appl. Sci. 2021, 12, 175. [Google Scholar] [CrossRef]
  20. Talhan, A.; Kim, H.; Jeon, S. Tactile Ring: Multi-Mode Finger-Worn Soft Actuator for Rich Haptic Feedback. IEEE Access 2020, 8, 957–966. [Google Scholar] [CrossRef]
  21. Moy, G.; Wagner, C.; Fearing, R. A compliant tactile display for teletaction. In Proceedings of the 2000 ICRA. Millennium Conference. IEEE International Conference on Robotics and Automation. Symposia Proceedings (Cat. No.00CH37065), San Francisco, CA, USA, 24–28 April 2000. [Google Scholar] [CrossRef]
  22. Ujitoko, Y.; Taniguchi, T.; Sakurai, S.; Hirota, K. Development of Finger-Mounted High-Density Pin-Array Haptic Display. IEEE Access 2020, 8, 145107–145114. [Google Scholar] [CrossRef]
  23. Suzuki, Y.; Kobayashi, M. Air jet driven force feedback in virtual reality. IEEE Comput. Graph. Appl. 2005, 25, 44–47. [Google Scholar] [CrossRef]
  24. Kim, Y.; Kim, S.; Ha, T.; Oakley, I.; Woo, W.; Ryu, J. Air-jet button effects in AR. In Lecture Notes in Computer Science; Springer: Berlin/Heidelberg, Germany, 2006. [Google Scholar] [CrossRef]
  25. Lee, E.H.; Kim, S.H.; Yun, K.S. Three-Axis Pneumatic Haptic Display for the Mechanical and Thermal Stimulation of a Human Finger Pad. Actuators 2021, 10, 60. [Google Scholar] [CrossRef]
  26. Frediani, G.; Carpi, F. Tactile display of softness on fingertip. Sci. Rep. 2020, 10, 20491. [Google Scholar] [CrossRef]
  27. Fukuda, T.; Tanaka, Y.; Kappers, A.M.; Fujiwara, M.; Sano, A. A Pneumatic Tactile Ring for Instantaneous Sensory Feedback in Laparoscopic Tumor Localization. IEEE Trans. Haptics 2018, 11, 485–497. [Google Scholar] [CrossRef]
  28. Premarathna, C.P.; Ruhunage, I.; Chathuranga, D.S.; Lalitharatne, T.D. Haptic Feedback System for an Artificial Prosthetic Hand for Object Grasping and Slip Detection: A Preliminary Study. In Proceedings of the 2018 IEEE International Conference on Robotics and Biomimetics (ROBIO), Kuala Lumpur, Malaysia, 12–15 December 2018; pp. 2304–2309. [Google Scholar] [CrossRef]
  29. Lim, S.C.; Lee, H.K.; Doh, E.; Yun, K.S.; Park, J. Tactile display with tangential and normal skin displacement for robot-assisted surgery. Adv. Robot. 2014, 28, 859–868. [Google Scholar] [CrossRef]
  30. King, C.H.; Franco, M.; Culjat, M.O.; Higa, A.T.; Bisley, J.W.; Dutson, E.; Grundfest, W.S. Fabrication and Characterization of a Balloon Actuator Array for Haptic Feedback in Robotic Surgery. J. Med. Devices 2008, 2, 041006. [Google Scholar] [CrossRef]
  31. King, C.; Culjat, M.; Franco, M.; Bisley, J.; Dutson, E.; Grundfest, W. Optimization of a Pneumatic Balloon Tactile Display for Robot-Assisted Surgery Based on Human Perception. IEEE Trans. Biomed. Eng. 2008, 55, 2593–2600. [Google Scholar] [CrossRef] [PubMed]
  32. van Beek, F.E.; Bisschop, Q.P.I.; Kuling, I.A. Validation of a soft Pneumatic Unit Cell (PUC) in a VR experience: A comparison between vibrotactile and soft pneumatic haptic feedback. IEEE Trans. Haptics 2023, 16, 1–11. [Google Scholar] [CrossRef] [PubMed]
  33. Caasenbrood, B.J.; Van Beek, F.E.; Chu, H.K.; Kuling, I.A. A Desktop-sized Platform for Real-time Control Applications of Pneumatic Soft Robots. In Proceedings of the 2022 IEEE 5th International Conference on Soft Robotics, Edinburgh, UK, 4–8 April 2022; Institute of Electrical and Electronics Engineers Inc.: Piscataway, NJ, USA, 2022; pp. 217–223. [Google Scholar] [CrossRef]
  34. OpenCV: Camera Calibration—docs.opencv.org. Available online: https://docs.opencv.org/4.x/dc/dbb/tutorial_py_calibration.html (accessed on 22 August 2023).
Figure 1. (a) Schematic and nomenclature used in describing Pneumatic Unit Cell (PUC). (b) Section view of PUC along coronal plane. (c) Pneumatic Unit Cell next to a scale for size reference.
Actuators 13 00045 g001
Figure 2. Fabrication steps of Pneumatic Unit Cells (PUC): (a) Mold used for the fabrication of the upper part of the PUC. (b) Mold used for the fabrication of the bottom part of the PUC. (c) Top view and cross-section view of the mold assembly. Injection of Dragon SkinTM 10 Medium into the molds through the inlets. (d) The extracted upper and bottom parts of PUCs from their respective molds. (e) Gluing of the upper and bottom parts of the PUC using Dragon SkinTM 10 Medium. (f) Fully assembled PUC.
Actuators 13 00045 g002
Figure 3. Measured location versus thickness ratio (mm/mm). The thickness ratio refers to the ratio of the measured top-layer thickness to the target top-layer thickness. (a) An illustration representing the thickness-measurement locations across the cross-section of the top layer. (b) The plots depict mean thickness ratios with error bars representing ± standard deviation (bold lines) and individual sample measurements (thin lines) for different PUC designs (0.6 mm in blue, 0.9 mm in green, and 1.2 mm in pink) at various measurement locations.
Actuators 13 00045 g003
Figure 4. Schematic of the hardware setup used to set the pressure on the Festo pressure regulator (model number: VEAB-L-26-D13-Q4-V1-1R1) and Festo high-frequency valve (model number: MHP2-MS1H-3/2G-M5) through Raspberry Pi 4 and Matlab.
Actuators 13 00045 g004
Figure 5. Input pressure signal and test setups used for measuring the free deflection of the top layer and blocking force of the PUCs under inflation: (a) Input pressure signal used during the static-pressure test. (b) The test setup used for measuring the free deflection. The picture illustrates the mounting platform for the PUC and an April tag marking the coronal plane of the PUCs. The setup was placed inside a desktop photo studio. (c) The test setup used for measuring the blocking force of the PUC. PUCs were sandwiched between the mounting platform and a rigid contact plate. The contact plate was fixed to the force-transducer probe.
Actuators 13 00045 g005
Figure 6. Steps followed for extracting the free deflection of the top layer and blocking force of the PUCs under inflation: (a) shows a frame of an image captured by using the Exilim Ex-F1 camera and the extracted edge data of the PUCs at different stages of inflation. Each frame was taken from a different time stamp. Red pixels represent the midpoints of the PUC. The vertical position of the PUC’s top layer for a given frame is calculated by taking the average of the vertical position of the red pixels. (b) illustrates the steps followed in calculating the mean free deflection/blocking force at a constant pressure. Each data point represents the measured free deflection or blocking force at a given frame. The window represents the set of data points that were used to calculate the mean free deflection or blocking force for a given inflation pressure.
Actuators 13 00045 g006
Figure 7. Static pressure (kPa) versus free deflection (mm) performance of 0.6 mm (blue), 0.9 mm (green), and 1.2 mm (pink) PUC designs. Thin style lines represent the free-deflection data of the individual PUC samples. Solid style lines represent the mean free deflection for each PUC design while dashed bold style lines represent the linear curve-fitted results by using the 4 to 30 kPa pressure range free-deflection data.
Actuators 13 00045 g007
Figure 8. Static pressure (kPa) versus block force (N) performance of 0.9 mm (green) and 1.2 mm (pink) PUC designs. Thin style lines represent individual PUC sample data, solid style lines show the mean blocking force, and dashed style lines represent linear fits for the 0.9 mm and 1.2 mm PUC designs.
Actuators 13 00045 g008
Figure 9. Steps followed in measuring free deflection in frequency test: (a) Recording of the top-layer motion of a 0.9 mm PUC design at 20 kPa pressure and 30 Hz frequency for one second within a seven-second block. (bd) Sorted free-deflection data of the 0.9 mm PUC at 20 kPa pressure for frequencies of 0.5 Hz, 30 Hz, and 100 Hz. Dashed lines indicate the threshold lines used to distinguish data points representing inflated and deflated states.
Actuators 13 00045 g009
Figure 10. Free-deflection results for (a) 0.9 mm and (b) 1.2 mm PUC designs at different inflation–deflation frequencies (Hz) and pressure (10 kPa in blue, 20 kPa in red, and 30 kPa in yellow). Thin style lines represent the free-deflection data of individual PUC samples, solid style lines show the mean free-deflection data, and dashed style lines represent curve-fit results for 0.9 mm (green) and 1.2 mm (pink) PUC design.
Actuators 13 00045 g010
Table 1. Detailed information on the experimental conditions used in the characterization of Pneumatic Unit Cells.
ExperimentMeasuringDesignPressureFrequency
Static-Pressure ConditionFree Deflection0.6 mm0 to 40 kPa-
0.9 mm0 to 40 kPa-
1.2 mm0 to 40 kPa-
Static-Pressure ConditionBlocking Force0.6 mm--
0.9 mm0 to 30 kPa-
1.2 mm0 to 30 kPa-
Frequency ConditionFree Deflection0.6 mm--
0.9 mm10, 20, 30 kPa0.5 to 100 Hz
1.2 mm10, 20, 30 kPa0.5 to 100 Hz
Table 2. Curve fitting results for free deflection under static-pressure conditions by using Equation (1).
DesignPressure Range
(kPa)
Coefficient
a sFD (mm/kPa)
Confidence Bounds
a sFD (mm/kPa)
RMSE
(mm)
0.6 mm4 to 40 kPa0.23(0.21, 0.25)1.96
4 to 30 kPa0.16(0.15, 0.17)0.58
0.9 mm4 to 40 kPa0.13(0.12, 0.14)0.93
4 to 30 kPa0.094(0.09, 0.098)0.21
1.2 mm4 to 40 kPa0.068(0.066, 0.07)0.19
4 to 30 kPa0.065(0.062, 0.067)0.14
Table 3. Curve fitting results for blocking force under static-pressure conditions by using Equation (2).
Top Layer
Thickness
Pressure Range
(kPa)
Coefficient
a sFr ( mm 2 )
Confidence Bounds
a sFr ( mm 2 )
RMSE
(N)
0.9 mm4 to 3033.7(32.04, 35.4)0.08
1.2 mm4 to 3034.4(33.18, 35.54)0.058
Table 4. Results of curve fitting for free deflection under frequency conditions by using Equation (3).
DesignPressure
(kPa)
Frequency
( S 1 )
CoefficientConfidence BoundRMSE
(mm)
a fFD
(mm/kPa)
b fFD × 10 3
(mm × S/kPa)
a fFD
(mm/kPa)
b fFD × 10 3
(mm × S/kPa)
0.9 mm10, 20, 300.5 to 1000.0790.36(0.077, 0.081)(0.3, 0.4)0.22
1.2 mm10, 20, 300.5 to 1000.0520.17(0.05, 0.054)(0.1, 0.2)0.20
Disclaimer/Publisher’s Note: The statements, opinions and data contained in all publications are solely those of the individual author(s) and contributor(s) and not of MDPI and/or the editor(s). MDPI and/or the editor(s) disclaim responsibility for any injury to people or property resulting from any ideas, methods, instructions or products referred to in the content.

