Abstract
Three distinct synchronized switching circuits based on a magnetostrictive actuator are compared in this paper to examine their control mechanisms and circuit characteristics. These circuits include a semi-active shunt circuit, a semi-active current inversion and amplification circuit, and a semi-active automatic current inversion and amplification circuit. Each circuit type employs an additional electronic switch. The synchronized switching method enables the rational control of the circuit current generated by the magnetostrictive actuator to fulfill any desired control strategy. Simulation and experimental results on a 10-bay truss structure reveal that the three circuits can effectively adjust the polarity of the induced current as needed. The three circuits are then compared to thoroughly analyze their unique characteristics and explain their respective advantages and dis-advantages. Using the comparison results, various options available for control circuit design are demonstrated.
1. Introduction
Magnetostrictive actuators comprise magnetostrictive materials with the ability to convert mechanical energy into magnetic energy, and vice versa [1]. Typically, these materials are combined with coils [2,3,4,5] to create actuators; current is induced as a result of changes in the magnetic field, and vice versa. Vibration control technologies employing magnetostrictive actuators have garnered significant interest [6,7,8,9]. There has been extensive research performed on miniaturized magnetostrictive actuators comprising electric circuits driven by their energy conversion capabilities [10,11,12]. However, when a magnetostrictive actuator is directly used for vibration control, its performance is relatively limited. Therefore, an electromechanical system is needed that combines the magnetostrictive actuator with the target structure to achieve superior vibration control performance. Semi-active control methods [13,14,15] are generally regarded as efficient and robust solutions. These methods involve selecting an appropriate passive state using a switch and are typically implemented by combining an actuator with an electric circuit.
We introduced a novel semi-active control method based on a magnetostrictive actuator [16]. This method utilizes a well-designed electric circuit to invert and amplify the current.
In this paper, two novel electric circuits, the shunt circuit (Circuit 1) and the current amplification circuit (Circuit 2), are proposed based on the semi-active control method. Although the original concept of these circuits has been described in our previous works [17,18,19], Circuits 1 and 2 are further developed and proposed as new circuits in this paper. Circuit 1 includes an electronic switch and two rectifier diodes added to the passive shunt circuit to match the polarities of the current and the target current calculated from vibration displacement and velocity. Circuit 2 incorporates an electronic switch and a capacitor added to the passive shunt circuit to invert and amplify the current. The conventional Circuit 3 [16] employs two diodes to automatically match the current polarity. To apply these control circuits to actual structural vibration controls, it is essential to characterize the control circuits and their underlying mechanisms.
The objective of this paper was to conduct a comparative analysis of three types of synchronized switching circuits based on a magnetostrictive actuator, namely a semi-active shunt circuit (Circuit 1), semi-active current inversion and amplification circuit (Circuit 2), and semi-active automatic current inversion and amplification circuit (Circuit 3). The primary objective was to clarify the distinct features of each circuit. The secondary objective was to evaluate the vibration control performance of each circuit through simulations and experimental validations conducted on a 10-bay truss structure. The comparison provided both an in-depth insight into semi-active controls and a criterion for selecting the control design. Meanwhile, comparing the three circuit implementations through experimental validations offered valuable guidance for practical applications.
2. Magnetostrictive Actuator
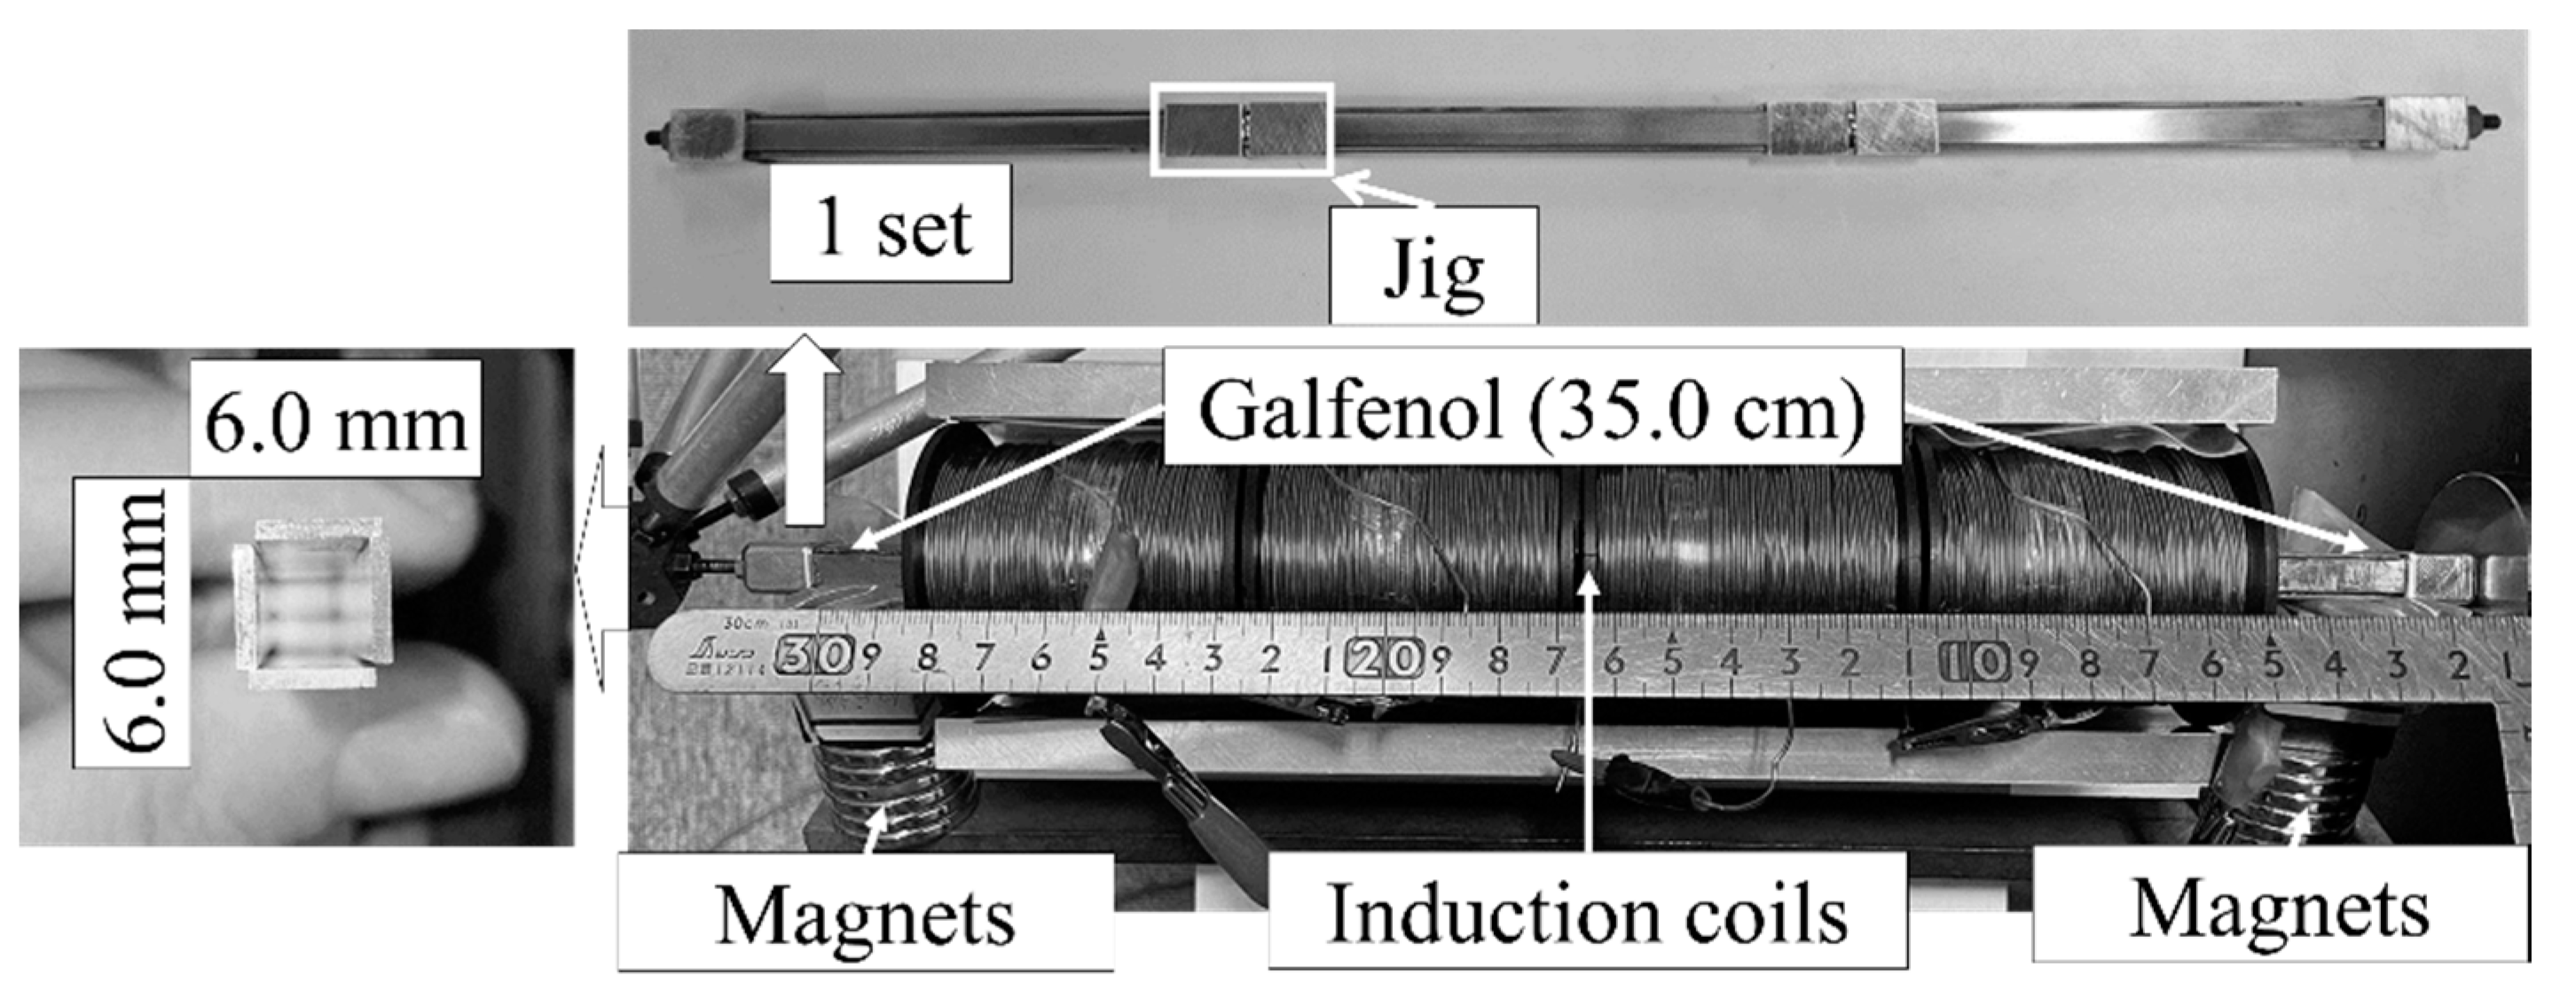
The magnetostrictive actuator used in this study is depicted in Figure 1. The magnetostrictive material used was Galfenol (Fe81.4Ga18.6), processed into sheets with dimensions of 1.0 mm thickness, 6.0 mm width, and 100.0 mm length. The Galfenol sheets were assembled in sets of four, forming a hollow square cylinder that was secured to the jigs. These sets were then joined together using bolts between each jig, resulting in three interconnected sets of hollow square cylinders. The combined length of the Galfenol and jigs was approximately 35.0 cm. This arrangement was chosen to ensure uniform stiffness among the actuator and other structure bars in the experimental environment. A steel beam housing permanent magnets was employed to enhance the external magnetic field, thereby augmenting the Villari-Joule effect. The behavior of the magnetostrictive transducer exhibited non-linearity and was significantly influenced by the initial magnetic field. Therefore, we deliberately selected an initial magnetic field in our experimental environment to ensure that the magnetostrictive materials exhibited the maximum rate of magnetostriction change. Under this selected initial magnetic field, a linear relationship between the magnetic field and the magnetostriction was assumed. Lastly, four cylindrical coils connected in series were used to induce a current as the magnetic field varied.
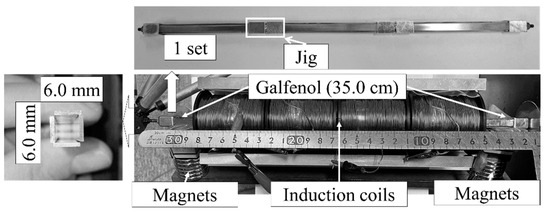
Figure 1.
Magnetostrictive actuator used in this study.
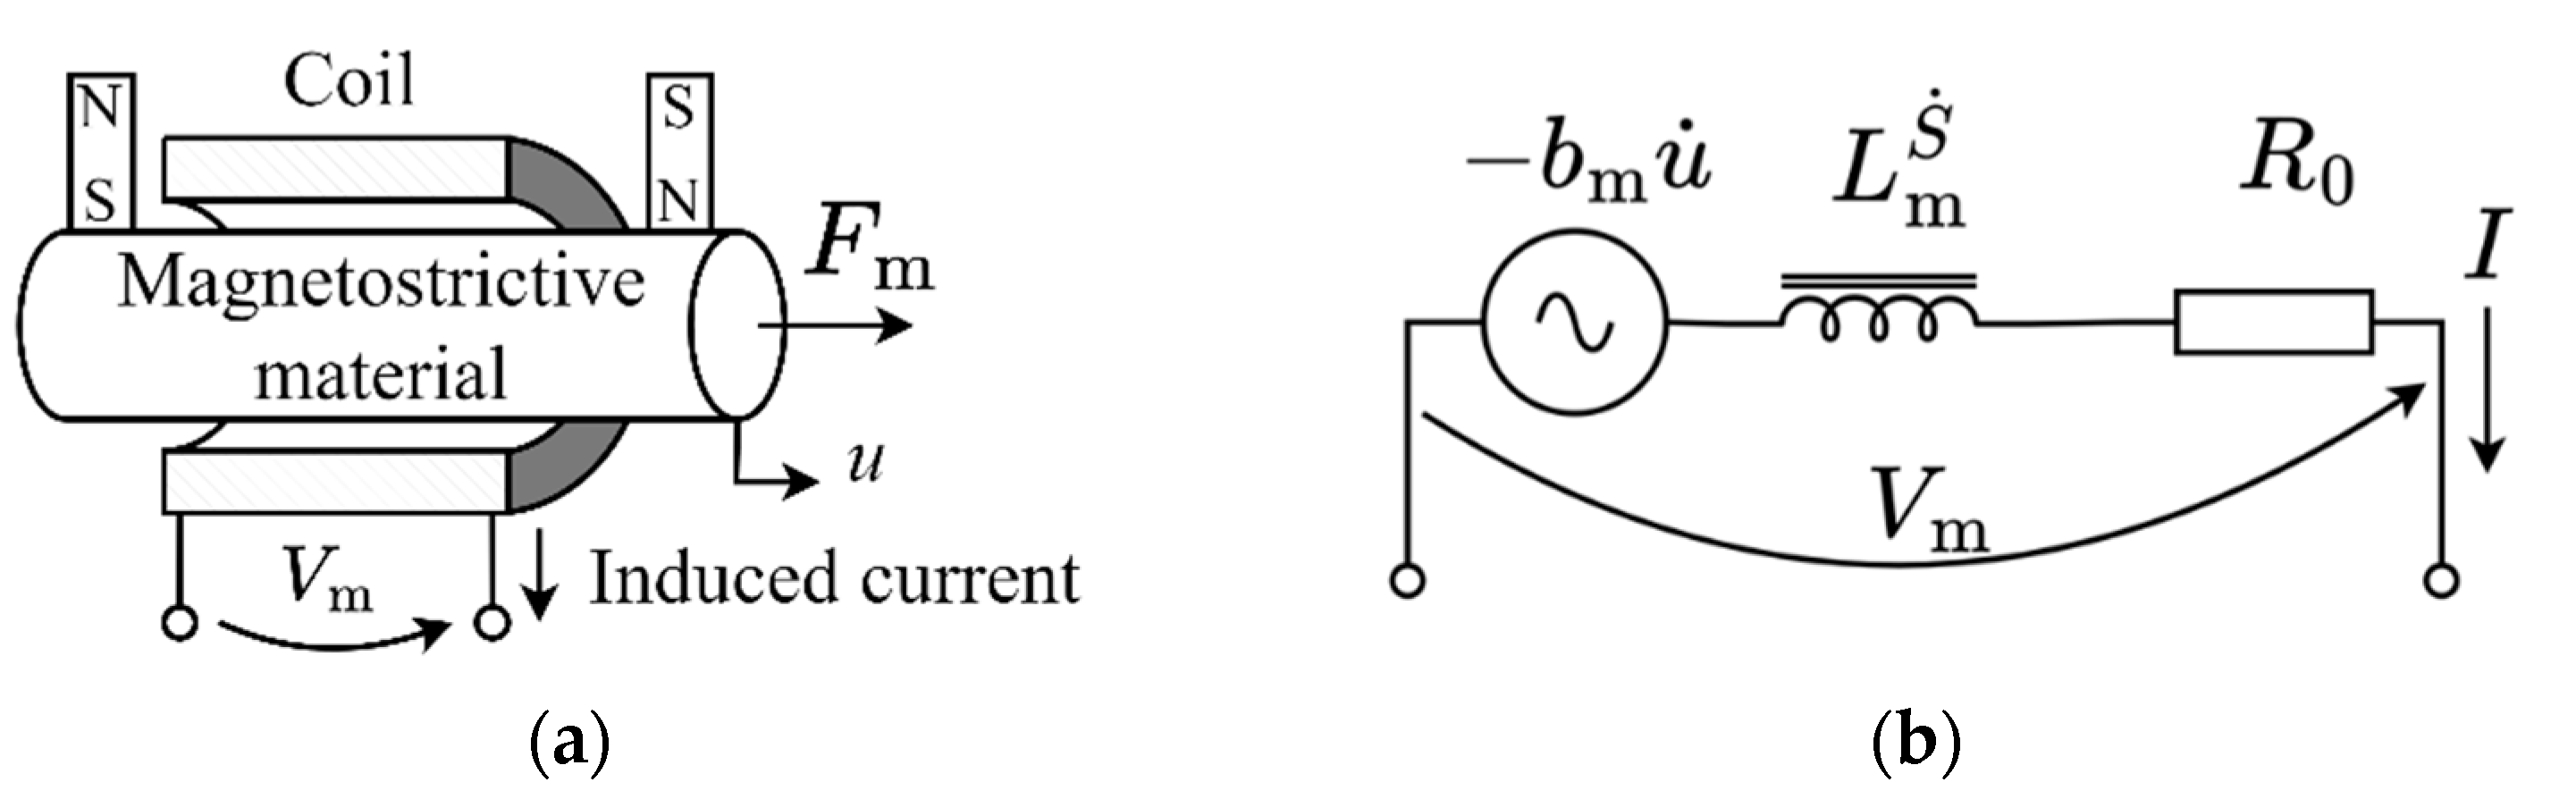
In Figure 2, the schematic of the mechanical and electrical models of the magnetostrictive actuator is presented. These models, comprising magnetostrictive material, coils, and permanent magnets, serve to describe the tensile force . When the magnetostrictive actuator is integrated into the mechanical vibration system, comprises electromagnetic and elastic forces. Considering electrical energy dissipation in the components, an electrical model of a magnetostrictive actuator is illustrated in Figure 2b. As a result, the fundamental equations considered in the electromechanical system can be derived as:
where , , , and are the stiffness at constant current, inductance at constant velocity, internal resistance, and the magnetostriction coefficient of the magnetostrictive actuator, respectively. Equation (1) (detailed in Appendix A) establishes the relationship between the tensile force , deformation u, and current I when the magnetostrictive actuator is placed within a mechanical vibration system. The tensile force is generated in the coil in accordance with Faraday’s law. The tensile force increases as the current I increases. Equation (2) derives the relationship among the circuit elements, which is expressed using Kirchhoff’s circuit law. Each term of Equation (2) represents the voltage of each circuit element. Consequently, the tensile force of the magnetostrictive actuator exhibits a controllable relationship based on changes in the circuit elements.

Figure 2.
Schematic of the magnetostrictive actuator showing (a) the mechanical model, and (b) the electrical model.
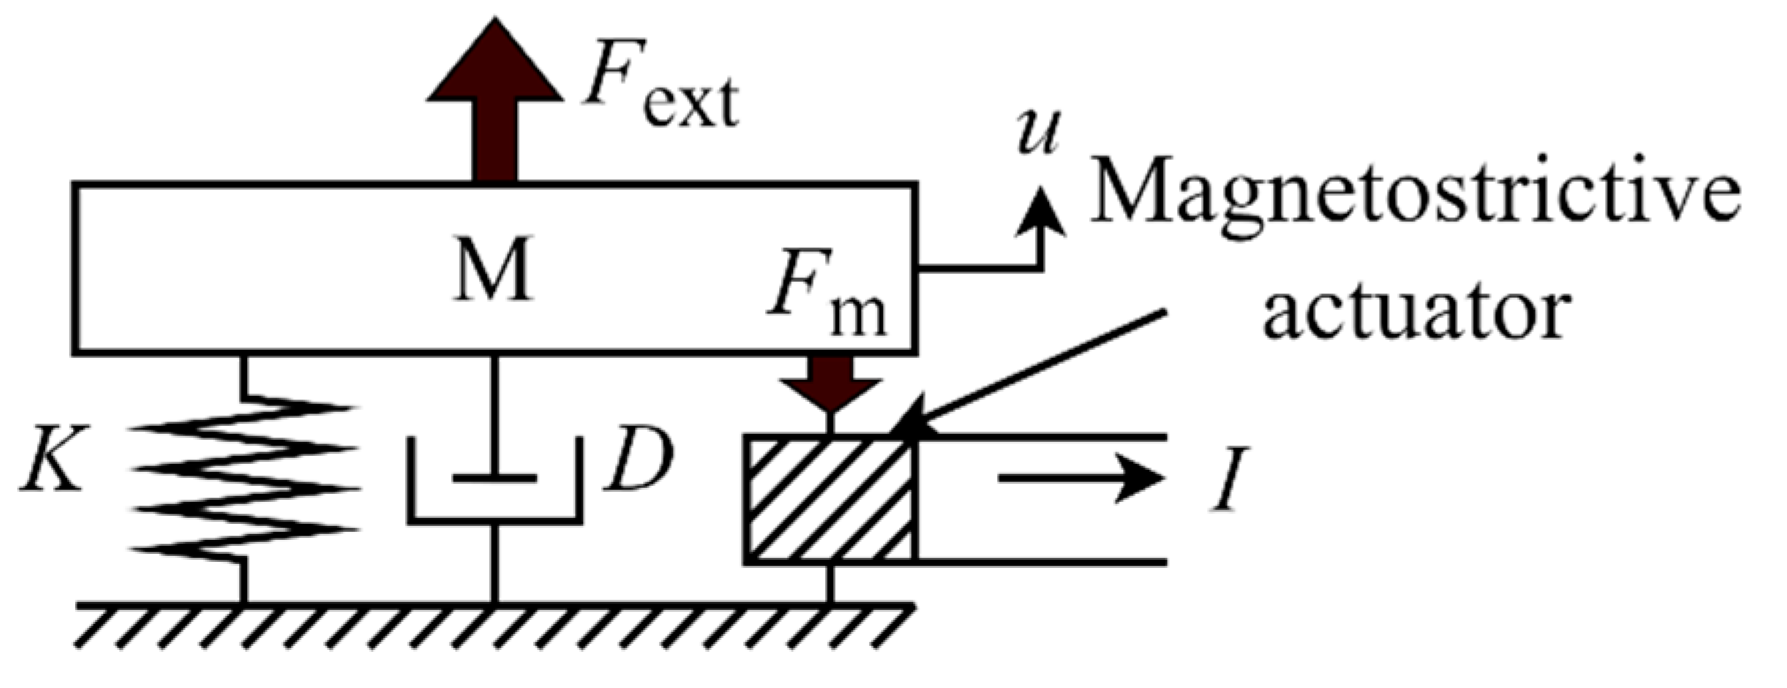
The electromechanical system of a vibrating structure equipped with a magnetostrictive actuator can be modeled as a single-degree-of-freedom spring-mass-damper system, as depicted in Figure 3. The motion equation of this electromechanical model with a magnetostrictive actuator is derived as follows:
where M, D, and K are the mass, damping coefficient, and stiffness of the structure, respectively; and , I, and u are the external force on the structure, the current, and the displacement of the mass, respectively.

Figure 3.
Schematic of the electromechanical model for the magnetostrictive actuator.
If no current flows through the coils of the magnetostrictive actuator, there is no caused by the current; however, an elastic force exists. Because the elastic force is determined by material properties, it cannot be altered easily. Therefore, control methods that induce or amplify as much current as possible are of utmost importance. To accommodate high current levels, two concepts of circuit design (shunt and amplification) are developed. The shunt-type control circuit adjusts the direction of the current induced from the coils, while the amplification-type control circuit alters the polarity of the current I and amplifies it.
3. Synchronized Switching Circuits
3.1. Semi-Active Shunt Circuit (Circuit 1)
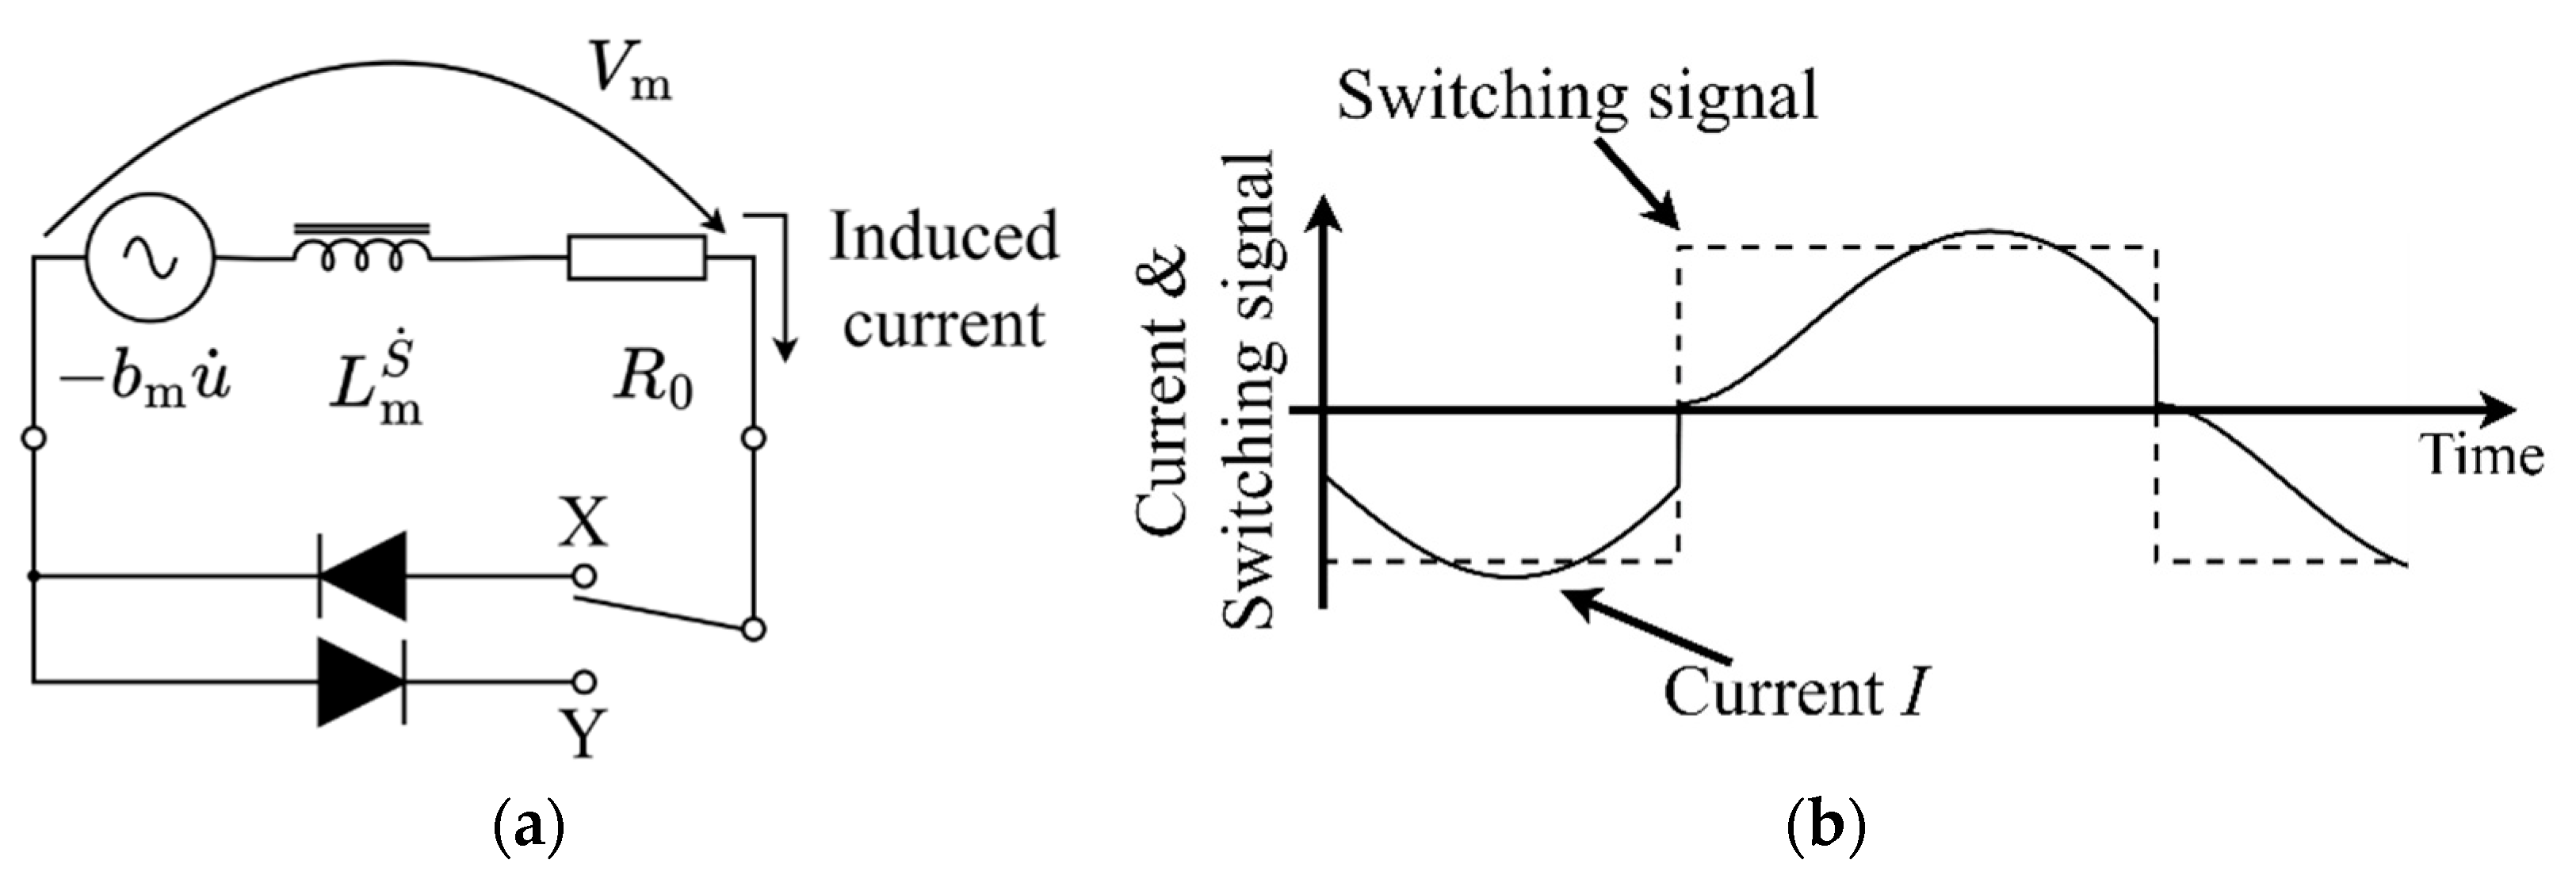
To implement the semi-active control strategy, an electronic switch and two rectifier diodes were added to the passive shunt circuit as shown in Figure 4a. This circuit is hereinafter designated as Circuit 1. The electronic switch selects connection points X or Y depending on the target waveform obtained from any control strategy. This method allows for the modification of the induced current to closely match the target waveform’s polarity relationship.

Figure 4.
(a) Electrical model of the semi-active shunt circuit (Circuit 1) and (b) current status changes according to the switching signal.
Because of the rectifier diode and electronic switch, the polarity of the induced current can be controlled. Circuit 1 produces a new current waveform that partially matches the target waveform. When point X is selected, only positive current flows through the magnetostrictive actuator. Conversely, when point Y is selected, only negative current flows through the magnetostrictive actuator. Regardless of the connection point selected by the electronic switch, the circuit remains shorted. Here, the circuit equation can be expressed as:
The current I is induced from the magnetostrictive actuator and is related to the vibration velocity of the materials . Through the relationship between I and , I and charge Q from the circuit can be combined with the mechanical model.
Figure 4b shows the switching signal and current status using Circuit 1. The current polarity corresponds to the selected point. When the electronic switch changes, the induced current instantly drops to zero and is amplified by the deformation vibration in the selected direction. Because the magnetostrictive actuator is shorted irrespective of the selected connection point, electrical energy is dissipated by the internal resistance . The distinction is that Circuit 1 can adjust the phase of the induced current to match the target waveform, facilitating phase change and current polarity determination. However, the amplitude of the induced current is constrained by the deformation amplitude, resulting in a vibration control performance for Circuit 1 that is not significantly different from that of the passive shunt circuit. As a result, a semi-active current inversion and amplification circuit was proposed to amplify the current.
3.2. Semi-Active Current Inversion and Amplification Circuit (Circuit 2)
In semi-active control methods, the magnetostrictive actuator generates a control input force without an external current source. The control input force’s energy source is the electrical energy temporarily converted from the target structure’s kinetic energy by the magnetostrictive actuator. Semi-active control methods aim to efficiently transform electrical energy back into kinetic energy at the appropriate moment.
Consequently, the semi-active current inversion and amplification circuit (Circuit 2) was proposed to convert kinetic energy into electrical energy, which is then utilized as . Specifically, in Circuit 2, I is regenerated and supplied back to the mechanical system. To fulfill the requirements of Circuit 2, an inductor-capacitor (LC) circuit is incorporated to invert I. When the LC circuit is conducting, the circuit equation can be expressed as:
Here, the current oscillates passively due to the energy transfer between the inductor and capacitor. Because the LC oscillation frequency is significantly higher than the mechanical vibration frequency, the current polarity can be altered by conducting for half of the LC oscillation period.
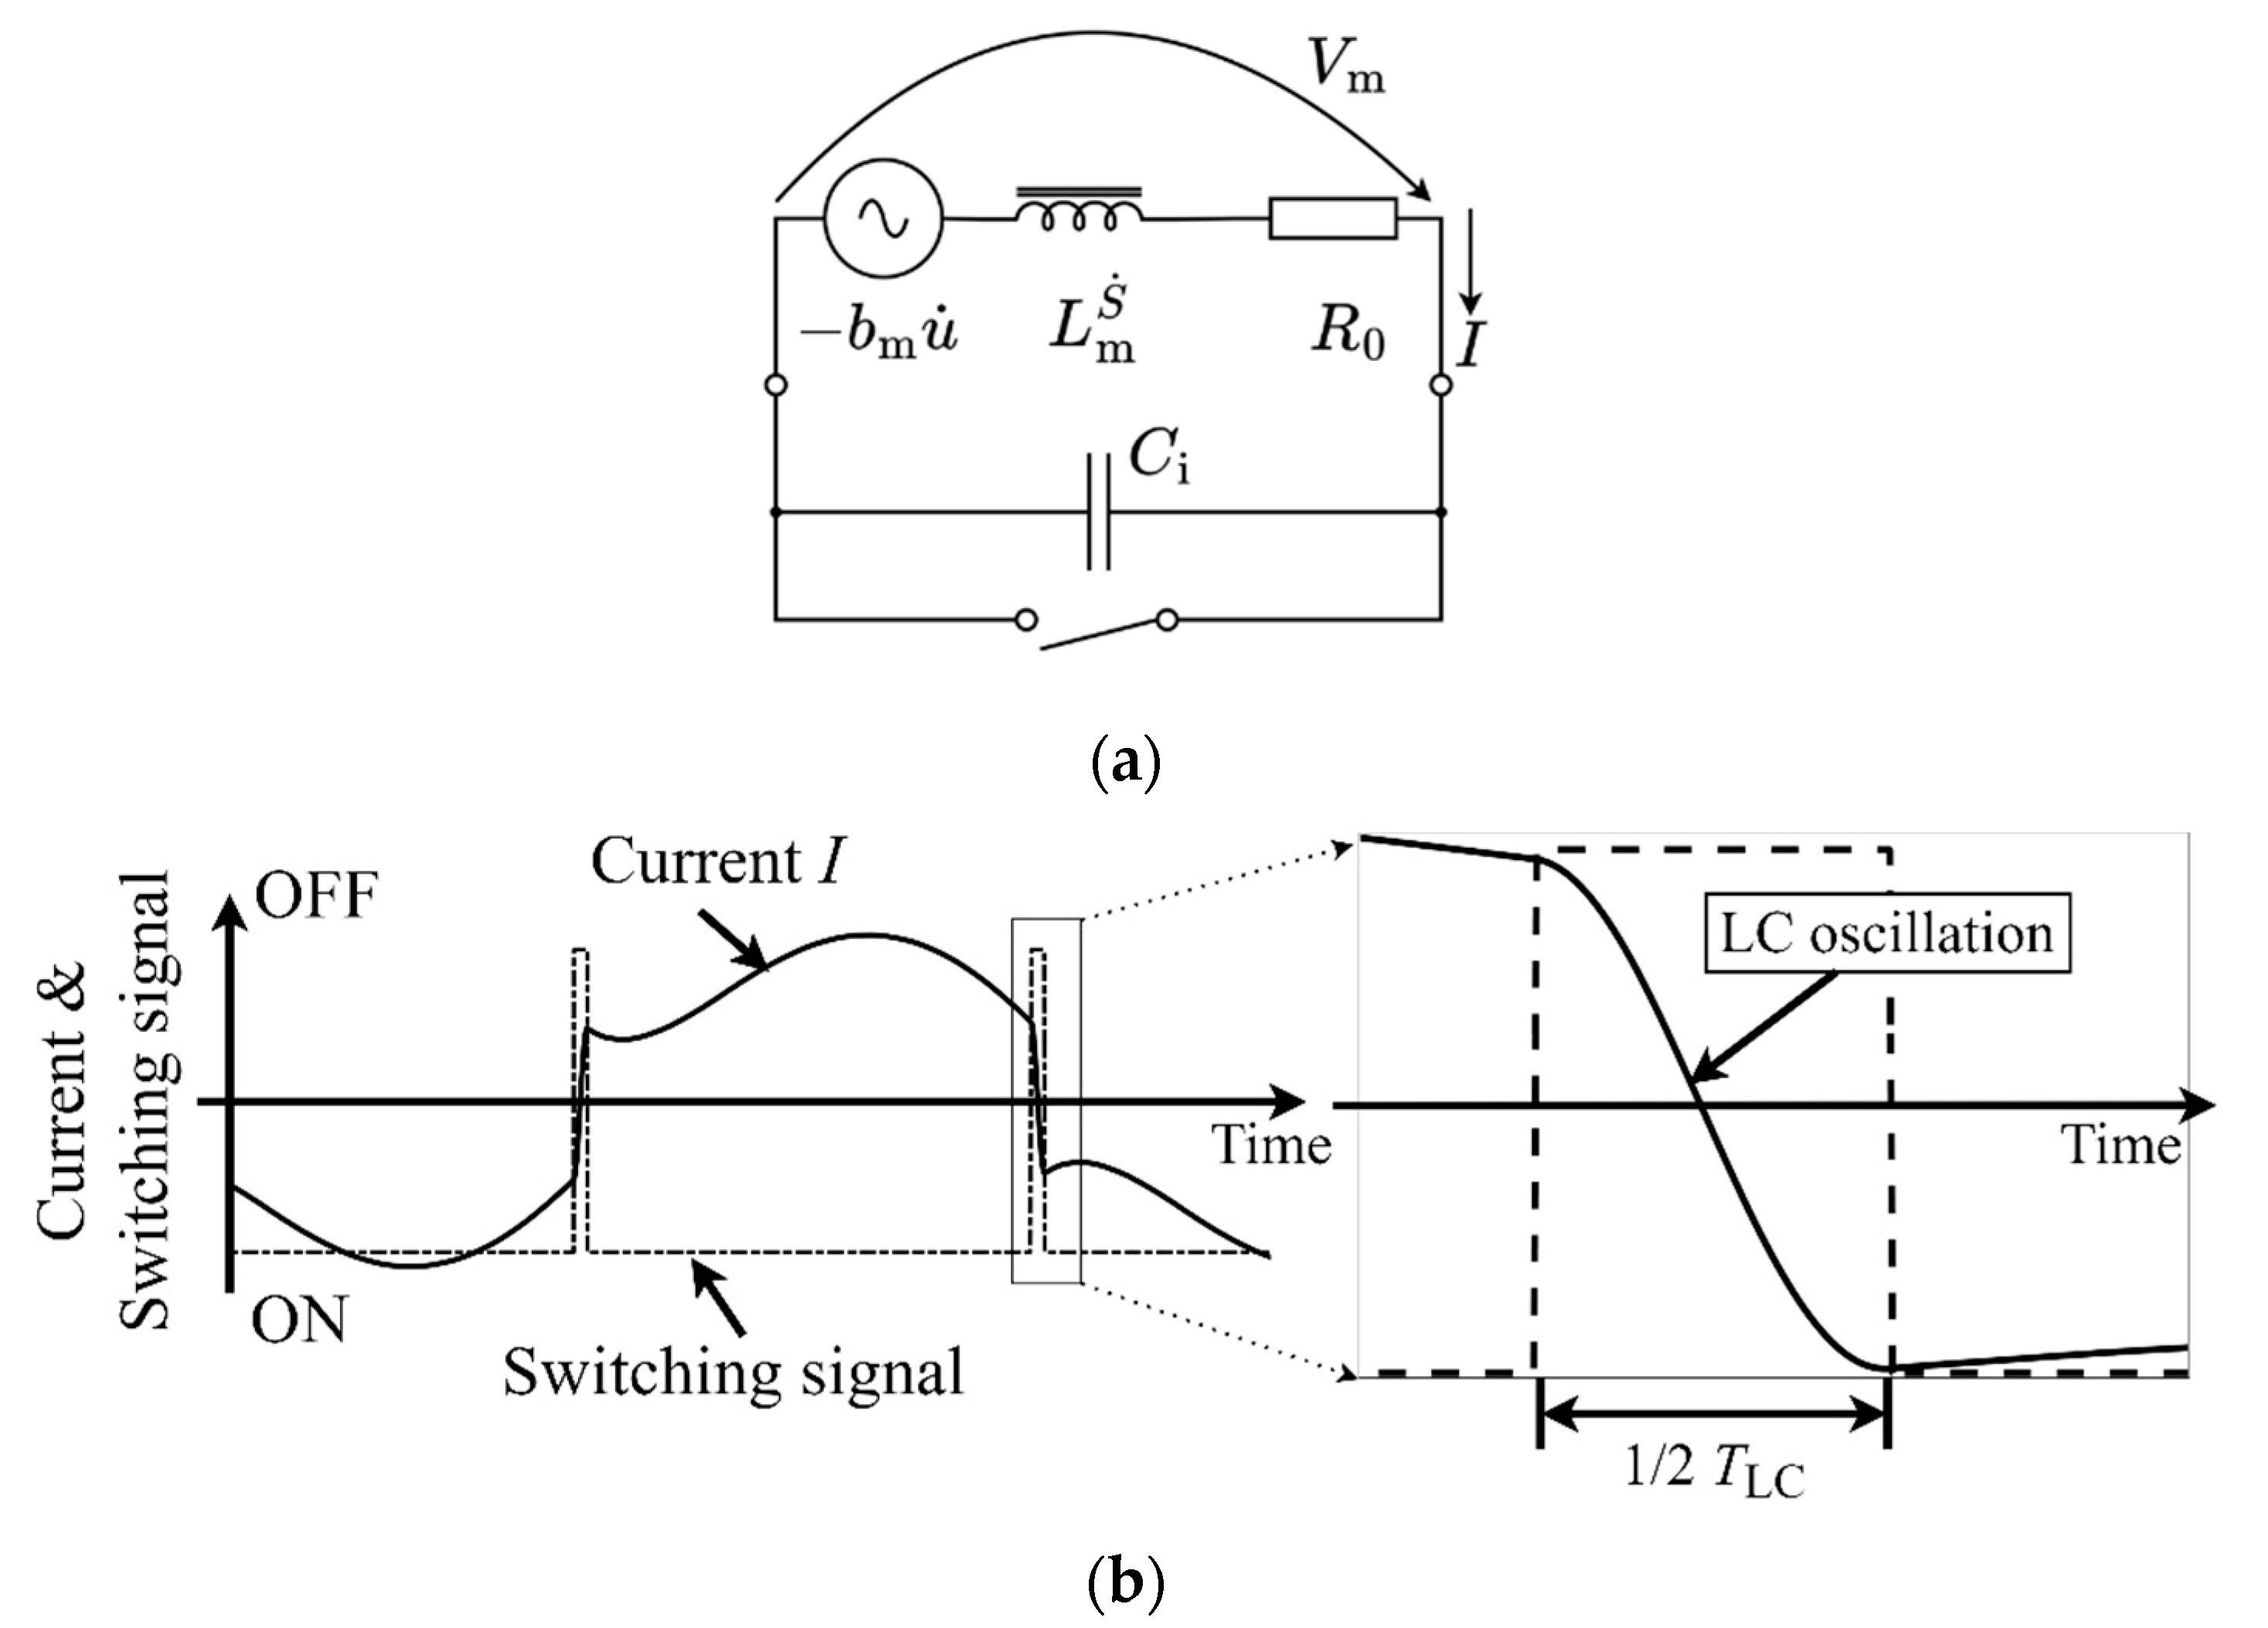
The LC circuit allows for the flexible adjustment of the polarity of I while ensuring that I remains high during polarity changes. This mechanism is referred to as the current inversion process. Figure 5a depicts Circuit 2. Building upon the passive shunt circuit, an inversion capacitor and an electronic switch are integrated. The electronic switch is turned ON or OFF based on a target waveform obtained from any control strategy used to regulate the circuit’s status.
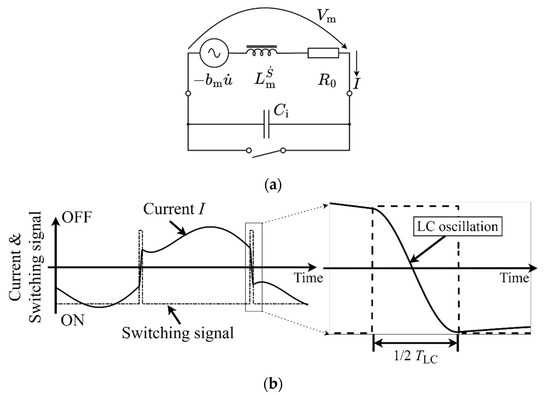
Figure 5.
(a) Electrical model of the semi-active current amplification circuit (Circuit 2) and (b) the switching signal changes the status of the current.
The circuit status can be categorized as one of two cases:
Case (1): When the switch is turned ON, I flows through the wire.
Case (2): When the switch is turned OFF, LC electrical oscillation occurs.
Figure 5b illustrates the changes in the current status and switching signal. When the electronic switch is turned OFF, the magnetostrictive actuator connects to the inversion capacitor , leading to I undergoing LC electrical free oscillation (LC oscillation). The LC oscillation frequency is determined by the capacitance and the inductance . Setting the OFF time-width to half of the LC oscillation period ensures that the absolute value of I remains relatively constant when the LC oscillation concludes, with its polarity inversed.
However, because the LC oscillation period, , is very short and requires high accuracy, any time delay negatively impacts the vibration control performance. Moreover, if the inversion capacitor changes, a new is necessary. Considering the practical application of Circuit 2, an automatic current inversion method was designed, which is detailed in Section 3.3.
3.3. Semi-Active Automatic Current Inversion and Amplification Circuit (Circuit 3)
Figure 6a presents a semi-active automatic current inversion and amplification circuit [16] (Circuit 3). Circuit 3 works similarly to Circuit 2, using the LC oscillation to inverse the current polarity. Additionally, Circuit 3 incorporates two diodes, similar to Circuit 1. If the direction of current I opposes the diodes’ direction, current inversion occurs; otherwise, current inversion ceases. Consequently, Circuit 3 automatically terminates the current inversion process without relying on to turn OFF the switch. The circuit status can be classified into one of four cases:
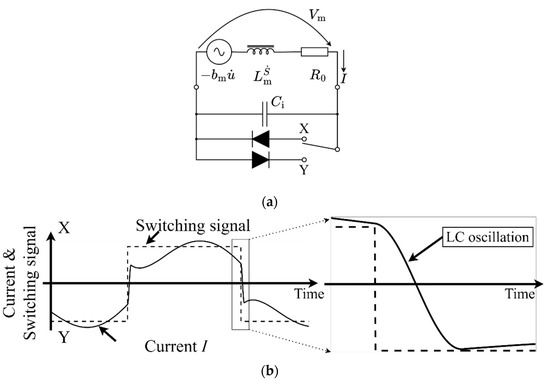
Figure 6.
(a) Electrical model of the semi-active current amplification circuit with the automatic current inversion (Circuit 3) and (b) the current status changes according to the switching signal.
Case (1): When point X is selected and the induced voltage is positive, the diode conducts. A positive I flows through the diode.
Case (2): When point Y is selected and is negative, the diode conducts. A negative I flows through the diode.
Case (3): When point X is selected and is negative, the diode does not conduct. I flows through the inversion capacitor , inversing the current I from negative to positive instantaneously.
Case (4): If point Y is selected and is positive, the diode does not conduct. I flows through , inversing I from positive to negative instantaneously.
As the diodes dictate the direction of current flow, it is feasible to determine whether I is inversed. The current flow direction is also governed by the diodes. Therefore, when using Circuit 3, it is only necessary to detect the optimal timing for current inversion and select the connection points based on the control strategy. Figure 6b displays the switching signal and circuit status. With Circuit 3, the control strategy merely needs to select the appropriate connection point at the right time, and the current inversion terminates automatically.
Because the current status of Circuit 3 is identical to that of Circuit 2, both circuits are expected to exhibit the same current amplification and vibration control performance. By selecting a connection point instead of turning the electronic switch ON or OFF, current inversion can be achieved without determining the LC oscillation period. This approach is therefore more versatile than the ON–OFF control style.
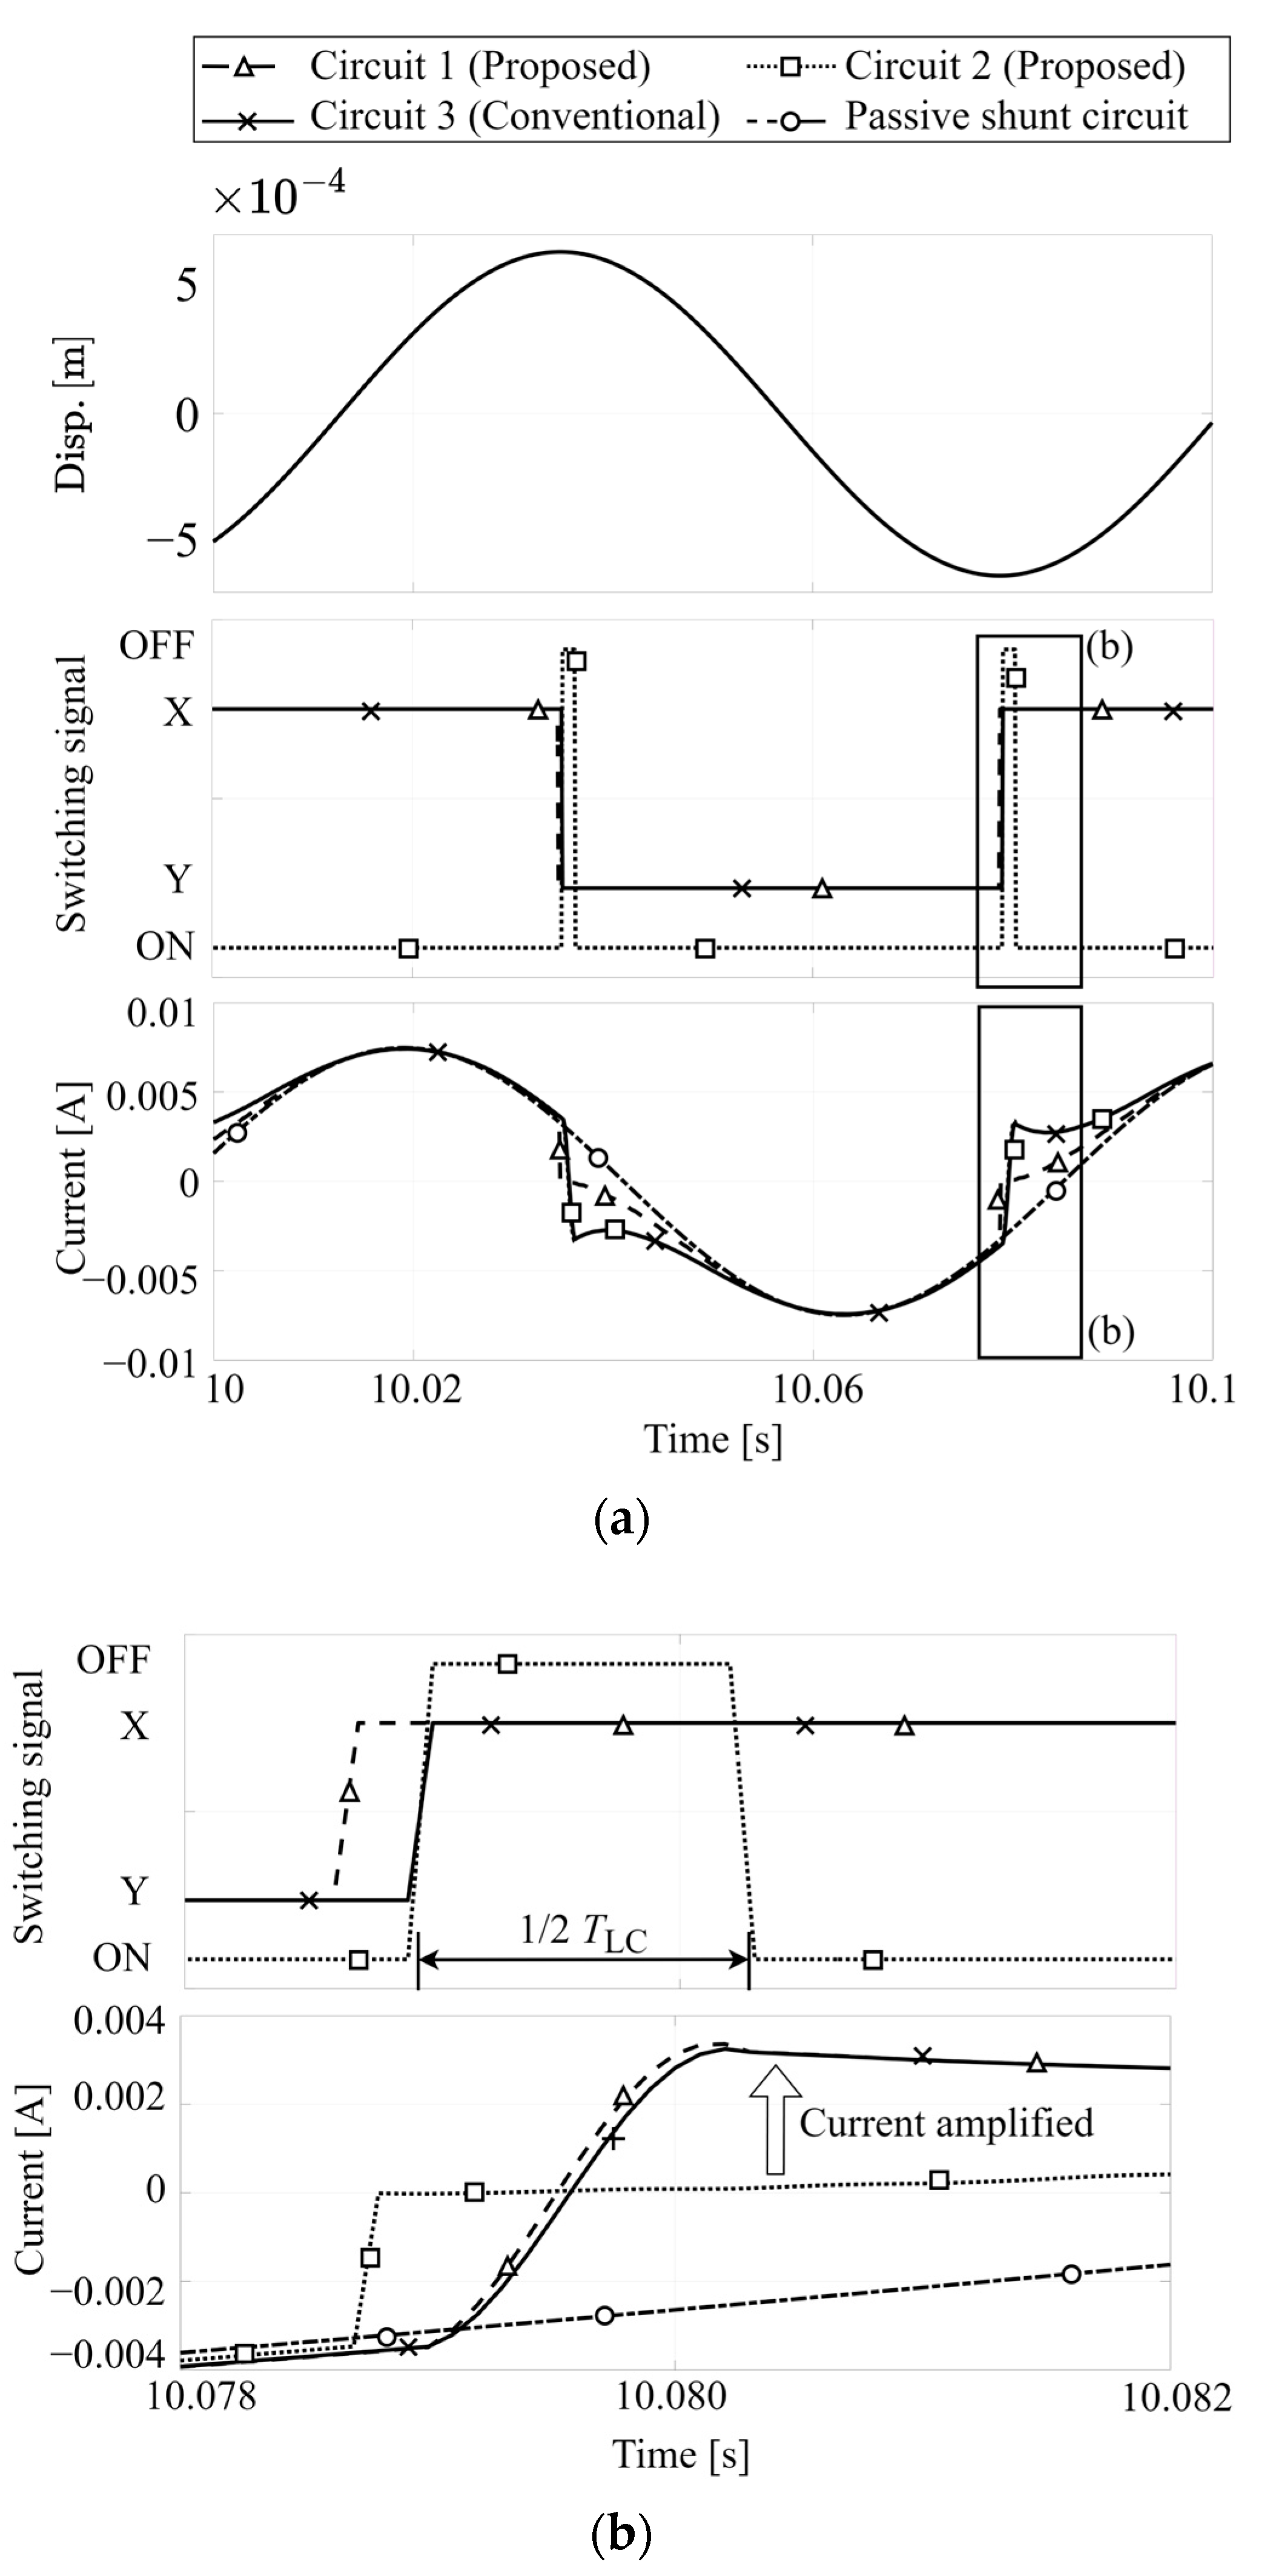
To compare the characteristics of each circuit, the current changes can be summarized using a uniform control strategy. Here, the switching timing is essentially the same. Figure 7a displays the time history of displacement, switching signal, and I for each circuit. Circuit 2 requires a very short time to turn OFF the electronic switch. The switching time intervals for Circuits 1 and 3 are basically the same and equal to half of the period of mechanical vibration. Figure 7b illustrates the partial enlargements when current inversion occurs. Because Circuit 1 only consists of a shunt circuit, the induced current is cut to zero when the electronic switch changes between connection points. Circuit 2 needs to calculate as precisely as possible; however, this period is considerably less than that of the mechanical vibration, leading to an increase in observation and calculation requirements. By comparing the circuit currents of Circuits 1, 2, and 3, we confirm that Circuits 2 and 3 maintain I at a high level due to the LC oscillation.
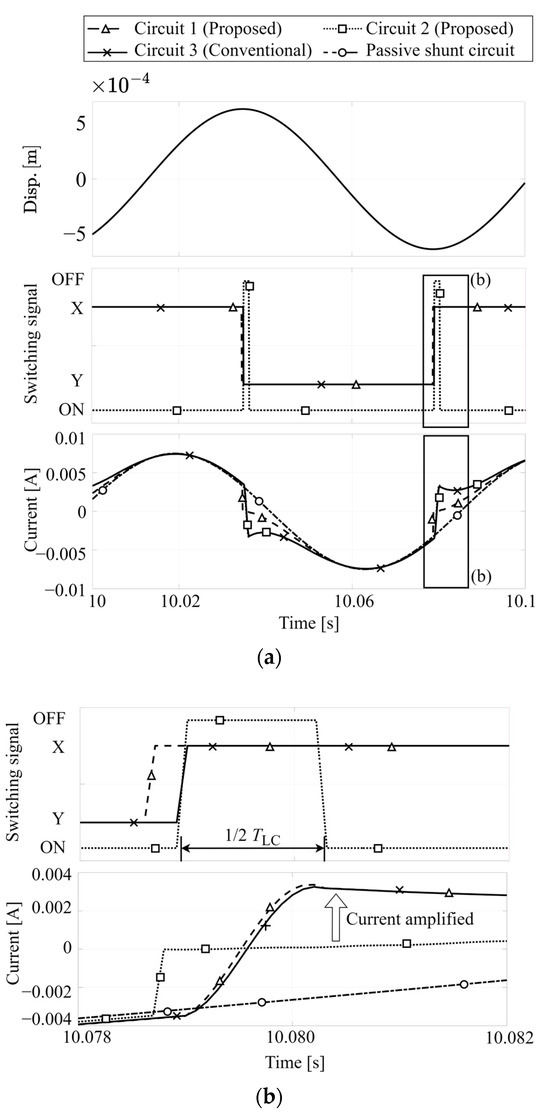
Figure 7.
(a) Time histories of single-mode vibration control. From the top: displacement, switching signal (X, Y for Circuits 1 and 3; ON, OFF for Circuit 2), and current I. (b) Partial enlargements when the current inversion occurs.
4. Numerical Simulations
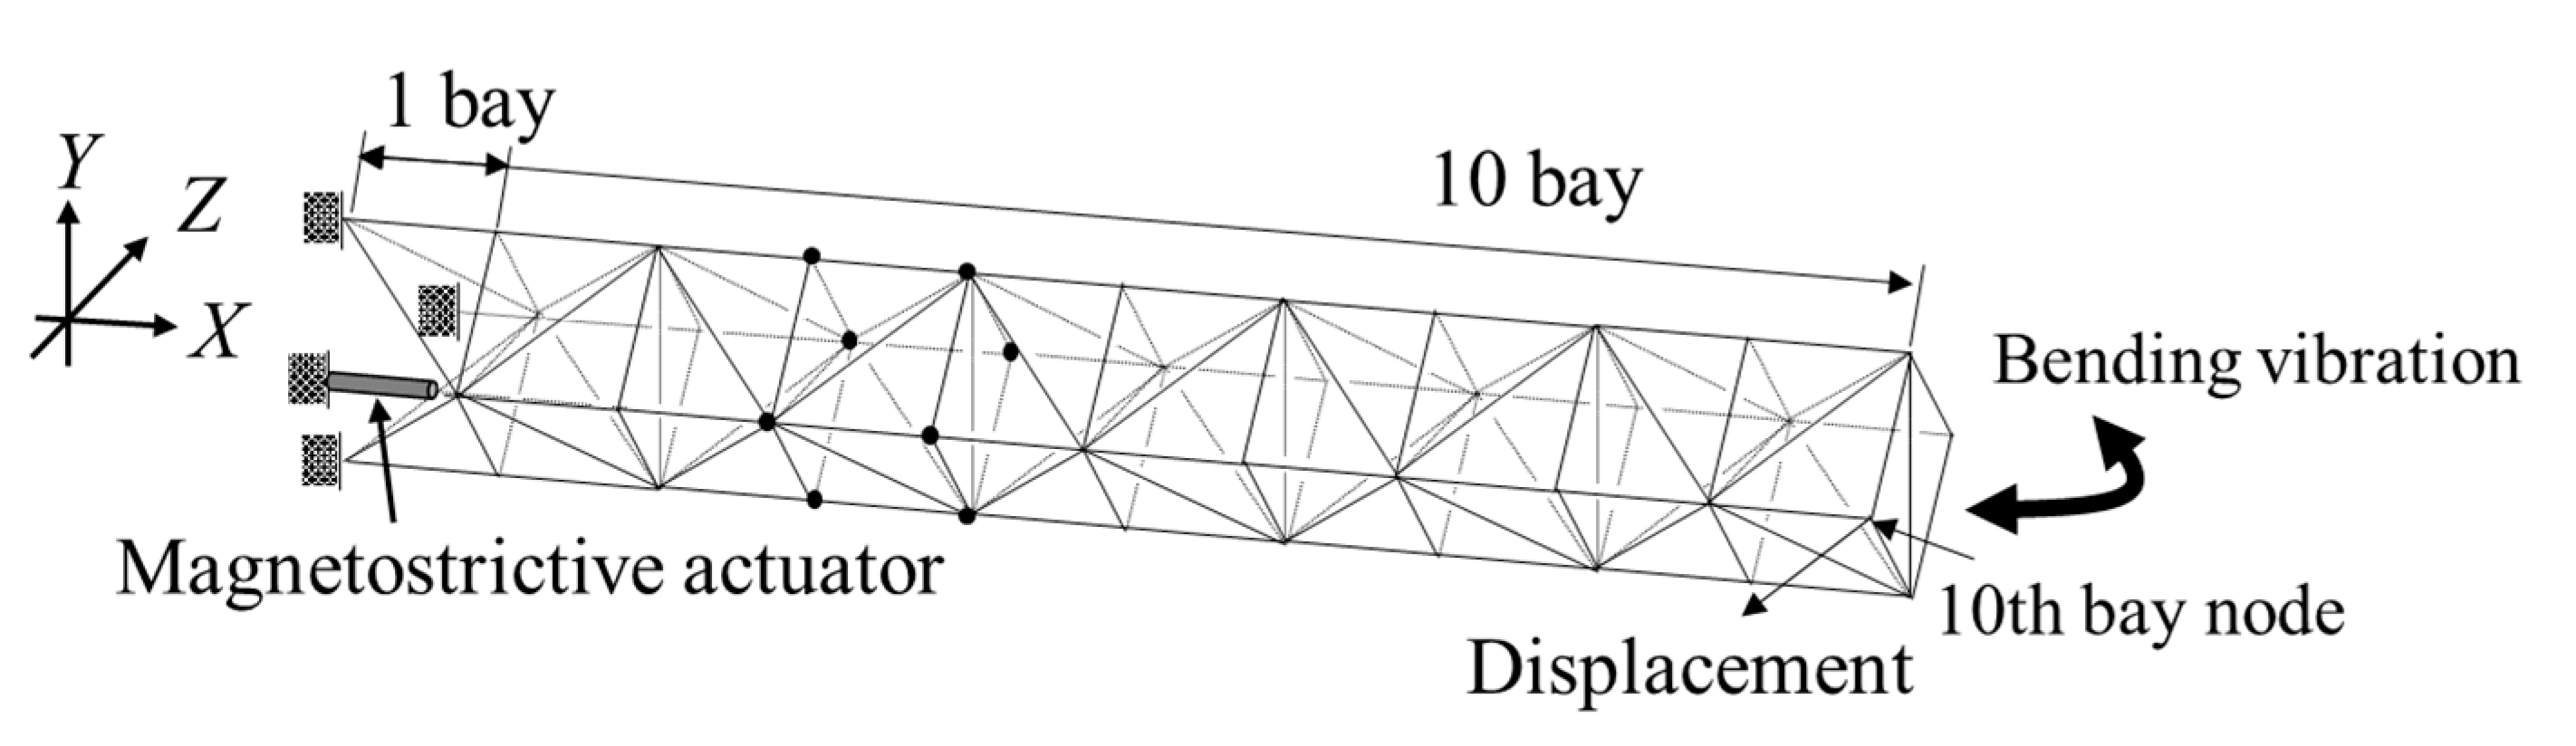
The vibration control performance was evaluated by analyzing a cantilevered 10-bay truss structure, showcasing the vibration control performance of each synchronized switching circuit. The truss structure, consisting of rods and nodes, is depicted in Figure 8. The numerical simulation parameters are summarized in Table 1, with each parameter measured based on the experimental condition.
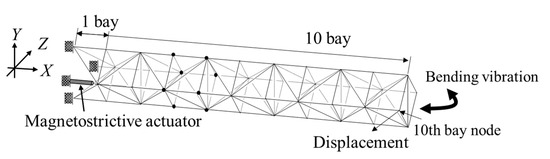
Figure 8.
Truss structure with the magnetostrictive actuator.

Table 1.
Numerical simulation parameters.
The same target control input force, , based on the state of the mechanical system, was provided. was obtained using the mode displacement and velocity of each vibration mode as follows:
where K is the feedback gain, and z is the state vector contributed by each modal displacement η and velocity . The vibration control input force and performance increase with increases in the control input force .
However, our goal was to semi-actively control the vibration by designing three electric circuits instead of actively supplying the control input force . Three electric circuits can emulate by intelligently designing the switching signal. Specifically, Circuits 1, 2, and 3 can align the polarity of I and . Moreover, Circuits 2 and 3 can amplify I by regenerating it. The switching strategies of the semi-active control circuits are summarized in Table 2. Once is obtained, the electronic switches in the semi-active control circuits can be managed. The equation of state for the semi-active control methods is detailed in Appendix B.
Table 2.
Switching strategies of semi-active control circuits.
The system experienced excitation, causing it to vibrate in the first natural bending vibration mode (11.7 Hz) along the Z-axis. To assess the vibration control performance of different circuits on the truss structure, a 20.0 s excitation was applied. The control circuit was opened when no control was applied (non-controlled), and a magnetostrictive actuator was connected to each circuit when vibration control was implemented.
An index, , is introduced to evaluate the vibration control performance. This value represents the root mean square (RMS) of all truss node displacements. The RMS of displacement used for assessment is given by the following equation:
where , , and . is the displacement vector of the i-th node on the X-Y-Z axis. Table 2 displays using each control circuit. Circuit 1 demonstrated superior vibration control performance compared to the passive shunt circuit, as it matched the polarity of I to . Additionally, when the polarity of I and were aligned, a higher current led to improved vibration control performance.
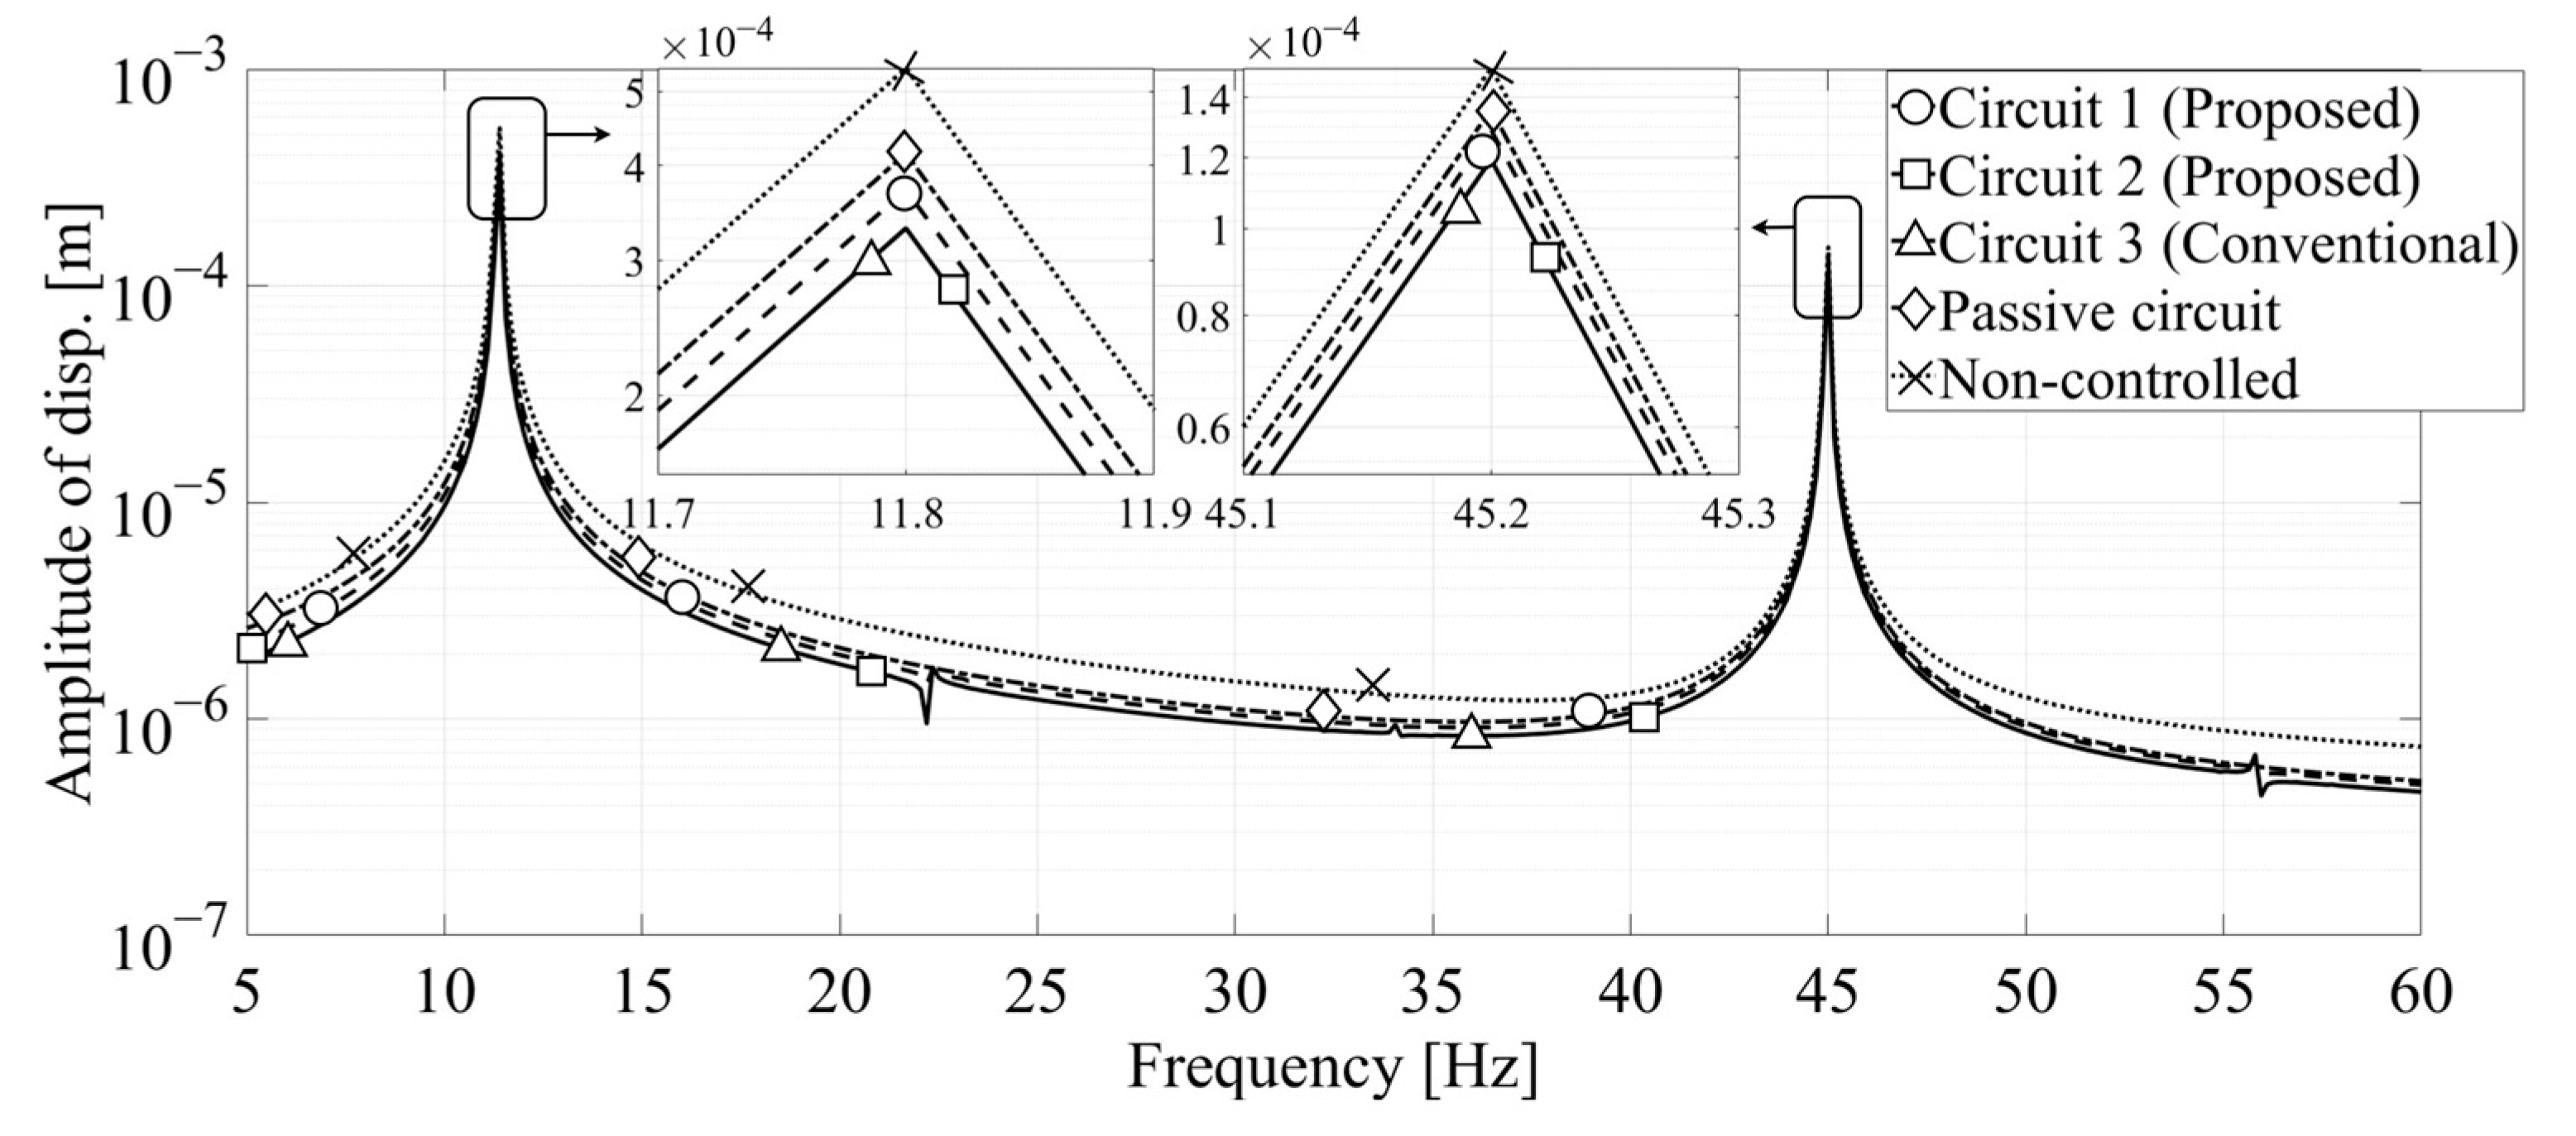
To assess the vibration control performance under higher vibration modes or mixed modes, the truss structure was excited under the second natural bending vibration mode and a combination of the first and second natural vibration modes along the Z-axis. The frequency of the second natural vibration mode for the truss structure was 45.2 Hz. The frequency response curves of the truss structure employing each method are illustrated in Figure 9. Because Circuits 2 and 3 only differ in implementation methods, there was no difference in vibration control performance. The values for each circuit are summarized in Table 3. Under these conditions, the vibration control performances exhibited by Circuits 2 and 3 were better than those for the passive shunt circuit and Circuit 1.
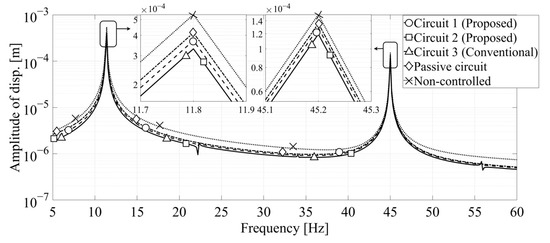
Figure 9.
Simulated frequency response curves of the truss structure with various control circuits.
Table 3.
Vibration control performance of each control circuit. The unit is [m].
5. Experimental Validations and Results
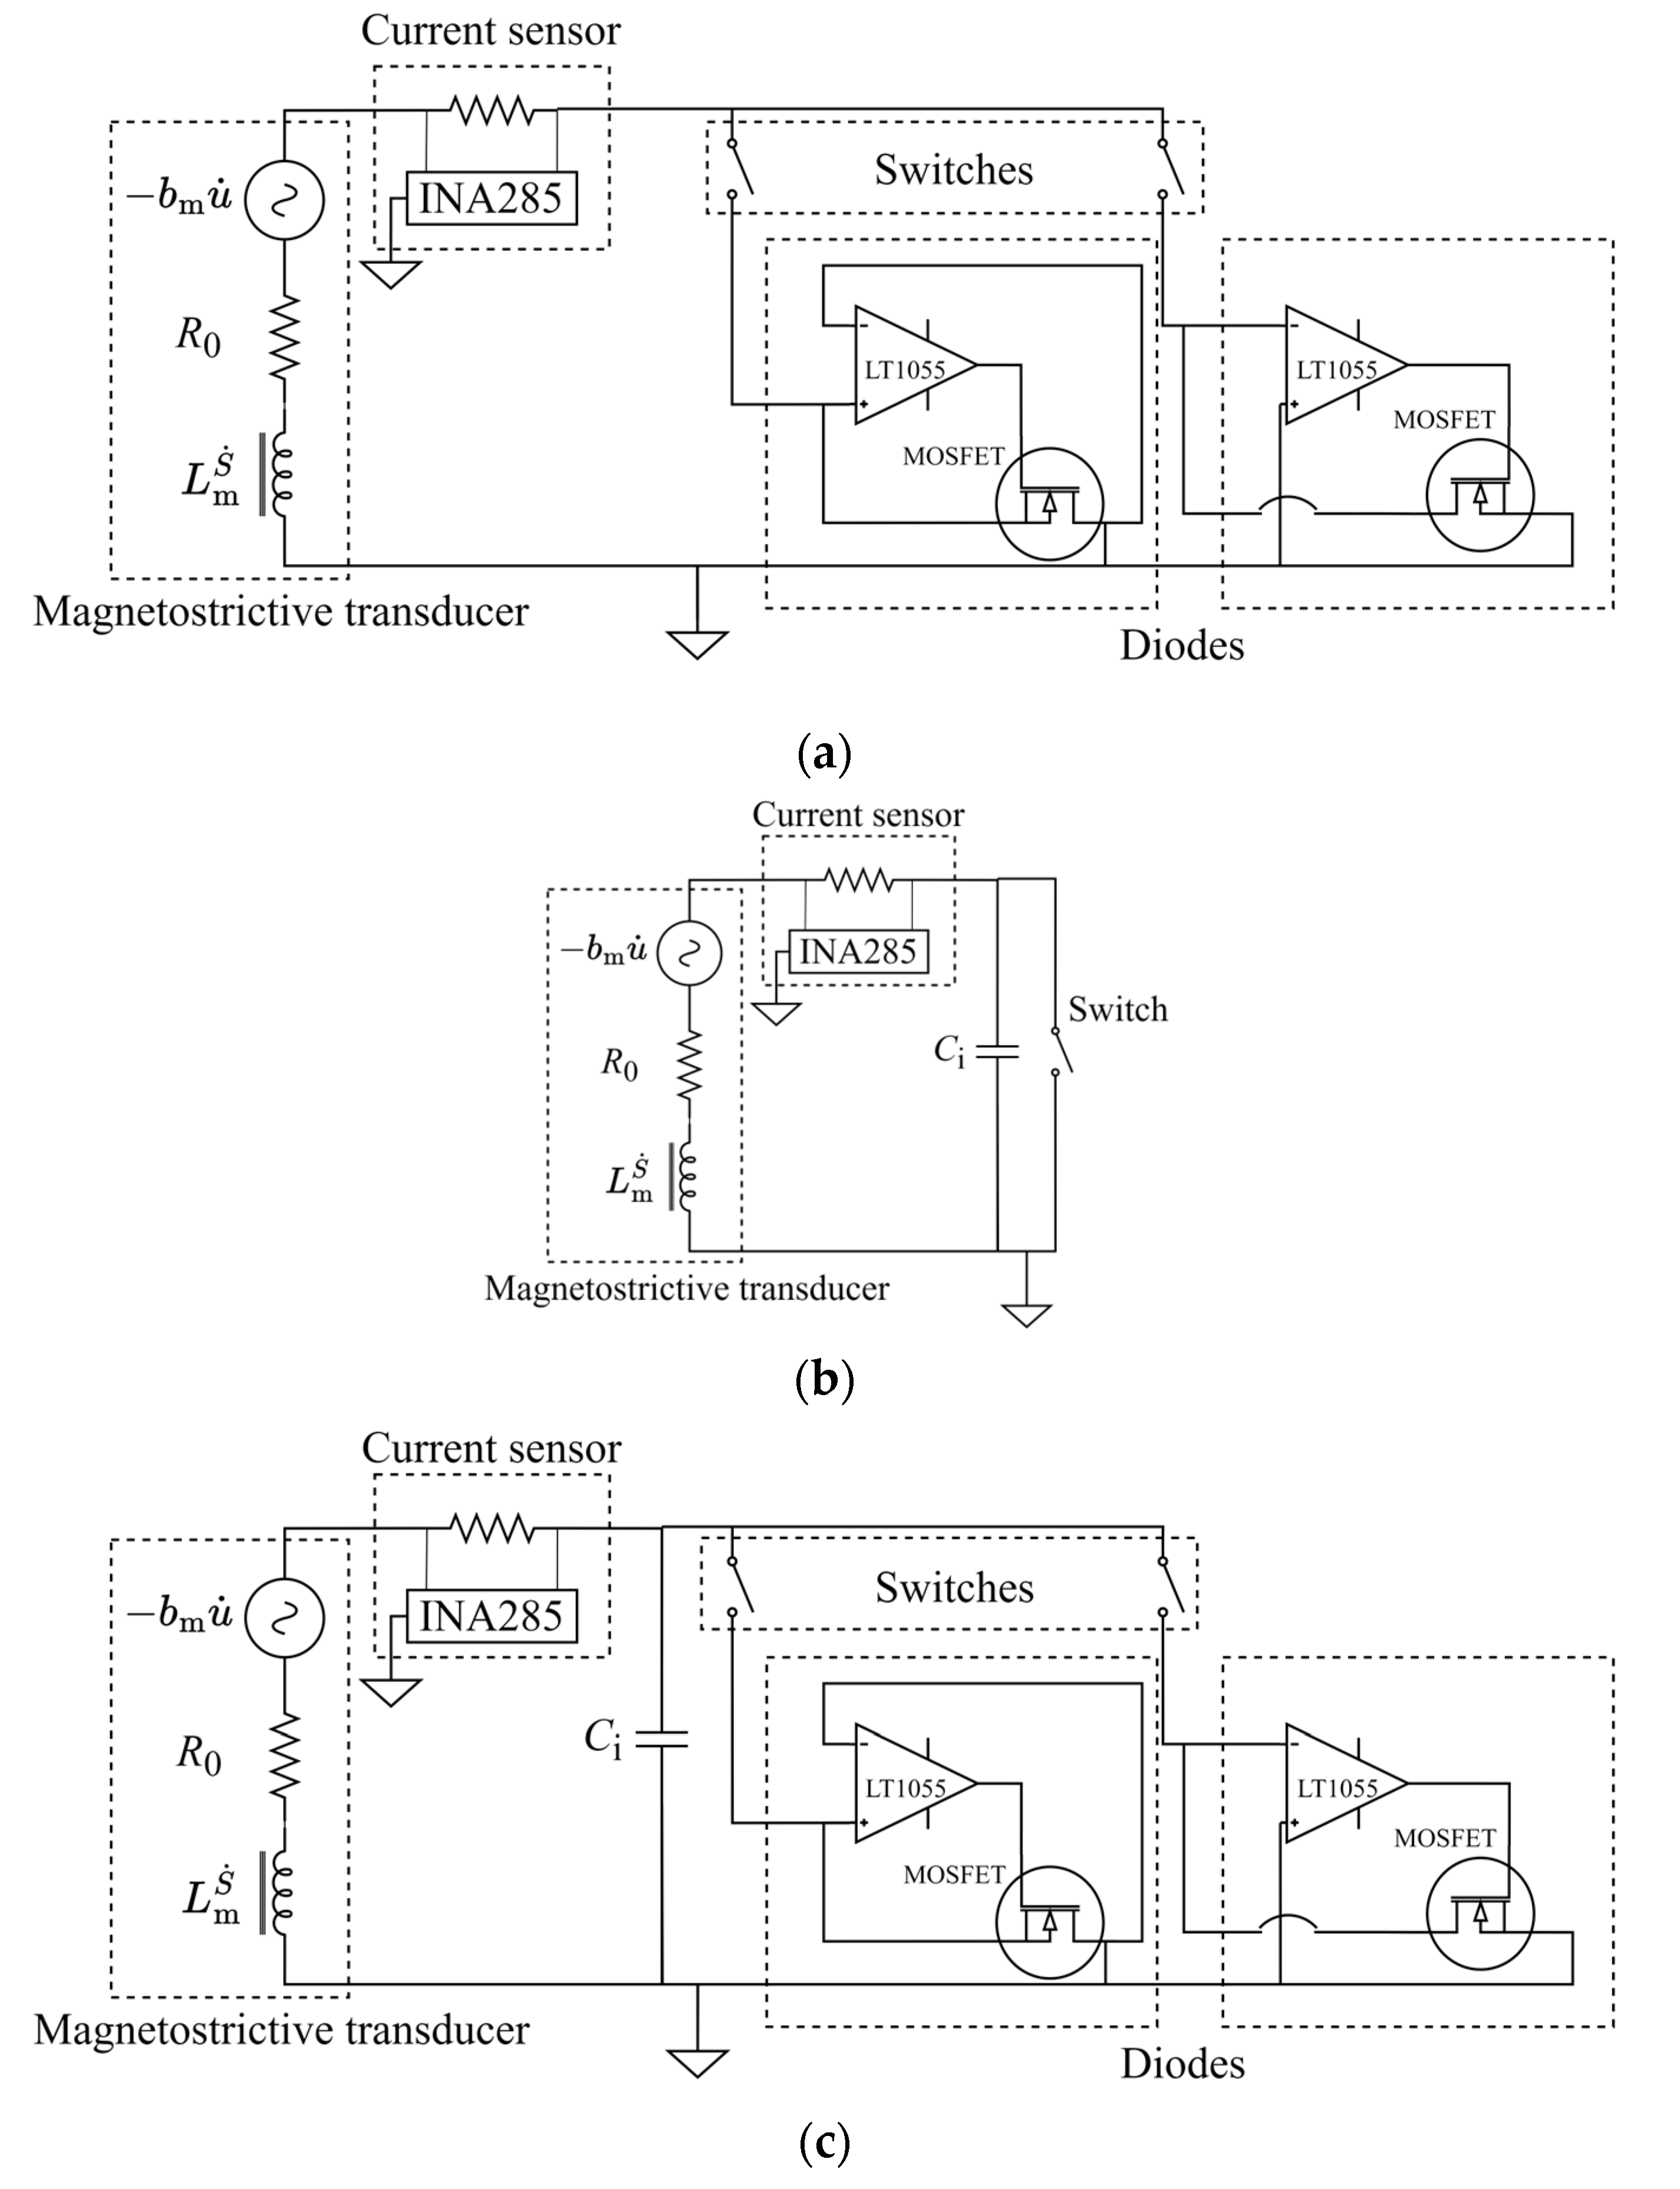
To validate the vibration control performance of each circuit, the cantilevered 10-bay truss structure, which comprised aluminum bars and iron nodes, was employed as the target flexible structure. The experimental setup and the three semi-active control circuits are depicted in Figure 10. Additionally, circuit diagrams of each semi-active control circuit are depicted in Figure 11. The truss structure was 3.75 m long and weighed 13.2 kg. An aluminum bar located in the first bay of the truss structure was replaced by the magnetostrictive actuator described in Section 2. Each circuit was connected to the magnetostrictive actuator to control the structural vibration. In the context of the experimental setting, it is important to note that the induced voltage generated by the actuator was less than the forward voltage threshold of a physical diode. Consequently, to instantiate an ideal diode, an active circuit including an operation amplifier LT1055 (Linear Technology, Milpitas, CA, USA) was employed. Additionally, each electronic switch was actuated by a control signal voltage, distinct from the input into the control circuit. For the measurement of I, a current sensor INA285 (Texas Instruments, Dallas, TX, USA) was employed. The vibration displacement of the 10th bay node along the Z-axis was measured using a laser displacement sensor. Furthermore, Equation (7) was reformulated due to an insufficient number of laser displacement sensors for the measurement of displacements across all nodes, i.e., (tip displacement of truss). Given that each experimental process may introduce errors in the measured displacement, a new index, the vibration control rate γ, was introduced to evaluate the vibration control performance of each circuit.
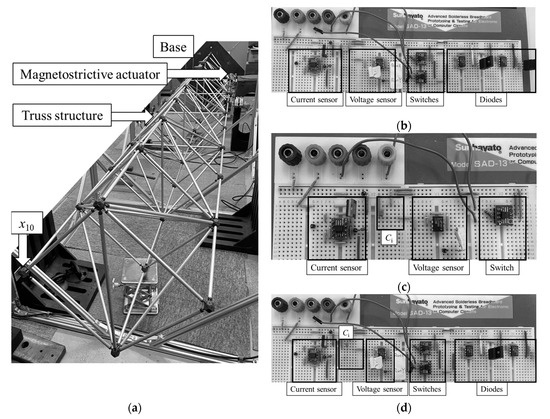
Figure 10.
(a) Experimental setup and three semi-active control circuits: (b) Circuit 1, (c) Circuit 2, and (d) Circuit 3.
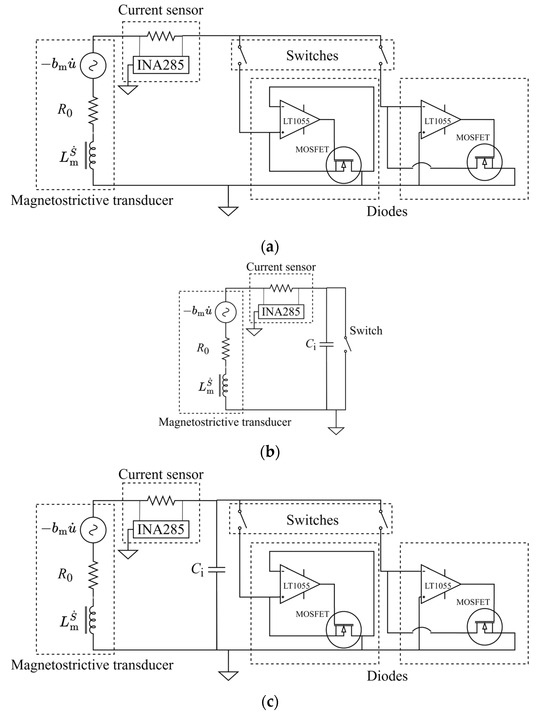
Figure 11.
Circuit diagrams of (a) Circuit 1, (b) Circuit 2, and (c) Circuit 3.
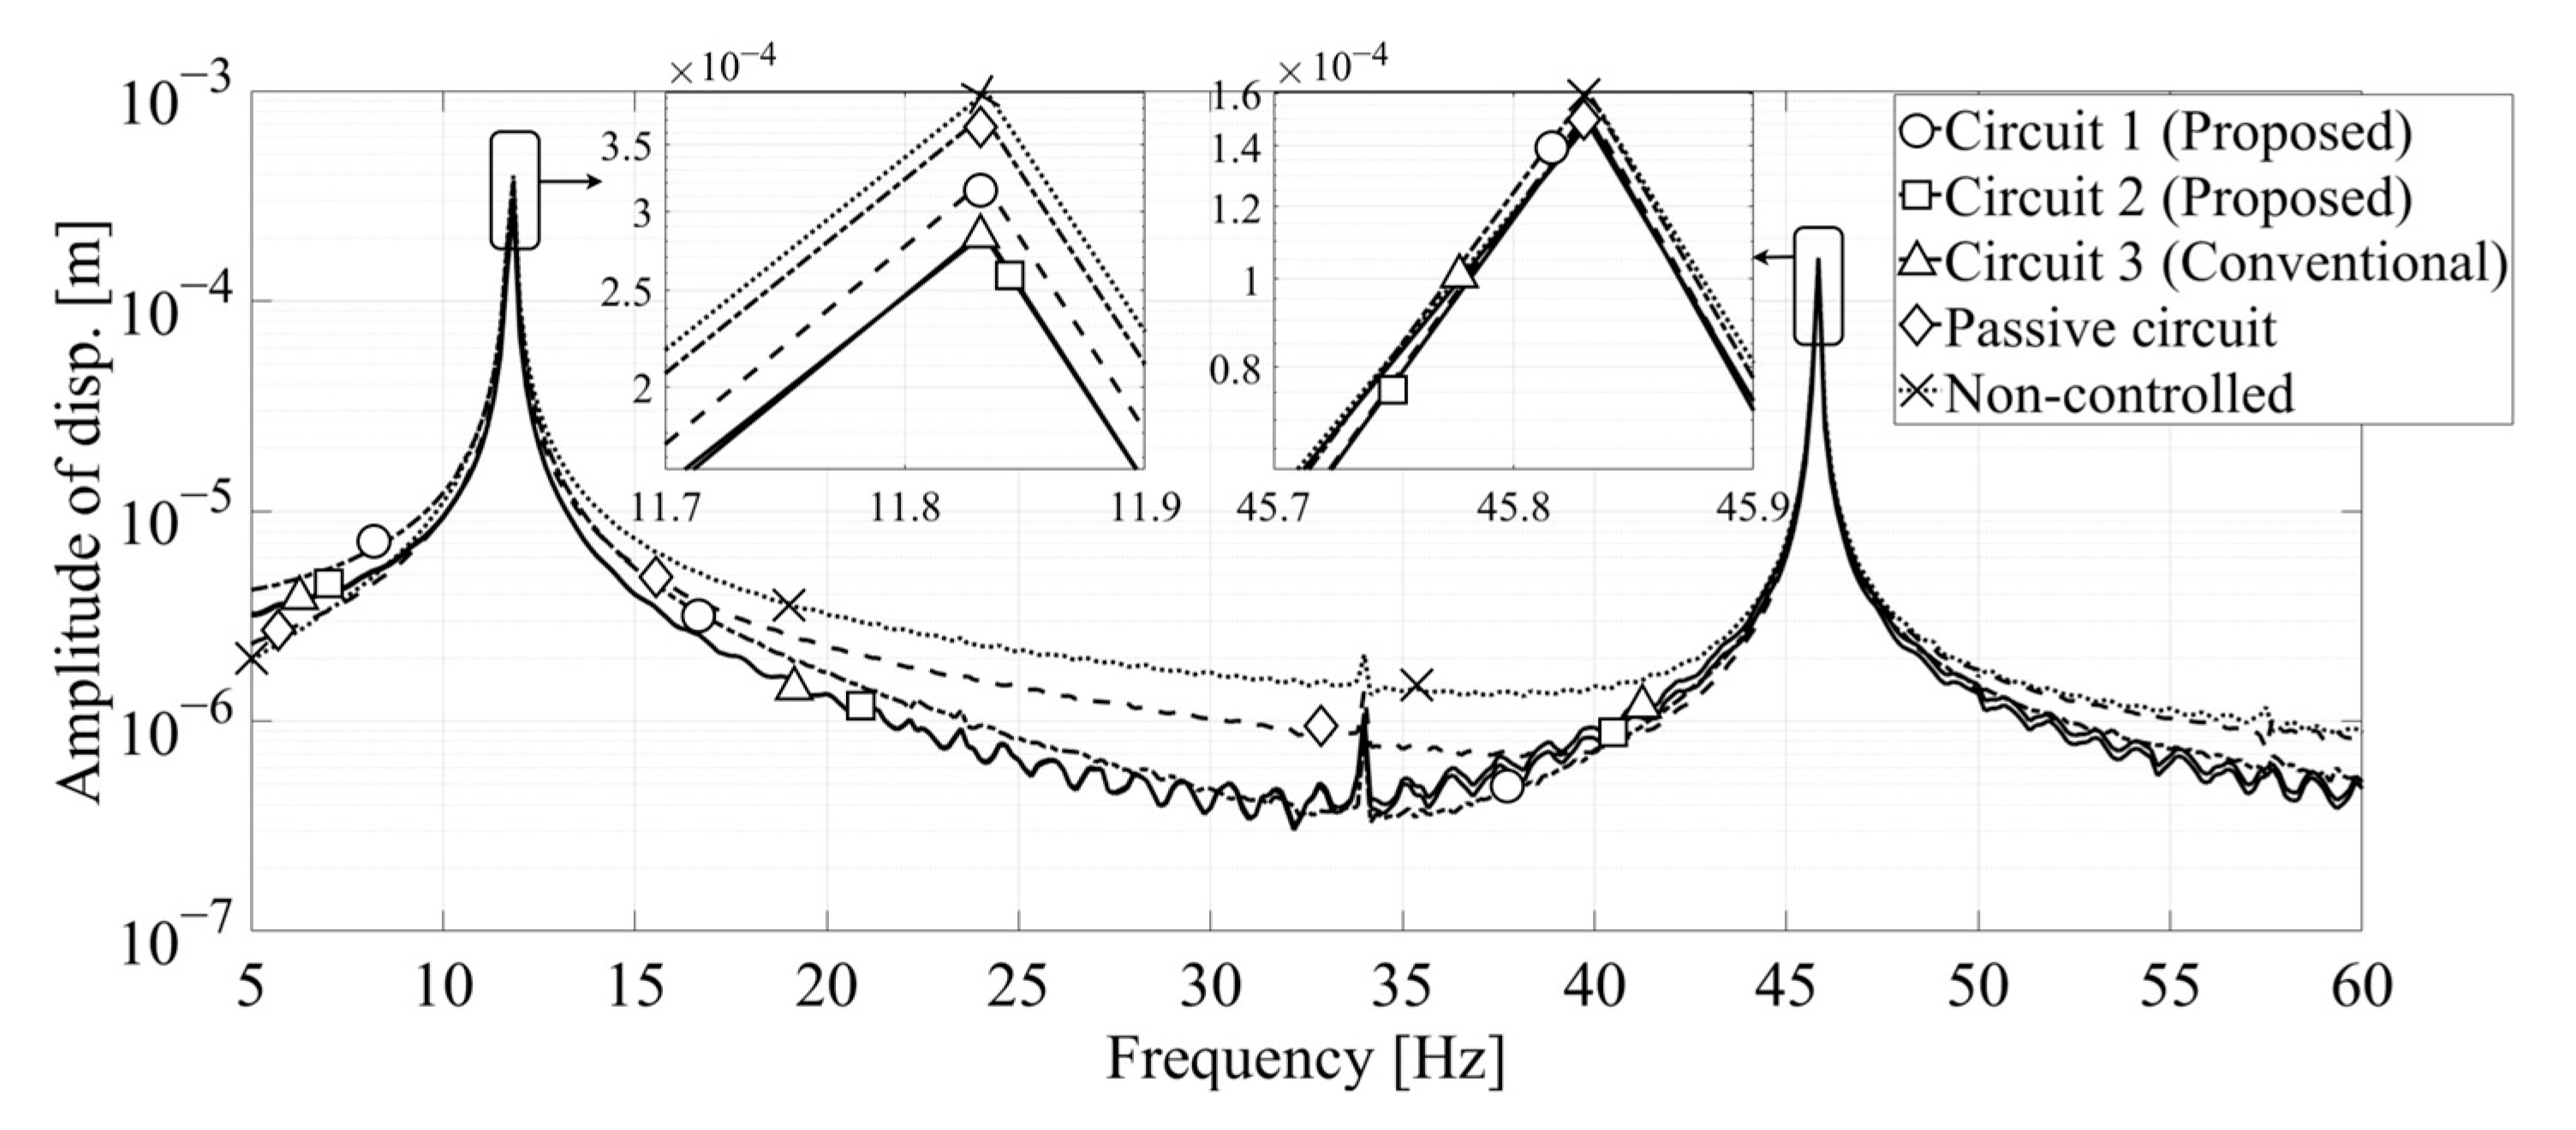
Three vibration conditions were conducted: the first natural vibration mode (11.7 Hz), second natural vibration mode (45.2 Hz), and the mixture of first and second modes along the Z-axis. The experimental frequency response curves of the truss structure with various control circuits are illustrated in Figure 12. These frequency response curves are in agreement with the numerical simulation results. The values of γ for each circuit are summarized in Table 4. Through experimental results, the following aspects were validated.
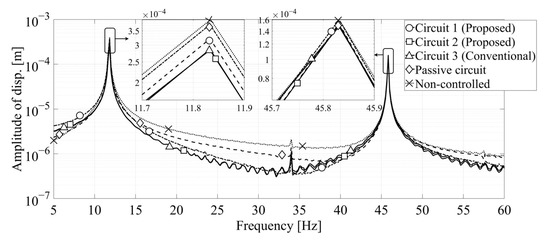
Figure 12.
Experimental response curves of the truss structure with various control circuits.
Table 4.
Vibration control rate of each control circuit.
- (1)
- The experimental and numerical simulation results were consistent.
- (2)
- The vibration control performances of the semi-active control circuits were higher than that of the passive circuit.
- (3)
- Circuits 2 and 3, which included LC oscillation, exhibited higher vibration control performance compared to Circuit 1, which does not include LC oscillation.
- (4)
- Circuits 2 and 3 were found to be more suitable for the mixture mode.
- (5)
- The vibration control rate of Circuit 2 showed a slight decrease compared to Circuit 3 due to difficulties in accurately detecting the duration of switch deactivation as pre-designed.
Under the experimental conditions, in addition to the vibration control rate, we were able to gain insight into the implementation methods of each circuit. Circuits 1 and 3 eliminated the need for precise switching durations, simplifying the switching strategy. Circuit 2 avoided the complexity of an active ideal diode circuit, making the experimental circuit setup relatively straightforward.
6. Conclusions
In this paper, three semi-active control circuits were discussed and compared. Each circuit comprised a magnetostrictive actuator and an electronic switch. The semi-active shunt circuit (Circuit 1) used the contributions of the diodes and an electronic switch to align the current polarity with the target waveform. The semi-active current amplification circuit (Circuit 2) employed LC oscillation to realize the current inversion, enabling the matching of current polarity. The current magnitudes were unchanged before and after matching. Circuit 3, similar to Circuit 2 but with the addition of diodes, automatically terminated current inversion, eliminating the need to determine the LC oscillation period. This simplification made Circuit 3’s control strategy easier to operate. Because Circuits 2 and 3 attained higher current values than Circuit 1, they exhibited improved vibration control performance.
Given the experimental conditions, Circuits 1 and 3 imposed fewer demands on the switching strategy, while Circuit 2 required less complex circuit implementation. The distinct characteristics of each circuit provided a range of options to choose from.
Numerical simulations and experimental validations were conducted using a cantilevered truss structure to compare the vibration control performance of the semi-active control circuits. The results demonstrated that each semi-active control circuit achieved better vibration control performance than the passive shunt circuit. Furthermore, under higher and mixed vibration modes, the semi-active control circuits exhibited superior vibration control performance.
Author Contributions
Conceptualization, A.L. and K.M.; methodology, A.L. and Y.K.; software, A.L.; validation, A.L.; formal analysis, A.L.; resources, A.L.; data curation, A.L.; writing—original draft preparation, A.L.; writing—review and editing, Y.K. and Y.H.; supervision, K.O. and K.M.; project administration, K.M.; funding acquisition, K.O., K.M. and A.L. All authors have read and agreed to the published version of the manuscript.
Funding
This work is supported by Grant-in-Aid for Scientific Research (KAKENHI), grant numbers 23K04240, 23K22945, 22K18853, and 22H01675, JSPS Core-to-Core Program, A. Advanced Research Networks, grant number JPJSCCA20200005, and the JST establishment of university fellowships, grant number JPMJFS2102.
Data Availability Statement
The data presented in this study are available on request from the corresponding author. The data are not publicly available due to privacy restrictions.
Conflicts of Interest
The authors declare no conflicts of interest.
Appendix A
The constitutive behaviors of magnetostrictive materials [20] can be represented by the following piezomagnetic equation when excitation is applied axially:
Here, H3, S3, and T3 represent the axial magnetic field, axial strain, and axial stress in the x3-direction, respectively, as shown in Figure A1. and represent the 33 components of the piezomagnetic coefficient matrix at constant stress and compliance matrix at constant magnetic field, respectively. When combined with coils, Equation (A1) can be rewritten as:
Here, h, , N, and l represent the magnetostrictive material length, cross-sectional area of the magnetostrictive material, number of coil turns, and coil length, respectively. The following equation is derived from Equation (A2).
Here,
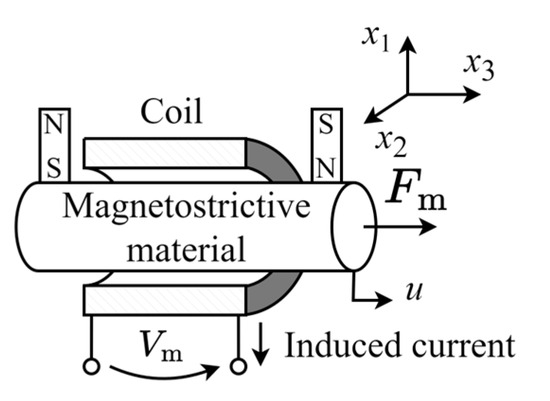
Figure A1.
Axial orientation of magnetostrictive actuator.
Figure A1.
Axial orientation of magnetostrictive actuator.

Appendix B
The equation of state combining electrical and mechanical systems is derived as follows:
Here, and are modal displacement and velocity, respectively. is the eigenmatrix of the mechanical system.
where and are the modal angular frequency and damping ratio of i-th vibration mode, respectively.
References
- Clark, A.E. Handbook of Ferromagnetic Materials; Elsevier: Amsterdam, The Netherlands, 1980; Volume 1, pp. 531–589. [Google Scholar] [CrossRef]
- Narita, F.; Wang, Z.; Kurita, H.; Li, Z.; Shi, Y.; Jia, Y.; Soutis, C. A review of piezoelectric and magnetostrictive biosensor materials for detection of COVID-19 and other viruses. Adv. Mater. 2021, 33, 2005448. [Google Scholar] [CrossRef] [PubMed]
- Apicella, V.; Zhang, Y.W.; Li, X.; Ding, H.; Chen, L.Q. Integration of a nonlinear energy sink and a giant magnetostrictive energy harvester. J. Sound Vib. 2017, 391, 35. [Google Scholar] [CrossRef]
- Clemente, C.S.; Iannone, I.; Loschiavo, V.; Davino, D. Design and optimization of a boost interface for magnetostrictive energy harvesting. Appl. Sci. 2023, 13, 1606. [Google Scholar] [CrossRef]
- Liu, Y.; Ducharne, B.; Sebald, G.; Makihara, K.; Lallart, M. Investigation of energy harvesting capabilities of Matglas 2605SA1. Appl. Sci. 2023, 13, 3477. [Google Scholar] [CrossRef]
- Kurita, H.; Lohmuller, P.; Laheurte, P.; Nakajima, K.; Narita, F. Additive manufacturing and energy-harvesting performance of honeycomb-structured magnetostrictive Fe52–Co48 alloys. Addit. Manuf. 2022, 54, 102741. [Google Scholar] [CrossRef]
- Katabira, K.; Kurita, H.; Yoshida, Y.; Narita, F. Fabrication and characterization of carbon fiber reinforced plastics containing magnetostrictive Fe-Co fibers with damage self-detection capability. Sensors 2019, 19, 4984. [Google Scholar] [CrossRef] [PubMed]
- Moon, S.; Lim, C.; Kim, B.; Park, Y. Structural vibration control using linear magnetostrictive actuators. J. Sound Vib. 2007, 302, 875. [Google Scholar] [CrossRef]
- Mion, T.; D’Agati, M.J.; Sofronici, S.; Bussmann, K.; Staruch, M.; Kost, J.L.; Co, K.; Olsson, R.H., III; Finkel, P. High isolation, double-clamped, magnetoelectric microelectromechanical resonator magnetometer. Sensors 2023, 23, 8626. [Google Scholar] [CrossRef] [PubMed]
- Liu, H.; Liu, H.; Zhao, X.; Li, A.; Yu, X. Design and characteristic analysis of magnetostrictive vibration harvester with double-stage rhombus amplification mechanism. Machines 2022, 10, 848. [Google Scholar] [CrossRef]
- Kawauchi, H.; Tanzawa, T. A fully integrated clocked AC-DC charge pump for magnetostrictive vibration energy harvesting. Electronics 2020, 9, 2194. [Google Scholar] [CrossRef]
- Li, A.; Goto, K.; Kobayashi, Y.; Hara, Y.; Jia, Y.; Shi, Y.; Soutis, C.; Kurita, H.; Narita, F.; Otsuka, K.; et al. Energy harvesting using a magnetostrictive transducer based on switching control. Sens. Actuator A Phys. 2023, 355, 114303. [Google Scholar] [CrossRef]
- Scheidler, J.J.; Asnani, V.M.; Dapino, M.J. Vibration control via stiffness switching of magnetostrictive transducers. In Proceedings of the SPIE 9799, Smart Structures and Materials + Nondestructive Evaluation and Health Monitoring (SPIE), Las Vegas, NV, USA, 15 April 2016; Volume 979909. [Google Scholar] [CrossRef]
- Takamoto, I.; Abe, M.; Hara, Y.; Otsuka, K. Makihara, Comprehensive predictive control for vibration suppression based on piecewise constant input formulation. J. Intell. Mater. Syst. Struct. 2021, 33, 901–917. [Google Scholar] [CrossRef]
- Abe, M.; Hara, Y.; Otsuka, K.; Makihara, K. Semi-Active switching vibration control with tree-based prediction and optimization strategy. J. Intell. Mater. Syst. Struct. 2023, 34, 440–460. [Google Scholar] [CrossRef]
- Li, A.; Kobayashi, Y.; Hara, Y.; Otsuka, K.; Makihara, K. Magnetostrictive-based induced current inversion and amplification: Semi-active vibration suppression for multiple-degree-of-freedom flexible structures. J. Sound Vib. 2024, 568, 118068. [Google Scholar] [CrossRef]
- Fujita, Y.; Makihara, K. Magnetostrictive vibration energy harvester with control circuit. In Proceedings of the 13th International Conference on Flow Dynamics, Sendai, Japan, 10–12 October 2016. [Google Scholar]
- Fujita, Y.; Makihara, K. Magnetostrictive vibration energy harvesting with controlling circuit. In Proceedings of the Dynamics and Design Conference 2016, Yamaguchi, Japan, 23–26 August 2016; 539. [Google Scholar] [CrossRef]
- Miyazawa, H.; Sogo, N.; Makihara, K. Semi-active control of truss structure with magnetostrictive transducer. In Proceedings of the 14th International Conference on Flow Dynamics, Sendai, Japan, 1–3 November 2017. [Google Scholar]
- Scheidler, J.J.; Asnani, V.M.; Dapino, M.J. Dynamic Characterization of Galfenol (Fe81.6Ga18.4); National Aeronautics and Space Administration STI Program; Tech. Rep. NASA/TP-2016-218754; NASA: Hampton, VA, USA, 2016. [Google Scholar]


Disclaimer/Publisher’s Note: The statements, opinions and data contained in all publications are solely those of the individual author(s) and contributor(s) and not of MDPI and/or the editor(s). MDPI and/or the editor(s) disclaim responsibility for any injury to people or property resulting from any ideas, methods, instructions or products referred to in the content. |
© 2024 by the authors. Licensee MDPI, Basel, Switzerland. This article is an open access article distributed under the terms and conditions of the Creative Commons Attribution (CC BY) license (https://creativecommons.org/licenses/by/4.0/).