Abstract
Intelligent control algorithms have been extensively utilized for adaptive controller parameter adjustment. While the Particle Swarm Optimization (PSO) algorithm has several issues: slow convergence speed requiring a large number of iterations, a tendency to get trapped in local optima, and difficulty escaping from them. It is also sensitive to the distribution of the solution space, where uneven distribution can lead to inefficient contraction. On the other hand, the Beetle Antennae Search (BAS) algorithm is robust, precise, and has strong global search capabilities. However, its limitation lies in focusing on a single individual. As the number of iterations increases, the step size decays, causing it to get stuck in local extrema and preventing escape. Although setting a fixed or larger initial step size can avoid this, it results in poor stability. The PSO algorithm, which targets a population, can help the BAS algorithm increase diversity and address its deficiencies. Conversely, the characteristics of the BAS algorithm can aid the PSO algorithm in finding the optimal solution early in the optimization process, accelerating convergence. Therefore, considering the combination of BAS and PSO algorithms can leverage their respective advantages and enhance overall algorithm performance. This paper proposes an improved algorithm, W-K-BSO, which integrates the Beetle Antennae Search strategy into the local search phase of PSO. By leveraging chaotic mapping, the algorithm enhances population diversity and accelerates convergence speed. Additionally, the adoption of linearly decreasing inertia weight enhances algorithm performance, while the coordinated control of the contraction factor and inertia weight regulates global and local optimization performance. Furthermore, the influence of beetle antennae position increments on particles is incorporated, along with the establishment of new velocity update rules. Simulation experiments conducted on nine benchmark functions demonstrate that the W-K-BSO algorithm consistently exhibits strong optimization capabilities. It significantly improves the ability to escape local optima, convergence precision, and algorithm stability across various dimensions, with enhancements ranging from 7 to 9 orders of magnitude compared to the BAS algorithm. Application of the W-K-BSO algorithm to PID optimization for the Pointing and Tracking System (PTS) reduced system stabilization time by 28.5%, confirming the algorithm’s superiority and competitiveness.
1. Introduction
Photoelectric tracking systems, as a class of integrated optomechatronics widely implemented in astronomy, communication, positioning, and tracking, present a critical and challenging issue in enhancing their overall precision []. The controller within the control system is pivotal in determining the tracking performance []; hence, optimizing the controller’s parameters is a necessary measure to improve this performance [].
In addressing optimization problems, intelligent optimization algorithms have initiated a new chapter, garnering extensive research and application since their inception []. These algorithms have afforded better solutions to complex problems. However, with further exploration, it has been observed that each algorithm has its limitations, stemming from its inherent characteristics and scope of application []. Consequently, scholars have sought to improve these algorithms by combining two, leveraging their strengths and compensating for their weaknesses [].
PSO and BAS algorithms have been utilized to solve optimization problems, entailed by basic mathematical operations and minimal computational and environmental requirements, and thus widely applied in various parameter optimizations [,]. Ye et al. proposed the Beetle Swarm Antennae Search (BSAS) algorithm, incorporating a feedback step-size update strategy, and addressing issues related to the algorithm’s over-reliance on the beetle’s random direction and the need for frequent updates of beetle positions and step sizes []. Lei et al. suggested the Beetle Antennae Search with Flower Pollination Algorithm (BFPA), applying butterfly pollination strategies for global search and BAS for local searches to enhance search performance and convergence rates []. Xu et al. introduced the Levy flight and adaptive strategy-based BAS (LABAS), grouping beetles, updating swarm information with elite individuals, and incorporating generalized oppositional learning in the initial and elite populations with Levy flight and proportion factors []. Fan et al. applied a BAS and PID hybrid controller for electro-hydraulic servo systems, significantly enhancing system performance and effectively meeting control demands []. However, their limitations lie in focusing on a single individual. As the number of iterations increases, the step size decays, causing it to get stuck in local extrema and preventing escape. Although setting a fixed or larger initial step size can avoid this, it results in poor stability.
Sedighizadeh et al. developed a Generalized PSO (GEPSO) algorithm, incorporating two new items into the velocity update rule and adopting a novel dynamic inertia weight update strategy, outperforming other variants in run time and fitness values []. Aydilek proposed a hybrid algorithm combining Firefly Algorithm (FA) and PSO (HFPSO), using PSO for global search and FA for local search, rapidly and reliably finding optimal solutions []. Dhanachandra et al. integrated Dynamic Particle Swarm Optimization (DPSO) with Fuzzy C-Means Clustering (FCM), using DPSO to find FCM’s optimal solutions and applying the improved method to image segmentation and noise reduction, demonstrating enhanced noise resistance and performance []. However, the PSO algorithm has several issues: slow convergence speed requiring a large number of iterations, a tendency to get trapped in local optima, and difficulty escaping from them. It is also sensitive to the distribution of the solution space, where uneven distribution can lead to inefficient contraction.
The BAS algorithm displays robust performance, high precision, and strong global search capabilities, but its limitation arises from its focus on individual particles []. As iterations increase and step sizes decay, it may become trapped in local optima, despite solutions like fixed step sizes or larger initial step sizes introducing instability. The PSO algorithm, on the other hand, addresses a collective, aiding BAS by increasing diversity and rectifying its shortcomings []. Moreover, BAS’s traits facilitate rapid identification of the optimal solution in PSO’s initial stages, hastening convergence. This consideration led to the hybridization of BAS and PSO, aiming to capitalize on the individual advantages of each algorithm and enhance overall performance.
In this study, we integrate the beetle antennae search strategy into the PSO local search, proposing an improved algorithm referred to as W-K-BSO. Our principal contributions are as follows:
- We utilize chaotic mapping to optimize population diversity, resulting in a stochastic and uniform distribution of individuals, thereby enhancing the algorithm’s convergence rate without compromising the inherent randomness of the population.
- The inertia weight is updated using a linearly decreasing differential approach, mitigating the deficiency of conventional linear decrement strategies that may fail to identify the optimal value direction in the initial stages, leading to convergence towards local optima in later stages.
- We synergistically control the algorithm using a contraction factor and inertia weight, ensuring convergence while effectively managing global and local search performance. The contraction factor includes an acceleration coefficient derived from the beetle’s antennae position increments. These three factors collectively dictate the updating mechanism. By treating the particle’s position as the centroid of the beetle, we generate positions for the beetle’s left and right antennae, calculate their fitness values, and create new positions and increments. These new positions serve as the current positions of the particles. We also incorporate the impact of antennae position increments on the current particle positions into the velocity update rule. Finally, we test the algorithm using benchmark functions and apply it to the optimization of PID in photovoltaic tracking systems.
The subsequent sections of this paper are arranged as follows: Section 2 discusses relevant theories, Section 3 presents the local search Particle Swarm Optimization algorithm based on the beetle antennae search algorithm, Section 4 conducts a simulation analysis, Section 5 details the experimental validation, and Section 6 provides a summary of the paper.
2. Theoretical Foundations
2.1. Fundamental Particle Swarm Optimization
PSO is a population-based stochastic optimization algorithm initially introduced by Kennedy and Eberhart []. The fundamental premise is as follows: given a dimensional search space and a swarm consisting of particles, the position of particle i in the search space can be represented as:
Corresponding to its position, the velocity vector, which is also dimensional, is given by:
The best position reached by particle i , known as the personal best or individual extremum, is denoted as:
The best position attained by the swarm, referred to as the global best or group extremum, is represented by:
Once the personal and global extrema are identified, the velocity and position of the particles are updated using:
In these equations, and are random numbers, and are acceleration coefficients that adjust the influence of individual and group cognition during the search, facilitating rapid convergence, and can also be termed learning factors. denotes the velocity of particle i in the d-th dimension at the t-th iteration, signifies the position of particle i in the d-th dimension at the t-th iteration, represents the coordinate position of particle i’s personal best in the d-th dimension at the t-th iteration, and indicates the coordinate position of the global best in the d-th dimension for the entire swarm at the t-th iteration.
The optimization process of the basic PSO algorithm is visualized in the Figure 1.
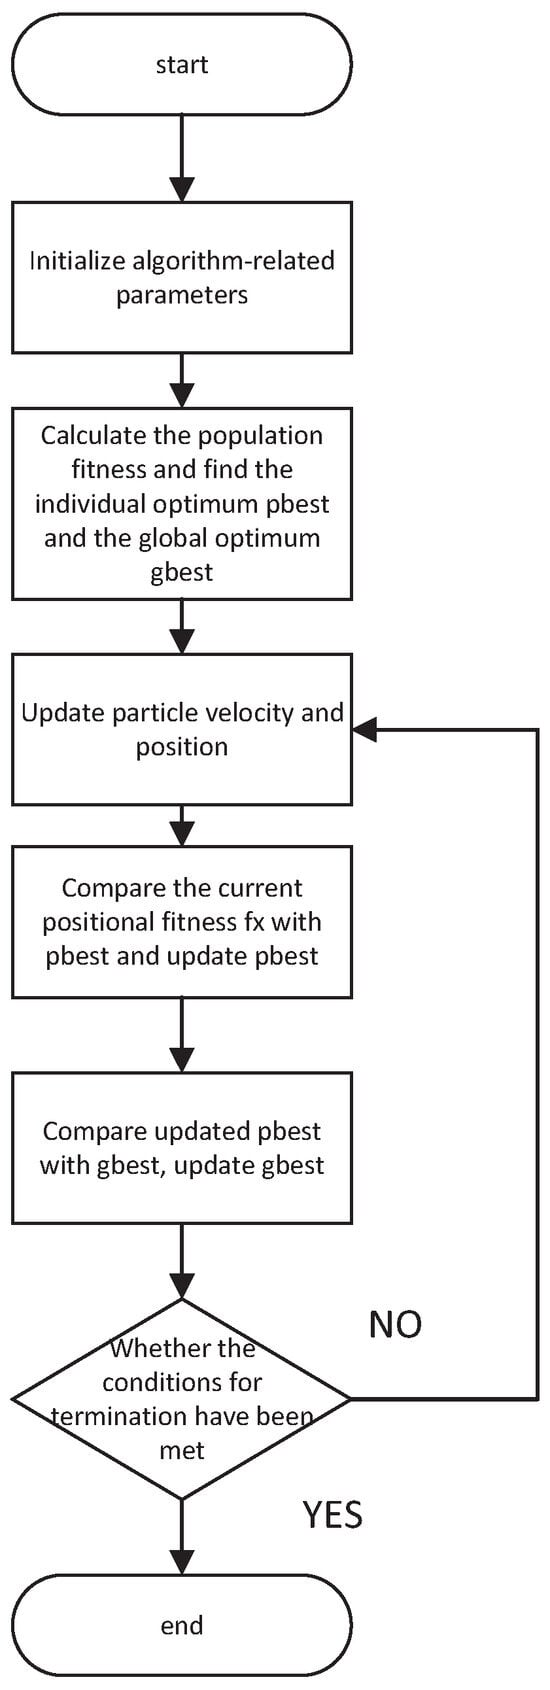
Figure 1.
Flow chart of the PSO algorithm.
To preserve individual momentum within the swarm, Shi and Eberhart proposed incorporating an inertia weight into the velocity update rule, leading to the development of the Standard Particle Swarm Optimization (SPSO) []. The velocity update rule for the SPSO algorithm is illustrated as follows:
In the Standard PSO algorithm, a high value of inertia weight emphasizes the particle’s current velocity, making it suitable for extensive global searches. However, the swift velocity and large position jumps might overlook certain areas, potentially missing the optimal solution. Conversely, a low inertia weight value diminishes the influence of the particle’s current velocity, which is advantageous for a focused local search. Yet, the limited search space and rapid convergence may lead to entrapment in local optima.
To effectively balance the local and global exploration capabilities of the PSO algorithm, Clerc and Kennedy introduced a constriction factor , resulting in the Constriction Factor Particle Swarm Optimization (CFPSO) []. The CFPSO algorithm replaces the inertia weight of the basic PSO algorithm with the constriction factor . Utilizing this factor allows for efficient searches across various regions, ensuring convergence to a high-quality collective optimal solution. The velocity update equation for the CFPSO algorithm is as follows:
Here, the constriction factor governs the convergence phase of the algorithm, enabling it to achieve more effective and precise solutions.
In summary, the PSO algorithm boasts simplicity in coding, rapid convergence, and high efficiency during the early search phases. However, it lacks precision and, when dealing with multimodal problems, its strong global search capability leads to a swift reduction in the search range, causing particles to converge quickly and lose diversity. Additionally, the low utilization of information leads to premature convergence, negatively impacting the optimization process and application of the algorithm. These issues necessitate improvements to the algorithm, ensuring an enhanced optimization and application potential.
2.2. Beetle Antennae Search Algorithm
The BAS algorithm is an innovative biomimetic algorithm inspired by the foraging behavior of beetles. Biologically, a beetle, when searching for food, does not initially know the food’s location; it locates its food based on the strength of the scent detected by its antennae. A beetle has a pair of long antennae. If the scent received by the left antenna is stronger than that received by the right, the beetle will move to the left, and vice versa. By this simple principle, beetles can efficiently locate food. In the BAS algorithm, the beetle is modeled as a particle, and its antennae are abstracted to points located on either side of the particle’s centroid. The search step length is set according to the distance ratio between the two antennae. Within the BAS algorithm framework, the optimal value of the fitness function is analogous to the food location in nature, and the variables of the fitness function represent the beetle’s position in space.
The modeling process of the BAS algorithm is as follows:
- Initialization of beetle’s position and direction: The position and orientation of the beetle are randomly generated and normalized:where ‘rands(.)’ function denotes uniformly distributed random numbers in the range of −1 to 1, and ‘Dim’ represents the dimensionality.
- Antennae placement for scent detection: In nature, as a beetle uses its antennae to detect food scent without knowing the precise location of the food, it determines its next movement based on the scent detected by its antennae. The positions of the beetle’s left and right antennae, and , can be represented as:where t represents the iteration number, the position of the right antenna, the position of the left antenna, the position of the beetle at time t, and the perception distance of the antennae.
- Determining the Movement Direction: Based on the chosen fitness function, the fitness values of both antennae are computed, and the beetle moves towards the antenna receiving the lower fitness value.
- Iterative Update of Position:where represents the step length of the beetle’s search, ‘sign()’ the sign function, and ‘f()’ the target optimization function.
- Updating the Perception Length and Search Step Length: Upon completing the movement, both the antennae’s perception length and the search step length are updated:where is a fixed reduction factor for the detection distance and search step length in the BAS algorithm, typically set to . This fixed reduction factor possesses scale invariance, facilitating the adaptation of the search efficiency over successive iterations.
The flowchart of the BAS algorithm is shown in the Figure 2 below.
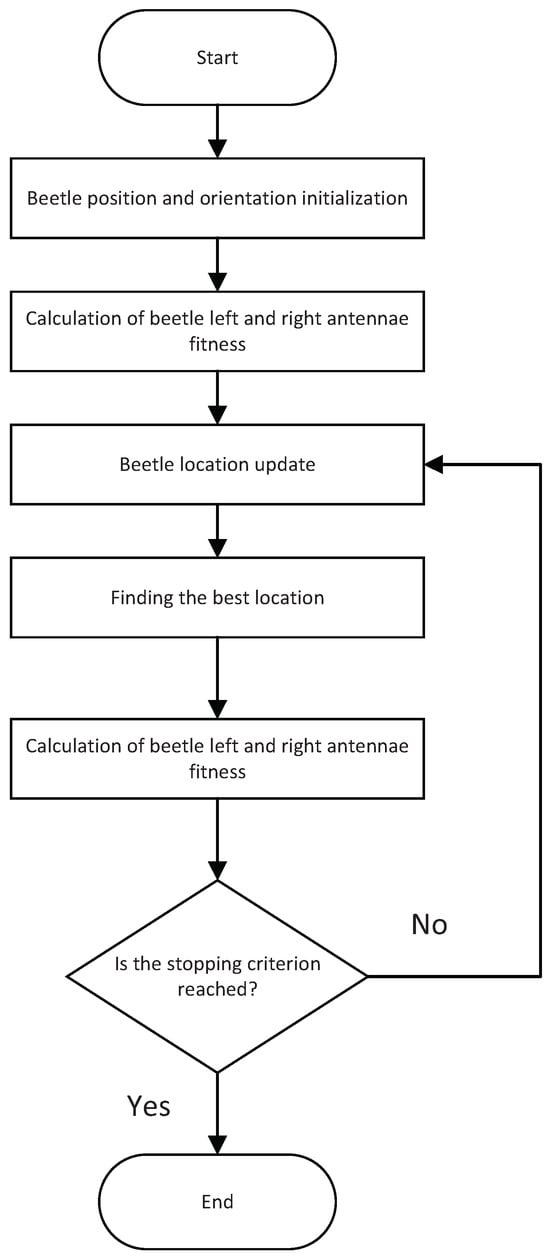
Figure 2.
Flow chart of the BAS algorithm.
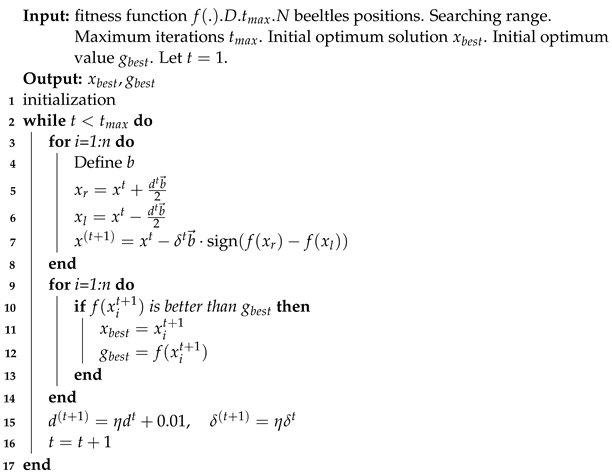
The pseudocode for the BAS algorithm is provided in Algorithm 1:
| Algorithm 1: BAS algorithm |
 |
2.3. Benchmark Functions
In the domain of optimization, benchmark functions are commonly employed to evaluate the performance of algorithms []. Table 1 presents a selection of benchmark functions along with their respective mathematical expressions.

Table 1.
Benchmark Functions.
2.4. Fitness Function
Among the commonly employed PID error performance criteria, the Integral of Absolute Error (IAE) is suitable for systems with good transient responses and minimal errors. Therefore, this study adopts the IAE criterion as the fitness function for the algorithm. To control excessive control efforts, a quadratic term of the input is included in the fitness function, given by:
where represent the weight factors, denotes the system error, and signifies the PID output. To avoid overshoot, a penalty control is implemented such that any overshoot is included as part of the error performance measure. Specifically, when overshoot occurs, the fitness function becomes:
where is the penalty factor, typically chosen as a large value. Generally, .
3. A Hybrid PSO Algorithm Incorporating BAS Algorithm for Local Search
The preceding section delineated the theoretical underpinnings of both the PSO and the BAS algorithms. Addressing the limitations inherent in the PSO algorithm, particularly its low information utilization and precision [], and the singularity of the BAS algorithm which results in suboptimal performance in high-dimensional search spaces, this chapter introduces a hybrid algorithm that integrates the characteristics of the BAS algorithm with the PSO algorithm. The enhancement of the algorithm is achieved through the optimization of population initialization, inertia weight, constriction factor, and an improved velocity update rule. This amalgamation realizes a complementary synergy between the performance advantages of the constituent algorithms.
3.1. Enhancing Population Diversity through Chaotic Mapping
In the search process of intelligent optimization algorithms, the distribution of the initial population, that is, the quality of solutions within the search space, significantly impacts the optimization process. A better and more uniform initial position distribution aids in the convergence to the optimal solution and accelerates the search speed. Conversely, a suboptimal initial distribution may impede the algorithm’s ability to explore the entire search space, thus affecting its performance. Utilizing the regularity, randomness, and ergodicity of chaotic mapping [], this study optimizes the initial population positions. This ensures a random and uniform distribution of population individuals, enhancing population diversity without altering the inherent randomness of the population.
Firstly, the randomly generated population positions and velocities are mapped within the interval , where and represent the maximum and minimum values of position and velocity, respectively.
Subsequently, the positions are subjected to the Logistic chaotic mapping to obtain the chaotic values :
where is the control parameter. The chaotic values are then transformed back into the search space of the population to yield new initial positions and velocities :
3.2. Enhanced Inertia Weight and Contraction Factor
The conventional linearly decreasing inertia weight in the PSO algorithm provides strong global search capabilities during the early stages of optimization. However, if the global optimum is not located early on, the reduced inertia weight in later stages, which favors local search, may lead the algorithm into local optima. To overcome this deficiency, a linearly varying inertia weight is employed, with the computational formula given by:
This dynamic formula ensures a larger inertia weight in the early stages with a slow decay, which maintains robust global search performance and is conducive to finding the optimal solution quickly, thereby accelerating the convergence rate of the algorithm. In later stages, a smaller inertia weight with rapid decay enhances the local search capability. Once the algorithm has identified a general region of the optimum in the early stages, it can swiftly pinpoint the exact optimum value, leading to an improved problem-solving outcome and, to some extent, mitigating the shortcomings of the typical linear decrement strategy.
The contraction factor effectively searches various regions and ensures the convergence of the algorithm. The inertia weight helps to guarantee convergence, and both the inertia weight and the acceleration coefficient control the balance between global and local search capabilities. This study considers combining the strategies of inertia weight and the acceleration coefficient to enhance the particles’ search capabilities and better balance their global and local search capabilities. This leads to the development of the PSO with a linearly decreasing inertia weight and contraction factor (W-K-PSO). The velocity and contraction factor update equations are given by:
In the above equations, is the random acceleration coefficient for particle update rules, and the contraction factor is determined by the three acceleration coefficients together. By introducing an acceleration coefficient for the position of the BAS algorithm, the search space judgment is no longer solely determined by the individual and swarm acceleration coefficients.
3.3. Refined Velocity Update Rule
To address the issue of low precision in high-dimensional problems, this study introduces the searching strategy of the BAS algorithm into the local search of the PSO algorithm. The W-K-BSO algorithm considers not only the current and historical best solutions but also the impact of the individual position increments of the beetle on the particle velocity. A new velocity update rule for PSO is thus defined. During the iterations of the W-K-BSO algorithm, a “ beetle” is randomly generated. The initial position of each particle is used as the centroid of the beetle, effectively treating each beetle as a particle. The positions of the left and right antennae are computed and their fitness values , are compared. The superior fitness is used to update the beetle’s position information and the position increments. Subsequently, the beetle’s position information and increments are utilized to update the particle velocity and calculate the new particle positions. The fitness value of the new positions is compared with the individual best and the global best to update the local and global optima. Incorporating the beetle’s position increments in the velocity update rule leverages the beetle’s robust global search capabilities, guiding the particles to locate the optimal values more effectively from the initial stages of the search process. The constructed W-K-BSO algorithm better resolves the issues of the PSO algorithm being susceptible to local optima, exhibiting low precision, and poor stability. The particle velocity and position update formulas are provided as follows:
where is random number, and denotes the position increments of the beetle. The flowchart of the algorithm is presented in the Figure 3:
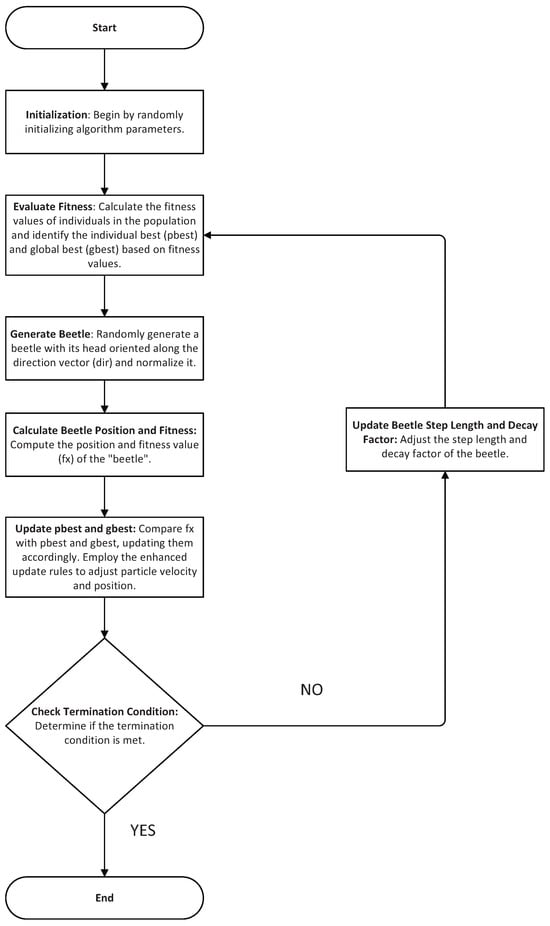
Figure 3.
Flow chart of the W-K-BSO algorithm.
4. Simulation Analysis
As inferred from the optimization process and the algorithmic model of the W-K-BSO algorithm, several initialization parameters require setting, which include: population size , maximum number of iterations , initial step size , step size reduction factor , spatial dimensionality , and acceleration coefficients . The initial step size can be tailored based on different application scenarios. The specific parameter settings are as follows in the Table 2:
Table 2.
The specific parameter settings.
To validate the effectiveness of the W-K-BSO algorithm, simulations were conducted to compare its performance with other algorithms, using the minimization of nine benchmark test functions. To ensure the diversity of the test functions and universality of the conclusions, both unimodal and multimodal functions with distinct characteristics were employed. The parameter settings for the selected functions are detailed in the following Table 3:
Table 3.
The specific parameter settings.
The W-K-BSO algorithm was compared with the BAS and SPSO algorithms through simulations. For BAS and W-K-BSO, the step size reduction factors were set as and , respectively, with initial step sizes of and . The maximum number of iterations was for SPSO and W-K-BSO. Population sizes for SPSO and W-K-BSO were set to , and the maximum and minimum velocities were and , respectively. The maximum and minimum inertia weights for the W-K-BSO algorithm were denoted as and . The inertia weight for SPSO was , and the acceleration coefficients for all algorithms were . The dimensionality was (set as 2 dimensions for the Schaffer function). Each algorithm was run independently 30 times to compare the best, worst, average, and standard deviation values of the BAS, SPSO, and W-K-BSO algorithms across different dimensions of the selected benchmark functions. The results obtained by the proposed algorithm in this study are presented in bold.
The Table 4 and Table 5 present the best (Best), worst (Worst), average (Avg), and standard deviation (Sd) values for the BAS, SPSO, and W-K-BSO algorithms across nine benchmark functions with dimensions of 30, 100, 500, and 1000. A holistic analysis of the BAS, SPSO, and W-K-BSO algorithms, whether applied to multimodal or unimodal functions, shows that the W-K-BSO algorithm significantly outperforms both the BAS and SPSO algorithms, demonstrating its robust performance. Moreover, multimodal functions possess multiple local optima, which can easily trap the algorithms in local optima, preventing convergence to the global optimum. The data in the table effectively demonstrate the effectiveness of the W-K-BSO algorithm against such scenarios. The W-K-BSO algorithm can effectively find the theoretical minimum value of 0 for the functions under low or high dimensionality, and a standard deviation of 0, highlighting the algorithm’s high stability. Although convergence to 0 for functions was not achieved, the optimization outcomes were still significantly enhanced. For two other functions , the optimization effects were more pronounced, and the standard deviation indicated a higher stability of the W-K-BSO algorithm across these functions. In terms of another function , the W-K-BSO algorithm improved the performance by 7 to 9 orders of magnitude compared to the BAS algorithm and by 4 to 8 orders of magnitude compared to the SPSO algorithm across different dimensions.
Table 4.
The performance indices of each algorithm.
Table 5.
The performance indices of each algorithm.
To further contrast the optimization efficacy of the algorithms, the Figure 4 presents the convergence comparison curves of BAS, SPSO, CFPSO, W-K-PSO, and W-K-BSO for 100-dimensional functions (with Schaffer set at 2 dimensions).
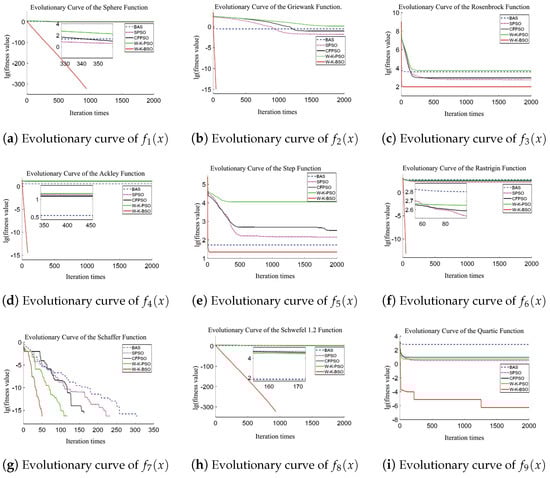
Figure 4.
Evolutionary curves of the test functions.
Figure 4a shows that before 350 iterations, the convergence speed, from fastest to slowest, is as follows: CFPSO, W-K-PSO, SPSO, BAS. However, the slopes of their evolution curves are all smaller than that of W-K-PSO, indicating that in the initial optimization phase, W-K-BSO is the fastest, far outpacing the other algorithms. After 350 iterations, as seen in the inset, BAS, PSO, CFPSO, and W-K-PSO have lg(fitness) > 0, suggesting these algorithms have become trapped in local optima and cannot find the global optimum. In contrast, W-K-BSO has lg(fitness) < −300 and stops iterating around 950 iterations, demonstrating that W-K-BSO finds the global optimum with a standard deviation of 0, indicating good convergence and stability. Therefore, for optimizing the function, the convergence speeds of the five algorithms from highest to lowest are: W-K-BSO, CFPSO, W-K-PSO, SPSO, BAS, with only W-K-BSO finding the global optimum.
Figure 4b shows that BAS experiences early optimization stagnation. Initially, BAS’s convergence performance is better than SPSO, CFPSO, and W-K-PSO, but after 1000 iterations, SPSO and CFPSO overtake BAS. Although their convergence curves flatten, they still search in the correct direction. The W-K-BSO algorithm finds the theoretical optimum value of the function by the 45th iteration, showing significantly better convergence performance than the other algorithms. Thus, for optimizing the function, the convergence speeds from highest to lowest are: W-K-BSO, BAS, SPSO, CFPSO, W-K-PSO, with the order of finding the global optimum being: W-K-BSO, SPSO, CFPSO.
Figure 4c indicates that none of the five algorithms found the optimal value of 0 for the function. The optimization effect of W-K-BSO on the function is not very pronounced, with limited accuracy improvement. However, W-K-BSO still outperforms other algorithms in terms of convergence speed and accuracy. BAS has a faster convergence speed than SPSO, CFPSO, and W-K-PSO, but SPSO and CFPSO have slightly higher accuracy than BAS. The proposed algorithm shows a small standard deviation, indicating good stability. Therefore, for optimizing the function, the convergence speeds from highest to lowest are: W-K-BSO, BAS, SPSO, CFPSO, W-K-PSO.
Figure 4d,f show that the W-K-BSO algorithm exhibits good convergence performance from the initial optimization stage, finding the optimal value in fewer than 100 iterations, demonstrating robust and global convergence. The other four algorithms show comparable optimization performance but experience early optimization stagnation. For the function, under the same number of iterations, the algorithm accuracies from highest to lowest are: W-K-BSO, BAS, CFPSO, SPSO, W-K-PSO. For the function, the accuracies from highest to lowest are: W-K-BSO, SPSO, CFPSO, W-K-PSO, BAS.
Figure 4e shows that the W-K-BSO algorithm initially exhibits fast convergence speed but falls into a local optimum at the 25th iteration. Nevertheless, W-K-BSO achieves higher convergence accuracy. Therefore, for optimizing the function, the convergence speeds from highest to lowest are: W-K-BSO, BAS, CFPSO, SPSO, W-K-PSO.
Figure 4g indicates that all five algorithms find the optimal value before 350 iterations, but W-K-BSO converges to the optimal value of the function much faster than the other four algorithms. As shown in Table 4 and Table 5, the SPSO algorithm occasionally finds the optimal value but is unstable, while the proposed W-K-BSO algorithm converges to the theoretical optimum with a 100% success rate in 30 independent runs, indicating good algorithm stability. Thus, for optimizing the function, the convergence speeds from highest to lowest are: W-K-BSO, W-K-PSO, SPSO, BAS, CFPSO.
Figure 4h shows that, similar to the function, CFPSO, W-K-PSO, SPSO, and BAS fall into local optima and cannot escape, whereas W-K-PSO escapes the local optimum and finds the global optimum. Therefore, for optimizing the function, the convergence speeds from highest to lowest are: W-K-BSO, W-K-PSO, CFPSO, SPSO, BAS.
Figure 4i shows that the W-K-BSO algorithm initially converges rapidly, but its convergence speed slows down afterward. Although it continues to approach the optimal value until the maximum number of iterations is reached, the time required to escape local optima increases. Overall, W-K-BSO has the highest accuracy. Therefore, for optimizing the function, the convergence speeds from highest to lowest are: W-K-BSO, W-K-PSO, CFPSO, SPSO, BAS.
Based on the above simulation results, we have created a comparative table, as shown in Table 6.
Table 6.
Comparison of Simulation Results for Various Algorithms.
In conclusion, the W-K-BSO algorithm of this study demonstrates a robust search performance across various benchmark functions and dimensionalities, achieving high accuracy. The algorithm can rapidly converge to the optimal values for some functions , albeit more slowly for others , still successfully identifies the optimal values. Despite having relatively weaker optimization capabilities for certain functions , the algorithm consistently exhibits enhanced convergence accuracy compared to other methods. The stability and efficacy of the improved algorithm are evident across the convergence scenarios of various functions.
The Wilcoxon signed-rank test is employed to determine whether there are significant differences between two independent sample groups. In the Wilcoxon signed-rank test, the test statistic is calculated by summing the ranks of the absolute differences between the observed values and the central position under the null hypothesis, each assigned with the appropriate sign. Unlike the T-test, the Wilcoxon signed-rank test does not require the differences between paired data to follow a normal distribution; it only requires symmetry. Therefore, it is suitable for comparing the optimization results of different algorithms on various test functions. The Wilcoxon signed-rank test is conducted under the assumption of symmetric sample data, providing more information than the sign test, thereby yielding more reliable results. This method can be used to pairwise compare the statistical results, such as means or variances, obtained from different optimization algorithms across various test functions, allowing for a unified qualitative analysis of their optimization performance.
In this study, we employed the Wilcoxon signed-rank test to analyze the performance of the proposed method, setting the significance level at 0.05. Table 7 presents the Wilcoxon signed-rank test results for the optimal values of nine test functions after 30 independent runs. Here, “win” indicates the superior algorithm in each comparison; “+” denotes that the W-K-BSO algorithm outperformed the compared algorithm, “−” indicates that the W-K-BSO algorithm underperformed compared to the compared algorithm, and “=” signifies no significant difference in performance between the two algorithms. From Table 7, by statistically analyzing the “+/=/−” values, it is evident that the W-K-BSO algorithm generally demonstrates superior convergence speed and search accuracy compared to the BAS algorithm, SPSO algorithm, CFPSO algorithm, and W-K-PSO algorithm across the nine different test functions.
Table 7.
The results of Wilcoxon sign rank test.
5. Experimental Validation
The Figure 5 illustrates a high-precision Pointing and Tracking System (PTS) subsystem with a dual-axis, dual-tip tilt mirror tracking system. In the diagram, the high-precision PTS primarily consists of three parts: A target simulation unit that includes a signal sending device (laser) and a target mirror movement adjustment device, a monitor consisting of a position-sensitive detector and an image charge-coupled device (CCD), and finally, the control device (tracking mirror). Initially, the laser is utilized as the signal sending device to simulate the motion of the target. Moreover, the target mirror within the target simulation unit can adjust the motion of the target. Subsequently, the tracking mirror, driven by a motor, reflects the signal light onto the position-sensitive detector. After receiving the target signal, the CCD detects the steady-state error and transmits this error to the position controller.
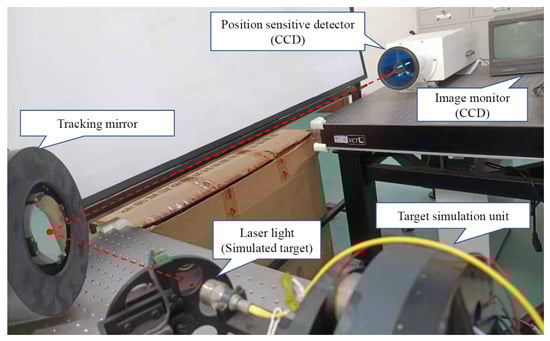
Figure 5.
PTS subsystem.
The control object transfer function is as follows:
In this experiment, the proposed method is applied to the electro-optical tracking system to test its performance and draw conclusions through comparison.
Using the Integral Absolute Error (IAE) as the algorithm fitness function, the optimal PID parameters obtained from the search are substituted into the PID of the electro-optical tracking system, producing the step response and error curve. During the experiment, the population size is set to , and the number of iterations is . The PID parameter optimization curve and the fitness curve of the W-K-BSO algorithm are shown in the Figure 6.
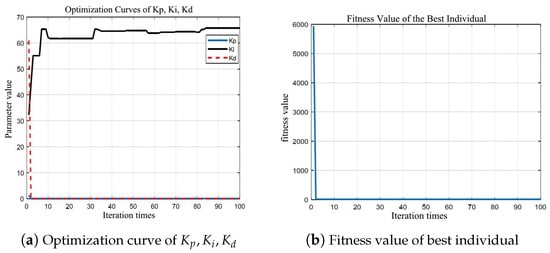
Figure 6.
Optimization curves of the W-K-BSO algorithm.
The PID parameters optimized by the W-K-BSO algorithm are listed in the Table 8, with the best fitness value :
Table 8.
The PID parameters optimized by the W-K-BSO algorithm.
The step response and error curves obtained using the PID parameters optimized by the W-K-BSO algorithm for the electro-optical tracking system are shown in Figure 7.
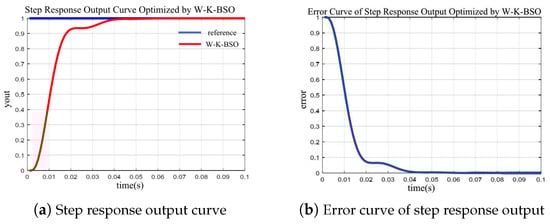
Figure 7.
The step response and error curves obtained using the PID parameters optimized by the W-K-BSO algorithm.
The PID parameter tuning of the electro-optical tracking system was conducted using the W-K-BSO, SPSO, and GA algorithms under identical experimental conditions. A comprehensive comparison of the step response and error curves of the three algorithms was analyzed. In the Figure 8, the rin curve represents the system input signal, and the SPSO, W-K-BSO, and GA curves represent the output signals for their respective algorithms.
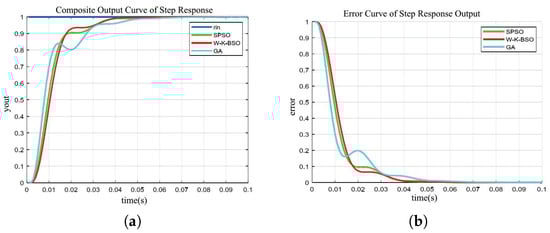
Figure 8.
The step response and error curves obtained using the PID parameters optimized by the W-K-BSO algorithm. (a) The comparison of the step response; (b) The comparison of the step response output error.
From the Figure 8, the analysis of the parameter tuning results from the W-K-BSO, SPSO, and GA algorithms indicates that the GA algorithm has the fastest convergence rate among the three but also exhibits the largest error. The convergence rate of the W-K-BSO algorithm is slightly slower than the SPSO algorithm, yet it has the smallest error. Although the convergence speed of the W-K-BSO algorithm does not show a significant advantage, its error rate is clearly superior to that of the GA and SPSO algorithms. The GA algorithm begins to stabilize around 0.05 s, reaching a fixed value at approximately 0.07 s. Both the W-K-BSO and SPSO algorithms achieve stability in less than 0.05 s.
6. Conclusions
This paper effectively combines the PSO algorithm with the BAS algorithm, utilizing the collective nature of PSO to address the limitation of individual uniformity in BAS, thereby significantly increasing the likelihood of finding the optimal solution. Additionally, it integrates the fine-tuned search capability of PSO with the global search ability of BAS to enhance the optimization performance. The paper proposes improvements to address existing shortcomings of these algorithms and applies the enhanced algorithm to broaden its application scope. The main contributions of this paper are as follows:
- Utilizing Logistic chaotic mapping for population initialization to generate high-quality initial solutions;
- Introducing a linear decreasing strategy to the inertia weight to improve algorithm efficiency;
- Employing a contraction factor and inertia weight to collaboratively control the global and local search performance of the algorithm; Introducing the influence of beetle position increments on particles and establishing new velocity update rules.
Simulation experiments conducted on nine benchmark functions demonstrate that the W-K-BSO algorithm exhibits strong optimization capabilities throughout the search process. Significant improvements are observed in the ability to escape local optima, convergence precision, and stability across various dimensions. The application of the W-K-BSO algorithm to optimize the PID of a feed electro-optical tracking system serves as a testament to the algorithm’s superiority and competitiveness.
Author Contributions
Conceptualization, T.F.; Formal analysis, S.D.; Methodology, T.F.; Resources, Q.D. and Y.M.; Software, T.F.; Supervision, Y.M.; Writing—original draft, T.F.; Writing—review and editing, Q.D. All authors have read and agreed to the published version of the manuscript.
Funding
This work was supported in part by Sichuan Science and Technology Program of China under Grant 2024NSFSC1492.
Institutional Review Board Statement
Not applicable.
Informed Consent Statement
Not applicable.
Data Availability Statement
Data are contained within the article.
Conflicts of Interest
The authors declare no conflicts of interest.
References
- Xia, W.; Mao, Y.; Zhang, L.; Guo, T.; Wang, H.; Bao, Q. Extended State Kalman Filter-Based Model Predictive Control for Electro-Optical Tracking Systems with Disturbances: Design and Experimental Verification. Actuators 2024, 13, 113. [Google Scholar] [CrossRef]
- Zhuang, S.; Li, J.; Wang, H.; Deng, J.; Mao, Y. Multi-Channel Phase-Compensated Active Disturbance Rejection Control with an Improved Backstepping Strategy for Electro-Optical Tracking Systems. Actuators 2024, 13, 117. [Google Scholar] [CrossRef]
- Xiao, L. Parameter tuning of PID controller for beer filling machine liquid level control based on improved genetic algorithm. Comput. Intell. Neurosci. 2021, 2021, 7287796. [Google Scholar] [CrossRef] [PubMed]
- Han, B.; Jiang, Y.; Yang, W.; Xu, Y.; Yao, J.; Zhao, Y. Kinematics characteristics analysis of a 3-UPS/S parallel airborne stabilized platform. Aerosp. Sci. Technol. 2023, 134, 108163. [Google Scholar] [CrossRef]
- Khan, A.H.; Cao, X.; Li, S.; Katsikis, V.N.; Liao, L. BAS-ADAM: An ADAM based approach to improve the performance of beetle antennae search optimizer. IEEE/CAA J. Autom. Sin. 2020, 7, 461–471. [Google Scholar] [CrossRef]
- Aner, E.A.; Awad, M.I.; Shehata, O.M. Performance evaluation of PSO-PID and PSO-FLC for continuum robot’s developed modeling and control. Sci. Rep. 2024, 14, 733. [Google Scholar] [CrossRef] [PubMed]
- Zhang, J.; Zhang, T.; Zhang, G.; Kong, M. Parameter optimization of PID controller based on an enhanced whale optimization algorithm for AVR system. Oper. Res. 2023, 23, 44. [Google Scholar] [CrossRef]
- Ye, K.; Shu, L.; Xiao, Z.; Li, W. An improved beetle swarm antennae search algorithm based on multiple operators. Soft Comput. 2024, 28, 6555–6570. [Google Scholar] [CrossRef]
- Sasmal, B.; Hussien, A.G.; Das, A.; Dhal, K.G. A comprehensive survey on aquila optimizer. Arch. Comput. Methods Eng. 2023, 30, 4449–4476. [Google Scholar] [CrossRef]
- Ji, T.; Wei, H.; Wang, J.; Tian, S.; Yao, Y.; Hu, S. Research into the Beetle Antennae Optimization-Based PID Servo System Control of an Industrial Robot. Mathematics 2023, 11, 4066. [Google Scholar] [CrossRef]
- Sharma, S.; Bharti, R.K. New efficient Hadoop scheduler: Generalized particle swarm optimization and simulated annealing-dominant resource fairness. Concurr. Comput. Pract. Exp. 2023, 35, e7528. [Google Scholar] [CrossRef]
- Kaya, S. A hybrid firefly and particle swarm optimization algorithm with local search for the problem of municipal solid waste collection: A real-life example. Neural Comput. Appl. 2023, 35, 7107–7124. [Google Scholar] [CrossRef]
- Kanadath, A.; Jothi, J.A.A.; Urolagin, S. Multilevel colonoscopy histopathology image segmentation using particle swarm optimization techniques. SN Comput. Sci. 2023, 4, 427. [Google Scholar] [CrossRef] [PubMed]
- Yu, Y.; Li, J.; Chen, D. Optimal dispatching method for integrated energy system based on robust economic model predictive control considering source–load power interval prediction. Glob. Energy Interconnect. 2022, 5, 564–578. [Google Scholar] [CrossRef]
- Jiyue, E.; Liu, J.; Wan, Z. A novel adaptive algorithm of particle swarm optimization based on the human social learning intelligence. Swarm Evol. Comput. 2023, 80, 101336. [Google Scholar]
- Parque, V.; Khalifa, A. PID Tuning Using Differential Evolution With Success-Based Particle Adaptations. IEEE Access 2023, 11, 136219–136268. [Google Scholar] [CrossRef]
- Zheng, Y.; Sun, R.; Liu, Y.; Wang, Y.; Song, R.; Li, Y. A Hybridization Grey Wolf Optimizer to Identify Parameters of Helical Hydraulic Rotary Actuator. Actuators 2023, 12, 220. [Google Scholar] [CrossRef]
- Hasan, M.K.; Chuah, T.C.; El-Saleh, A.A.; Shafiq, M.; Shaikh, S.A.; Islam, S.; Krichen, M. Constriction factor particle swarm optimization based load balancing and cell association for 5G heterogeneous networks. Comput. Commun. 2021, 180, 328–337. [Google Scholar] [CrossRef]
- Huang, C.; Zhao, Y.; Yan, W.; Liu, Q.; Zhou, J. A new method for predicting crosstalk of random cable bundle based on BAS-BP neural network algorithm. IEEE Access 2020, 8, 20224–20232. [Google Scholar] [CrossRef]
- Ju, X.; Lu, J.; Rong, B.; Jin, H. Parameter identification of displacement model for giant magnetostrictive actuator using differential evolution algorithm. Actuators 2023, 12, 76. [Google Scholar] [CrossRef]
- Naik, R.B.; Singh, U. A review on applications of chaotic maps in pseudo-random number generators and encryption. Ann. Data Sci. 2024, 11, 25–50. [Google Scholar] [CrossRef]
Disclaimer/Publisher’s Note: The statements, opinions and data contained in all publications are solely those of the individual author(s) and contributor(s) and not of MDPI and/or the editor(s). MDPI and/or the editor(s) disclaim responsibility for any injury to people or property resulting from any ideas, methods, instructions or products referred to in the content. |
© 2024 by the authors. Licensee MDPI, Basel, Switzerland. This article is an open access article distributed under the terms and conditions of the Creative Commons Attribution (CC BY) license (https://creativecommons.org/licenses/by/4.0/).