Article

Optimising Sodium Borohydride Reduction of Platinum onto Nafion-117 in the Electroless Plating of Ionic Polymer–Metal Composites

by
Eyman Manaf
1,
Daniel P. Fitzpatrick
1,
Clement L. Higginbotham
1 and
John G. Lyons
2,*
1
PRISM Research Institute, Technological University of the Shannon, N37 HD68 Athlone, Ireland
2
Faculty of Engineering & Informatics, Technological University of the Shannon, N37 HD68 Athlone, Ireland
*
Author to whom correspondence should be addressed.
Actuators 2024, 13(9), 350; https://doi.org/10.3390/act13090350
Submission received: 11 July 2024 / Revised: 4 September 2024 / Accepted: 7 September 2024 / Published: 10 September 2024
(This article belongs to the Special Issue Electroactive Polymer (EAP) for Actuators and Sensors Applications)

Abstract

:
The effects of process parameters on the electroless plating of ionic polymer–metal composites (IPMCs) were studied in this work. Specifically, the NaBH4 reduction of platinum onto Nafion-117 was characterised. The effects of the concurrent variation of NaBH4 concentration, stir time and temperature on surface resistance were studied through a full factorial design. The three-factor three-level factorial design resulted in 27 runs. Surface resistance was measured using a four-point probe. A regression model with an R2 value of 97.45% was obtained. Surface resistance was found to decrease with increasing stir time (20 to 60 min) and temperature (20 to 60 °C). These responses were attributed to increased platinisation rates, resulting in more uniform electrode deposition, confirmed by scanning electron microscopy (SEM) and energy-dispersive X-ray (EDAX) analysis. Surface resistance decreased, going from 1% to 5% NaBH4 concentration, but increased from 5% to 10% concentration. This behaviour was attributed to surface morphology: increased grain size inducing porous electrodes, in line with findings in the literature. The maximum tip displacement, measured through a computer vision system, as well as the maximum blocking force, measured through an analytical balance setup, were obtained for all 27 samples. The varying results were discussed with regards to surface and cross-sectional SEMs, alongside EDAX analysis.

1. Introduction

The conventional and preferred chemical method of manufacturing ionic polymer–metal composites (IPMCs) is through electroless plating due to good bonding between the electrodes and the Nafion membrane [1]. Electroless plating is a controlled autocatalytic deposition of a continuous layer on a catalytic surface in the presence of a complex compound and reducing agent [2]. The chemical deposition of platinum onto Nafion was first described in a 1980 patent by H. Takenaka and E. Torikai [3]. Known as the Takenaka–Torikai method, the plating utilised tetraammineplatinum(II) chloride (Pt-Ammine) as the metal complex and sodium borohydride as the primary reducing agent. The platinisation was carried out by suspending the Nafion membrane in-between two chambers, with one side filled with the metal complex, the other with the reducing agent. The reducing agent on one side of the chamber penetrates the Nafion membrane through osmosis and is introduced to the Pt-Ammine in the other chamber, initiating platinisation on the membrane surface. This method was surpassed by Fedkiw et al. in 1989 when they introduced an impregnation–reduction method which involved soaking the Nafion in the metal complex to exchange ions, and using sodium borohydride to reduce the impregnated Pt atoms [4]. Despite non-standardisation, with reported methods varying in terms of process parameters such as the concentrations of reagents used, stirring time, soaking time and many more, the electroless plating of IPMCs generally follows four main stages: pre-treatment, ion-exchange, reduction and post-treatment.
The process of the platinum reduction of IPMCs involves two stages of reduction: primary reduction and secondary reduction. The detailed instructions provided by Kim and Shahinpoor [5] utilise sodium borohydride (NaBH4) as the main reducing agent to initiate platinum adsorption onto a Nafion-117 film. The membrane previously soaked in Pt-Ammine is placed in an aqueous solution of 5% sodium borohydride at 60 °C. The translucent Nafion film turns blackish-silver, signalling platinum deposition. The chemical reaction of the primary reduction is as given in Equation (1) [6].
N a B H 4 + 4   P t ( N H 3 ) 4 2 + + 8 O H   4 P t 0 + 16 N H 3 + N a B O 2 + 6 H 2 O
Several works have looked at optimising different stages of the electroless plating of IPMCs. One prominent work is the study performed by Kim et al. examining the effect of 13 factors on the performance of IPMCs (characterised by maximum force produced) through a Taguchi design [5]. The 13 factors encompass various factors from all of the stages in the electroless plating of IPMCs. In the first reduction stage using lithium borohydride, they considered three factors: concentration of the reducing agent, the reduction bath temperature and the reduction/stirring time. Through the Taguchi design, each of those factors were studied at three varying levels. However, in the published article, the levels were not specified and were only denoted as level 1, level 2 and level 3. Without the exact values for each of those levels, it is difficult to infer conclusive results from the given signal-to-noise ratio (S/N) response graphs. It also makes the replication and verification of the optimisation difficult for other researchers. Furthermore, the Taguchi design employed focused more on maximising force as opposed to the effects of the different process parameters on the force produced. This resulted in the authors not delving too deeply into the reaction kinetics of each of the 13 process parameters studied. However, the work carried out by Kim and Shahinpoor acts as a strong foundation towards the optimisation of the electroless plating of IPMCs.
A similar work by Rashid and Shahinpoor also looked at force optimisation through the use of an orthogonal array method, analysing 13 process variables in the manufacturing of IPMCs, with each variable studied at three different levels [7]. However, for the 13 process variables studied, it was not stated which variables belonged to which stage, making it hard to discern which processes are involved in the first reduction stage. Despite providing details of the levels used, individual effects of the variables on the force produced as the levels were varied were not given.
Similarly, Yip et al. utilised the same Taguchi design to optimise maximum tip force based on four factors: surface roughening, first reduction time interval, first reduction amount and second reduction time interval [8]. They concluded that all the factors, except surface roughening, were significant in determining the maximum tip force. No analysis or discussions were made regarding the individual effects of those factors and their interactions on the performance of IPMCs.
Another work by Rashid et al. investigated varying concentrations of tetraammineplatinum(II) chloride and sodium borohydride at different reaction temperatures in the impregnation–reduction of IPMCs [9]. A one-factor-at-a-time (OFAT) approach was taken in studying the factors, with Pt-Ammine and sodium borohydride concentrations in the range of 5–40 mM and 20–100 mM, respectively. The reactions were investigated at temperature values of 5, 25 and 50 °C. Due to the OFAT approach taken, the optimum conditions found by the authors could not be reliably trusted since OFAT does not consider the whole experimental environment compared to a design of experiment approach.
The different configurations of the ion-exchange stage in the electroless plating of IPMCs found in the literature is summarised in Table 1.

2. Materials and Methods

2.1. IPMC Preparation

Nafion-117 films, obtained from Ion Power Gmbh, (Munich, Germany) were cut into strips of 10 × 50 mm. The strips were roughened using a 400-grit sandpaper on a specially built hand-sander (Figure 1), 150 cycles on each side of the membrane (forward and backwards counts as one cycle), employing the grid method [12,18]. The membranes were then ultrasonicated using a Clifton MU-14 ultrasonic bath (Nickel-Electro Ltd, Weston-super-Mare, UK.) for 30 min with deionised water as the medium. They were then boiled in 2 M hydrochloric acid (HCl) and deionised water for 30 min, respectively.
According to previous experimentation [19], the recommended configurations for optimised Nafion-117 sorption of tetraammineplatinum(II) chloride (98% purity, St. Louis, MO, USA) in the platinisation of IPMCs were found to be as follows: 1.0 g/L Pt-Ammine concentration, 24 h soak time, pH of 3 and temperature of approximately 20 °C. The Nafion-117 strips were soaked according to the prescribed settings. Further platinisation of IPMCs was carried out through NaBH4 (98% purity, Fair Lawn, NJ, USA) reduction.

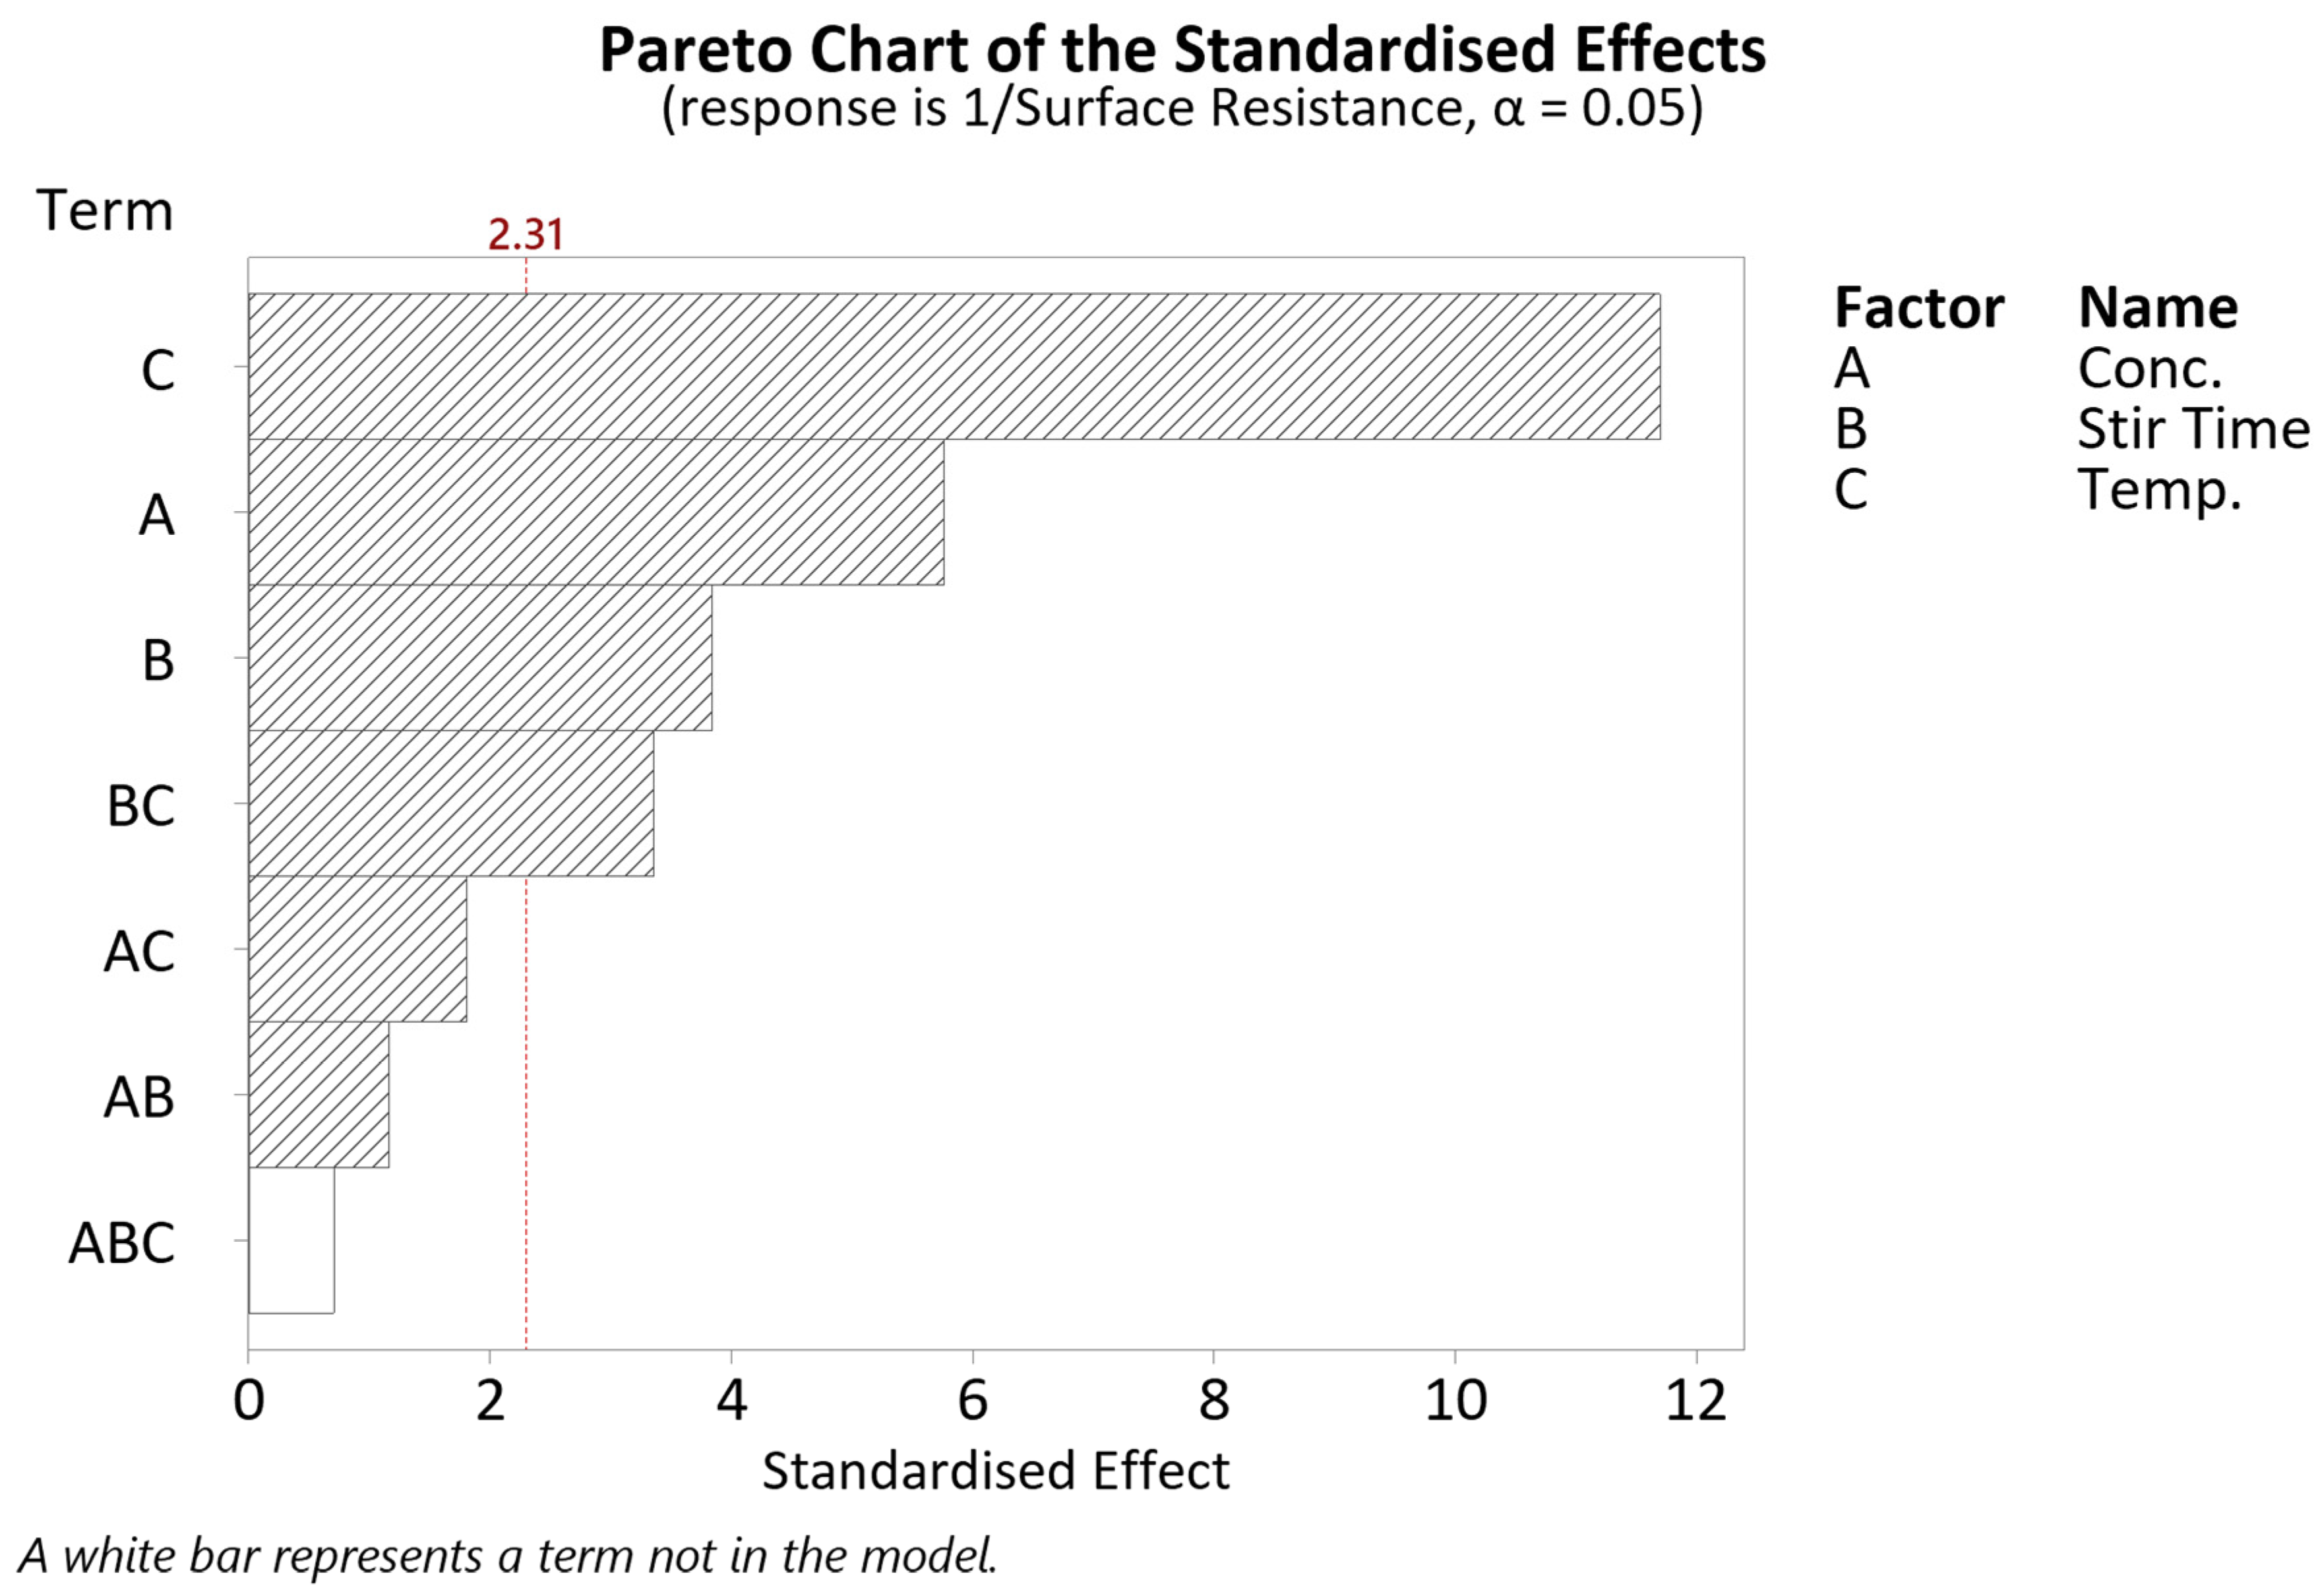
2.2. Full Factorial Design for Sodium Borohydride Reduction

A design of experiments (DOE) approach was employed to study the effects of simultaneous variation of NaBH4 concentration, stir time and temperature on the platinisation of IPMCs. A 3-level full factorial design was carried out consisting of 27 runs. The factors and their respective levels are given in Table 2.
Each sample was reduced in 100 mL of NaBH4 solution at the varied settings of the DOE. A summarised methodology of IPMC sample preparation and platinisation is given in Figure 2.

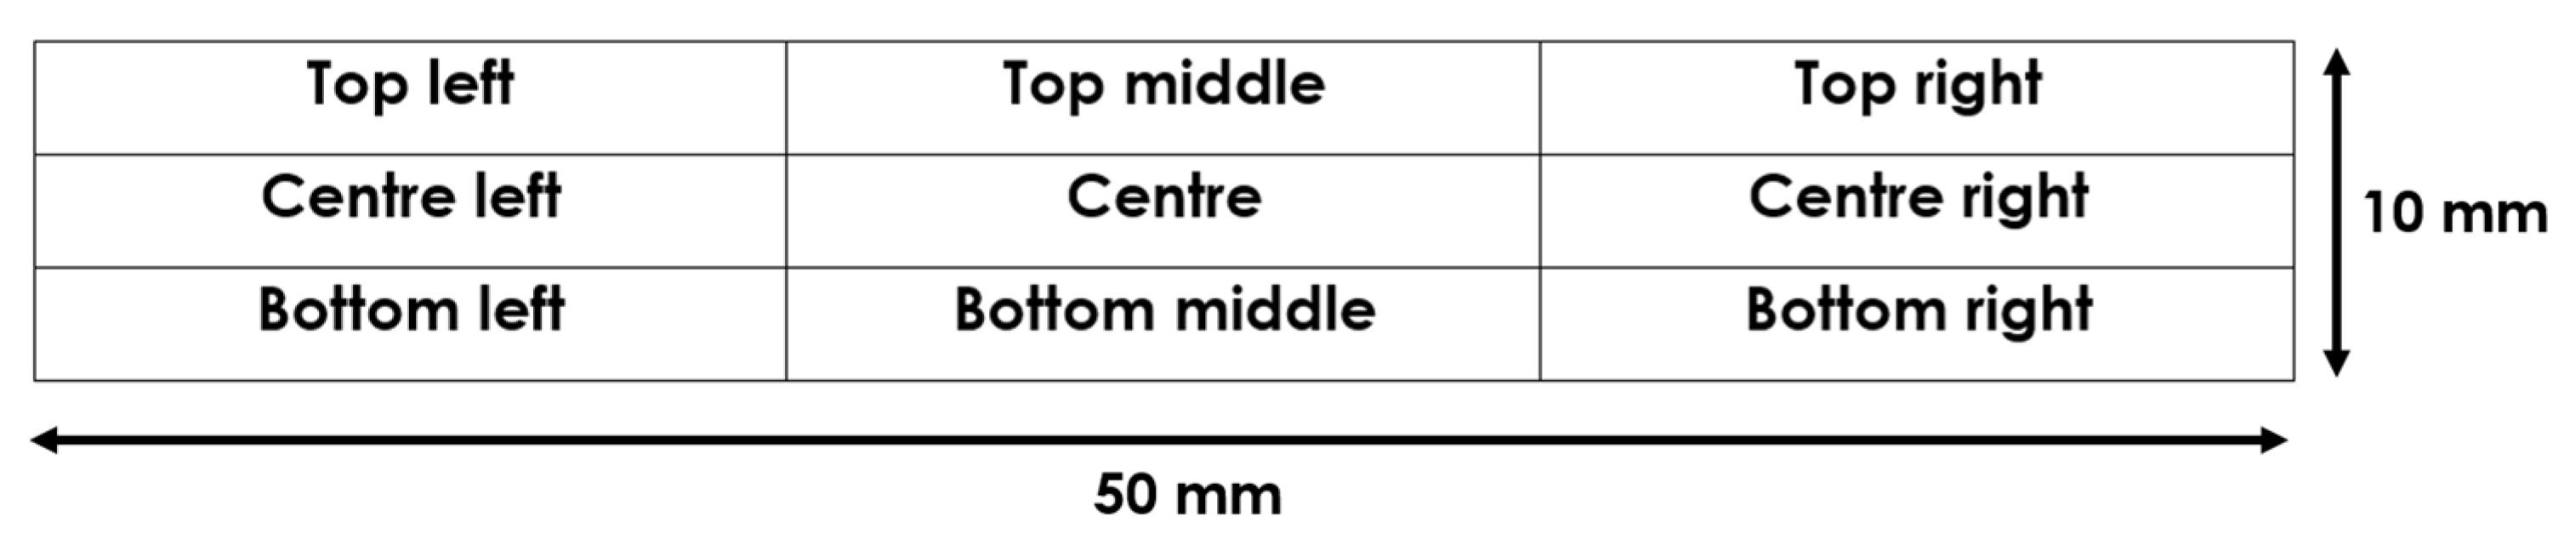
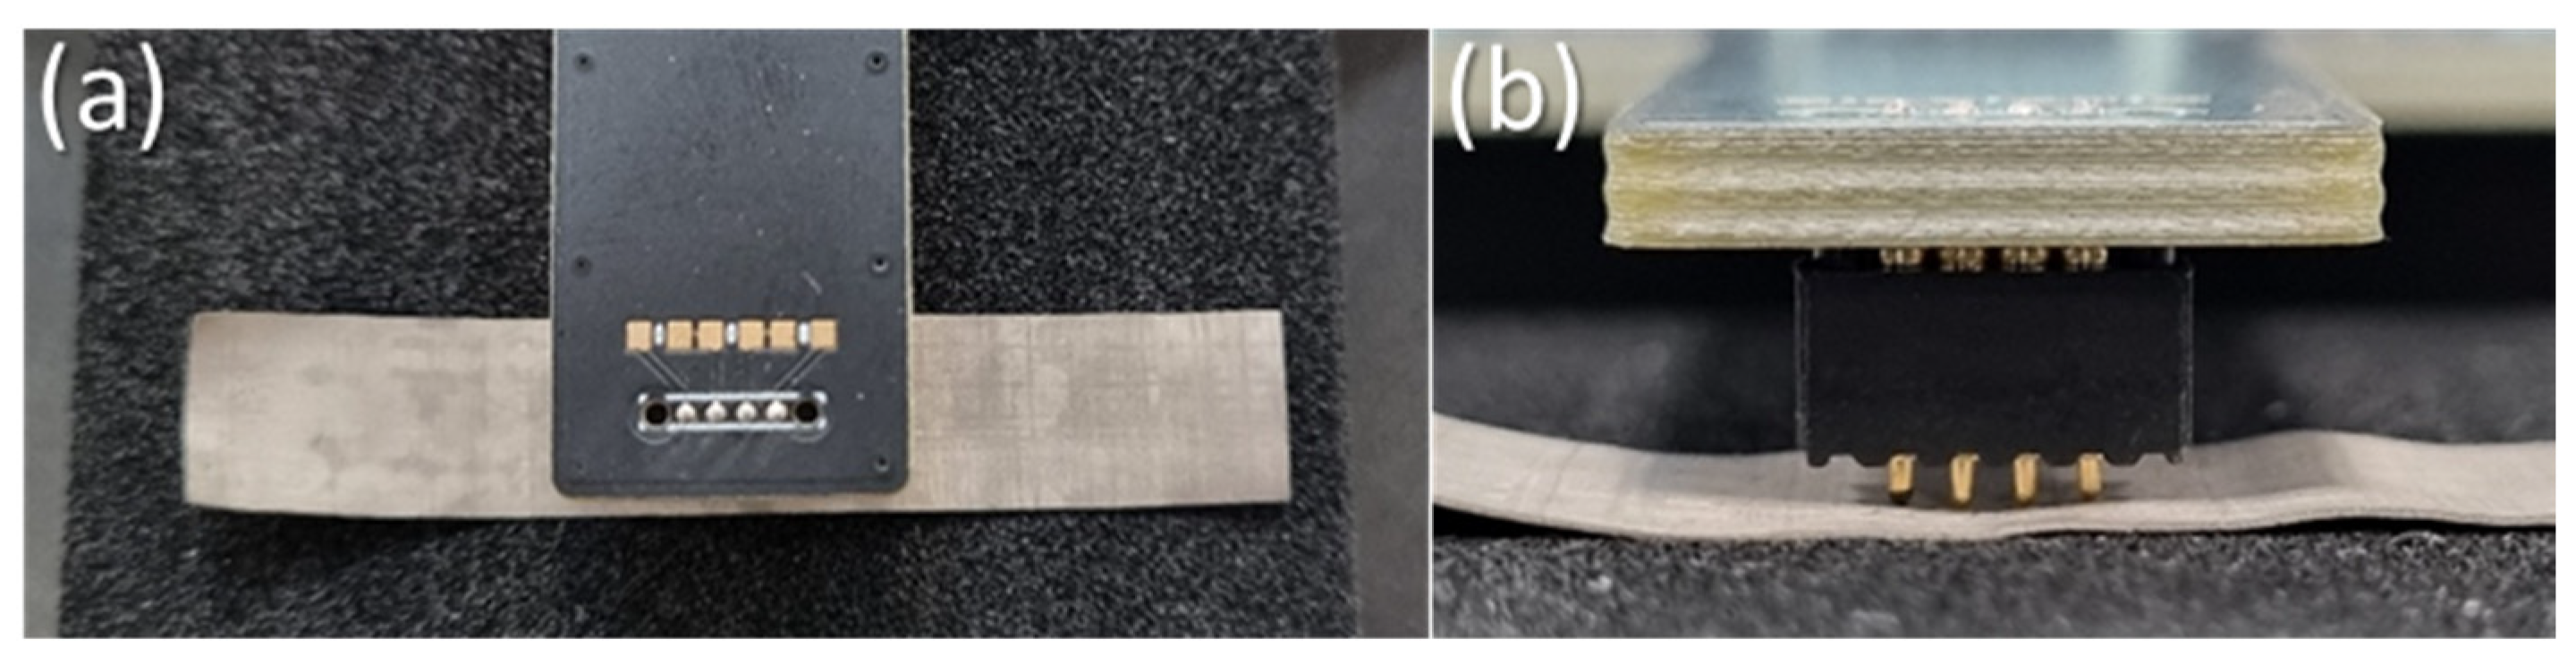
2.3. Surface Resistance Measurements

IPMC samples were divided into nine regions for surface resistance measurements, as shown in Figure 3.
Surface resistance was measured using an Ossila Four Point Probe (Ossila B.V., Leiden, the Netherlands). An average of 100 surface resistance measurements were taken for each region. Each region was centred beneath the probes, aligning the longer edge parallel to the probes (Figure 4a). The platform was raised until the probes contacted the samples and mostly retracted back into the casing (Figure 4b).
Measurement variations between regions for each sample were quantified using the coefficient of variation (CV). CV is calculated through Equation (2), whereby σ is the population standard deviation and μ is the population mean. A CV calculation example is given in Appendix A using raw data of surface resistance measurements given in Table A1.
C V = σ μ × 100

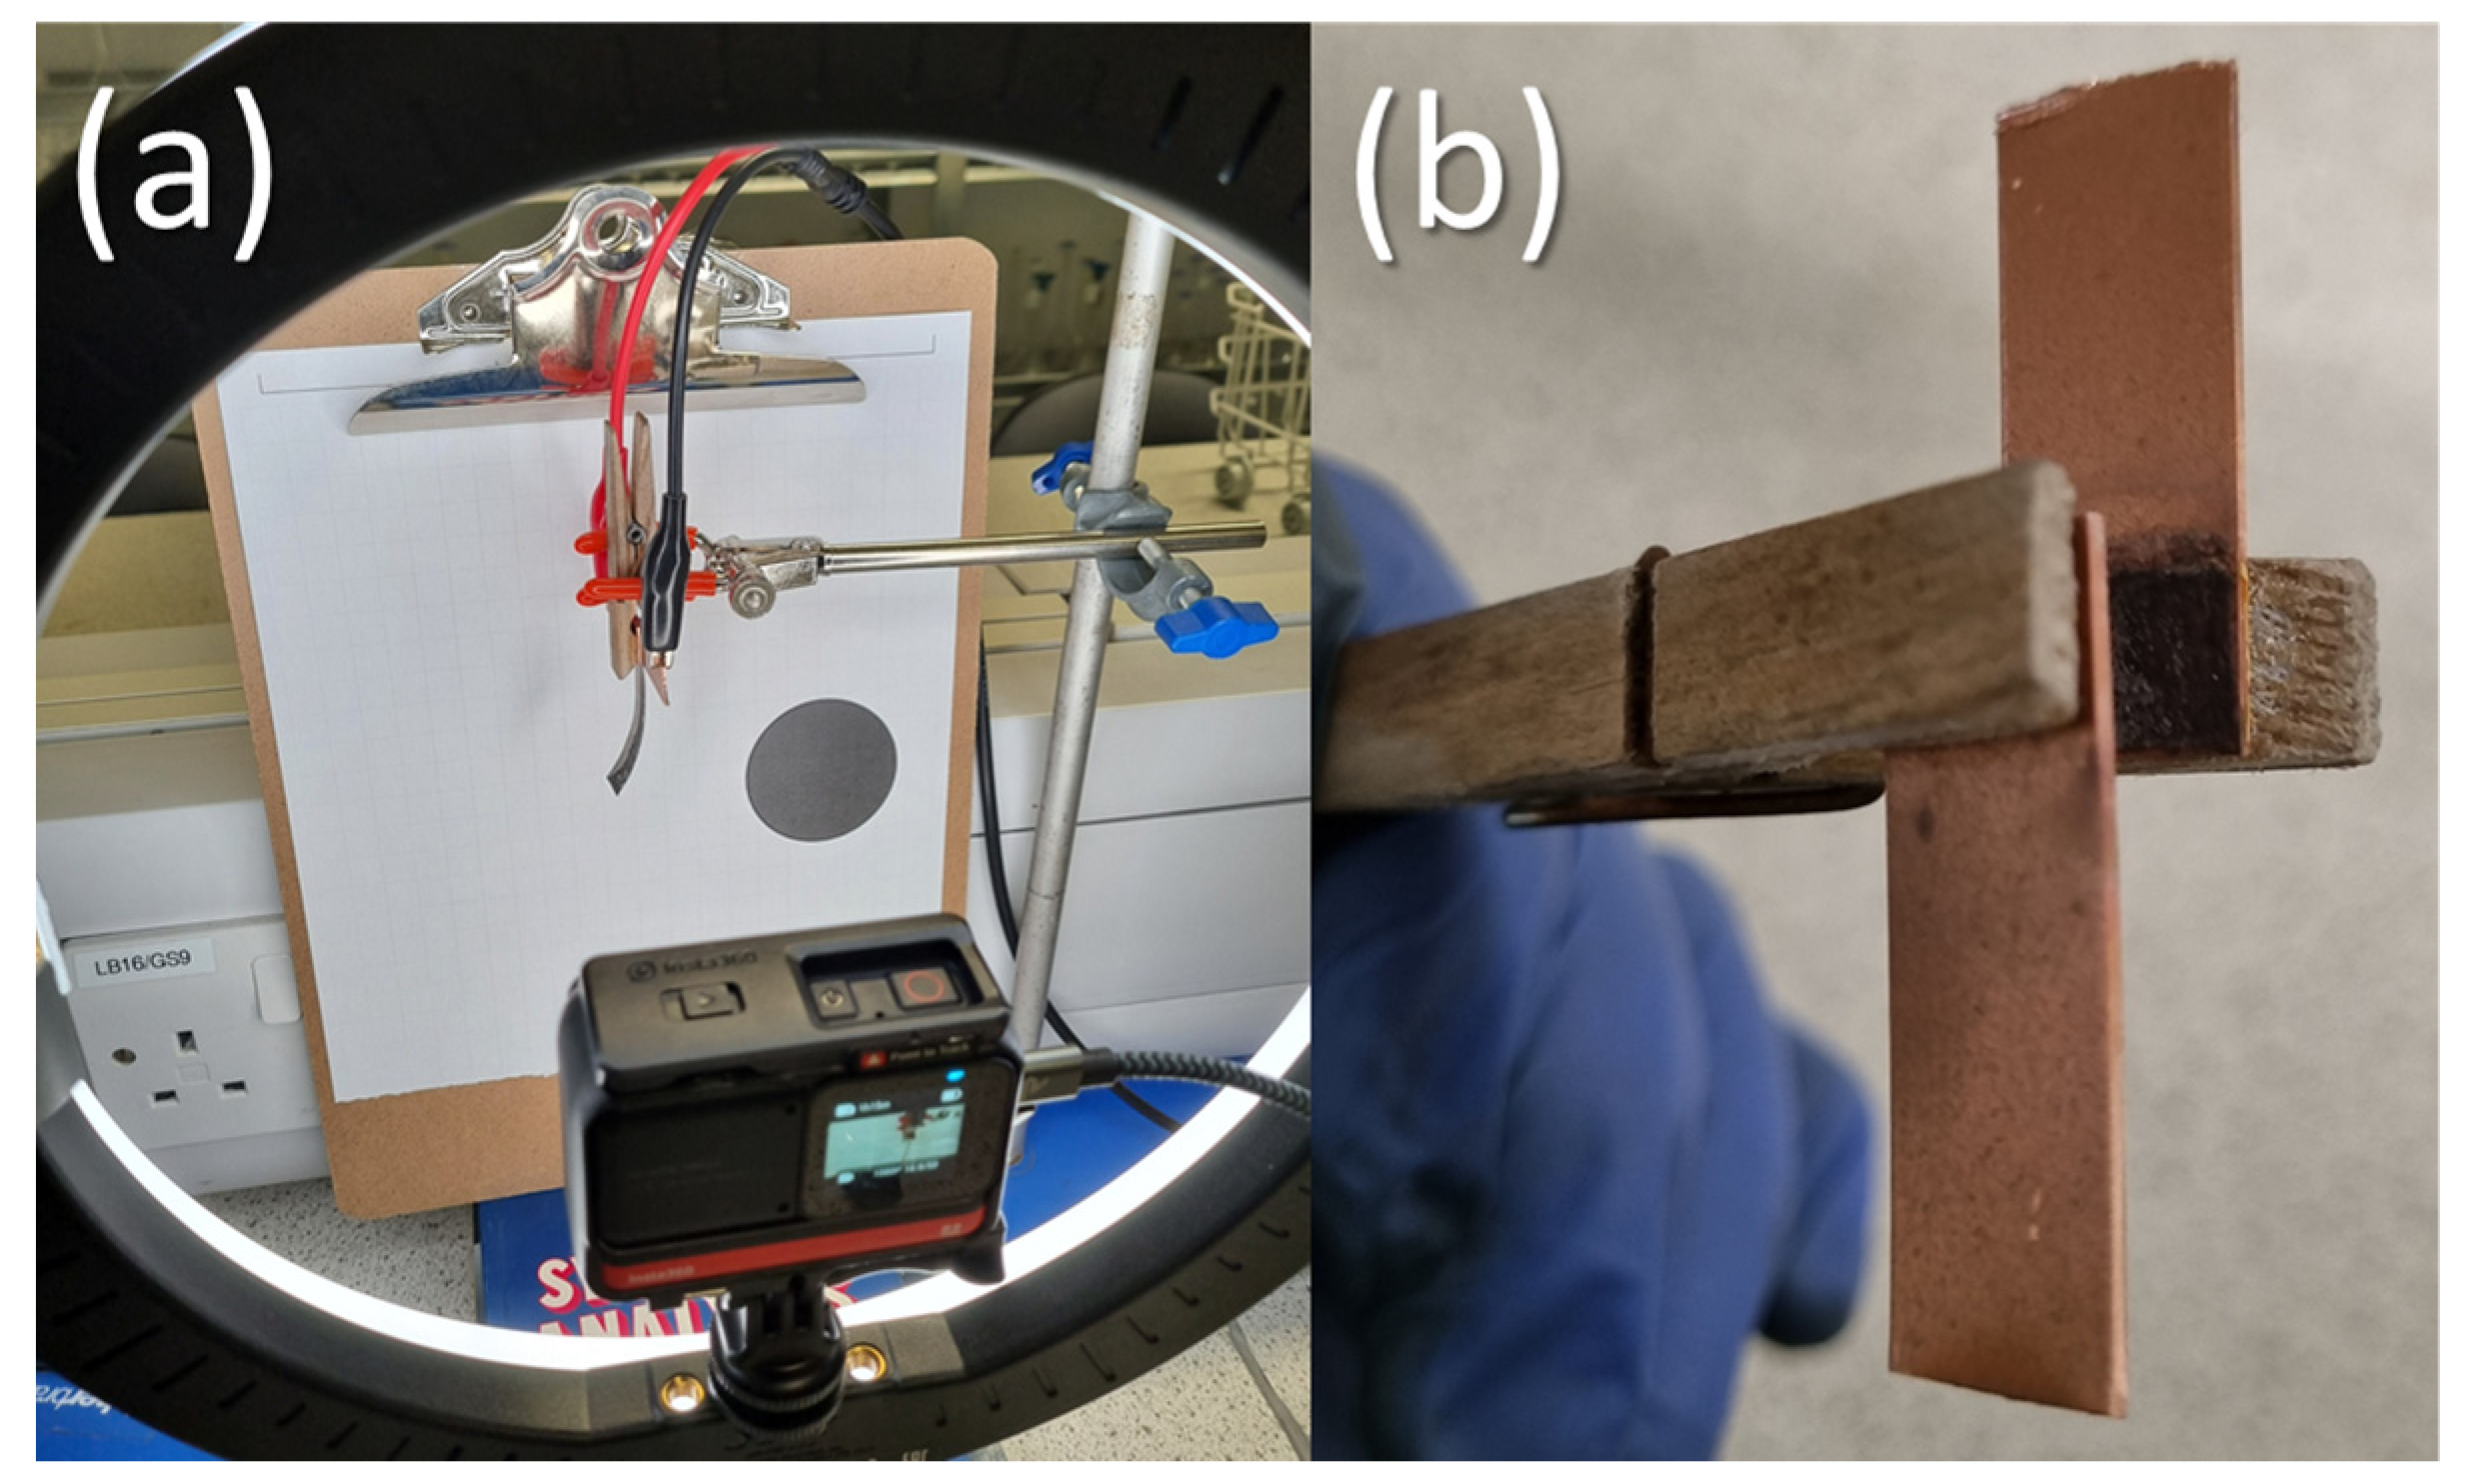
2.4. IPMC Displacement Measurement

Maximum IPMC displacement was measured using a previously developed computer vision system [20]. Briefly, an Insta360 One R camera (Insta360, Shenzen, China) mounted with the 4 K wide-angle lens with F2.8 aperture was used. The narrow FOV was chosen. The resolution was set to 1080 p recording at 50 fps. A JOBY Beamo 12” ring light (JOBY, London, UK) was used as a light source at the 5600 K colour temperature mode, set to the maximum intensity level. Approximately 10 mm of the sample length was clamped to copper plates, with one side attached to the negative terminal of the power supply and the other attached to the positive terminal (as shown in Figure 5).

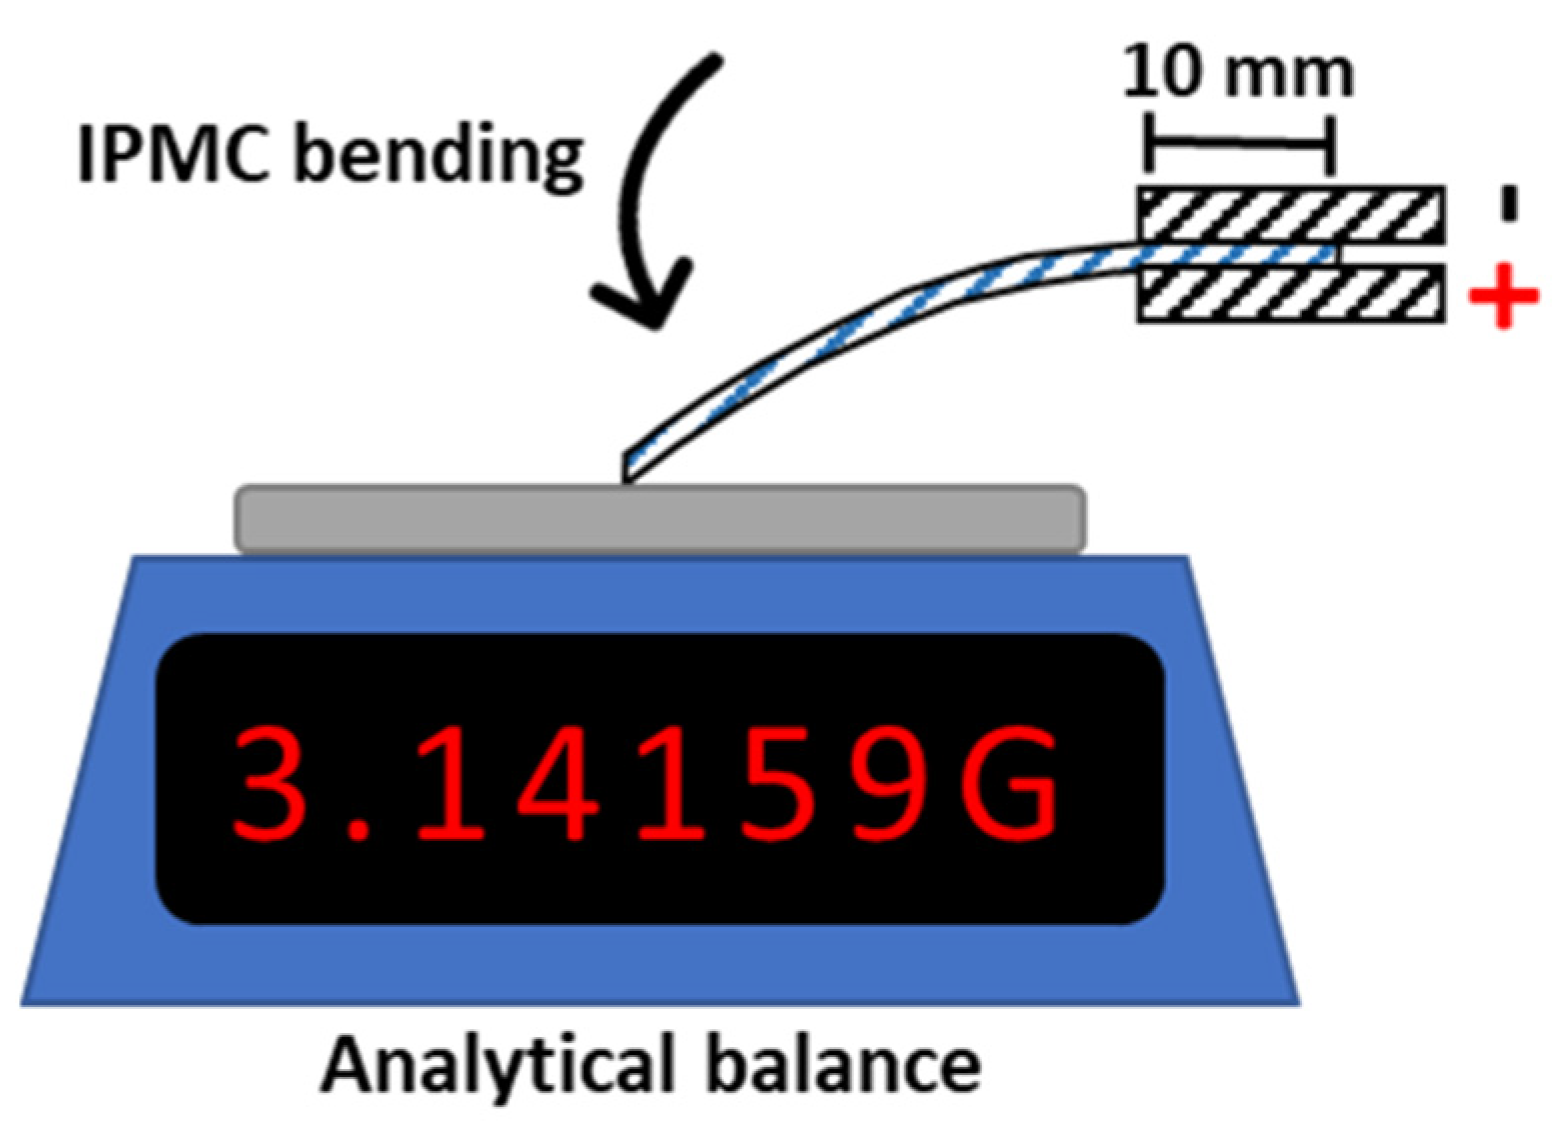
2.5. IPMC Blocking Force Measurement

The schematic for blocking force measurement is given in Figure 6. Generated mass readings in this study typically range up to 103 milligrams. Blocking force (F), given in mN, was calculated according to Equation (3), where m is the mass generated from the analytical balance in grams and g is Earth’s gravitational constant of 9.81 m/s2 [6,18].
F = mg
A Denver Instrument TP-1502 analytical balance (Denver Instrument, Bohemia, NY, USA) was used to measure blocking force. A Rapid PS3025 DC power supply (Rapid Electronics, Colchester, UK) was used to apply 9 V to the samples. Voltage was applied through 1 mm copper plates (Figure 5b) clamping approximately 10 mm of the sample length. The samples were set up in a way that they are nearly touching the balance. Zeroing the scale with the sample touching the balance was found to be difficult as the mass fluctuated.

2.6. Scanning Electron Microscopy

Surface and cross-sectional morphologies were examined through a TESCAN MIRA XMU with 20 kv voltage. Back-scattered electron (BSE) detection was used for both surface morphology and cross-section morphology analysis. For cross-section analysis, the samples were hand-cut using microtome blades (Leica Biosystems, Deer Park, IL, USA). The samples were sputter-coated with gold using an Agar Sputter Coater (Agar Scientific, Stansted, UK), at a current of 30 mA and sputter time of 55 s. The samples were adhered to sample holders by carbon tape. After exposing the prepared samples to electron beam radiation in vacuum condition, images were captured at various magnifications. Energy-dispersive X-ray (EDAX) analysis was employed alongside SEM imaging for the elemental mapping of IPMCs.

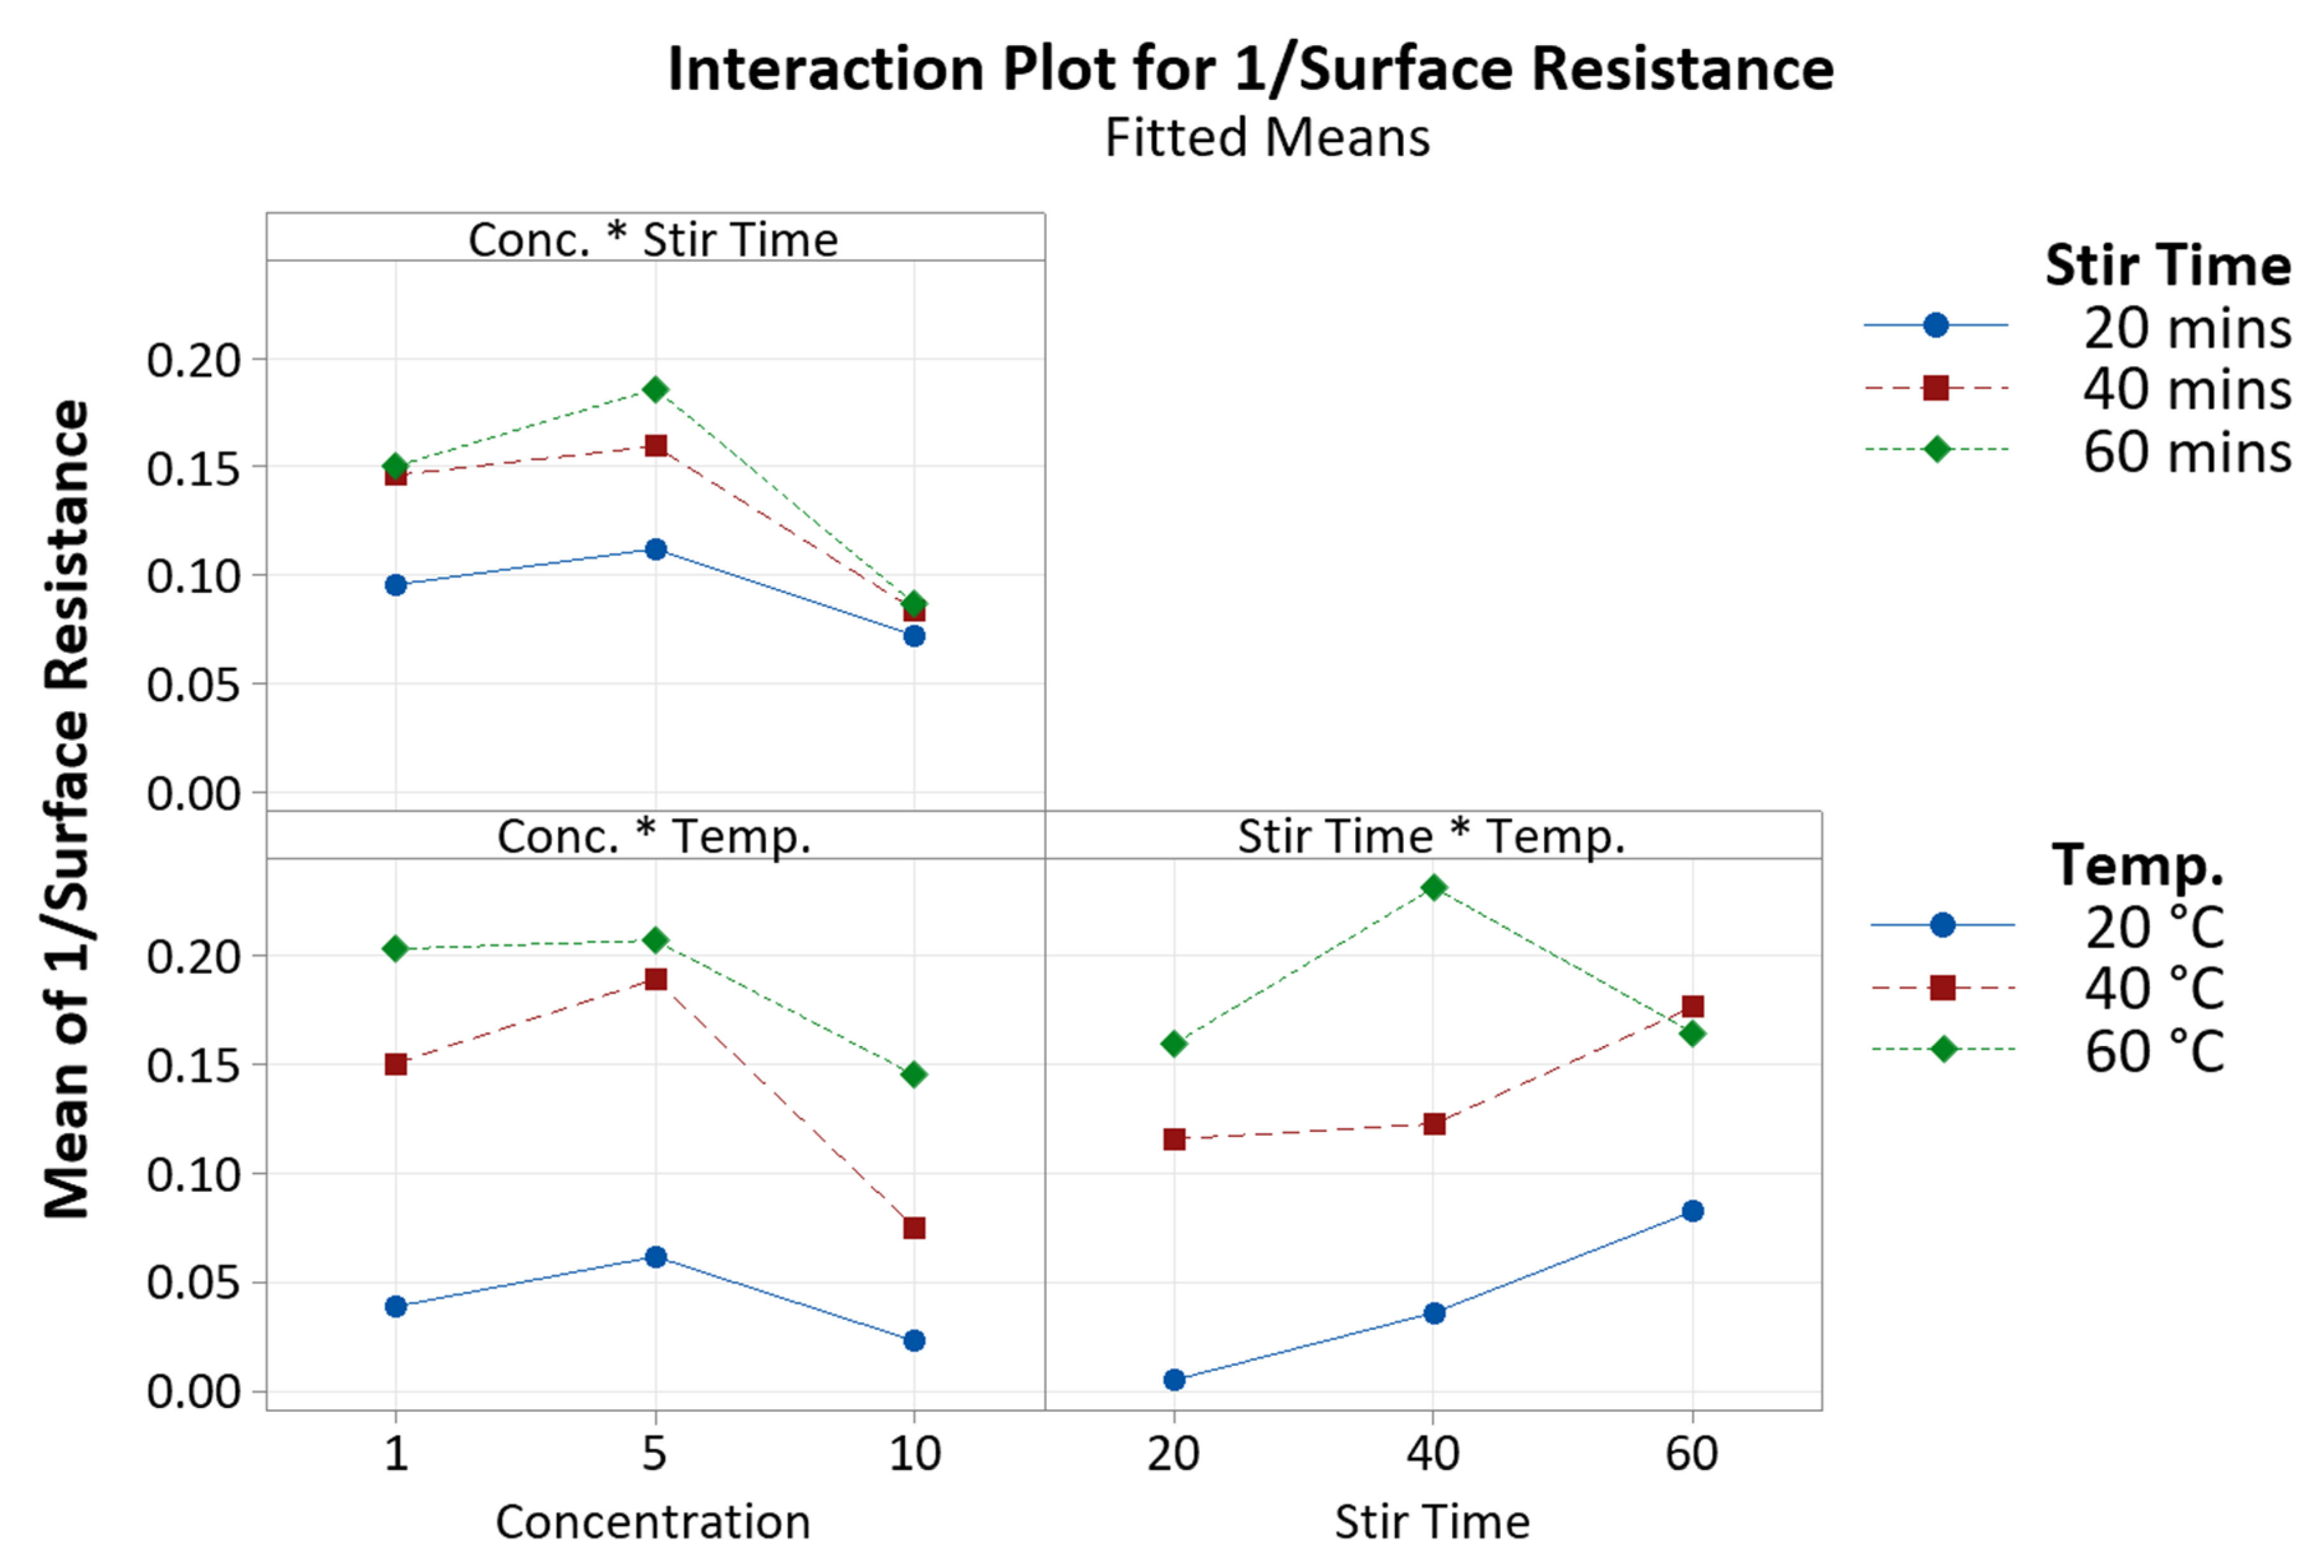
3. Results and Discussion
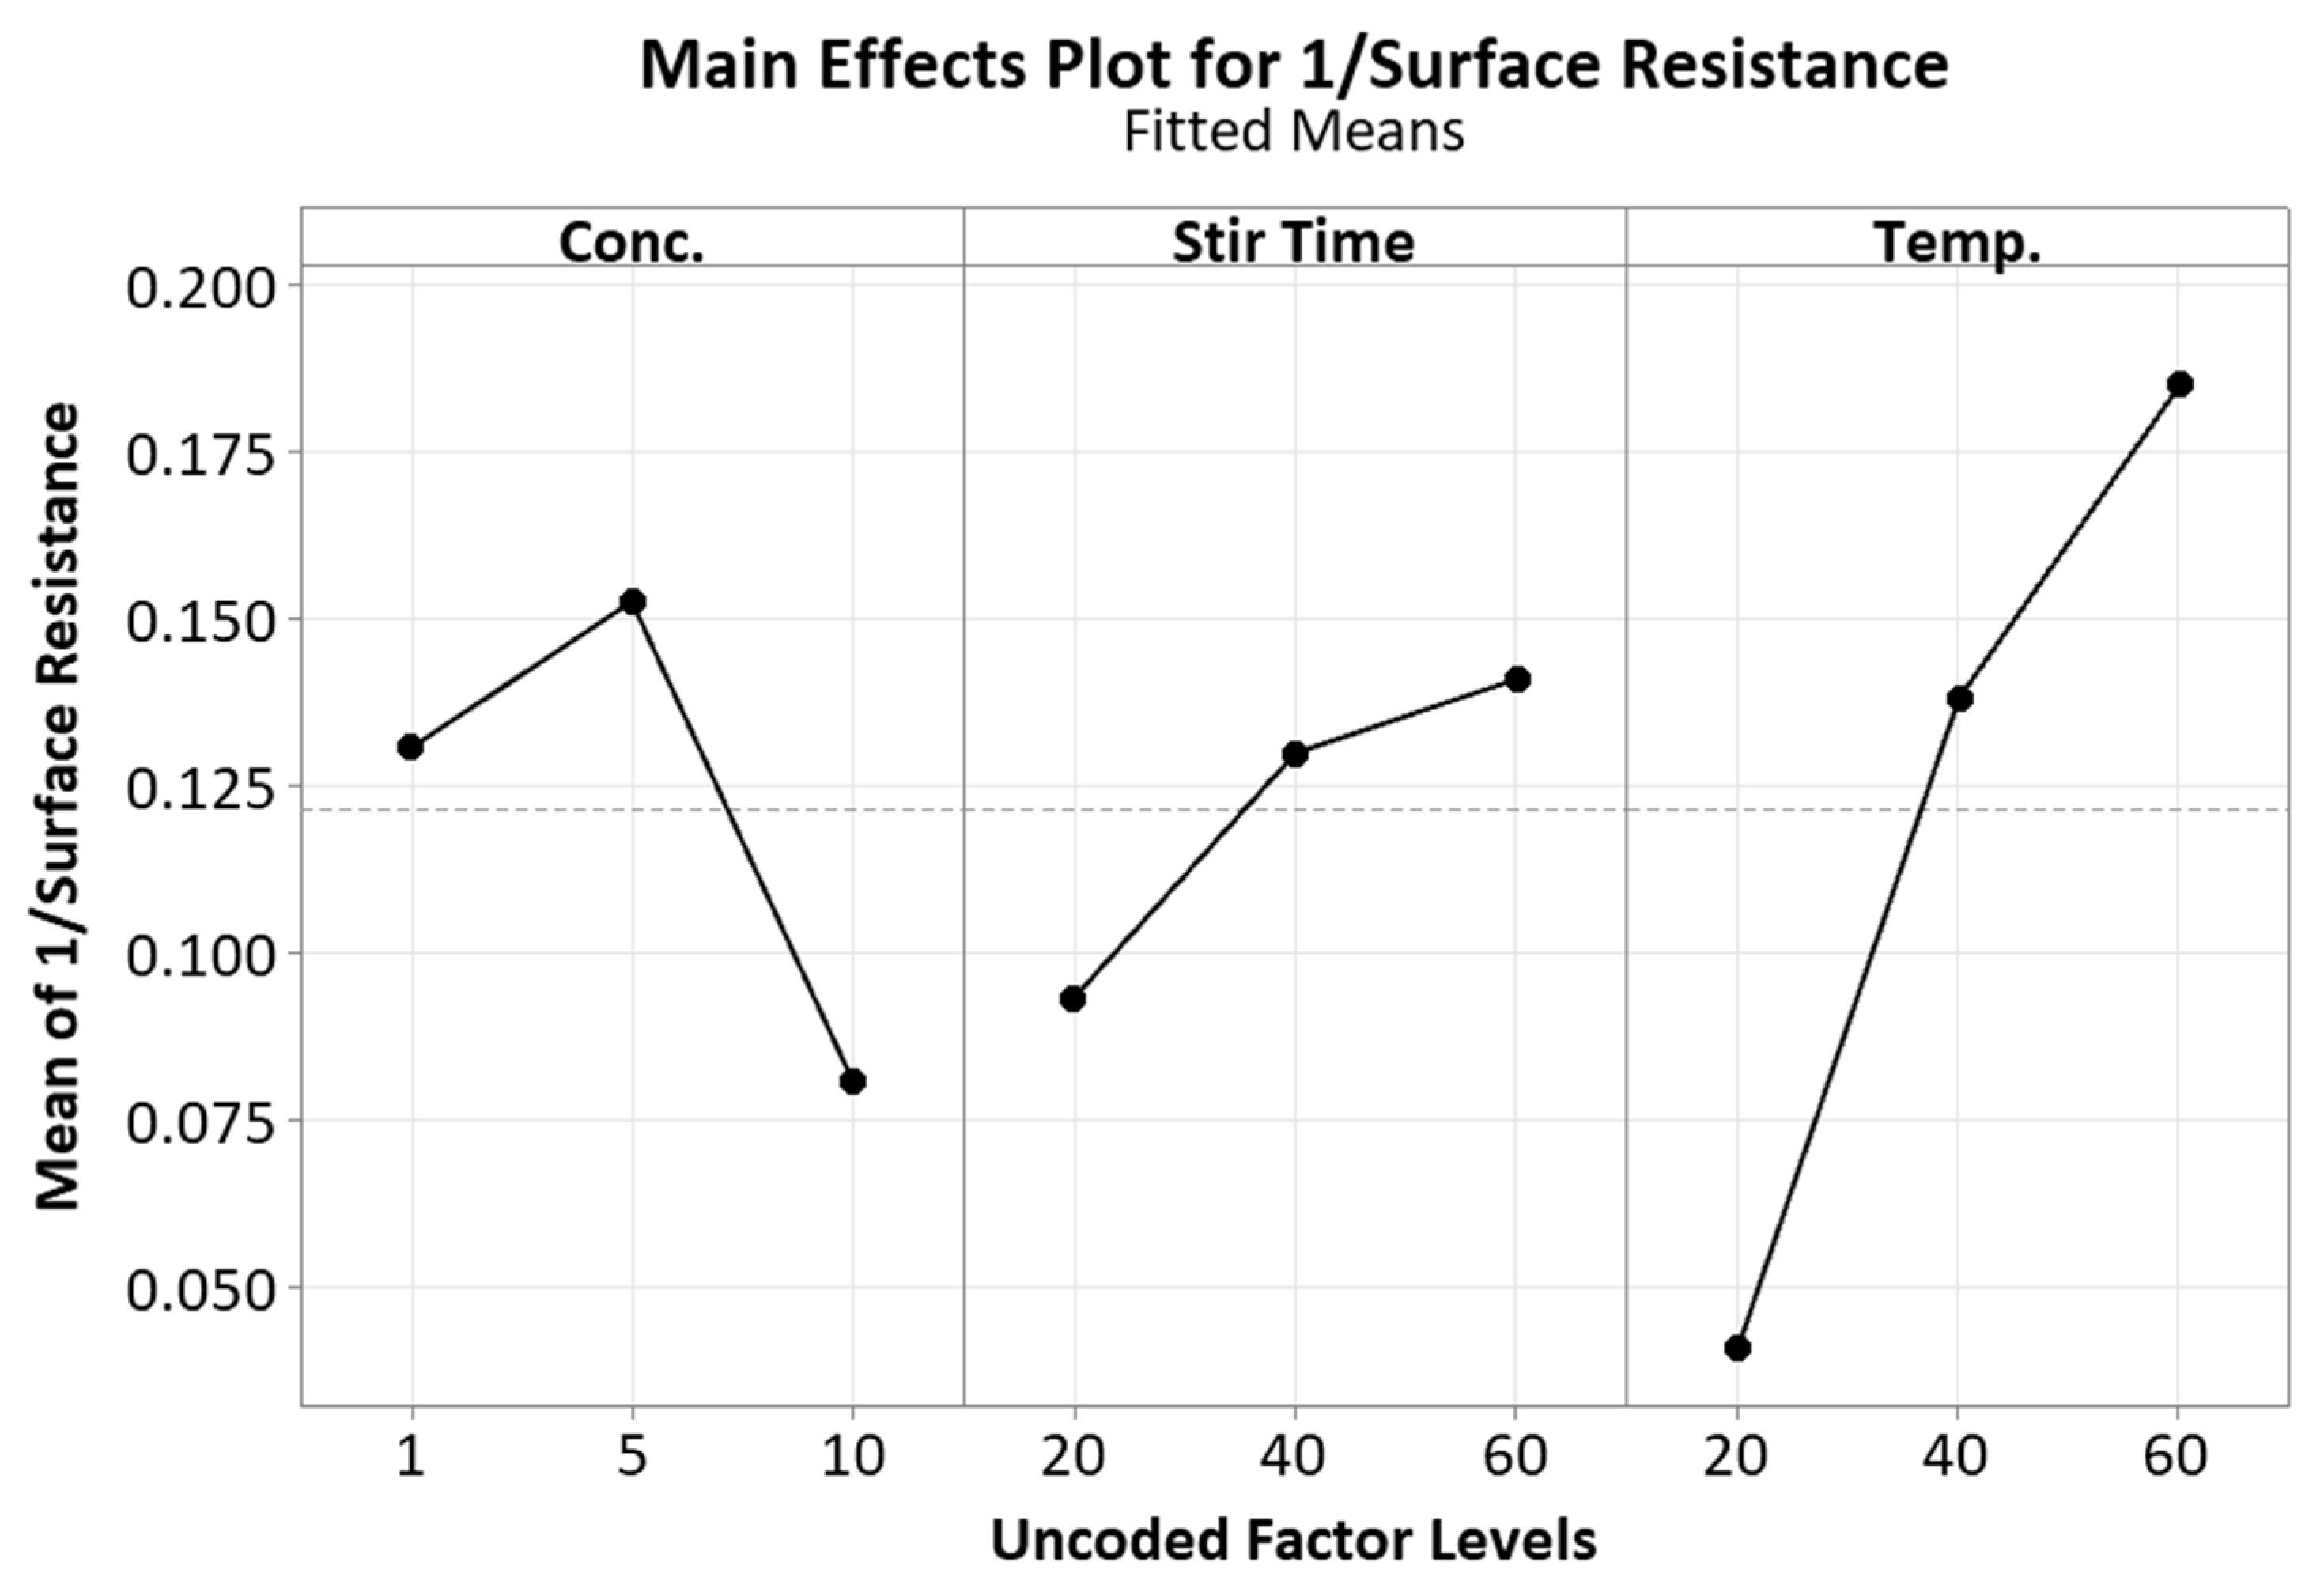
The full factorial analysis included only up to second-order terms, since incorporating third-order terms would result in a saturated model. Data transformation was carried out on the response to better fit the model. The reciprocal of surface resistance was used as the dependent variable in the linear regression analysis. The model yielded an R2 value of 97.45%. The regression equation is given in Table A2. Figure 7 shows a Pareto chart with absolute values of standardised effects, from largest to smallest, indicating the relative strength of effects, alongside a reference line indicating which effects are statistically significant. From Figure 7, statistically significant terms include temperature (C), concentration (A), stir time (B), and the interaction between stir time and temperature (BC).
The significance of the main terms are also reflected in the main effects plot given in Figure 8; all three main effects have a considerable line slope as opposed to having a horizontal response. The main effects plot can be used to compare the relative strength of the effects of the different factors. As mentioned, a lower electrode surface resistance is desirable for better IPMC performance. Henceforth, since the reciprocal of surface resistance (SR−1) is used in the analysis, the higher the number the better. Both Figure 7 and Figure 8 indicate that temperature had the most significant effect on SR−1.

3.1. Concentration

Referring to the main effects plot in Figure 8, the mean SR−1 increases slightly, going from a concentration of 1% to 5%. However, there is a drastic drop in the mean SR−1 from 5% to 10% NaBH4 concentration, meaning higher surface resistance. This is contrary to findings by Rashid et al. They reported a decrease in surface resistance with an increase in NaBH4 concentration in the range of 20 mM to 100 mM (2% to 10% concentration). However, it is noteworthy that they carried out a one-factor-at-a-time approach, keeping temperature and reduction time at a constant 50 °C and 2 h, respectively [9]. Furthermore, the NaBH4 solutions were replaced every 20 min within those 2 h. Interestingly, they performed electrochemically active surface area (Sa) measurements through cyclic voltammetry at varying NaBH4 concentrations. The Sa measurements peaked at a 60 mM (6%) concentration, whereas they were low at 20 mM and 100 mM. Rashid et al. attributed this to different microstructures and electrode porosity at the different concentrations. They found that average platinum grain increased with an increase in NaBH4 concentration. Similarly, in a study on the effect of NaBH4 concentration and synthesis temperature on a palladium–carbon catalyst, Chen et al. elucidated that too-rapid of a reduction rate would cause an uneven aggregation of palladium particles, resulting in a cluster size increase and a decrease in uniformity [21].
Another explanation for the drop in the mean SR−1 from 5% to 10% concentration could be the agglomeration of borohydride cations, lessening the amount available for the reduction process to occur. However, considering that NaBH4 is an ionic compound, it fully dissociates in water and would be solvated by water molecules. Agglomeration seems unlikely since the ions are homogenously dispersed.

3.2. Stir Time

As evident from the main effects plot, SR−1 increases with soak time. As more of the sorped Pt2+ are exposed to the borohydride ions, more Pt0 atoms are generated. However, the increase in SR−1 from 40 to 60 min is marginally relative to the increase from 20 to 40 min. This may be due to (1) most of the accessible Pt2+ in the sulfonic acid sites having been reduced, decreasing the platinisation rate; and (2) the decrease in borohydride ions as NaBH4 hydrolyses producing hydrogen gas, as per Equation (4) [22].
B H 4 + 4 H 2 O     B ( O H ) 4 + 4 H 2
It was observed that all the samples that were removed after 20 min of stir time had effervescence coming off the samples, as shown in Figure 9, most likely from the ammonia gas being produced. This indicates that the end point of the reaction has not been reached.

3.3. Temperature

Increasing the temperature from 20 °C to 60 °C results in higher SR−1, i.e., surface resistance decreases with an increase in temperature. This is in line with the results found by Rashid et al. and Lee et al. [9,23]. The rate of reaction increases with temperature: more energy results in more elemental platinum produced and deposited onto the Nafion-117 strip within a time period. Furthermore, increased kinetic energy from the heat would allow for the deeper sorped platinum cations to be accessible by the borohydride anions, producing more Pt0 [23]. Relative to the other main effects, the steep line for temperature in the main effects plot indicates a great magnitude effect on SR−1. This is supported by the Pareto chart given in Figure 7, indicating temperature to have the most significant effect on SR−1. This is in line with the findings by Rashid et al., where they found the sheet resistance to steeply decrease with increasing temperature in the range of 5 °C to 50 °C [9].
It was observed that some samples stirred at 20 °C stained beakers with platinum streaks, as shown in Figure 10. Physical agitation from stirring most likely caused the physisorped Pt cations on the Nafion strips to be displaced and adsorbed onto the beaker walls, further reduced to elemental Pt by NaBH4. Reduction kinetics at that temperature could be slow enough, allowing for the Pt cations to be displaced from physical agitation. Another possibility is the desorption of elemental platinum from the Nafion surface. However, if this were the case, the particles would be seen floating in the remaining solution instead of staining the inside walls of the beaker.
This phenomenon was not observed for samples reduced at higher temperatures of 40 °C and 60 °C. It is possible that higher temperatures induce higher platinisation rates, reducing the desorption of Pt cations from the Nafion-117 membrane. Further, it was experimentally observed that the reduction process is exothermic from the increase in temperature as the sample was placed into the borohydride solution.
The pictures of all the platinised samples are given in Figure 11. It is clear that the platinum electrode deposition is not homogenous, with samples having regions and spots of different colours and shading. The uneven coating is also evident from the CV measurements given in Table 3, with the lowest being 39.9% for FF27. This unevenness could possibly be from the non-uniform sanding of the Nafion-117 surface and/or suboptimal fluid dynamics of the plating bath. The non-homogenous platinisation would result in uneven charge distribution along the length of the material, affecting transducing potential [24].
The regression estimated that the interaction between stir time and temperature (BC) is significant, with a p-value of 0.01 (Table A3). This indicates that the effects of stir time on the mean SR−1 are dependent on temperature, and vice versa. Examining the interaction plot in Figure 12, it can be seen that increasing temperature from 20 °C to 40 °C with increasing stir time yields a parallel response, exhibiting an increased mean SR−1. However, at 60 °C, the increase in the mean SR−1 happens from 20 to 40 min, but declines from 40 to 60 min just slightly below the mean SR−1 at 40 °C. The (*) symbol indicates an interaction between terms.
Looking at the interaction plot between concentration and temperature, the responses are parallel, with an increase in temperature resulting in an increased mean SR−1 at 1%, 5% and 10% NaBH4 concentrations. However, at each temperature level, the mean SR−1 peaked at 5%, and a substantial decline is seen at a 10% concentration. This could be a result of rapid reduction rate which induces uneven Pt particle aggregation, increasing cluster size and decreasing uniformity [21]. This could also be the reasoning behind the drop in the mean SR−1 from 5% to 10% NaBH4 concentration at the varying stir times, as seen in the concentration and stir time interaction plot.

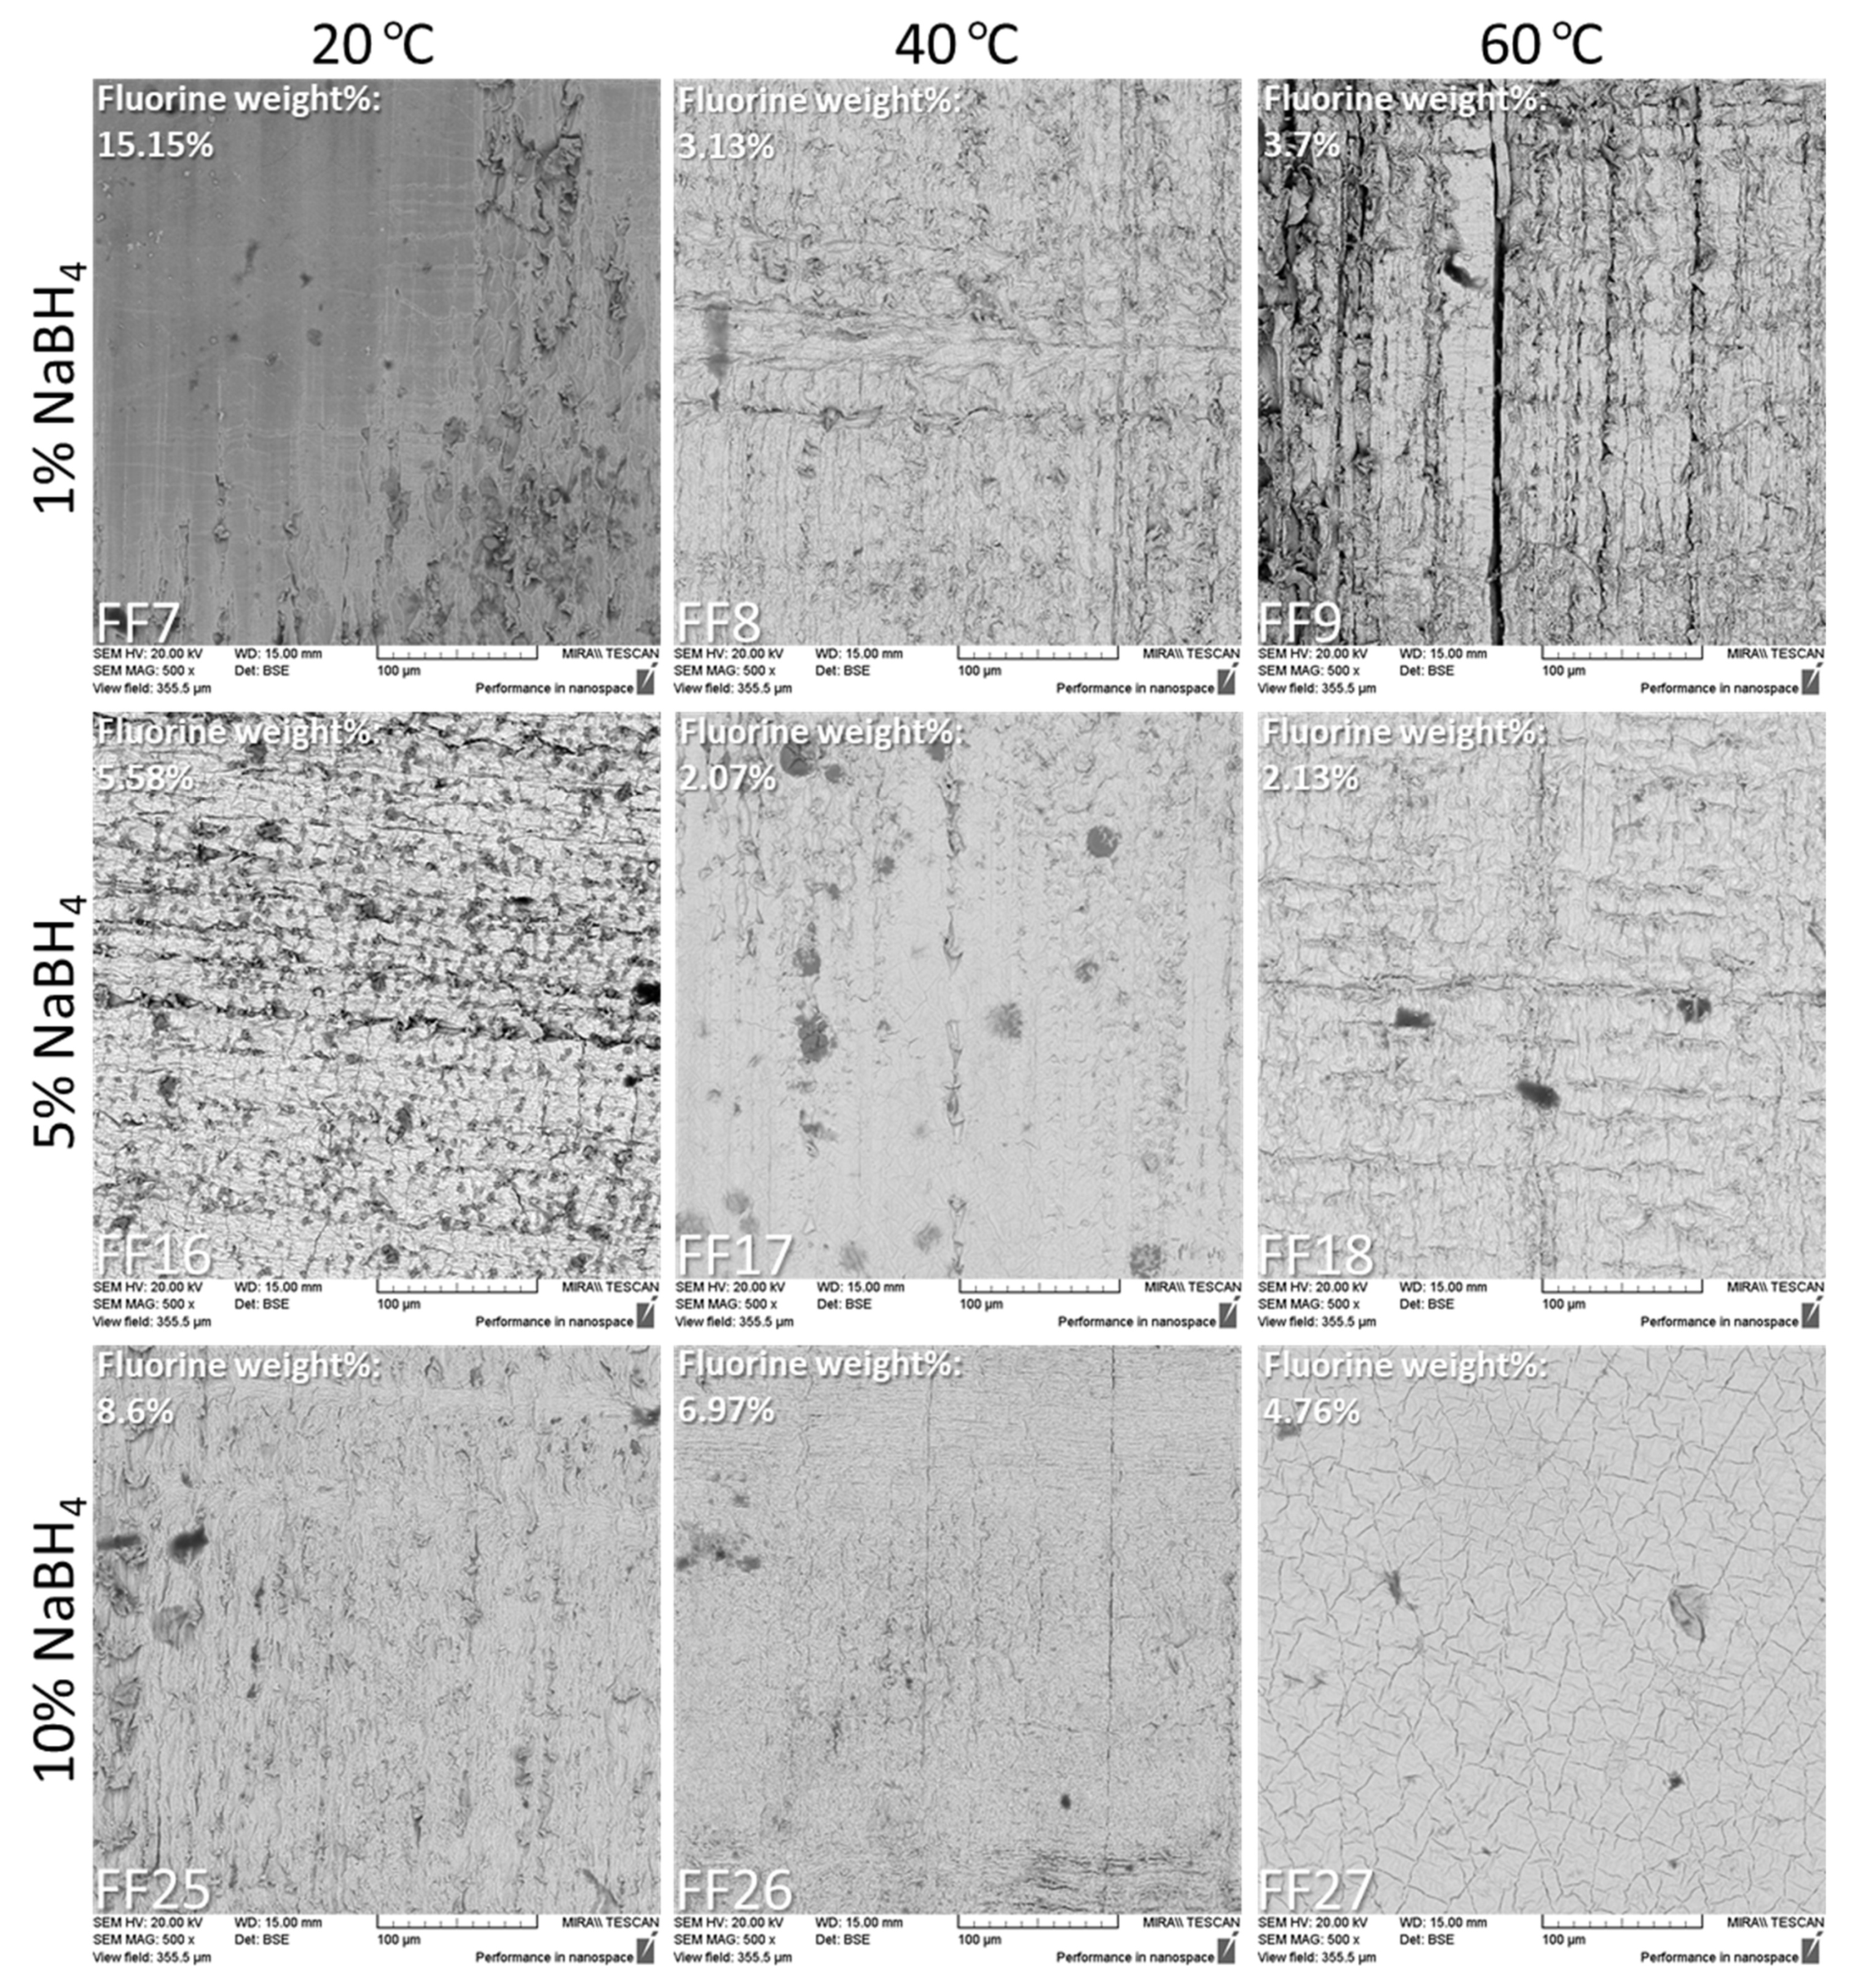
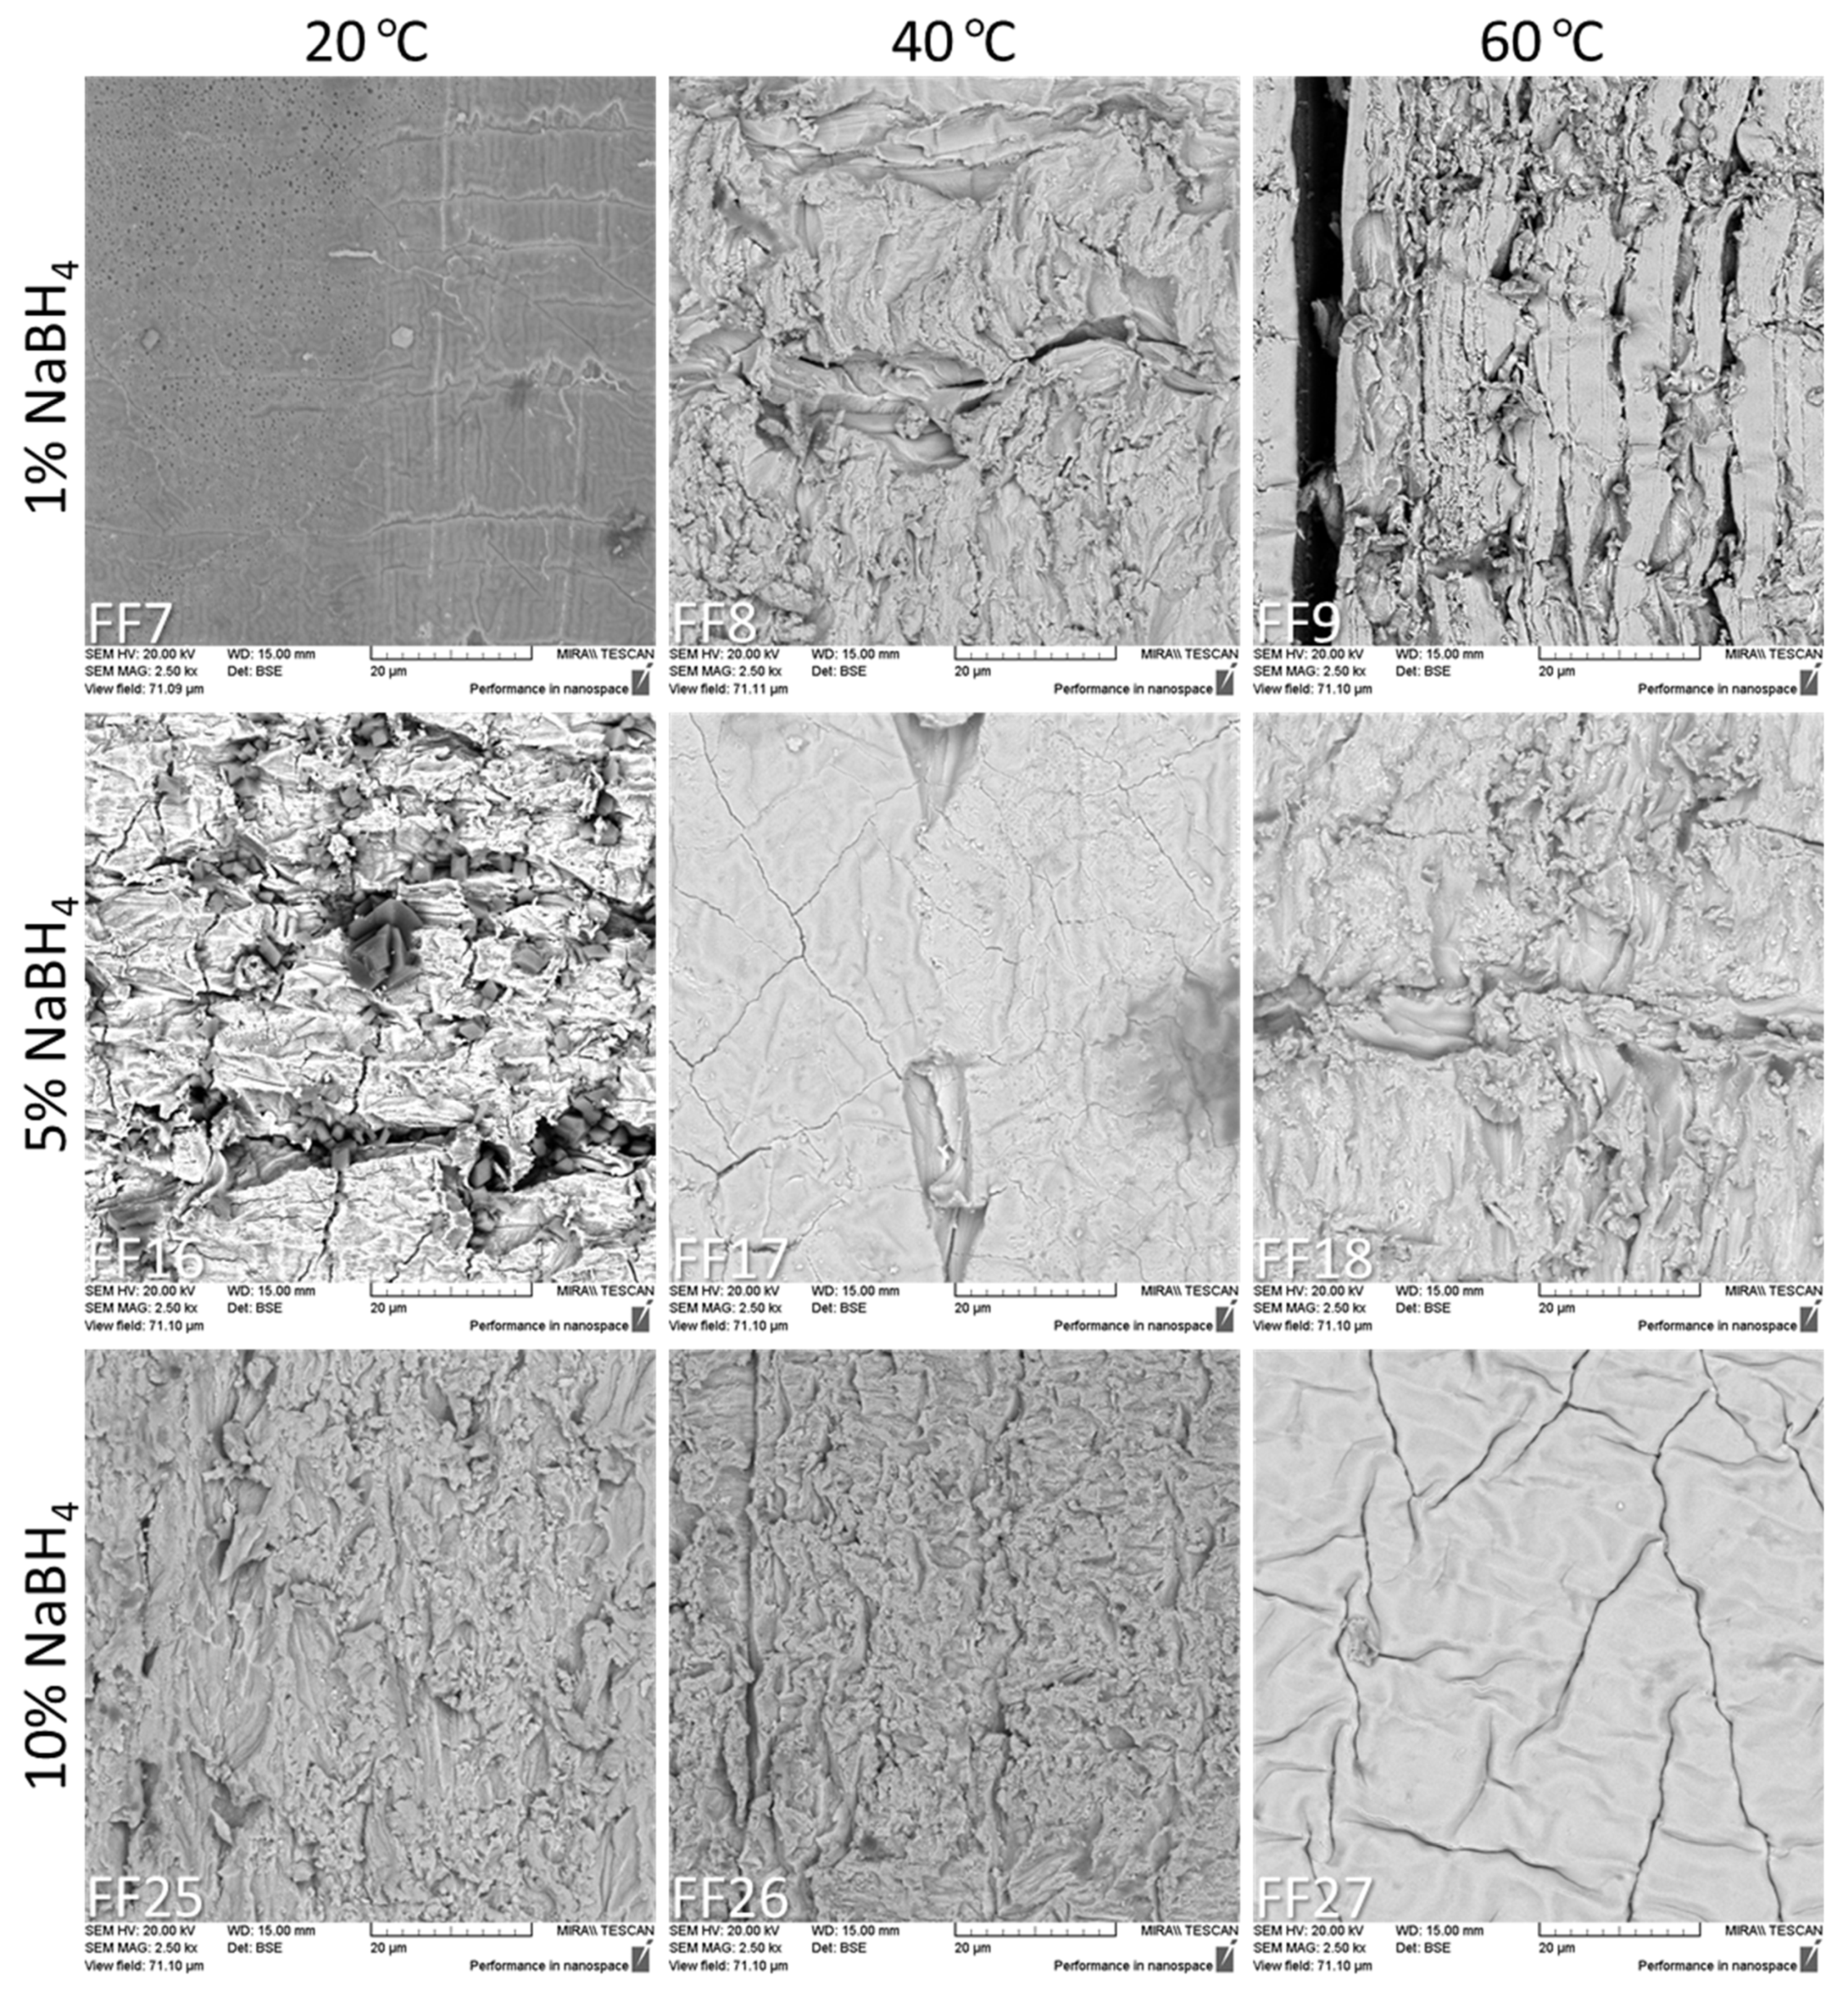
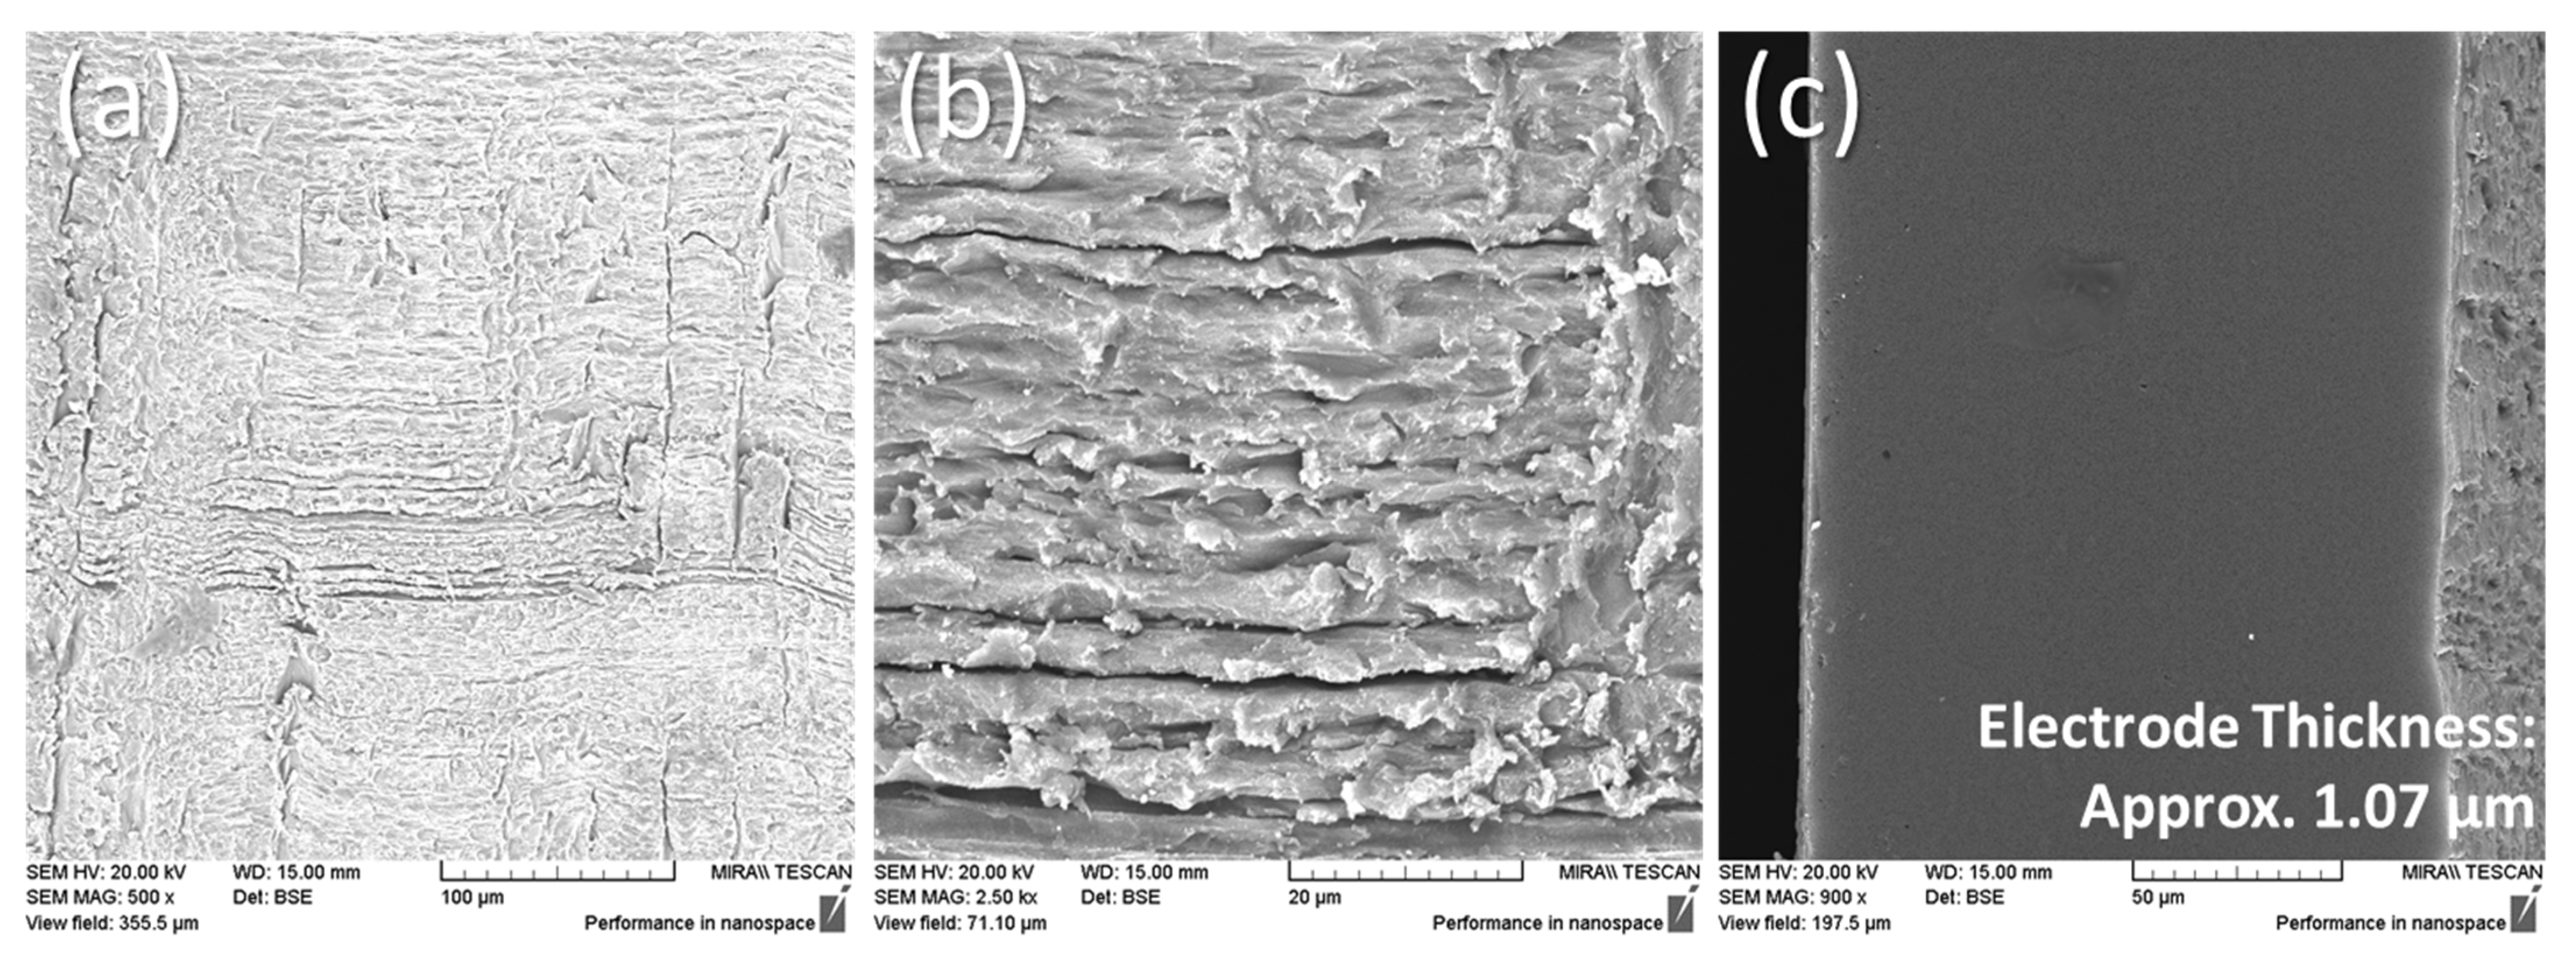
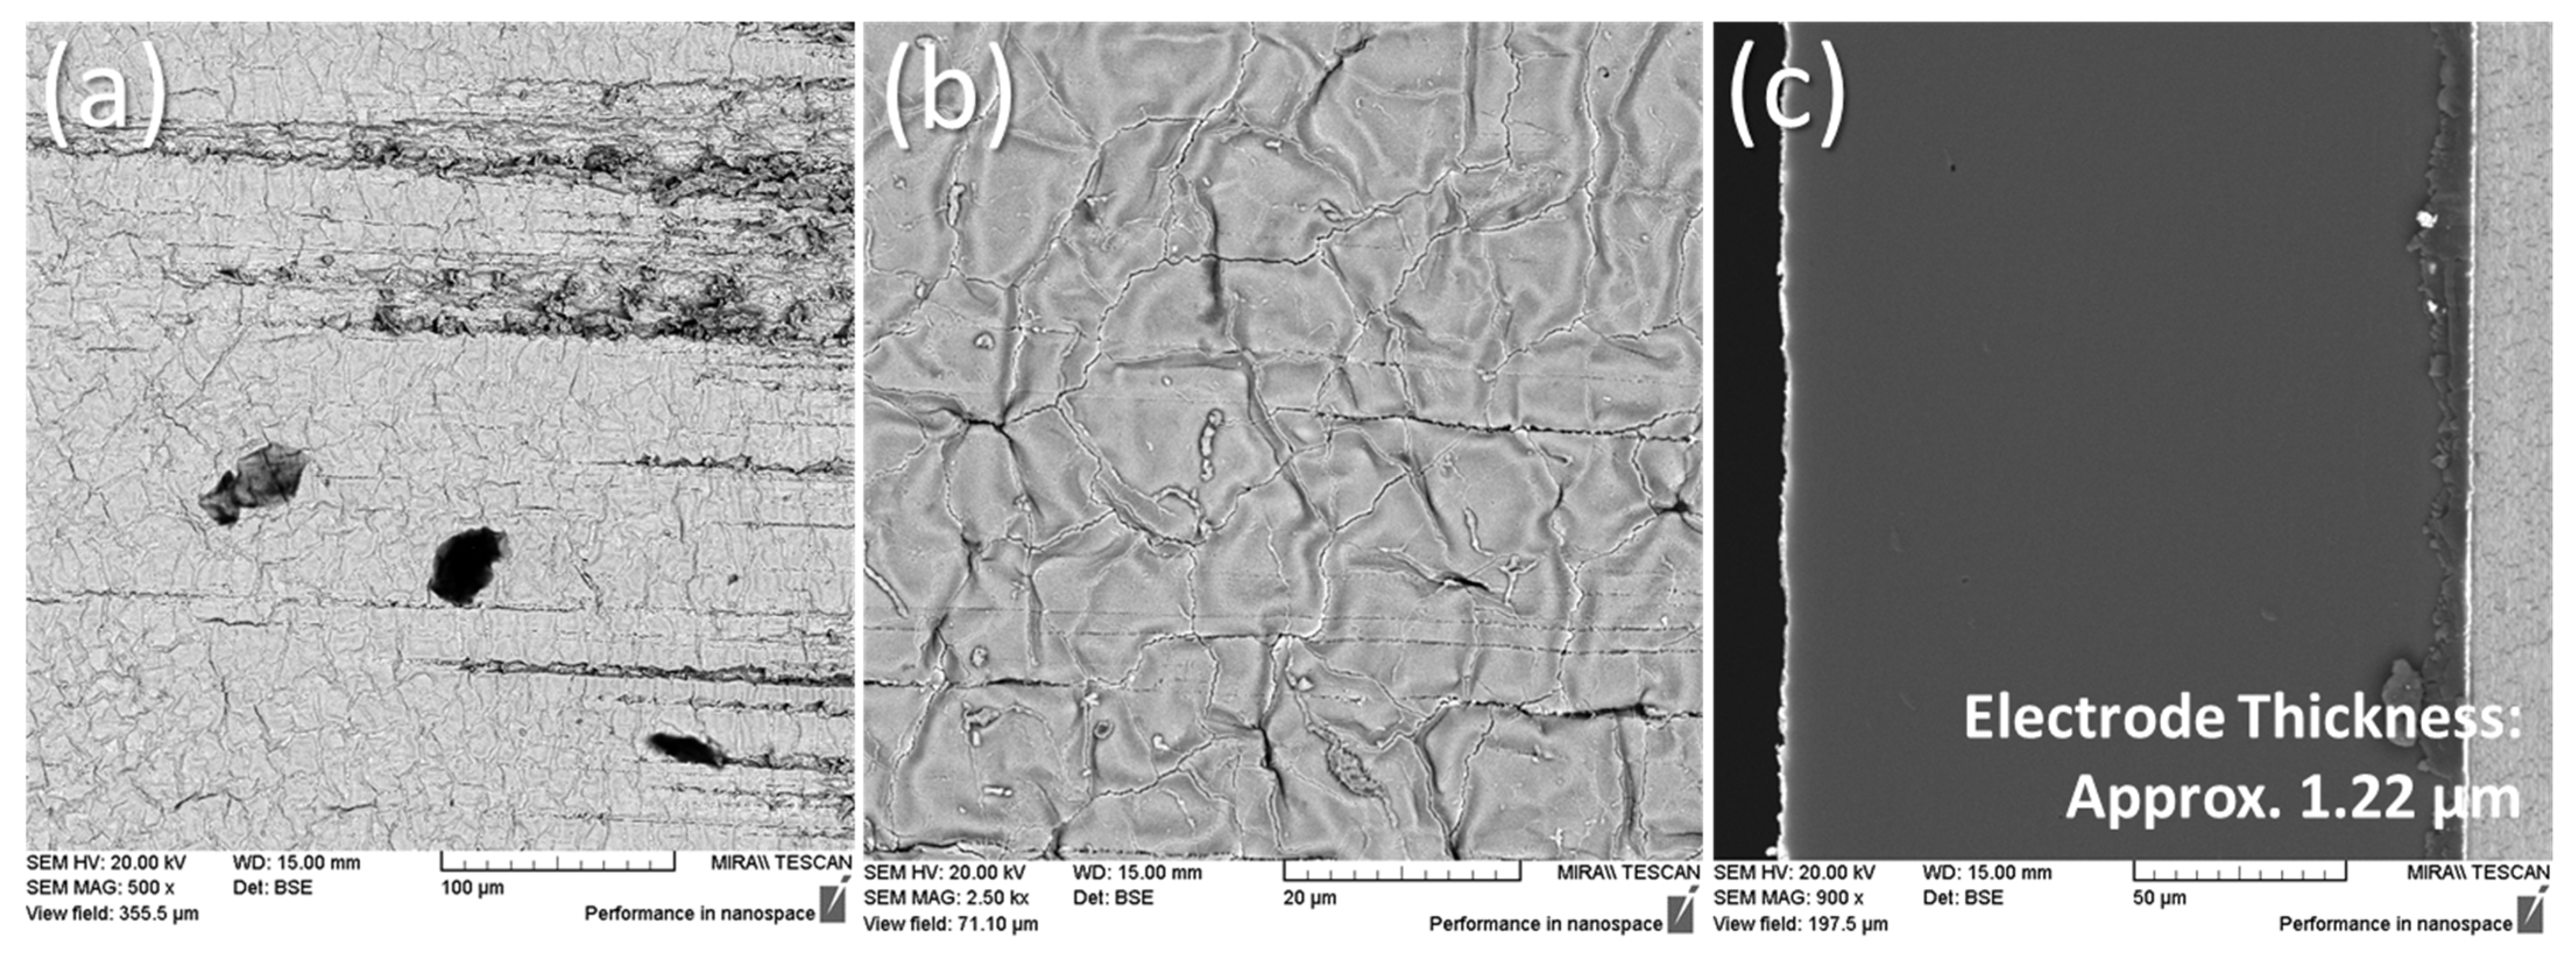
3.4. Scanning Electron Microscopy Results

Further analysis through SEM was warranted to help explain the regression responses as well the non-homogenous deposition of platinum seen in Figure 11. Given in Figure 13 are the surface SEMs of the samples at 60 min stir time, at varying NaBH4 concentrations and reduction temperatures, at a magnification of 500×. Similarly, given in Figure 14 are the same set of samples at a 2.5 k× magnification.
From Figure 13, an increase in temperature and NaBH4 concentration denotes greater plating uniformity across the Nafion-117 surface, as observed by reduced instances of electrode cracking. Nafion is characterised by having a polytetrafluoroethylene (PTFE) backbone with terminated sulfonic acid groups, making it abundant in fluorine atoms [25]. EDAX analysis was carried out specifically quantifying fluorine percentage on the IPMC electrode surface to determine if much of the polymer is exposed, i.e., not plated with platinum. At each of the different NaBH4 concentrations, EDAX readings indicate a general reduction in fluorine weight percentage (wt%) when increasing temperature from 20 °C to 60 °C. However, at 5% NaBH4, going from 40 °C to 60 °C, the fluorine wt% plateaued at approximately 2%.
Interestingly, the fluorine wt% shows a general decrease going from 1% to 5% NaBH4 concentration, and increases going from 5% to 10%. This trend could be related to the concentration response found in Figure 8. The increased wt% of fluorine in 10%-NaBH4-reduced samples could indicate higher porosity as more of the Nafion is exposed compared to the 5%-NaBH4-reduced samples. This would correlate with the increase in the mean surface resistance for a 10% NaBH4 concentration, as given in Figure 8, since higher porosity would imply more disjuncture in the electrode layer. The higher porosity could be a result of increased platinum grain size with an increase in NaBH4 concentration, as found by Rashid et al. [9], resulting from an extremely rapid NaBH4 reduction rate [21].
Examining Figure 14, it can generally be observed that electrode roughness improves with an increasing NaBH4 concentration and reducing temperature. This improvement is also accompanied by less instances of electrode cracking. Increased temperature and reducing agent concentration lead to denser platinum growth.
The cross-sections of the IPMC samples are given in Figure 15. Generally, it can be observed that as the reduction temperature increases, thicker electrode layers were obtained from the formation of bulky platinum polycrystals, as reported by Lee et al. [23]. The electrode infiltration into the polymer can be described as a layered electrode [26,27], as opposed to a dendritic or granular electrode infiltration exhibited by gold-type or palladium-type IPMCs, respectively [27,28].

3.5. IPMC Performance

IPMC performance is typically quantified through two metrics: maximum displacement and maximum blocking force under voltage loading. The maximum displacement measured for all 27 samples are given in Figure 16. The raw data for the full factorial design, including surface resistance measurements, displacement and blocking force values, are given in Table A4. FF26 recorded the highest maximum displacement at 65.9 mm, while FF22 recorded the lowest at 22.7 mm.
No significant trends can be inferred from Figure 16, mainly due to lack of replication and unaccounted experimental error. The good performance exhibited by FF26 could partly be attributed to the uniform electrode deposition, as seen in Figure 13. This is in agreement with the EDAX readings showing only 6.97 fluorine wt%. Further magnification of FF26 in Figure 14 reveals a somewhat rough surface compared to FF27. However, no deep disconnecting cracks are visible such as the one in FF9.
On the other hand, the poor displacement displayed by FF22 can be explained by examining the SEMs in Figure 17. From the 500× magnification of the surface, some areas exhibit rough protrusions and parallel channels across the sample. These features are more apparent at a 2.5 k× magnification. EDAX analysis reveals a 52.63 wt% of fluorine for the surface of F22. This indicates a poorly coated sample, probably due to surface treatment irregularities inhibiting the proper nucleation and growth of platinum crystals.
The maximum blocking force produced by the samples is given in Figure 18. Generally, it can be seen that the blocking force results show wide variations between samples, with no obvious trends. This is mainly due to the lack of replications for the testing. The highest maximum blocking force was recorded for FF12 at 7.079 mN, whilst FF1 recorded the lowest at 0.052 mN. Examining the surface SEM of FF12 in Figure 19a, a fairly uniform electrode deposition can be seen. Further magnification of the surface in Figure 19b reveals a homogenous platinum deposition with minimal cracking and without deep disconnecting ravines, and could be described as having a wrinkling surface, similar to the surface of FF27, akin to that of a reticulate venation found on leaves. This is supported by the EDAX readings in Figure 19a having a 2.85 wt% of fluorine and 95.47 wt% of platinum. The low percentage of fluorine indicates minimal areas where Nafion is exposed and not platinised.
The cross-section in Figure 19c reveals FF12 having a fairly uniform electrode layer at an approximately 1.22 μm thickness.
In contrast, the surface SEMs of FF1 given in Figure 20a,b indicate no such platinum growth, as compared to the reticulate venation seen on FF12 surface. This is supported by the EDAX readings showing a 55.40 wt% of fluorine and 14.15 wt% of platinum at a 500× magnification (Figure 20a), and a 48.86 wt% of fluorine and 14.98 wt% of platinum at a 2.5 k× magnification (Figure 20b). Furthermore, it can be visually seen from Figure 11 that the lower portion of FF1 has not been fully coated, evidenced from the translucency of the IPMC. This poor and non-homogenous coating is to be expected, since FF1 is set at the lowest settings for all the factors. Comparing electrode thickness between FF1 and FF12, the platinum deposition on FF12 is much more pronounced (seen from the white layer in Figure 19c), as opposed to FF1 (Figure 20c).
Evident from the maximum displacement and maximum blocking force results given in Figure 16 and Figure 18, respectively, surface resistance is not the only determining factor in the performance of the IPMCs. Mainly, the characteristics of the electrode and polymer matrix heavily influences the actuating abilities of IPMCs. As previously mentioned, a lower surface resistance results in a higher blocking force [5,8,14,23]. This is achieved through several cycles of platinisation to generate a uniform electrode layer [29,30,31]. However, several rounds of plating would result in thicker electrode layers, which would increase the stiffness and elastic modulus of the IPMCs, ultimately affecting their performance [32,33]. Furthermore, an inhomogeneous and porous plating of the electrodes would reduce conductivity and cause further water loss from the membrane during actuation. This would impact the hydration level of the IPMC, diminishing transducing capabilities, since water content controls the osmotic pressure and total capillary pressure of the polymer matrix [32,33].

4. Limitations and Recommendations

The main limitation of this study is the lack of replication in the full factorial design. Experimental error and variability cannot be estimated between the experimental designs, reducing consistency and reliability of results. More replications of the full factorial in this study would verify the unexpected response with regards to the effects of NaBH4 concentration on mean SR−1. The replication limitation is also extended to IPMC performance results, maximum displacement and blocking force, as can be seen from the lack of trends in the results and the wide variation in values. At least three replications are recommended for the experimental design and IPMC performance testing.
Another limitation in the electroless plating of IPMCs is the heterogeneous deposition of platinum onto the Nafion membranes. This is evident in Figure 11, whereby the colour gradients on the IPMCs are inconsistent, with some areas exhibiting a glossy silver finish and some a duller gloss, whilst others have areas of deep blacks. This is further supported by the inconsistent surface resistance measurements between regions of each sample quantified by CV (Table 3). Typically, IPMC electroless plating recipes utilise a minimum of two rounds of coatings: primary coating through NaBH4 reduction, and secondary coating through hydrazine monohydrate and hydroxylamine hydrochloride reduction [5,6,8]. Stable and good-performing IPMCs generally require several cycles of primary electrode deposition to obtain a more uniform and distributed electrode layer [30]. Further optimisation is required with regards to the homogenous platinisation of Nafion-117 membranes, potentially involving not only primary reduction through NaBH4, but also secondary reduction using hydrazine.
A key factor in electrode deposition homogeneity is the surface roughening of the Nafion membrane. In this study, a hand-built sander was built to roughen the membranes utilising only 400-grit sandpaper. The built sander does not keep constant pressure, which could have resulted in uneven sanding pressure applied during the roughening process. A finer grit could have been used to minimise the uneven roughening alongside the usage of different sandpaper grits, as utilised by some studies, which could refine the surface roughening process even further [12,18].
Alongside that, agitation of the plating solution could also be further developed since it is key in the homogenous electroless plating of the platinum particles [34]. In this study, the agitation speed was not varied and kept constant. An optimum degree of agitation is required since too-slow of an agitation (laminar flow) may result in insufficient particle dispersion, whilst too-fast of an agitation (turbulent flow) may cause poor particle incorporation due to insufficient time for the particles to adhere to the surface [35]. The size and shape of the vessel utilised for the agitation and the shape of the agitation paddles or stirring devices may also contribute to the IPMC process development.
The inhomogeneous platinisation of the Nafion membrane partly adds to the difficulty of building a regression model with regards to IPMC displacement and blocking force. The poor reproducibility of samples inhibits good model-building and pattern recognition. Once the issue of homogenous platinum deposition has been tackled, an interesting quandary to work towards would be applying a DOE approach to characterise the effects of varying process parameters on electrode thickness of IPMCs, and how that affects mechanical properties such as tensile strength, yield strength and elasticity. These properties could then be related to IPMC performance, i.e., displacement and blocking force, alongside differential scanning calorimetry and X-ray diffraction analysis to outline and model a regression between IPMC properties and its performance.

5. Conclusions

The effects of the concurrent variation of NaBH4 concentration, stir time and temperature on surface resistance of IPMCs were studied through a full factorial design. The three-factor three-level factorial design resulted in 27 runs. Surface resistance was measured using a four-point probe. The fitted responses resulted in a regression model with an R2 value of 97.45%. Temperature was found to have the most significant effect on surface resistance. Generally, surface resistance was found to decrease with increasing stir time (20 min to 60 min) and temperature (20 °C to 60 °C). These responses were attributed to increased platinisation rates, resulting in more uniform electrode deposition, confirmed by SEM and EDAX analysis. Surface resistance decreased, going from a 1% to 5% NaBH4 concentration, but increased from a 5% to 10% NaBH4 concentration. This behaviour was mainly attributed to surface morphology, increased grain size inducing porous electrodes, in line with findings in the literature. The maximum tip displacement, measured through a computer vision system, as well as the maximum blocking force, measured through an analytical balance setup, were obtained for all 27 samples. The varying results were discussed with regards to surface and cross-sectional SEMs, alongside EDAX analysis.

Author Contributions

Conceptualization, E.M. and J.G.L.; methodology, E.M.; formal analysis, E.M.; investigation, E.M.; resources, J.G.L. and C.L.H.; writing—original draft preparation, E.M.; writing—review and editing, E.M, D.P.F., C.L.H. and J.G.L.; visualization, E.M.; supervision, J.G.L. and C.L.H.; project administration, E.M. and J.G.L.; funding acquisition, J.G.L. and C.L.H. All authors have read and agreed to the published version of the manuscript.

Funding

This publication has emanated from research conducted with the financial support of the Presidents Doctoral Scholarship scheme from the Technological University of the Shannon.

Data Availability Statement

The original contributions presented in the study are included in the article; further inquiries can be directed to the corresponding author.

Acknowledgments

Special thanks to Samantha O’Sullivan for providing an outside perspective on the work, offering valuable insights into the presentation and readability of the article.

Conflicts of Interest

The authors declare no conflicts of interest.

Appendix A

An example of the calculations for the coefficient of variation (CV), as per Equation (2), is given below.
Recalling Equation (2), the CV for surface resistance values is given by dividing the population standard deviation, σ, by the population mean. The resulting values are then multiplied by 100 to get a percentage for the CV.
The calculation example will be using surface resistance values of sample FF2, as given in Table A1. The nine regions of surface resistance values for each sample are considered to be the entirety of the population for each sample. Thus, the population size for each sample is 9 (i.e., N = 9).
σ = Σ ( X μ ) 2 N
μ = Σ X N = 9.979 + 36.336 + 19.905 + 7.927 + 21.9 + 23.526 + 10.495 + 30.228 + 45.368   9 = 22.852
σ = 9.979 22.852 2 + 36.336 22.852 2 + 45.368 22.852 2 9 σ = 11.993
C V = 11.993 22.852 × 100 = 52.5 %
Table A1. Surface resistance values (average of 100 readings) for each region of each sample (Ω/square).
FF1FF2FF3
837,545.0772,381,020.195582.5189.97936.33619.9057.0323.7598.632
1,934,525.2232,754,967.0484682.5857.92721.923.5267.92711.6118.898
905,504.6332,730,937.7473730.6910.49530.22845.3686.3156.9549.064
FF4FF5FF6
34.263214.22831.93210.33632.9896.4367.2784.13896.579
28.97933.53564.00810.04421.9627.1835.4311.31125.654
28.31690.20224.11612.93317.5178.5185.94414.77217.937
FF7FF8FF9
13.81218.754519.44556.2836.47271.6842.1755.351
14.58931.50961.74612.5115.9135.948350.50681.6946.706
13.89223.39435.28712.74676.6876.408437.834101.9354.782
FF10FF11FF12
99.0462764.7263,635,747.617516.9041584.8627.21836.54719.0055.826
362.0442304.9782,772,178.739288,504.9692033.5386.66635.39220.3185.68
422.90212,713.805417,848.278122.993653.9697.253157.3830.799.615
FF13FF14FF15
32.03395.21731.29219.39213.0496.61660.77716.9144.254
30.56959.84625.57629.20710.8385.875551.80111.0033.716
26.267476.74425.89526.4329.9436.50122,889.6125.6293.888
FF16FF17FF18
9.299121.47436.1879.4089.6094.04422.6899.6095.961
7.39265.903501.89514.06512.2935.38322.7649.3955.686
8.20275.451213.18319.01415.7094.66123.04813.1377.263
FF19FF20FF21
8913.4564071.7810,484.771889.377229.78223.90342.43623.7447.88
19,625.522895.9496240.571965.838320.2815.09822.63315.8566.977
4701.204415.0755042.8391485.6661894.30114.20321.93116.1858.274
FF22FF23FF24
6604.52778,888.929108.41430.71814,779.79925,851.422179.52632.615.494
87,029.21486,811.62585.88824.0464073.05428,441.47581.87830.4715.452
11,530.76922,689.88737.74131.4461356.765928.397327.94741.2315.78
FF25FF26FF27
26.312345.1961209.54147.92734.30614.4749.8915.46716.268
54.266110.3422756.198N/A58.4538.8859.2712.17811.348
25.5891229.9633058.124129.29364.6413.2319.28414.99328.343
Table A2. Regression equation for the full factorial design.
ResponseRegression Equation
1/Surface Resistance0.12132 + 0.00928 Conc._1 + 0.03124 Conc._5 − 0.04052 Conc._10
− 0.02815 Stir Time_20 + 0.00851 Stir Time_40 + 0.01964 Stir Time_60
− 0.08043 Temp._20 + 0.01676 Temp._40 + 0.06367 Temp._60
− 0.00704 Conc.*Stir Time_1 20 + 0.00706 Conc.*Stir Time_1 40
− 0.00002 Conc.*Stir Time_1 60 − 0.01236 Conc.*Stir Time_5 20
− 0.00159 Conc.*Stir Time_5 40 + 0.01395 Conc.*Stir Time_5 60
+ 0.01940 Conc.*Stir Time_10 20 − 0.00547 Conc.*Stir Time_10 40
− 0.01393 Conc.*Stir Time_10 60 − 0.01165 Conc.*Temp._1 20
+ 0.00286 Conc.*Temp._1 40 + 0.00879 Conc.*Temp._1 60
− 0.01064 Conc.*Temp._5 20 + 0.01985 Conc.*Temp._5 40
− 0.00921 Conc.*Temp._5 60 + 0.02229 Conc.*Temp._10 20
− 0.02271 Conc.*Temp._10 40 + 0.00042 Conc.*Temp._10 60
− 0.00801 Stir Time*Temp._20 20 + 0.00559 Stir Time*Temp._20 40
+ 0.00242 Stir Time*Temp._20 60 − 0.01372 Stir Time*Temp._40 20
− 0.02420 Stir Time*Temp._40 40 + 0.03791 Stir Time*Temp._40 60
+ 0.02172 Stir Time*Temp._60 20 + 0.01860 Stir Time*Temp._60 40
− 0.04033 Stir Time*Temp._60 60
Table A3. Full factorial ANOVA.
TermCoefSE CoefT-Valuep-ValueVIF
Constant0.121320.0043427.940.000
Conc.
  10.009280.006141.510.1691.33
  50.031240.006145.090.0011.33
Stir Time
  20−0.028150.00614−4.580.0021.33
  400.008510.006141.390.2031.33
Temp.
  20−0.080430.00614−13.100.0001.33
  400.016760.006142.730.0261.33
Conc.*Stir Time
  1 20−0.007040.00868−0.810.4411.78
  1 400.007060.008680.810.4401.78
  5 20−0.012360.00868−1.420.1921.78
  5 40−0.001590.00868−0.180.8591.78
Conc.*Temp.
  1 20−0.011650.00868−1.340.2171.78
  1 400.002860.008680.330.7511.78
  5 20−0.010640.00868−1.230.2551.78
  5 400.019850.008682.290.0521.78
Stir Time*Temp.
  20 20−0.008010.00868−0.920.3831.78
  20 400.005590.008680.640.5381.78
  40 20−0.013720.00868−1.580.1531.78
  40 40−0.024200.00868−2.790.0241.78
Table A4. Un-coded raw data for the full factorial design.
FFConc. (%)Soak Time (minutes)Temp. (°C)Min. Surf. Res. (Ω/square)Max. Disp.
(mm)
Max. Blocking Force
(mN)
112020582.527.710.052
2120407.9321.455.396
3120606.3114.121.51
41402024.1210.340.895
5140406.4418.464.932
6140604.1419.220.418
71602013.815.130.6
8160405.9116.813.876
9160604.7812.493.092
105202099.056.836.277
11520406.676.581.206
12520605.6812.67.079
135402025.5822.161.377
14540405.8739.021.749
15540603.7231.171.509
16560207.3913.062.545
17560404.0428.062.377
18560605.6924.091.372
19102020415.087.260.313
2010204014.28.582.918
211020606.9859.543.176
2210402037.744.321.618
2310404024.057.653.697
241040605.4520.73.817
2510602025.5922.743.389
261060408.8965.91.646
271060609.2748.743.805

References

  1. Yang, L.; Wang, H.; Zhang, X. Recent Progress in Preparation Process of Ionic Polymer-Metal Composites. Results Phys. 2021, 29, 104800. [Google Scholar] [CrossRef]
  2. Tarditi, A.M.; Bosko, M.L.; Cornaglia, L.M. 3.1 Electroless Plating of Pd Binary and Ternary Alloys and Surface Characteristics for Application in Hydrogen Separation. In Comprehensive Materials Finishing; Hashmi, M., Ed.; Elsevier: Oxford, UK, 2017; pp. 1–24. ISBN 978-0-12-803249-7. [Google Scholar]
  3. Takenaka, H.; Torikai, E. Production of an Ion-Exchange Membrane-Catalytic Electrode Bonded Material for Electrolytic Cells; NASA: Washington, DC, USA, 1980; pp. 147–150.
  4. Fedkiw, P.S.; Her, W.-H. An Impregnation-Reduction Method to Prepare Electrodes on Nafion SPE. J. Electrochem. Soc. 1989, 136, 899. [Google Scholar] [CrossRef]
  5. Kim, K.J.; Shahinpoor, M. Ionic Polymer Metal Composites: II. Manufacturing Techniques. Manufacturing Techniques. Smart Mater. Struct. 2003, 12, 65–79. [Google Scholar] [CrossRef]
  6. Yang, L.; Zhang, D.; Zhang, X.; Tian, A.; Wang, X. Models of Displacement and Blocking Force of Ionic-Polymer Metal Composites Based on Actuation Mechanism. Appl. Phys. Mater. Sci. Process. 2020, 126, 365. [Google Scholar] [CrossRef]
  7. Rashid, T.; Shahinpoor, M. Force Optimization of Ionic Polymeric Platinum Composite Artificial Muscles by Means of an Orthogonal Array Manufacturing Method. In Proceedings of the Smart Structures and Materials 1999: Electroactive Polymer Actuators and Devices, Newport Beach, CA, USA, 1–2 March 1999; SPIE: Bellingham, DC, USA, 1999; Volume 3669, pp. 289–298. [Google Scholar]
  8. Yip, J.; Feng, L.S.; Hang, C.W.; Marcus, Y.C.W.; Wai, K.C. Experimentally Validated Improvement of IPMC Performance through Alternation of Pretreatment and Electroless Plating Processes. Smart Mater. Struct. 2010, 20, 015009. [Google Scholar] [CrossRef]
  9. Rashid, M.; Jun, T.-S.; Kim, Y.S. Material Properties of the Pt Electrode Deposited on Nafion Membrane by the Impregnation–Reduction Method. J. Nanosci. Nanotechnol. 2013, 13, 3627–3633. [Google Scholar] [CrossRef]
  10. Shahinpoor, M. Chapter 2: Ionic Polymer Metal Composites (IPMCs) Optimal Manufacturing. In Ionic Polymer Metal Composites (IPMCs); Royal Society of Chemistry: London, UK, 2015; pp. 61–147. [Google Scholar]
  11. Liu, R.; Her, W.-H.; Fedkiw, P.S. In Situ Electrode Formation on a Nafion Membrane by Chemical Platinization. J. Electrochem. Soc. 1992, 139, 15. [Google Scholar] [CrossRef]
  12. Tian, A.; Sun, Y.; Wang, X.; Li, J.; Zhang, X.; Wang, H. Effects of Surface Roughening Method on the Performance of Ionic Polymer Metal Composition. In Proceedings of the 2021 IEEE International Symposium on Applications of Ferroelectrics (ISAF), Virtual, 16–21 May 2021; pp. 1–4. [Google Scholar]
  13. Palmre, V.; Pugal, D.; Kim, K.J.; Leang, K.K.; Asaka, K.; Aabloo, A. Nanothorn Electrodes for Ionic Polymer-Metal Composite Artificial Muscles. Sci. Rep. 2014, 4, 6176. [Google Scholar] [CrossRef]
  14. Kim, K.J.; Lee, D.-C.; Nam, J.; Hwang, T.S. Fabricating Ionic/Polyimtde Membranes. U.S. Patent 11,312,851, 26 April 2022. [Google Scholar]
  15. Oguro, K. Preparation Procedure Ion-Exchange Polymer Metal Composites (IPMC) Membranes. Available online: https://ndeaa.jpl.nasa.gov/nasa-nde/lommas/eap/IPMC_PrepProcedure.htm (accessed on 29 September 2021).
  16. Xu, B.; Wang, S.; Zhang, Z.; Ling, J.; Wu, X. Improving the Torsion Performance of IPMC by Changing the Electrode Separation. Sci. Rep. 2021, 11, 7639. [Google Scholar] [CrossRef]
  17. Ma, S.; Zhang, Y.; Liang, Y.; Ren, L.; Tian, W.; Ren, L. High-Performance Ionic-Polymer–Metal Composite: Toward Large-Deformation Fast-Response Artificial Muscles. Adv. Funct. Mater. 2020, 30, 1908508. [Google Scholar] [CrossRef]
  18. Yang, L.; Zhang, D.; Zhang, X.; Tian, A.; Ding, Y. Surface Roughening of Nafion Membranes Using Different Route Planning for IPMCs. Int. J. Smart Nano Mater. 2020, 11, 117–128. [Google Scholar] [CrossRef]
  19. Manaf, E.; Abdeali, G.; Reidy, S.; Higginbotham, C.L.; Lyons, J.G. Response Surface Modelling Nafion-117 Sorption of Tetraammineplatinum(II) Chloride in the Electroless Plating of IPMCs. Polymers 2024, 16, 2338. [Google Scholar] [CrossRef] [PubMed]
  20. Manaf, E.; Fitzgerald, K.; Higginbotham, C.L.; Lyons, J.G. Computer Vision System: Measuring Displacement and Bending Angle of Ionic Polymer-Metal Composites. Appl. Sci. 2022, 12, 6744. [Google Scholar] [CrossRef]
  21. Chen, J.; Wang, G.; Wang, X.; Yang, X.; Zhu, S.; Wang, R. Effect of NaBH4 Concentration and Synthesis Temperature on the Performance of Pd/C Catalyst for Formic Acid Electro-Oxidation. Mater. Express 2013, 3, 176–180. [Google Scholar] [CrossRef]
  22. Luty-Błocho, M.; Wojnicki, M.; Csapo, E.; Fitzner, K. On the Rate of Interaction of Sodium Borohydride with Platinum (IV) Chloride Complexes in Alkaline Media. Materials 2021, 14, 3137. [Google Scholar] [CrossRef]
  23. Lee, J.-W.; Nguyen, V.K.; Park, S.Y.; Yoo, Y. Effect of Reduction Temperature on Electrode Formation and Performance of Ionic Polymer Metal Composites. In Proceedings of the Smart Structures and Materials 2006: Electroactive Polymer Actuators and Devices (EAPAD), San Diego, CA, USA, 27 February–2 March 2006; SPIE: Bellingham, DC, USA, 2006; Volume 6168, pp. 602–610. [Google Scholar]
  24. Shahinpoor, M.; Kim, K.J. The Effect of Surface-Electrode Resistance on the Performance of Ionic Polymer-Metal Composite (IPMC) Artificial Muscles. Smart Mater. Struct. 2000, 9, 543–551. [Google Scholar] [CrossRef]
  25. Ninham, B.W.; Battye, M.J.; Bolotskova, P.N.; Gerasimov, R.Y.; Kozlov, V.A.; Bunkin, N.F. Nafion: New and Old Insights into Structure and Function. Polymers 2023, 15, 2214. [Google Scholar] [CrossRef]
  26. Chen, Q.; Xiong, K.; Bian, K.; Jin, N.; Wang, B. Preparation and Performance of Soft Actuator Based on IPMC with Silver Electrodes. Front. Mech. Eng. China 2009, 4, 436–440. [Google Scholar] [CrossRef]
  27. He, C.; Gu, Y.; Zhang, J.; Ma, L.; Yan, M.; Mou, J.; Ren, Y. Preparation and Modification Technology Analysis of Ionic Polymer-Metal Composites (IPMCs). Int. J. Mol. Sci. 2022, 23, 3522. [Google Scholar] [CrossRef]
  28. Wang, Y.; Chen, H.; Wang, Y.; Zhu, Z.; Li, D. Effect of Dehydration on the Mechanical and Physicochemical Properties of Gold- and Palladium-Ionomeric Polymer-Metal Composite (IPMC) Actuators. Electrochimica Acta 2014, 129, 450–458. [Google Scholar] [CrossRef]
  29. Cho, W.-H.; Kei, C.-C.; Liu, B.-H.; Yu, Y.-S.; Chen, F.-Z. Platinum Growth Analysis in Atomic Layer Deposition Using In-Situ Resistance Measurement. In Proceedings of the 2016 IEEE International Instrumentation and Measurement Technology Conference Proceedings, Taipei, Taiwan, 23–26 May 2016; pp. 1–4. [Google Scholar]
  30. De Luca, V.; Digiamberardino, P.; Di Pasquale, G.; Graziani, S.; Pollicino, A.; Umana, E.; Xibilia, M.G. Ionic Electroactive Polymer Metal Composites: Fabricating, Modeling, and Applications of Postsilicon Smart Devices. J. Polym. Sci. Part B Polym. Phys. 2013, 51, 699–734. [Google Scholar] [CrossRef]
  31. Schlupp, M.V.F.; Wehrle, M.M.; Kunze, K.; Remhof, A.; Vogt, U.F. Platinum Thin-Film Electrodes Prepared by a Cost-Effective Chemical Vapor Deposition Technique. Adv. Eng. Mater. 2016, 18, 1200–1207. [Google Scholar] [CrossRef]
  32. Tang, G.; Mei, D.; Zhao, X.; Zhao, C.; Li, L.; Wang, Y. A Comprehensive Survey of Ionic Polymer Metal Composite Transducers: Preparation, Performance Optimization and Applications. Soft Sci. 2023, 3, 9. [Google Scholar] [CrossRef]
  33. Zhang, H.; Lin, Z.; Hu, Y.; Ma, S.; Liang, Y.; Ren, L.; Ren, L. Low-Voltage Driven Ionic Polymer-Metal Composite Actuators: Structures, Materials, and Applications. Adv. Sci. 2023, 10, 2206135. [Google Scholar] [CrossRef] [PubMed]
  34. Balaraju, J.N.; Sankara Narayanan, T.S.N.; Seshadri, S.K. Electroless Ni–P Composite Coatings. J. Appl. Electrochem. 2003, 33, 807–816. [Google Scholar] [CrossRef]
  35. Kalantary, M.R.; Holbrook, K.A.; Wells, P.B. Optimisation of a Bath for Electroless Plating and Its Use for the Production of Nickel-Phosphorus-Silicon Carbide Coatings. Trans. IMF 1993, 71, 55–61. [Google Scholar] [CrossRef]
Figure 1. Nafion-117 sanding apparatus schematic.
Actuators 13 00350 g001
Figure 2. Summarised methodology of IPMC sample preparation.
Actuators 13 00350 g002
Figure 3. Regions for surface resistance measurements.
Actuators 13 00350 g003
Figure 4. (a) Aligning IPMC sample parallel to the probes; (b) probe contact with IPMC sample.
Actuators 13 00350 g004
Figure 5. (a) Computer vision setup; (b) copper plate clamping.
Actuators 13 00350 g005
Figure 6. Blocking force measurement schematic.
Actuators 13 00350 g006
Figure 7. Pareto chart of standardised effects.
Actuators 13 00350 g007
Figure 8. Main effects plot for the mean of the surface resistance reciprocal.
Actuators 13 00350 g008
Figure 9. Effervescence from the reduction process of the IPMCs.
Actuators 13 00350 g009
Figure 10. Beaker staining after the reduction process.
Actuators 13 00350 g010
Figure 11. All 27 platinised samples.
Actuators 13 00350 g011
Figure 12. Interaction plot for the mean of the surface resistance reciprocal.
Actuators 13 00350 g012
Figure 13. Surface SEMs of IPMCs at varying NaBH4 concentrations and temperatures, at a constant soak time of 60 min and a 500× magnification.
Actuators 13 00350 g013
Figure 14. Surface SEMs of IPMCs at varying NaBH4 concentrations and temperatures at a constant soak time of 60 min and a 2.5 k× magnification.
Actuators 13 00350 g014
Figure 15. SEMs of IPMC cross-sections at varying NaBH4 concentrations and temperatures at a constant soak time of 60 min and a 900× magnification.
Actuators 13 00350 g015
Figure 16. Maximum displacement for samples FF1 to FF27.
Actuators 13 00350 g016
Figure 17. SEM of FF22: (a) surface at a 500× magnification, (b) surface at a 2.5 k× magnification and (c) cross-section.
Actuators 13 00350 g017
Figure 18. Maximum blocking force for samples FF1 to FF27.
Actuators 13 00350 g018
Figure 19. SEM of FF12: (a) surface at a 500× magnification, (b) surface at a 2.5 k× magnification and (c) cross-section.
Actuators 13 00350 g019
Figure 20. SEM of FF1: (a) surface at a 500 magnification, (b) surface at a 2.5 k× magnification and (c) cross section.
Actuators 13 00350 g020
Table 1. Primary reduction configurations in the literature.
Author (s)Membrane SizeReducing AgentConcentrationStir Time Temp., °C
Kim et al., 2003 [5]5 × 5 cmNaBH4 1 or LiBH4 25%NS 360
Shahinpoor, 2015 [10]5 × 5 cmNaBH4 or LiBH45%NS40–60
Yip et al., 2011 [8]50 × 60 mmNaBH45 wt%6.5 h40–60
Liu et al., 1992 [11]1 in side hexagonNaBH40.1 M2 h50
Tian et al., 2021 [12]30 × 10 mmNaBH4NSNSNS
Palmre et al., 2014 [13]50 × 10 mmNaBH40.57 g/L2 h60
Kim et al., 2022 [14]0.5 × 2.5 cmNaBH40.57 g/L2 h60
Yang et al., 2020 [6]10 × 50 mmNaBH41%>30 min40–60
Oguro et al., 2000 [15]30 cm2NaBH45 wt%1.5 h40–60
Xu et al., 2021 [16]30 × 29 mmNaBH45%2 hNS
Ma et al., 2020 [17]30 × 30 mmNaBH45 wt%5 h (5 mL added every 30 min 10 times)40
Rashid et al., 2013 [9]15 mm dia. circleNaBH410–100 mM2 h (replaced every 20 min)5, 25, 50
1 NaBH4 is sodium borohydride, 2 LiBH4 is lithium borohydride, 3 NS denotes unspecified.
Table 2. Process variables and their levels for the full factorial design.
Full Factorial Configurations
FactorUnitNotationFactor Level
123
Concentration of NaBH4%Conc.1510
Stir TimeminutesST204060
Temperature°CTemp.204060
Table 3. Coefficient of variation (CV).
FF1
86.7%
FF2
52.5%
FF3
50.6%
FF4
94.7%
FF5
57.4%
FF6
131.0%
FF7
54.2%
FF8
108.4%
FF9
122.7%
FF10
174.6%
FF11
274.4%
FF12
124.9%
FF13
155.4%
FF14
58.4%
FF15
273.8%
FF16
110.8%
FF17
47.2%
FF18
53.2%
FF19
82.1%
FF20
98.0%
FF21
56.9%
FF22
113.9%
FF23
119.5%
FF24
129.6%
FF25
115.0%
FF26
80.0%
FF27
39.9%
Disclaimer/Publisher’s Note: The statements, opinions and data contained in all publications are solely those of the individual author(s) and contributor(s) and not of MDPI and/or the editor(s). MDPI and/or the editor(s) disclaim responsibility for any injury to people or property resulting from any ideas, methods, instructions or products referred to in the content.

