
Immune Characteristic Genes and Neutrophil Immune Transformation Studies in Severe COVID-19

 ,
,
Abstract
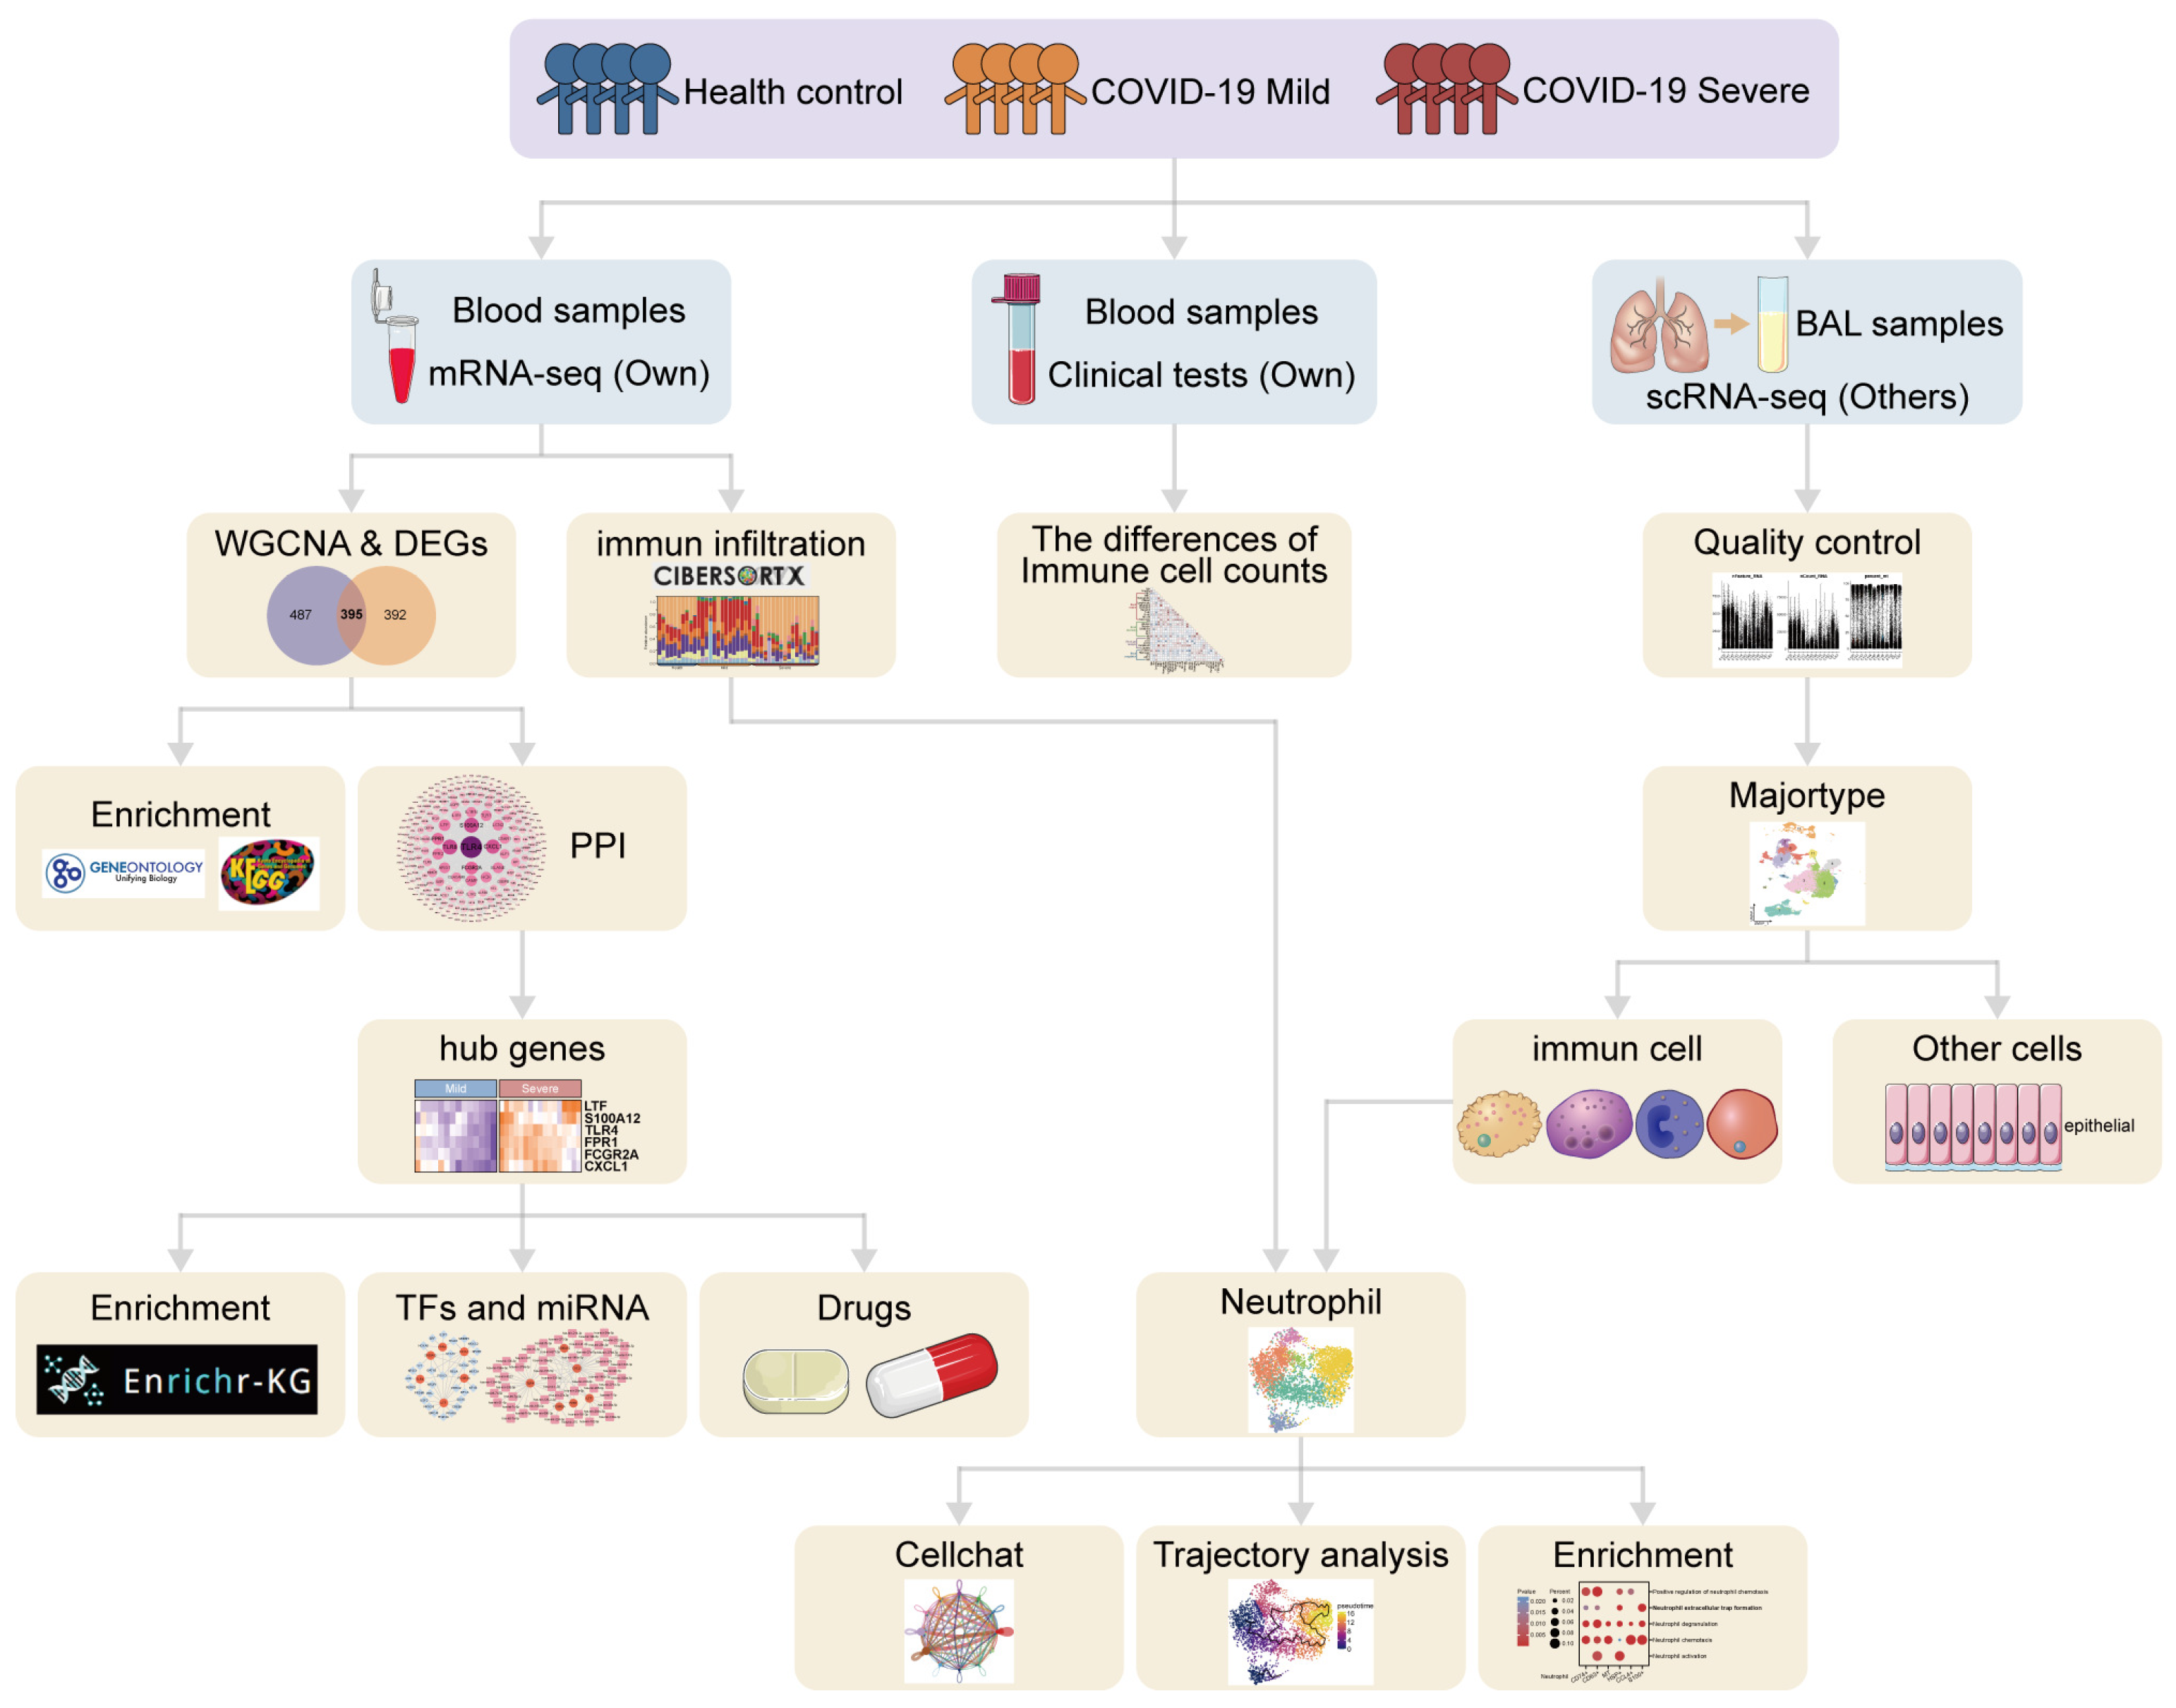
1. Introduction
2. Materials and Methods
2.1. Bulk RNA Sequencing Data Collection
2.2. Hierarchical Cluster Analysis and Principal Component Analysis
2.3. Weighted Gene Co-Expression Network Analysis
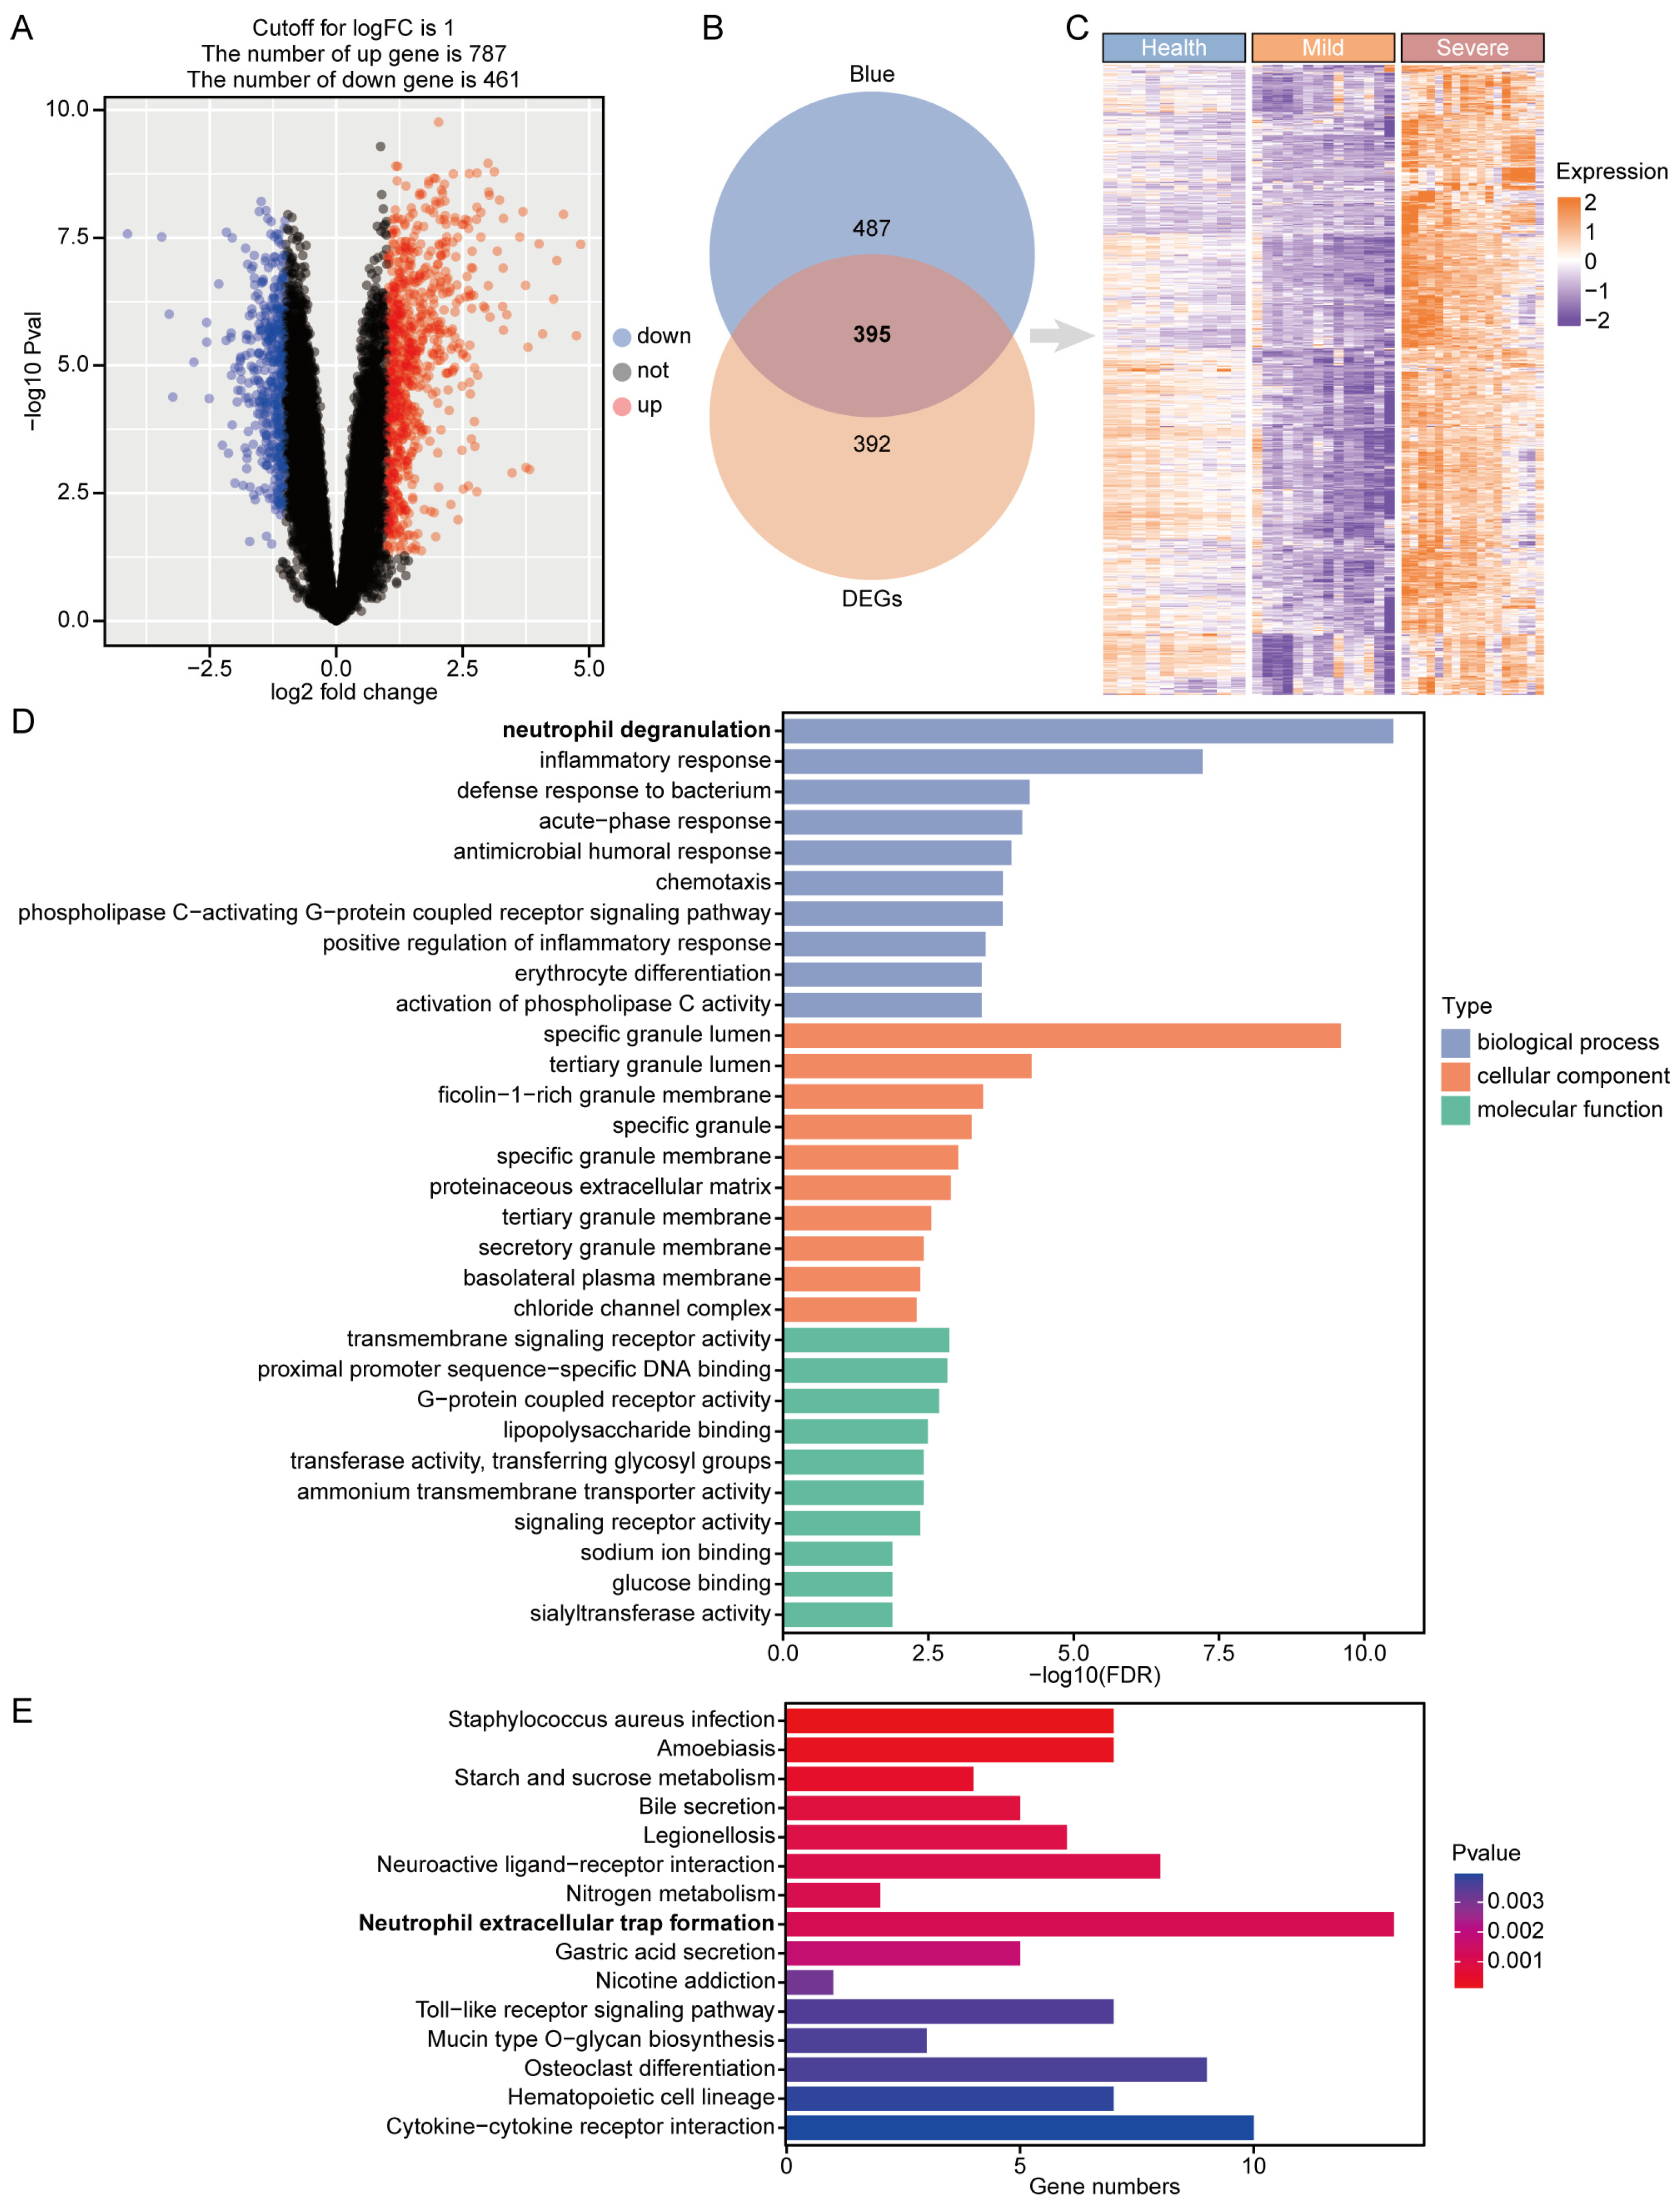
2.4. Identification of Differentially Expressed Genes and Critical Genes
2.5. Functional Enrichment Analysis
2.6. Protein–Protein Interaction Network Construction and Hub Gene Identification
2.7. Construction of TF–Gene and Gene–miRNA Interaction Networks
2.8. Identification of Target Drugs
2.9. Immune Infiltration Analysis
2.10. Analysis of Clinical and Laboratory Test Data
2.11. Analysis of Single-Cell RNA Sequencing Data from Bronchoalveolar Lavage Fluid
2.12. Pseudotime Analysis
2.13. Cell-to-Cell Communication
2.14. Statistical Analysis
3. Results
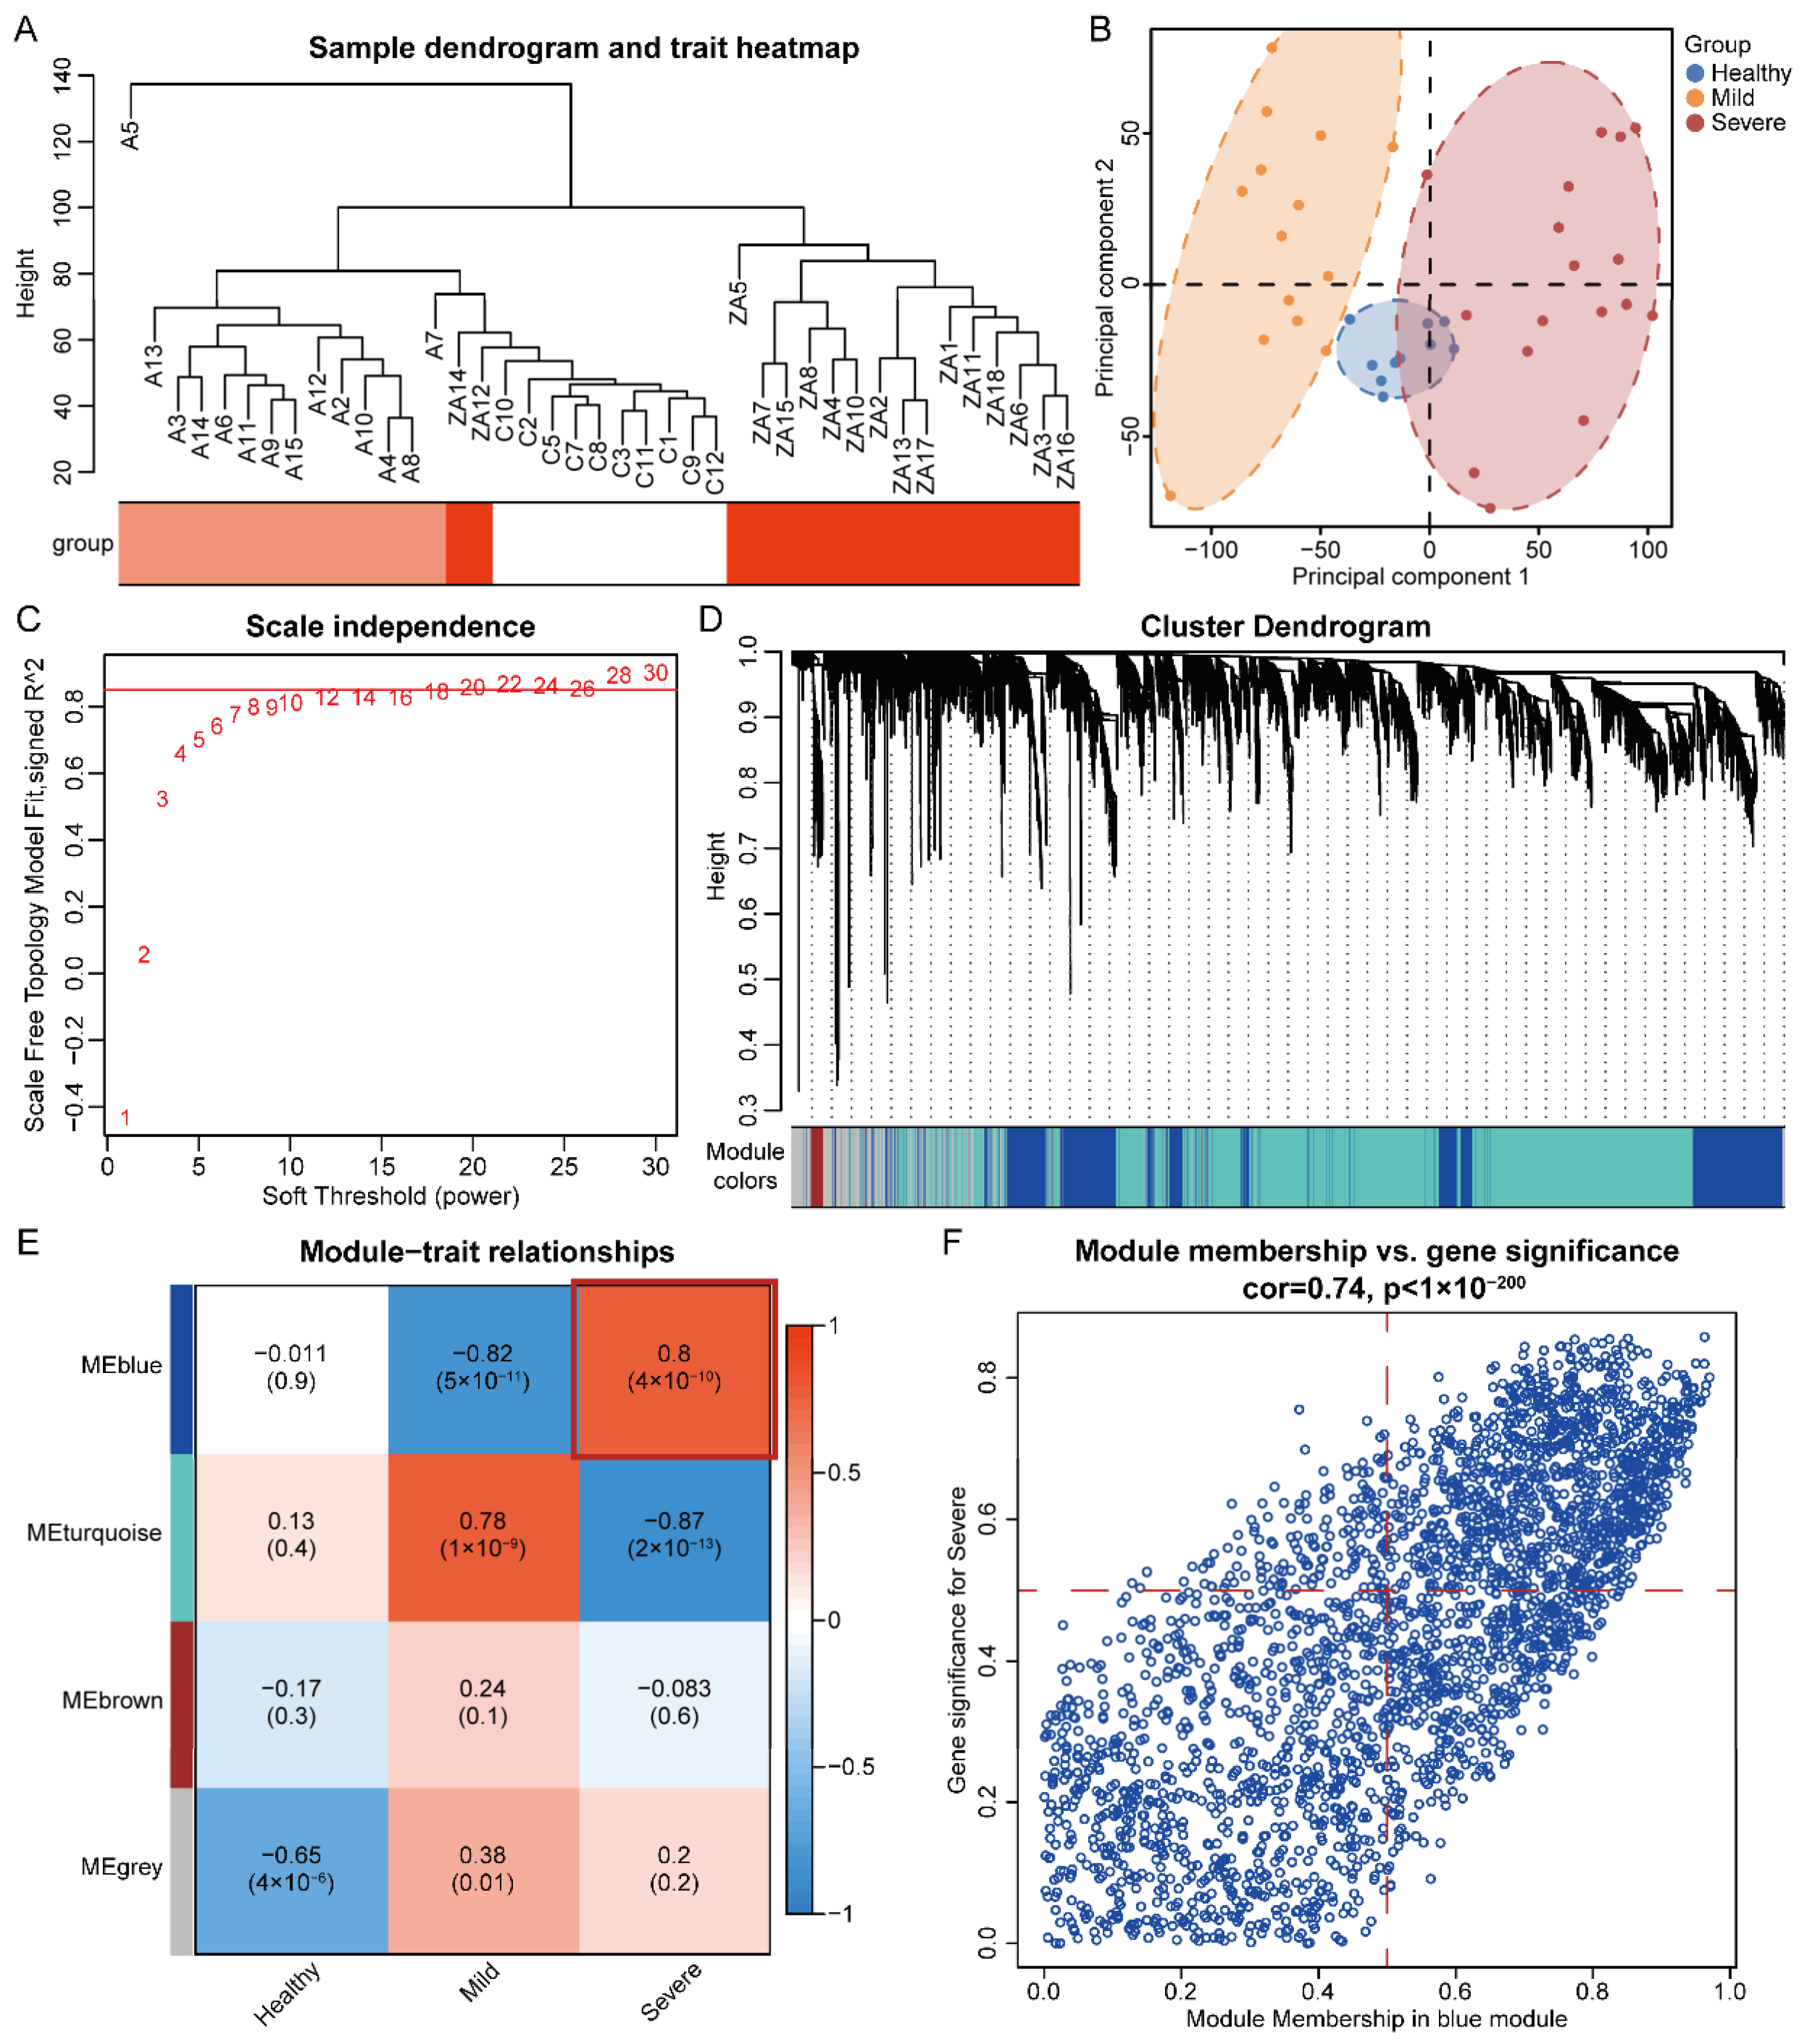
3.1. Hierarchical Cluster Analysis and Principal Component Analysis
3.2. Identification of Significant Modules and Genes of COVID-19 Severe by WGCNA
3.3. Identification and Enrichment of Critical Genes for COVID-19 Severe Disease
3.4. Construction of PPI Network and Identification of Hub Gene
3.5. Construction of TF–Gene and Gene–miRNA Interaction Networks and Drug Identification

| Term | p-Value | Combined Score | Genes |
|---|---|---|---|
| trimethoprim BOSS | 1.68 × 10⁻⁵ | 1158.315235 | CXCL1; TLR4; LTF |
| Muramyl Dipeptide CTD 00005307 | 1.73 × 10⁻⁵ | 5475.88964 | CXCL1; TLR4 |
| Adenylyl sulfate BOSS | 2.06 × 10⁻⁵ | 4896.915145 | TLR4; LTF |
| 6-Deoxy-D-galactose BOSS | 3.94 × 10⁻⁵ | 3265.179181 | TLR4; LTF |
| N-Formyl-Met-Leu-Phe BOSS | 6.42 × 10⁻⁵ | 2407.70308 | FPR1; TLR4 |
| Lysergide BOSS | 7.06 × 10⁻⁵ | 2270.521513 | TLR4; LTF |
| methacholine BOSS | 9.13 × 10⁻⁵ | 1932.575689 | CXCL1; TLR4 |
| SODIUM SULFATE BOSS | 1.55 × 10⁻⁴ | 1387.901255 | CXCL1; TLR4 |
| Heparitin BOSS | 2.97 × 10⁻⁴ | 918.6400252 | CXCL1; TLR4 |
| Hydroxyzine dihydrochloride BOSS | 3.66 × 10⁻⁴ | 803.1179907 | TLR4; LTF |
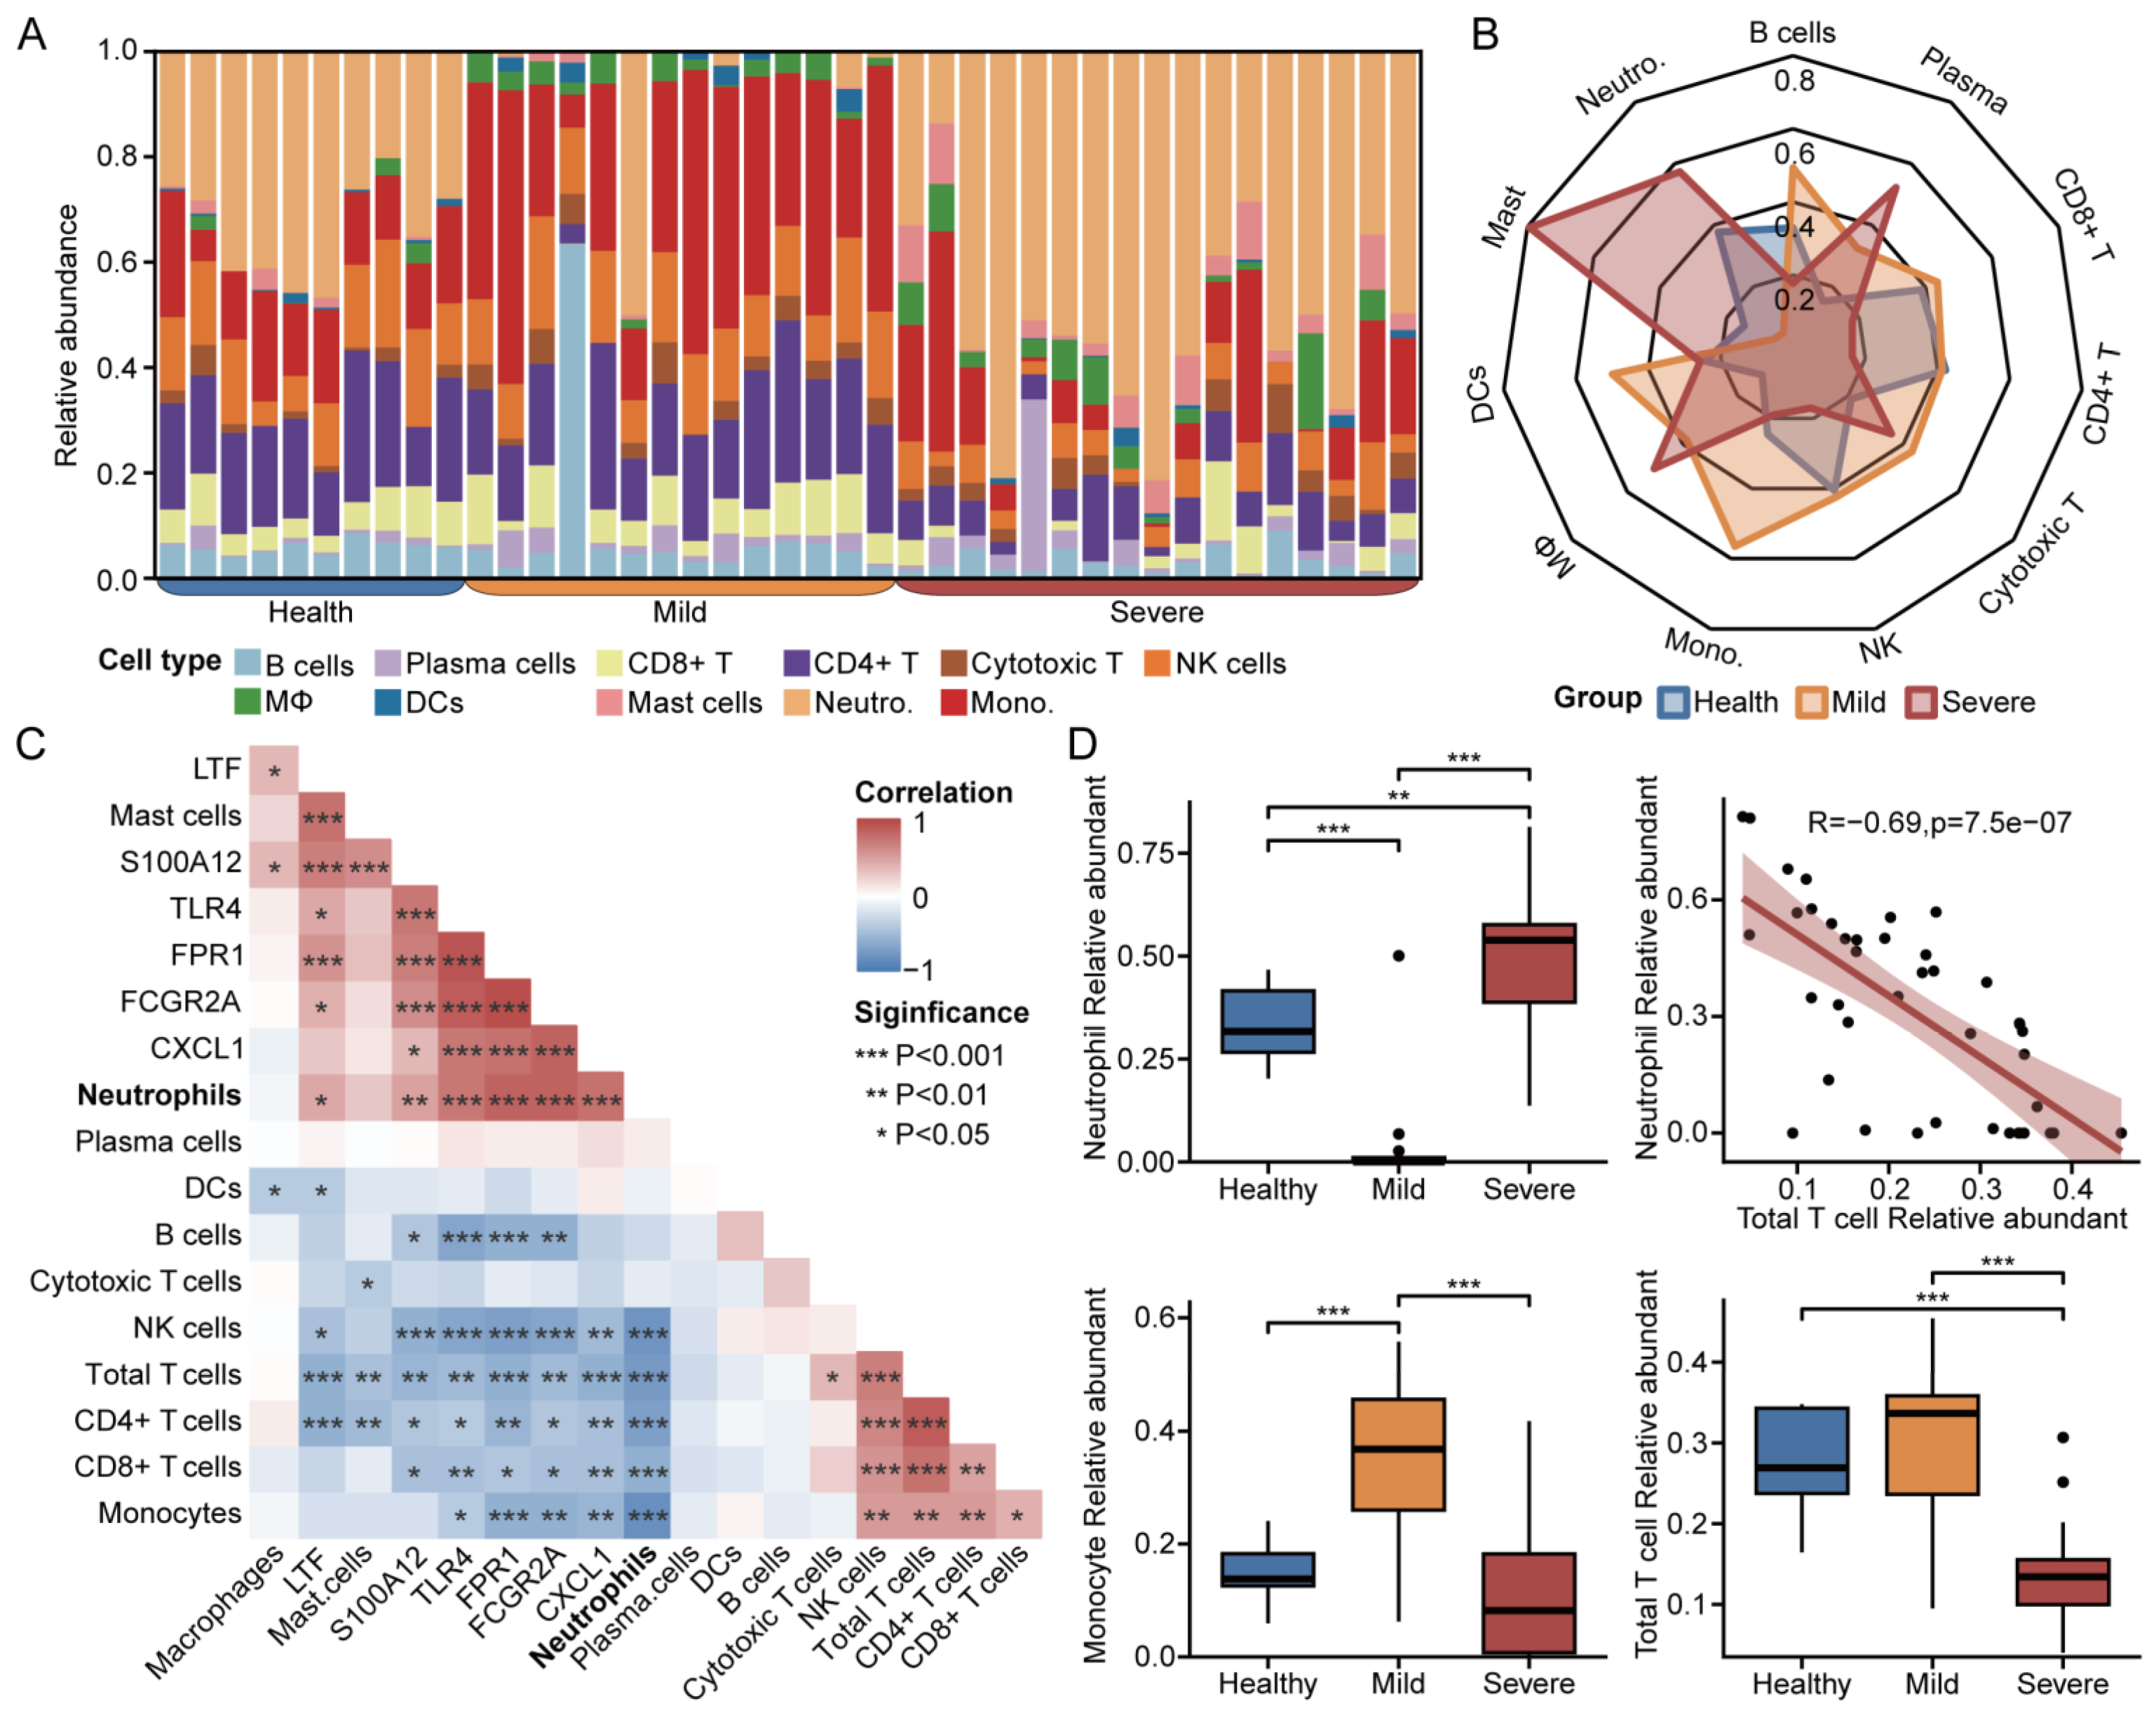
3.6. Immune Infiltration for Diverse Disease Severity in COVID-19
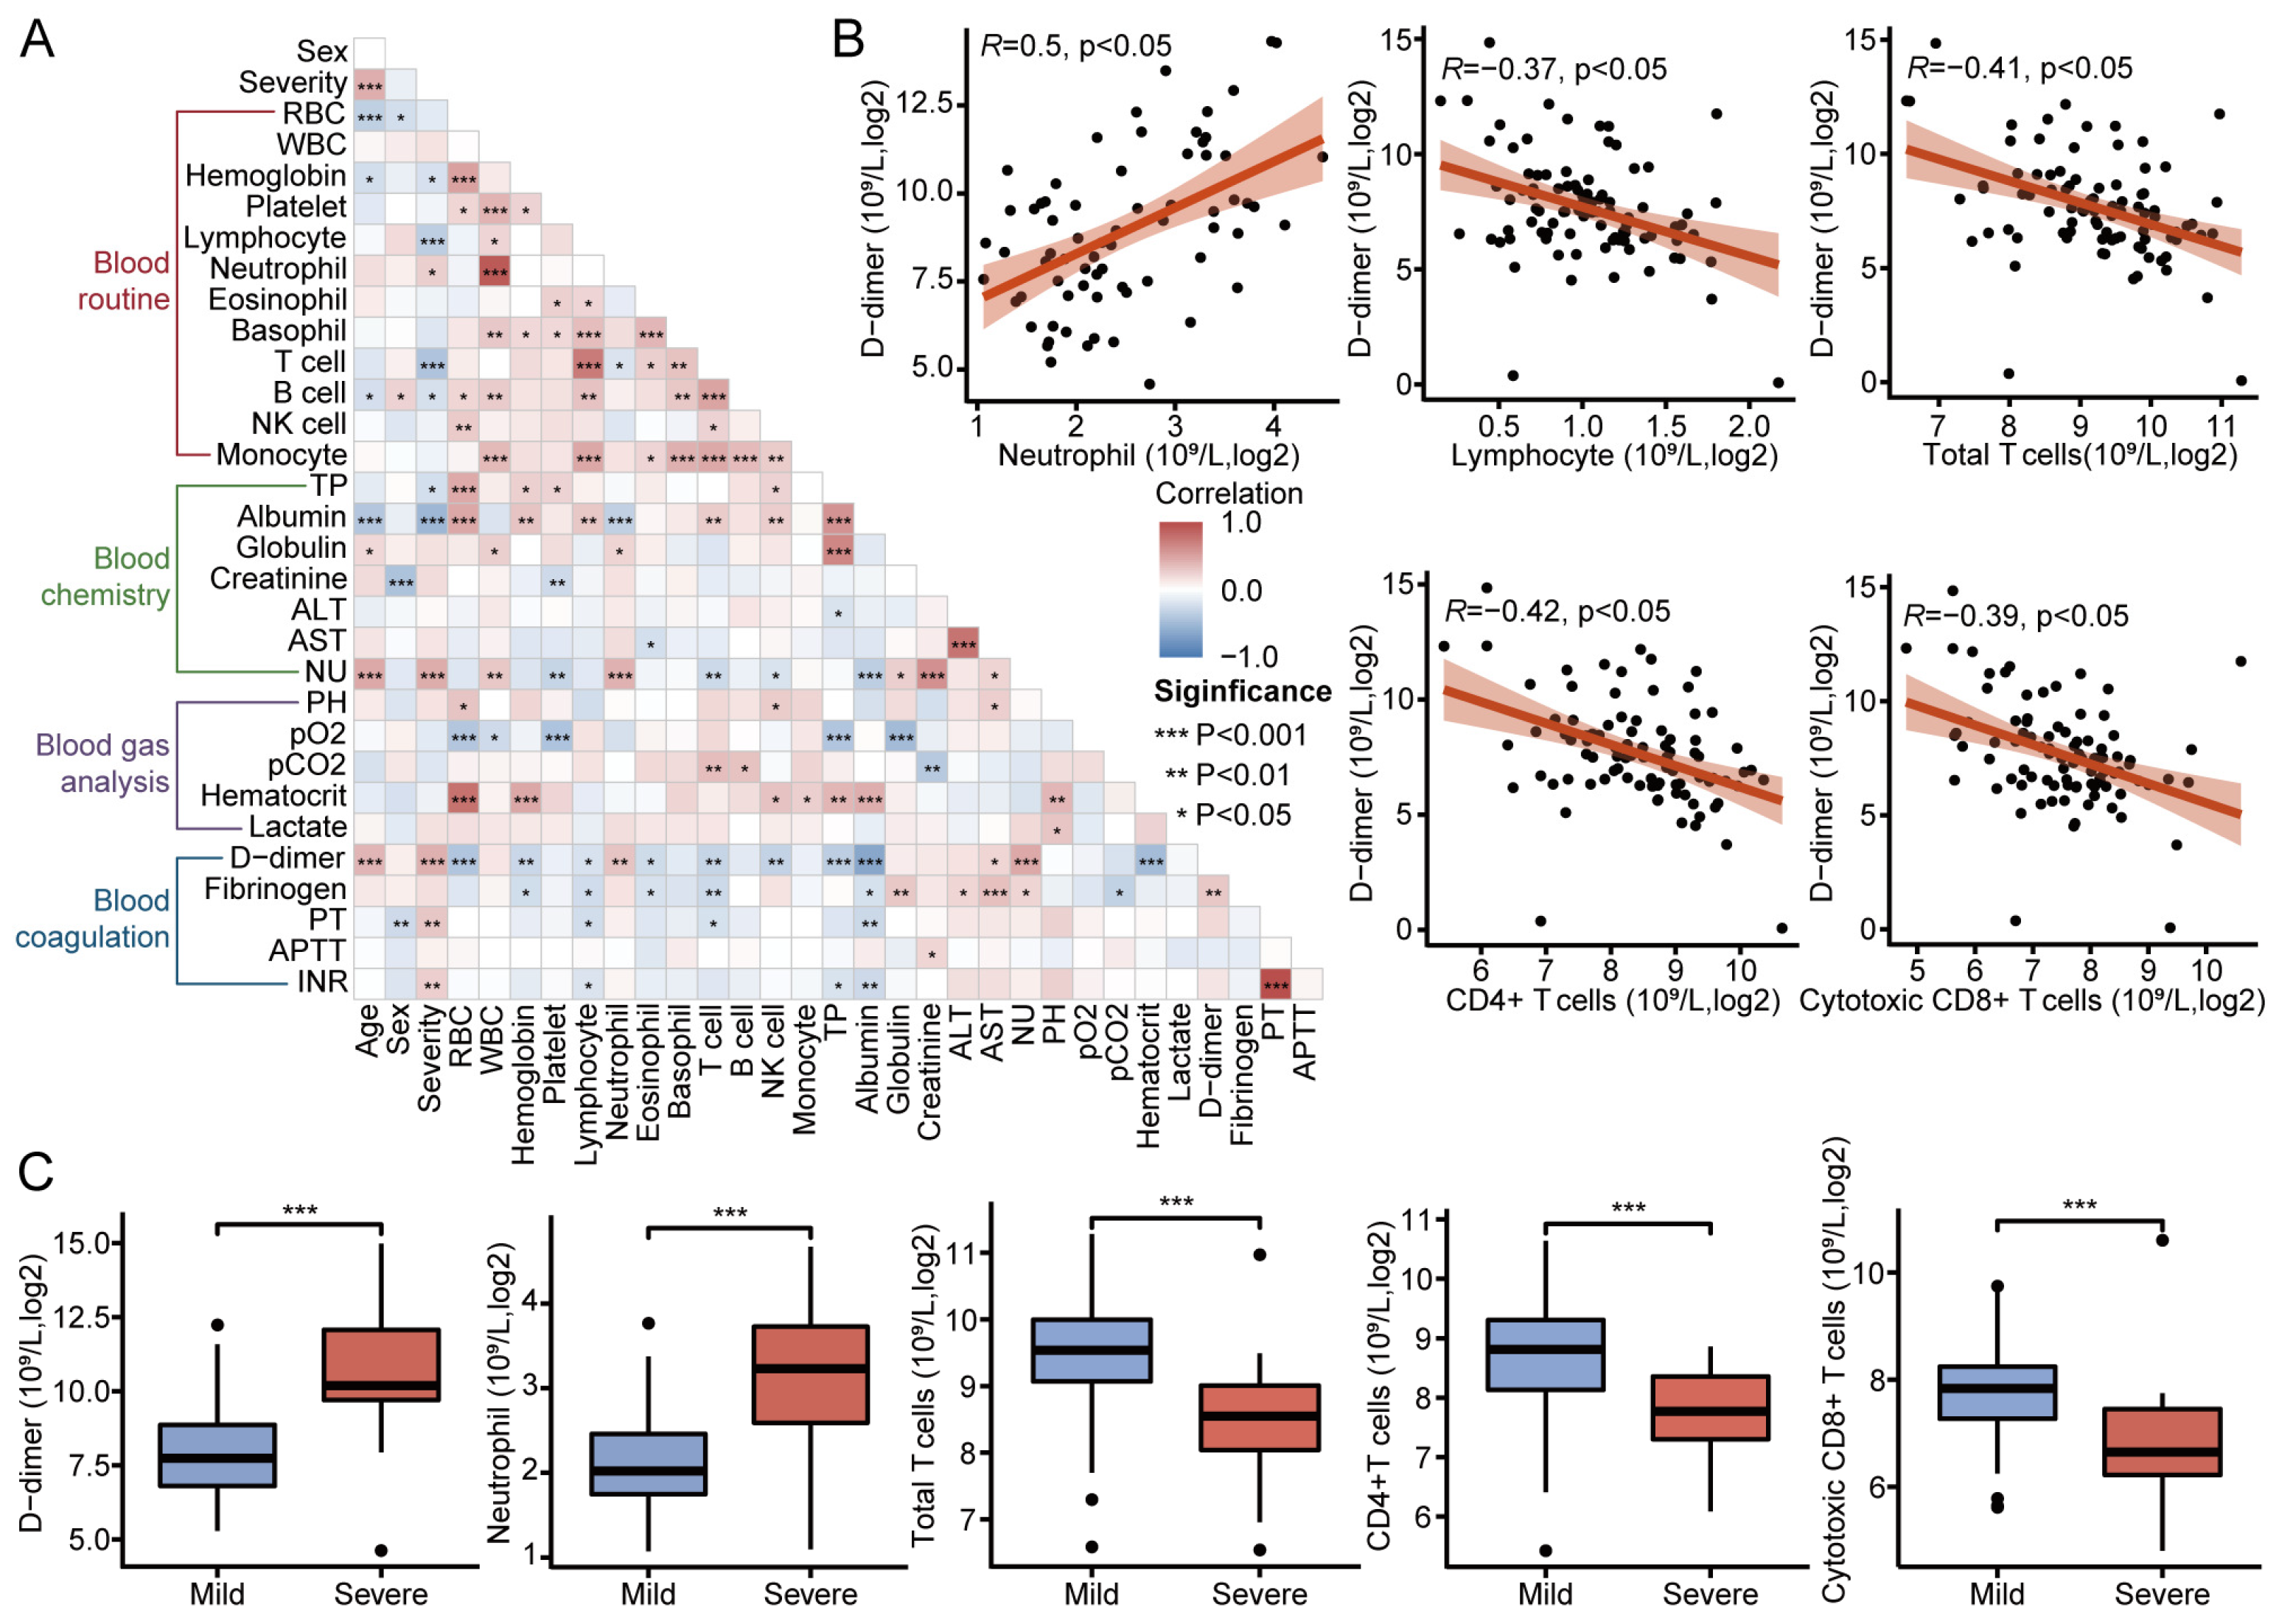
3.7. Clinical Metrics and Laboratory Test Results in Patients with COVID-19
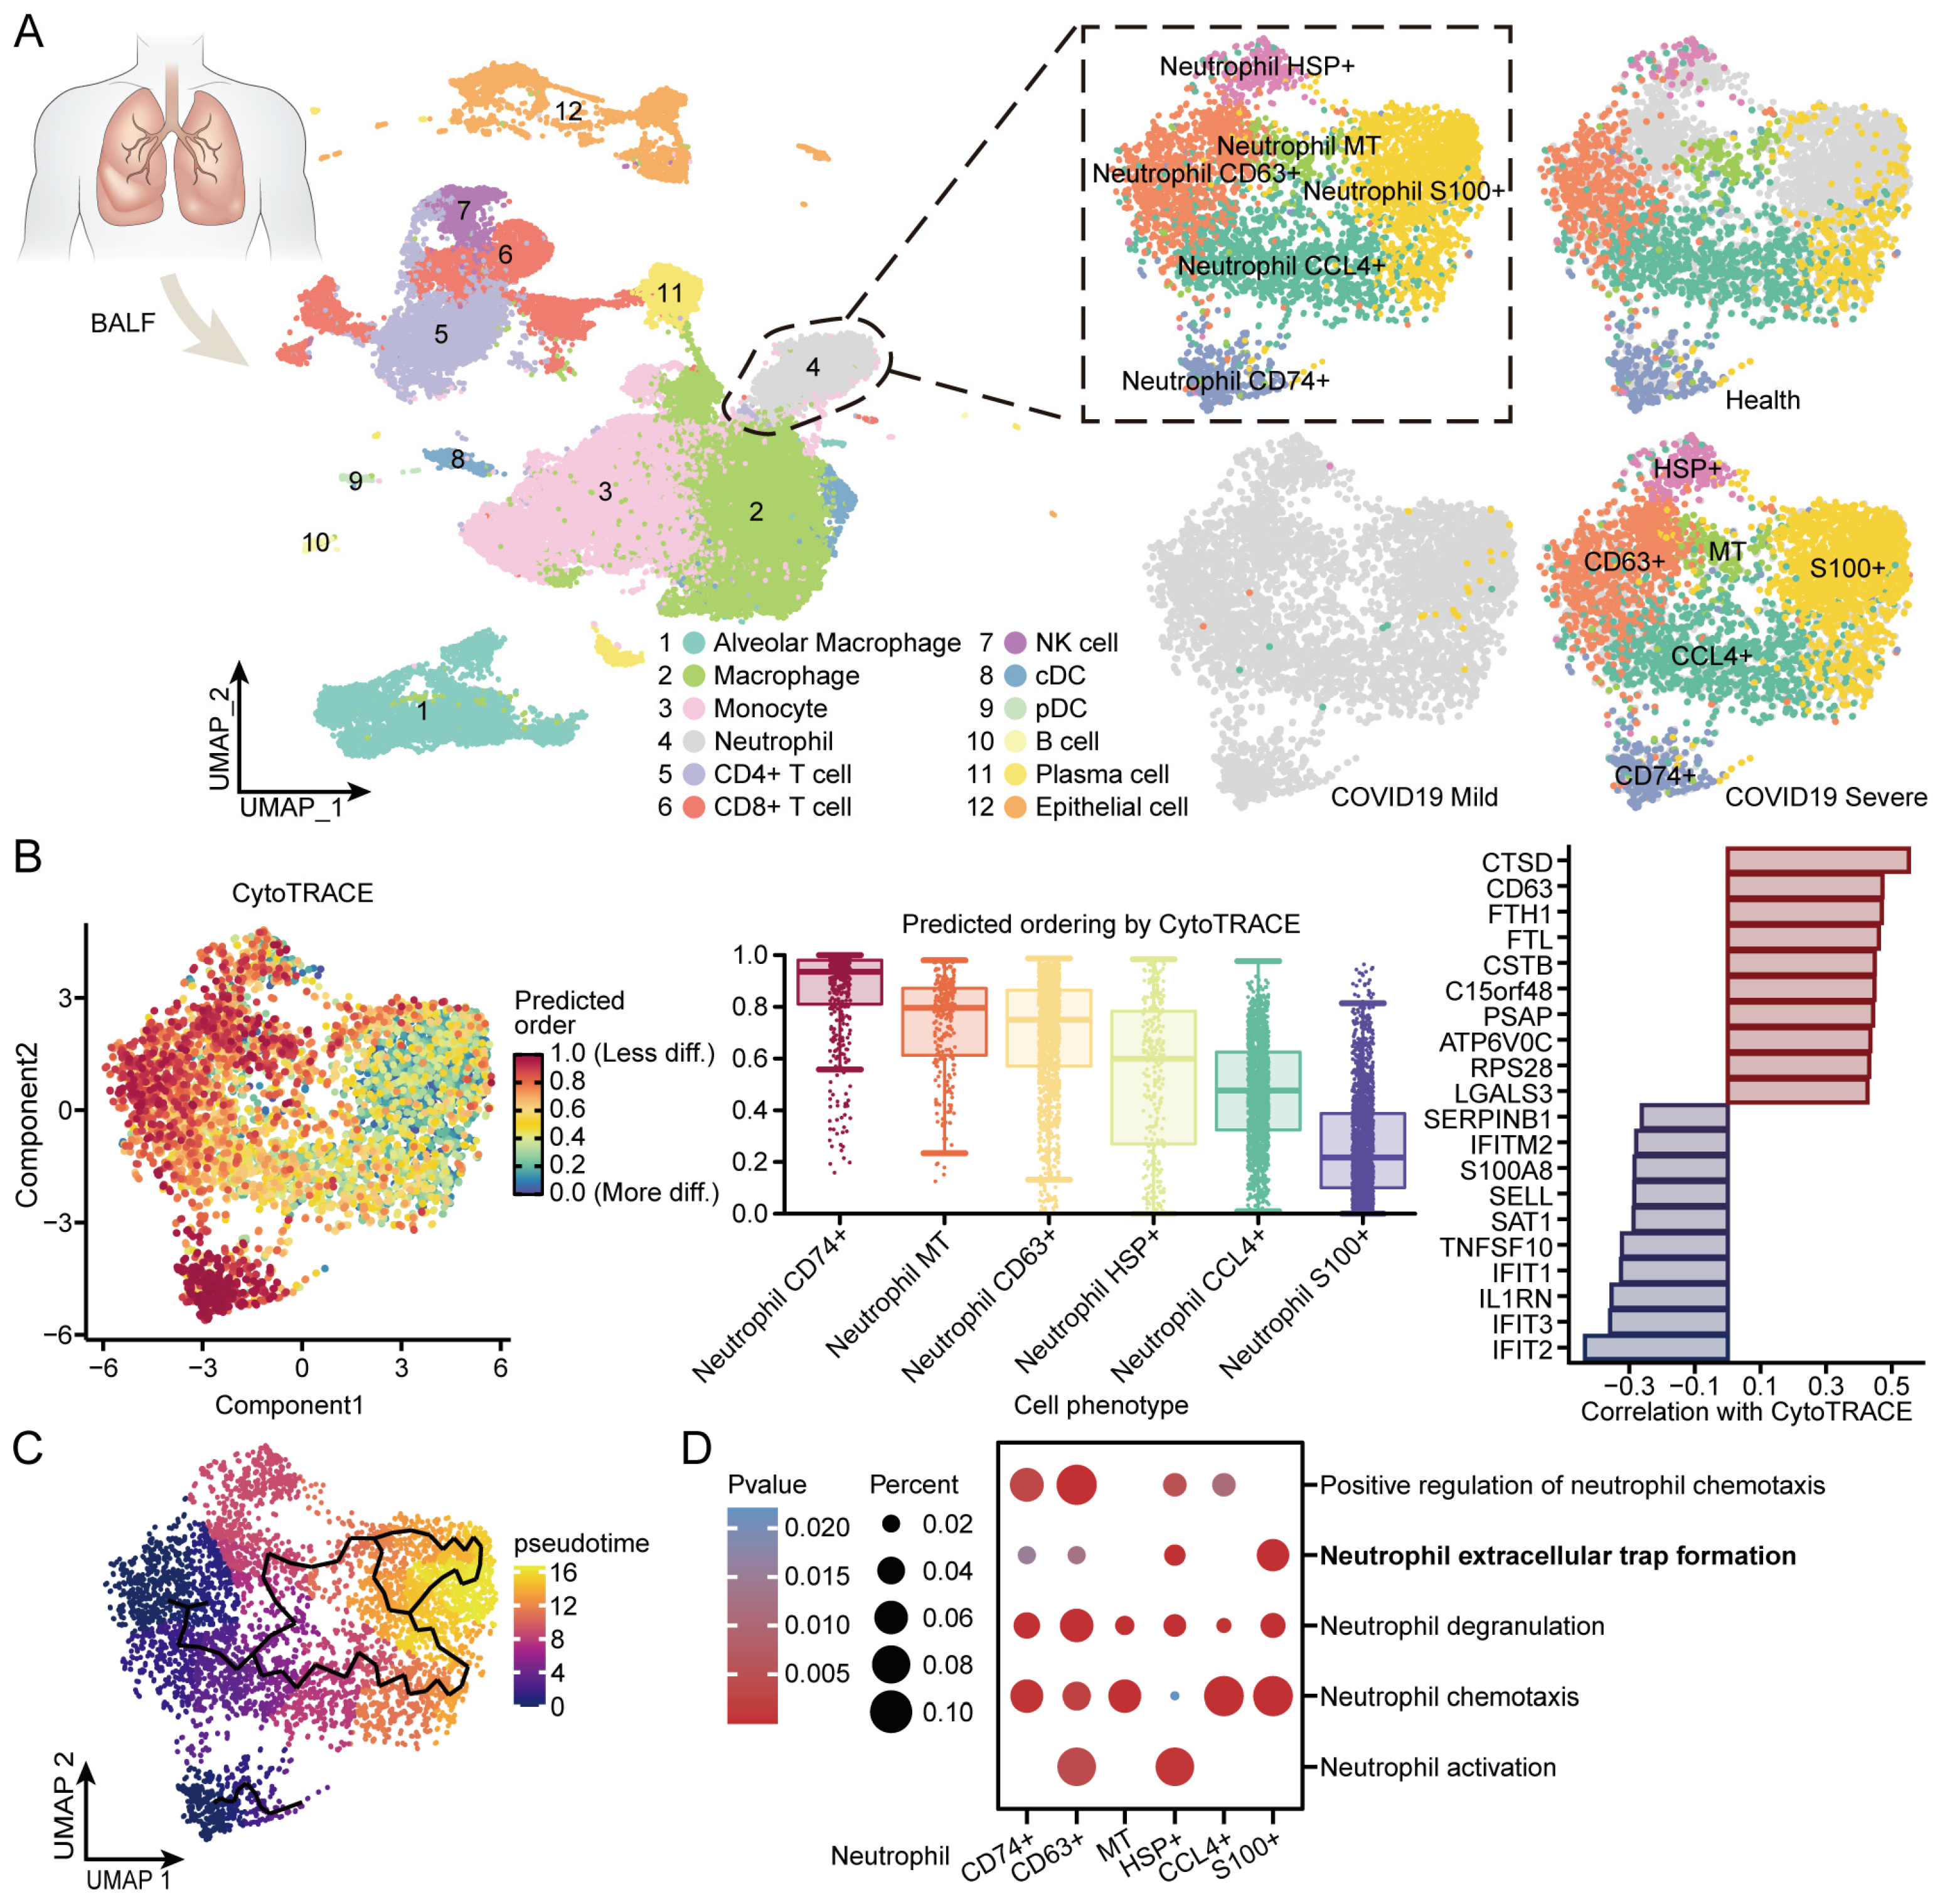
3.8. BALF Single-Cell Sequencing Reveals Internal Immune Shifts in Neutrophils from COVID-19 Patients
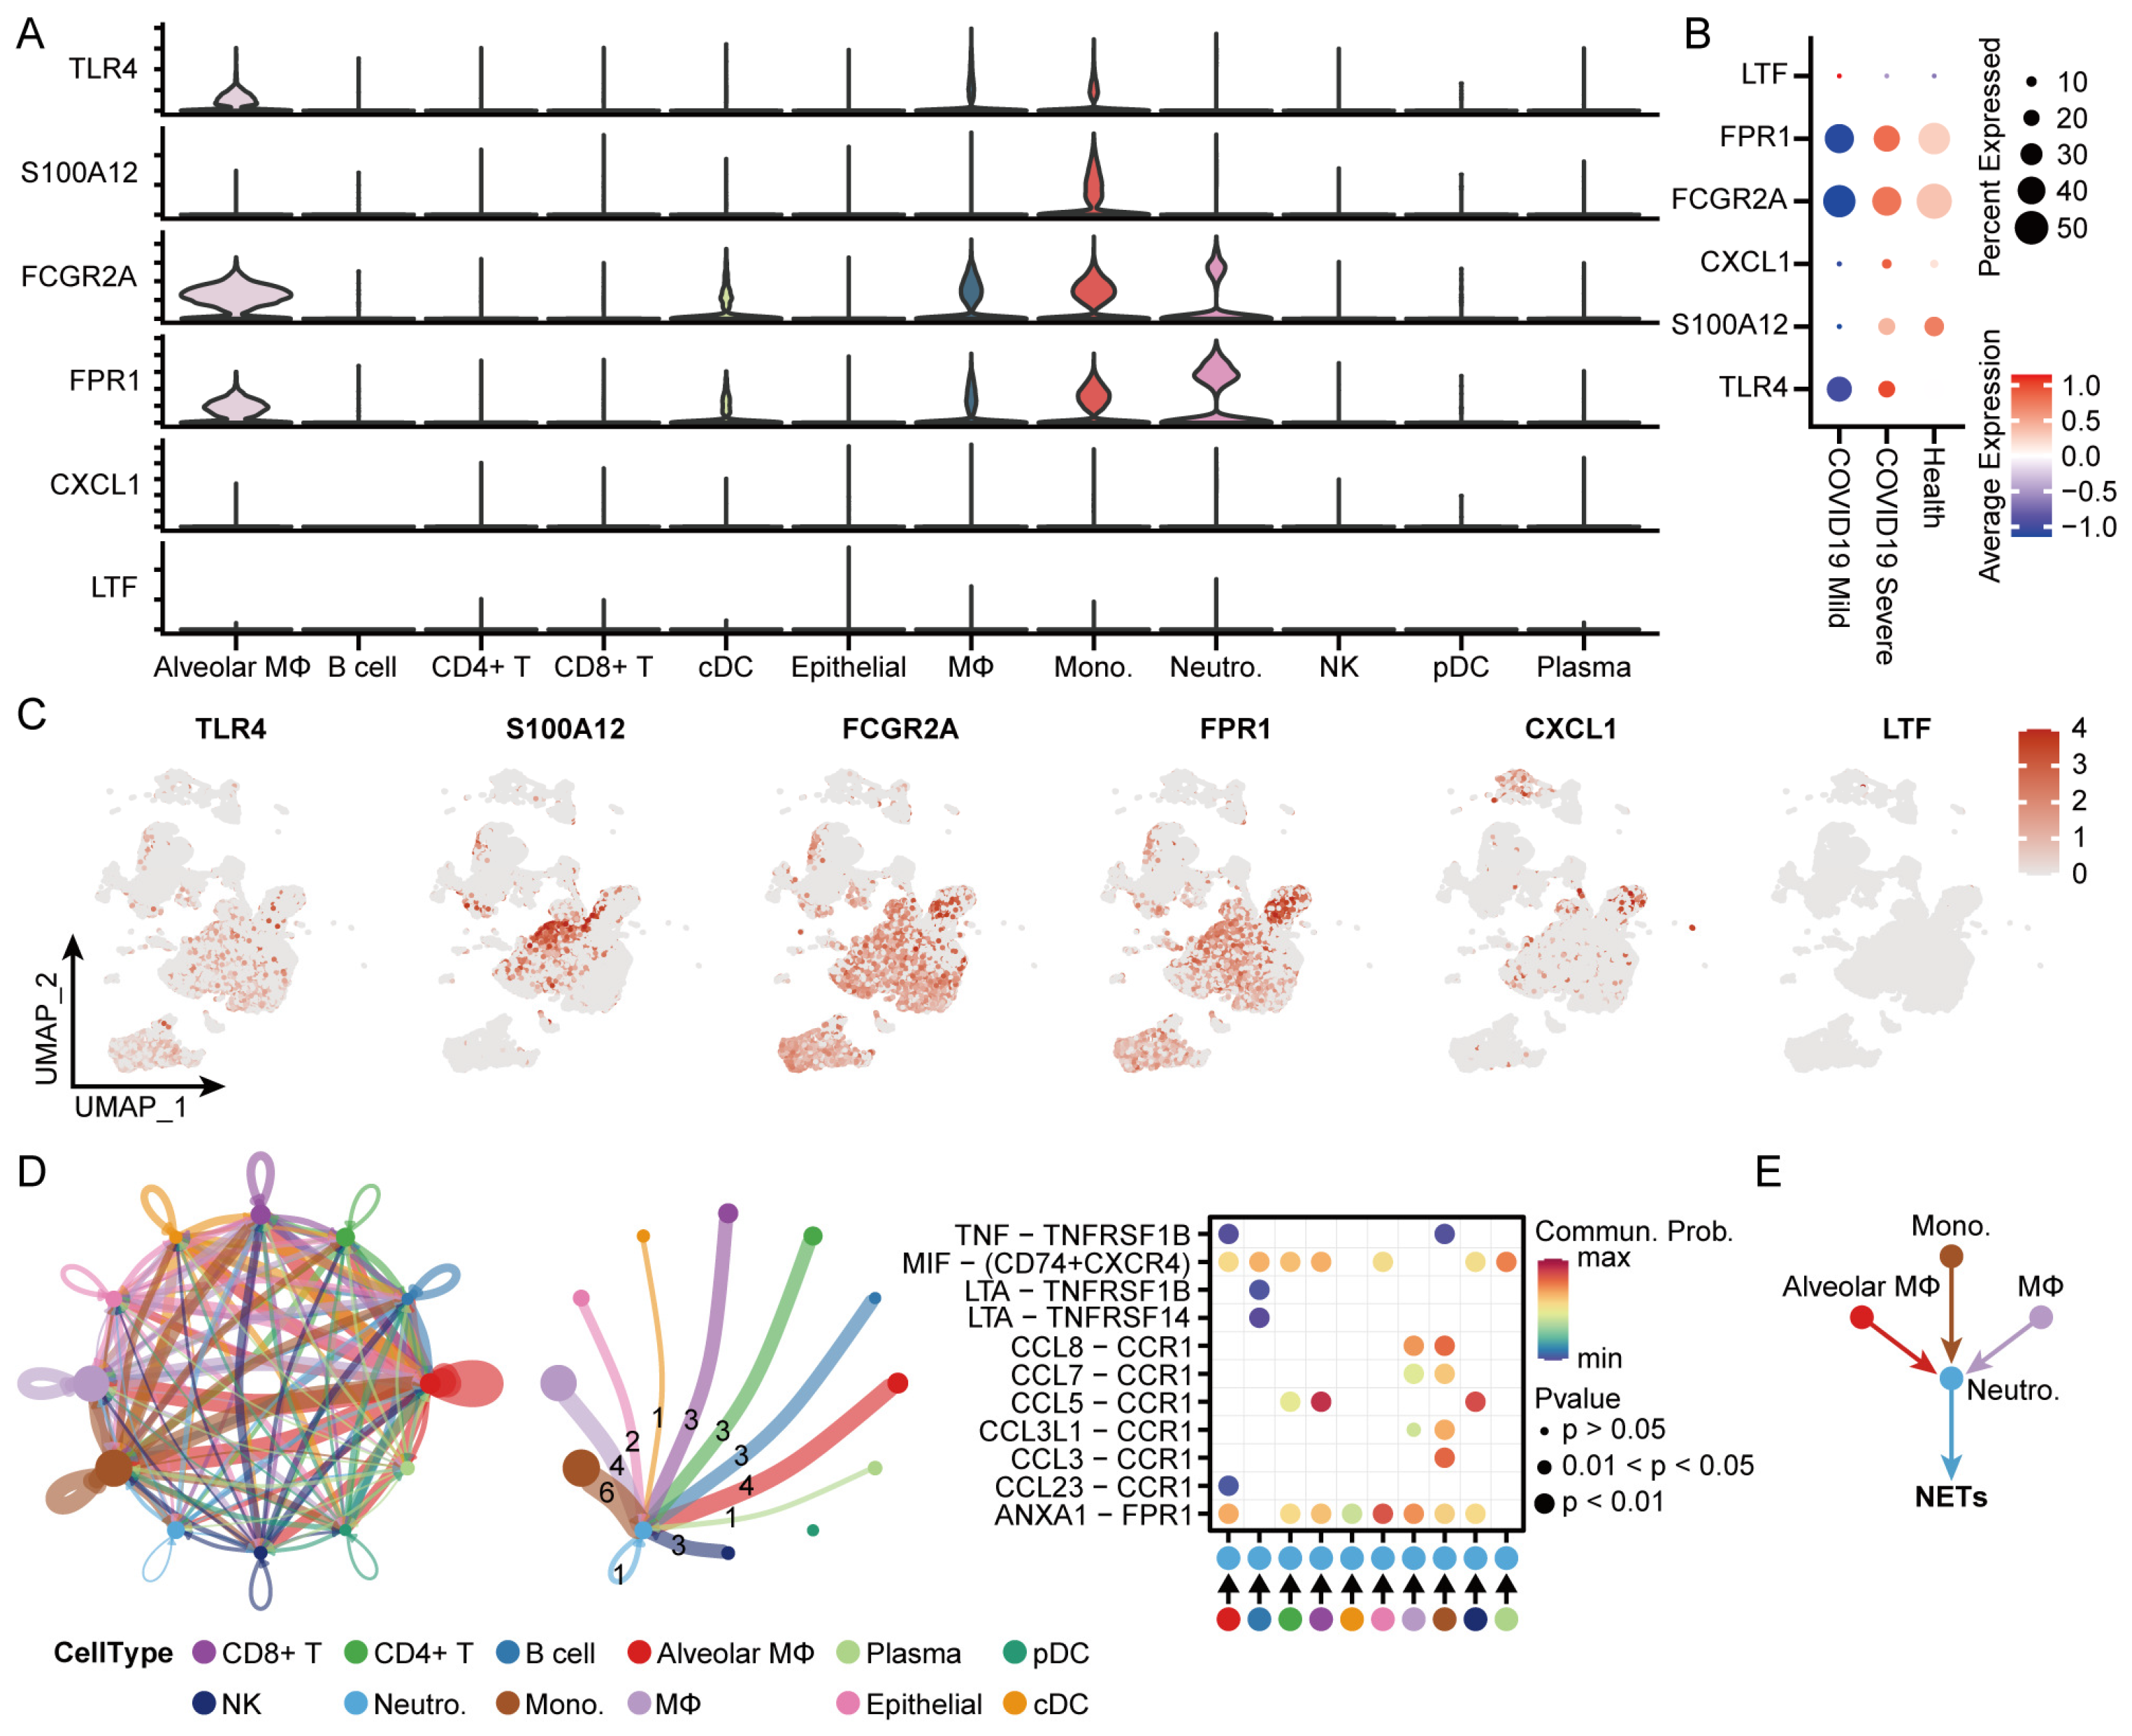
3.9. Identification of the Distribution and Cellular Communication of Hub Genes in Immune Cells from Patients with COVID-19
4. Discussion
5. Conclusions
6. Limitations
Supplementary Materials
Author Contributions
Funding
Data Availability Statement
Acknowledgments
Conflicts of Interest
References
- Dong, E.; Du, H.; Gardner, L. An Interactive Web-Based Dashboard to Track COVID-19 in Real Time. Lancet Infect. Dis. 2020, 20, 533–534. [Google Scholar] [CrossRef] [PubMed]
- Marini, J.J.; Gattinoni, L. Management of COVID-19 Respiratory Distress. JAMA 2020, 323, 2329–2330. [Google Scholar] [CrossRef] [PubMed]
- Zhou, F.; Yu, T.; Du, R.; Fan, G.; Liu, Y.; Liu, Z.; Xiang, J.; Wang, Y.; Song, B.; Gu, X.; et al. Clinical Course and Risk Factors for Mortality of Adult Inpatients with COVID-19 in Wuhan, China: A Retrospective Cohort Study. Lancet 2020, 395, 1054–1062. [Google Scholar] [CrossRef] [PubMed]
- Guan, J.; Wei, X.; Qin, S.; Liu, X.; Jiang, Y.; Chen, Y.; Chen, Y.; Lu, H.; Qian, J.; Wang, Z.; et al. Continuous Tracking of COVID-19 Patients’ Immune Status. Int. Immunopharmacol. 2020, 89, 107034. [Google Scholar] [CrossRef]
- Varga, Z.; Flammer, A.J.; Steiger, P.; Haberecker, M.; Andermatt, R.; Zinkernagel, A.S.; Mehra, M.R.; Schuepbach, R.A.; Ruschitzka, F.; Moch, H. Endothelial Cell Infection and Endotheliitis in COVID-19. Lancet 2020, 395, 1417–1418. [Google Scholar] [CrossRef] [PubMed]
- Liu, J.; Liu, Y.; Xiang, P.; Pu, L.; Xiong, H.; Li, C.; Zhang, M.; Tan, J.; Xu, Y.; Song, R.; et al. Neutrophil-to-Lymphocyte Ratio Predicts Critical Illness Patients with 2019 Coronavirus Disease in the Early Stage. J. Transl. Med. 2020, 18, 206. [Google Scholar] [CrossRef] [PubMed]
- Buja, L.M.; Wolf, D.A.; Zhao, B.; Akkanti, B.; McDonald, M.; Lelenwa, L.; Reilly, N.; Ottaviani, G.; Elghetany, M.T.; Trujillo, D.O.; et al. The Emerging Spectrum of Cardiopulmonary Pathology of the Coronavirus Disease 2019 (COVID-19): Report of 3 Autopsies from Houston, Texas, and Review of Autopsy Findings from Other United States Cities. Cardiovasc. Pathol. 2020, 48, 107233. [Google Scholar] [CrossRef] [PubMed]
- Middleton, E.A.; He, X.-Y.; Denorme, F.; Campbell, R.A.; Ng, D.; Salvatore, S.P.; Mostyka, M.; Baxter-Stoltzfus, A.; Borczuk, A.C.; Loda, M.; et al. Neutrophil Extracellular Traps Contribute to Immunothrombosis in COVID-19 Acute Respiratory Distress Syndrome. Blood 2020, 136, 1169–1179. [Google Scholar] [CrossRef] [PubMed]
- Leppkes, M.; Knopf, J.; Naschberger, E.; Lindemann, A.; Singh, J.; Herrmann, I.; Stürzl, M.; Staats, L.; Mahajan, A.; Schauer, C.; et al. Vascular Occlusion by Neutrophil Extracellular Traps in COVID-19. EBioMedicine 2020, 58, 102925. [Google Scholar] [CrossRef] [PubMed]
- Dou, Q.; Wei, X.; Zhou, K.; Yang, S.; Jia, P. Cardiovascular Manifestations and Mechanisms in Patients with COVID-19. Trends Endocrinol. Metab. 2020, 31, 893–904. [Google Scholar] [CrossRef] [PubMed]
- Tomar, B.; Anders, H.-J.; Desai, J.; Mulay, S.R. Neutrophils and Neutrophil Extracellular Traps Drive Necroinflammation in COVID-19. Cells 2020, 9, 1383. [Google Scholar] [CrossRef] [PubMed]
- Lai, G.; Liu, H.; Deng, J.; Li, K.; Xie, B. A Novel 3-Gene Signature for Identifying COVID-19 Patients Based on Bioinformatics and Machine Learning. Genes 2022, 13, 1602. [Google Scholar] [CrossRef] [PubMed]
- Wauters, E.; Van Mol, P.; Garg, A.D.; Jansen, S.; Van Herck, Y.; Vanderbeke, L.; Bassez, A.; Boeckx, B.; Malengier-Devlies, B.; Timmerman, A.; et al. Discriminating Mild from Critical COVID-19 by Innate and Adaptive Immune Single-Cell Profiling of Bronchoalveolar Lavages. Cell Res. 2021, 31, 272–290. [Google Scholar] [CrossRef] [PubMed]
- Schulte-Schrepping, J.; Reusch, N.; Paclik, D.; Baßler, K.; Schlickeiser, S.; Zhang, B.; Krämer, B.; Krammer, T.; Brumhard, S.; Bonaguro, L.; et al. Severe COVID-19 Is Marked by a Dysregulated Myeloid Cell Compartment. Cell 2020, 182, 1419–1440.e23. [Google Scholar] [CrossRef] [PubMed]
- Edgar, R.; Domrachev, M.; Lash, A.E. Gene Expression Omnibus: NCBI Gene Expression and Hybridization Array Data Repository. Nucleic Acids Res. 2002, 30, 207–210. [Google Scholar] [CrossRef] [PubMed]
- Zhou, Z.; Zhou, X.; Cheng, L.; Wen, L.; An, T.; Gao, H.; Deng, H.; Yan, Q.; Zhang, X.; Li, Y.; et al. Machine Learning Algorithms Utilizing Blood Parameters Enable Early Detection of Immunethrombotic Dysregulation in COVID-19. Clin. Transl. Med. 2021, 11, e523. [Google Scholar] [CrossRef]
- Ritchie, M.E.; Phipson, B.; Wu, D.; Hu, Y.; Law, C.W.; Shi, W.; Smyth, G.K. Limma Powers Differential Expression Analyses for RNA-Sequencing and Microarray Studies. Nucleic Acids Res. 2015, 43, e47. [Google Scholar] [CrossRef] [PubMed]
- Langfelder, P.; Horvath, S. WGCNA: An R Package for Weighted Correlation Network Analysis. BMC Bioinform. 2008, 9, 559. [Google Scholar] [CrossRef] [PubMed]
- Oksanen, J.; Blanchet, F.G.; Kindt, R.; Legendre, P.; Minchin, P.; O’Hara, B.; Simpson, G.; Solymos, P.; Stevens, H.; Wagner, H. Vegan: Community Ecology Package. R Package, Version 2.2-1; R Core Team: Vienna, Austria, 2015. [Google Scholar]
- Ashburner, M.; Ball, C.A.; Blake, J.A.; Botstein, D.; Butler, H.; Cherry, J.M.; Davis, A.P.; Dolinski, K.; Dwight, S.S.; Eppig, J.T.; et al. Gene Ontology: Tool for the Unification of Biology. The Gene Ontology Consortium. Nat. Genet. 2000, 25, 25–29. [Google Scholar] [CrossRef] [PubMed]
- Gene Ontology Consortium; Aleksander, S.A.; Balhoff, J.; Carbon, S.; Cherry, J.M.; Drabkin, H.J.; Ebert, D.; Feuermann, M.; Gaudet, P.; Harris, N.L.; et al. The Gene Ontology Knowledgebase in 2023. Genetics 2023, 224, iyad031. [Google Scholar] [CrossRef] [PubMed]
- Kanehisa, M.; Goto, S. KEGG: Kyoto Encyclopedia of Genes and Genomes. Nucleic Acids Res. 2000, 28, 27–30. [Google Scholar] [CrossRef] [PubMed]
- Thomas, P.D.; Ebert, D.; Muruganujan, A.; Mushayahama, T.; Albou, L.-P.; Mi, H. PANTHER: Making Genome-Scale Phylogenetics Accessible to All. Protein Sci. 2022, 31, 8–22. [Google Scholar] [CrossRef] [PubMed]
- Yu, G.; Wang, L.-G.; Han, Y.; He, Q.-Y. clusterProfiler: An R Package for Comparing Biological Themes among Gene Clusters. OMICS 2012, 16, 284–287. [Google Scholar] [CrossRef] [PubMed]
- Ggplot2: Elegant Graphics for Data Analysis (3e). Available online: https://ggplot2-book.org/ (accessed on 24 March 2024).
- Szklarczyk, D.; Kirsch, R.; Koutrouli, M.; Nastou, K.; Mehryary, F.; Hachilif, R.; Gable, A.L.; Fang, T.; Doncheva, N.T.; Pyysalo, S.; et al. The STRING Database in 2023: Protein-Protein Association Networks and Functional Enrichment Analyses for Any Sequenced Genome of Interest. Nucleic Acids Res. 2023, 51, D638–D646. [Google Scholar] [CrossRef] [PubMed]
- Doncheva, N.T.; Morris, J.H.; Gorodkin, J.; Jensen, L.J. Cytoscape StringApp: Network Analysis and Visualization of Proteomics Data. J. Proteome Res. 2019, 18, 623–632. [Google Scholar] [CrossRef]
- Chin, C.-H.; Chen, S.-H.; Wu, H.-H.; Ho, C.-W.; Ko, M.-T.; Lin, C.-Y. cytoHubba: Identifying Hub Objects and Sub-Networks from Complex Interactome. BMC Syst. Biol. 2014, 8 (Suppl. S4), S11. [Google Scholar] [CrossRef] [PubMed]
- Evangelista, J.E.; Xie, Z.; Marino, G.B.; Nguyen, N.; Clarke, D.J.B.; Ma’ayan, A. Enrichr-KG: Bridging Enrichment Analysis across Multiple Libraries. Nucleic Acids Res. 2023, 51, W168–W179. [Google Scholar] [CrossRef] [PubMed]
- Xia, J.; Gill, E.E.; Hancock, R.E.W. NetworkAnalyst for Statistical, Visual and Network-Based Meta-Analysis of Gene Expression Data. Nat. Protoc. 2015, 10, 823–844. [Google Scholar] [CrossRef] [PubMed]
- Yoo, M.; Shin, J.; Kim, J.; Ryall, K.A.; Lee, K.; Lee, S.; Jeon, M.; Kang, J.; Tan, A.C. DSigDB: Drug Signatures Database for Gene Set Analysis. Bioinformatics 2015, 31, 3069–3071. [Google Scholar] [CrossRef] [PubMed]
- Newman, A.M.; Liu, C.L.; Green, M.R.; Gentles, A.J.; Feng, W.; Xu, Y.; Hoang, C.D.; Diehn, M.; Alizadeh, A.A. Robust Enumeration of Cell Subsets from Tissue Expression Profiles. Nat. Methods 2015, 12, 453–457. [Google Scholar] [CrossRef] [PubMed]
- Liao, M.; Liu, Y.; Yuan, J.; Wen, Y.; Xu, G.; Zhao, J.; Cheng, L.; Li, J.; Wang, X.; Wang, F.; et al. Single-Cell Landscape of Bronchoalveolar Immune Cells in Patients with COVID-19. Nat. Med. 2020, 26, 842–844. [Google Scholar] [CrossRef] [PubMed]
- Stuart, T.; Butler, A.; Hoffman, P.; Hafemeister, C.; Papalexi, E.; Mauck, W.M.; Hao, Y.; Stoeckius, M.; Smibert, P.; Satija, R. Comprehensive Integration of Single-Cell Data. Cell 2019, 177, 1888–1902.e21. [Google Scholar] [CrossRef] [PubMed]
- Gulati, G.S.; Sikandar, S.S.; Wesche, D.J.; Manjunath, A.; Bharadwaj, A.; Berger, M.J.; Ilagan, F.; Kuo, A.H.; Hsieh, R.W.; Cai, S.; et al. Single-Cell Transcriptional Diversity Is a Hallmark of Developmental Potential. Science 2020, 367, 405–411. [Google Scholar] [CrossRef] [PubMed]
- Cao, J.; Spielmann, M.; Qiu, X.; Huang, X.; Ibrahim, D.M.; Hill, A.J.; Zhang, F.; Mundlos, S.; Christiansen, L.; Steemers, F.J.; et al. The Single-Cell Transcriptional Landscape of Mammalian Organogenesis. Nature 2019, 566, 496–502. [Google Scholar] [CrossRef]
- Jin, S.; Guerrero-Juarez, C.F.; Zhang, L.; Chang, I.; Ramos, R.; Kuan, C.-H.; Myung, P.; Plikus, M.V.; Nie, Q. Inference and Analysis of Cell-Cell Communication Using CellChat. Nat. Commun. 2021, 12, 1088. [Google Scholar] [CrossRef] [PubMed]
- R: A Language and Environment for Statistical Computing. Available online: https://www.semanticscholar.org/paper/R%3A-A-language-and-environment-for-statistical-Team/659408b243cec55de8d0a3bc51b81173007aa89b (accessed on 24 March 2024).
- Pullano, G.; Di Domenico, L.; Sabbatini, C.E.; Valdano, E.; Turbelin, C.; Debin, M.; Guerrisi, C.; Kengne-Kuetche, C.; Souty, C.; Hanslik, T.; et al. Underdetection of Cases of COVID-19 in France Threatens Epidemic Control. Nature 2021, 590, 134–139. [Google Scholar] [CrossRef] [PubMed]
- Shin, H.-Y. A Multi-Stage SEIR(D) Model of the COVID-19 Epidemic in Korea. Ann. Med. 2021, 53, 1159–1169. [Google Scholar] [CrossRef] [PubMed]
- Al-Kuraishy, H.M.; Al-Gareeb, A.I.; Al-Hussaniy, H.A.; Al-Harcan, N.A.H.; Alexiou, A.; Batiha, G.E.-S. Neutrophil Extracellular Traps (NETs) and Covid-19: A New Frontiers for Therapeutic Modality. Int. Immunopharmacol. 2022, 104, 108516. [Google Scholar] [CrossRef] [PubMed]
- Petrazzuolo, A.; Le Naour, J.; Vacchelli, E.; Gaussem, P.; Ellouze, S.; Jourdi, G.; Solary, E.; Fontenay, M.; Smadja, D.M.; Kroemer, G. No Impact of Cancer and Plague-Relevant FPR1 Polymorphisms on COVID-19. Oncoimmunology 2020, 9, 1857112. [Google Scholar] [CrossRef] [PubMed]
- Kuley, R.; Duvvuri, B.; Wallin, J.J.; Bui, N.; Adona, M.V.; O’Connor, N.G.; Sahi, S.K.; Stanaway, I.B.; Wurfel, M.M.; Morrell, E.D.; et al. Mitochondrial N-Formyl Methionine Peptides Contribute to Exaggerated Neutrophil Activation in Patients with COVID-19. Virulence 2023, 14, 2218077. [Google Scholar] [CrossRef] [PubMed]
- Qin, S.; Yao, X.; Li, W.; Wang, C.; Xu, W.; Gan, Z.; Yang, Y.; Zhong, A.; Wang, B.; He, Z.; et al. Novel Insight into the Underlying Dysregulation Mechanisms of Immune Cell-to-Cell Communication by Analyzing Multitissue Single-Cell Atlas of Two COVID-19 Patients. Cell Death Dis. 2023, 14, 286. [Google Scholar] [CrossRef] [PubMed]
- Lee, H.; Park, J.; Im, H.-J.; Na, K.J.; Choi, H. Discovery of Potential Imaging and Therapeutic Targets for Severe Inflammation in COVID-19 Patients. Sci. Rep. 2021, 11, 14151. [Google Scholar] [CrossRef] [PubMed]
- Li, Y.; Liu, Y.; Duo, M.; Wu, R.; Jiang, T.; Li, P.; Wang, Y.; Cheng, Z. Bioinformatic Analysis and Preliminary Validation of Potential Therapeutic Targets for COVID-19 Infection in Asthma Patients. Cell Commun. Signal 2022, 20, 201. [Google Scholar] [CrossRef] [PubMed]
- Apostolidis, S.A.; Sarkar, A.; Giannini, H.M.; Goel, R.R.; Mathew, D.; Suzuki, A.; Baxter, A.E.; Greenplate, A.R.; Alanio, C.; Abdel-Hakeem, M.; et al. Signaling Through FcγRIIA and the C5a-C5aR Pathway Mediate Platelet Hyperactivation in COVID-19. Front. Immunol. 2022, 13, 834988. [Google Scholar] [CrossRef] [PubMed]
- Von Hundelshausen, P.; Lorenz, R.; Siess, W.; Weber, C. Vaccine-Induced Immune Thrombotic Thrombocytopenia (VITT): Targeting Pathomechanisms with Bruton Tyrosine Kinase Inhibitors. Thromb. Haemost. 2021, 121, 1395–1399. [Google Scholar] [CrossRef] [PubMed]
- Zusso, M.; Lunardi, V.; Franceschini, D.; Pagetta, A.; Lo, R.; Stifani, S.; Frigo, A.C.; Giusti, P.; Moro, S. Ciprofloxacin and Levofloxacin Attenuate Microglia Inflammatory Response via TLR4/NF-kB Pathway. J. Neuroinflammation 2019, 16, 148. [Google Scholar] [CrossRef] [PubMed]
- Frank, M.G.; Nguyen, K.H.; Ball, J.B.; Hopkins, S.; Kelley, T.; Baratta, M.V.; Fleshner, M.; Maier, S.F. SARS-CoV-2 Spike S1 Subunit Induces Neuroinflammatory, Microglial and Behavioral Sickness Responses: Evidence of PAMP-like Properties. Brain Behav. Immun. 2022, 100, 267–277. [Google Scholar] [CrossRef] [PubMed]
- Alves, H.R.; Lomba, G.S.B.; Gonçalves-de-Albuquerque, C.F.; Burth, P. Irisin, Exercise, and COVID-19. Front. Endocrinol. 2022, 13, 879066. [Google Scholar] [CrossRef] [PubMed]
- Liu, Z.-M.; Yang, M.-H.; Yu, K.; Lian, Z.-X.; Deng, S.-L. Toll-like Receptor (TLRs) Agonists and Antagonists for COVID-19 Treatments. Front. Pharmacol. 2022, 13, 989664. [Google Scholar] [CrossRef] [PubMed]
- Carvalho, A.; Lu, J.; Francis, J.D.; Moore, R.E.; Haley, K.P.; Doster, R.S.; Townsend, S.D.; Johnson, J.G.; Damo, S.M.; Gaddy, J.A. S100A12 in Digestive Diseases and Health: A Scoping Review. Gastroenterol. Res. Pract. 2020, 2020, 2868373. [Google Scholar] [CrossRef]
- Lei, H. A Single Transcript for the Prognosis of Disease Severity in COVID-19 Patients. Sci. Rep. 2021, 11, 12174. [Google Scholar] [CrossRef] [PubMed]
- Russell, C.D.; Valanciute, A.; Gachanja, N.N.; Stephen, J.; Penrice-Randal, R.; Armstrong, S.D.; Clohisey, S.; Wang, B.; Al Qsous, W.; Wallace, W.A.; et al. Tissue Proteomic Analysis Identifies Mechanisms and Stages of Immunopathology in Fatal COVID-19. Am. J. Respir. Cell Mol. Biol. 2022, 66, 196–205. [Google Scholar] [CrossRef] [PubMed]
- Arunachalam, P.S.; Wimmers, F.; Mok, C.K.P.; Perera, R.A.P.M.; Scott, M.; Hagan, T.; Sigal, N.; Feng, Y.; Bristow, L.; Tak-Yin Tsang, O.; et al. Systems Biological Assessment of Immunity to Mild versus Severe COVID-19 Infection in Humans. Science 2020, 369, 1210–1220. [Google Scholar] [CrossRef] [PubMed]
- Korbecki, J.; Maruszewska, A.; Bosiacki, M.; Chlubek, D.; Baranowska-Bosiacka, I. The Potential Importance of CXCL1 in the Physiological State and in Noncancer Diseases of the Cardiovascular System, Respiratory System and Skin. Int. J. Mol. Sci. 2022, 24, 205. [Google Scholar] [CrossRef] [PubMed]
- Chua, R.L.; Lukassen, S.; Trump, S.; Hennig, B.P.; Wendisch, D.; Pott, F.; Debnath, O.; Thürmann, L.; Kurth, F.; Völker, M.T.; et al. COVID-19 Severity Correlates with Airway Epithelium-Immune Cell Interactions Identified by Single-Cell Analysis. Nat. Biotechnol. 2020, 38, 970–979. [Google Scholar] [CrossRef]
- Mohamed, Y.; El-Maradny, Y.A.; Saleh, A.K.; Nayl, A.A.; El-Gendi, H.; El-Fakharany, E.M. A Comprehensive Insight into Current Control of COVID-19: Immunogenicity, Vaccination, and Treatment. Biomed. Pharmacother. 2022, 153, 113499. [Google Scholar] [CrossRef] [PubMed]
- Şimşek-Yavuz, S.; Komsuoğlu Çelikyurt, F.I. An Update of Anti-Viral Treatment of COVID-19. Turk. J. Med. Sci. 2021, 51, 3372–3390. [Google Scholar] [CrossRef]
- Naidu, S.A.G.; Clemens, R.A.; Pressman, P.; Zaigham, M.; Kadkhoda, K.; Davies, K.J.A.; Naidu, A.S. COVID-19 during Pregnancy and Postpartum. J. Diet. Suppl. 2022, 19, 115–142. [Google Scholar] [CrossRef] [PubMed]
- Masso-Silva, J.A.; Moshensky, A.; Lam, M.T.Y.; Odish, M.F.; Patel, A.; Xu, L.; Hansen, E.; Trescott, S.; Nguyen, C.; Kim, R.; et al. Increased Peripheral Blood Neutrophil Activation Phenotypes and Neutrophil Extracellular Trap Formation in Critically Ill Coronavirus Disease 2019 (COVID-19) Patients: A Case Series and Review of the Literature. Clin. Infect. Dis. 2022, 74, 479–489. [Google Scholar] [CrossRef] [PubMed]
- Shi, S.; Nie, B.; Chen, X.; Cai, Q.; Lin, C.; Zhao, G.; Zhang, X. Clinical and Laboratory Characteristics of Severe and Non-Severe Patients with COVID-19: A Retrospective Cohort Study in China. J. Clin. Lab. Anal. 2021, 35, e23692. [Google Scholar] [CrossRef]
- Zuo, Y.; Yalavarthi, S.; Shi, H.; Gockman, K.; Zuo, M.; Madison, J.A.; Blair, C.; Weber, A.; Barnes, B.J.; Egeblad, M.; et al. Neutrophil Extracellular Traps in COVID-19. JCI Insight 2020, 5, e138999. [Google Scholar] [CrossRef] [PubMed]
- Chiang, C.-C.; Korinek, M.; Cheng, W.-J.; Hwang, T.-L. Targeting Neutrophils to Treat Acute Respiratory Distress Syndrome in Coronavirus Disease. Front. Pharmacol. 2020, 11, 572009. [Google Scholar] [CrossRef] [PubMed]
- Hazeldine, J.; Lord, J.M. Neutrophils and COVID-19: Active Participants and Rational Therapeutic Targets. Front. Immunol. 2021, 12, 680134. [Google Scholar] [CrossRef] [PubMed]
- Martinod, K.; Wagner, D.D. Thrombosis: Tangled up in NETs. Blood 2014, 123, 2768–2776. [Google Scholar] [CrossRef] [PubMed]
- Torres-Ruiz, J.; Absalón-Aguilar, A.; Nuñez-Aguirre, M.; Pérez-Fragoso, A.; Carrillo-Vázquez, D.A.; Maravillas-Montero, J.L.; Mejía-Domínguez, N.R.; Llorente, L.; Alcalá-Carmona, B.; Lira-Luna, J.; et al. Neutrophil Extracellular Traps Contribute to COVID-19 Hyperinflammation and Humoral Autoimmunity. Cells 2021, 10, 2545. [Google Scholar] [CrossRef] [PubMed]
- Martinod, K.; Deppermann, C. Immunothrombosis and Thromboinflammation in Host Defense and Disease. Platelets 2021, 32, 314–324. [Google Scholar] [CrossRef] [PubMed]
- Genchi, A.; Semerano, A.; Schwarz, G.; Dell’Acqua, B.; Gullotta, G.S.; Sampaolo, M.; Boeri, E.; Quattrini, A.; Sanvito, F.; Diamanti, S.; et al. Neutrophils Predominate the Immune Signature of Cerebral Thrombi in COVID-19 Stroke Patients. Acta Neuropathol. Commun. 2022, 10, 14. [Google Scholar] [CrossRef] [PubMed]


| Gene | logFC | Pval | FDR | Regulate |
|---|---|---|---|---|
| EGLN1 | 2.02491 | 1.72 × 10⁻¹⁰ | 2.12 × 10⁻⁶ | UP |
| MANSC1 | 3.00036 | 1.10 × 10⁻⁹ | 2.31 × 10⁻⁶ | UP |
| PDK3 | 1.18087 | 1.24 × 10⁻⁹ | 2.31 × 10⁻⁶ | UP |
| HIST2H2BE | 1.21761 | 1.26 × 10⁻⁹ | 2.31 × 10⁻⁶ | UP |
| KCNJ2 | 3.12549 | 1.61 × 10⁻⁹ | 2.31 × 10⁻⁶ | UP |
| TGFA | 2.78342 | 1.71 × 10⁻⁹ | 2.31 × 10⁻⁶ | UP |
| SULT1B1 | 2.6309 | 1.75 × 10⁻⁹ | 2.31 × 10⁻⁶ | UP |
| CMTM1 | 2.31296 | 1.77 × 10⁻⁹ | 2.31 × 10⁻⁶ | UP |
| PPP1R3D | 1.93043 | 2.15 × 10⁻⁹ | 2.31 × 10⁻⁶ | UP |
| KBTBD7 | 1.96831 | 2.20 × 10⁻⁹ | 2.31 × 10⁻⁶ | UP |
Disclaimer/Publisher’s Note: The statements, opinions and data contained in all publications are solely those of the individual author(s) and contributor(s) and not of MDPI and/or the editor(s). MDPI and/or the editor(s) disclaim responsibility for any injury to people or property resulting from any ideas, methods, instructions or products referred to in the content. |
© 2024 by the authors. Licensee MDPI, Basel, Switzerland. This article is an open access article distributed under the terms and conditions of the Creative Commons Attribution (CC BY) license (https://creativecommons.org/licenses/by/4.0/).
Share and Cite
Zhou, Z.; Zeng, X.; Liao, J.; Dong, X.; Deng, Y.; Wang, Y.; Zhou, M. Immune Characteristic Genes and Neutrophil Immune Transformation Studies in Severe COVID-19. Microorganisms 2024, 12, 737. https://doi.org/10.3390/microorganisms12040737
Zhou Z, Zeng X, Liao J, Dong X, Deng Y, Wang Y, Zhou M. Immune Characteristic Genes and Neutrophil Immune Transformation Studies in Severe COVID-19. Microorganisms. 2024; 12(4):737. https://doi.org/10.3390/microorganisms12040737
Chicago/Turabian StyleZhou, Zhaoming, Xin Zeng, Jing Liao, Xinfeng Dong, Yinyun Deng, Yinghui Wang, and Meijuan Zhou. 2024. "Immune Characteristic Genes and Neutrophil Immune Transformation Studies in Severe COVID-19" Microorganisms 12, no. 4: 737. https://doi.org/10.3390/microorganisms12040737
APA StyleZhou, Z., Zeng, X., Liao, J., Dong, X., Deng, Y., Wang, Y., & Zhou, M. (2024). Immune Characteristic Genes and Neutrophil Immune Transformation Studies in Severe COVID-19. Microorganisms, 12(4), 737. https://doi.org/10.3390/microorganisms12040737