Abstract
The global dissemination of SARS-CoV-2 resulted in the emergence of several variants, including Alpha, Alpha + E484K, Beta, and Omicron. Our research integrated the study of eukaryotic translation factors and fundamental components in general protein synthesis with the analysis of SARS-CoV-2 variants and vaccination status. Utilizing statistical methods, we successfully differentiated between variants in infected individuals and, to a lesser extent, between vaccinated and non-vaccinated infected individuals, relying on the expression profiles of translation factors. Additionally, our investigation identified common causal relationships among the translation factors, shedding light on the interplay between SARS-CoV-2 variants and the host’s translation machinery.
1. Introduction
Coronaviruses belong to the order of Nidovirales and infect mammals and birds [1,2]. The positive single-stranded RNA virus SARS-CoV-2 is related to MERS-CoV and SARS-CoV and causes acute and severe respiratory symptoms. In contrast, other widespread coronaviruses from the genus Alphacoronavirus cause seasonally clustered, usually mild, infections of the respiratory and gastrointestinal tracts in humans [3,4]. SARS-CoV-2 enters the cell via ACE2 or alternative receptors like C-type lectins, CD147, NRP1, or others [5]. After membrane fusion, the viral RNA is released in the cytoplasm, where non-structural proteins form replication organelles. Viral structural proteins and genomic RNA synthesized at the replication sites are translocated to the ER–Golgi intermediate compartment (ERGIC), where virus assembly and budding occur [6]. Among all the host cell structures and functionalities, viruses depend on the protein synthesis machinery inter alia. Viruses can directly target ribosomal proteins, ribosomal biogenesis factors, and translation initiation factors, emphasizing the synthesis of viral proteins and repressing the translation of host mRNAs [7,8,9,10,11]. One hotspot of the betacoronavirus SARS-CoV-2 after the outbreak in Wuhan [12,13,14] was Ischgl in early March 2020 [15].
The translation of RNA into proteins is a major level of regulating gene expression and is important for homeostasis and rapid intracellular responses to environmental triggers [6]. EIFs are required to assemble the 80S ribosome consisting of mRNA and initiator tRNA as well as 40S and 60S ribosomal subunits [16]. The canonical translation mechanism used by the majority of human RNAs depends on interaction with the 5′-cap structure and is therefore also referred to as cap-dependent translation. Here, the eIF4F complex, comprising the cap-binding eIF4E, DNA helicase eIF4A, and scaffolding eIF4G, binds mRNA for translation initiation. eIF3 interacts with eIF4G and the ribosome, bringing them together in a complex that further contains eIF2 and an initiator met-tRNA. The process is enhanced by the interaction of eIF4G with the poly-A binding protein PABP, a process that circularizes the mRNA [17].
However, phosphorylated eIF2α results in protein shutdown and cell death [18]. Moreover, the P38MAPK and ERK pathways are stimulated by SARS-CoV-2, enabling EIF4E to enhance translation following phosphorylation by p38 MAPK and ERK1/2-mediated phosphorylation of Mnk1 [19]. SARS-CoV-2 interactions were reported to be associated with EIF4H [20], EIF4G [21], and EIF4E [21]. Additionally, an association of eIF3 and SARS-CoV-2 was found [22].
Since eIFs are targeted by many viruses upon cell entry, providing a favorable condition for their own replication [23], we thereby investigated the expression differences in the eukaryotic translation factors and mTOR between different variants. We found evidence that eukaryotic translation factors are regulated to different levels between the virus variants (Alpha, Alpha + E484K, Beta, and Omicron) and also upon vaccination, representative of the grade of severity. Interrupting the translation machinery might have a beneficial impact on the disease course.
2. Materials and Methods
2.1. Data and Samples
The data for the analyses were based on mRNA expression upon the response of the cells by SARS-CoV-2 infections.
Total RNA was extracted from the buffy coat (white blood cells) of whole blood samples. A purification was executed using a Maxwell RSC simply RNA Blood Kit. The quality and concentration of the RNA were evaluated with an Agilent Bioanalyzer 2100 device (Agilent, Santa Clara, CA, USA).
Maxwell RSC simply RNA Blood purification kits were used for extracting RNA from the patients’ blood. Reverse transcriptase with random priming was used to create cDNA. Primers with sequences from ARTICnetwork were employed to generate 400 bp amplicons in 2 varying PCR pools. Following the amplification and merging of the pools, libraries were established with a QIASeq FX DNA Library UDI kit (Qiagen, Hilden, Germany). Illumina NextSeq 500/550 was used for sequencing, combined with 149 bp paired-end reads and 10 bp indices (Illumina, San Diego, CA, USA). An assembly of viral sequences was performed using CLC Genomics workbench v20.0.3 (Qiagen, Hilden, Germany). As a reference genome, SARS-CoV-2 Wuhan-Hu-1 was used (Accession NC_045512.2). FASTA files from http://cov-lineages.org/ (accessed on 20 November 2023) assisted the identification of SARS-CoV-2 variants. Poly-T oligo hybridization assisted the Poly-A-containing mRNA purification from 1 µg of RNA. SuperScript III (Invitrogen, Waltham, MA, USA) was used to synthesize cDNA. TruSeq Stranded mRNA Library Prep Kits (Illumina, San Diego, CA, USA, RS-20020595) were used to prepare the libraries for sequencing. Paired-end sequencing was performed with NovaSeq 6000 (Illumina, San Diego, CA, USA) with a yield of 190 million reads per sample.
The gene names are written italic, and the protein names are written standard.
2.2. Patient Cohort
Samples from patients were pooled and compared with healthy individuals (not asymptomatic, never infected, recovered) to obtain log2fold changes (Table 1).

Table 1.
Pooled groups, group size, number (n) of male and female patients, and the median age of the groups and, if available, the severity and the days after a positive PCR result. The healthy group consisted of 30 individuals (median: 72 years, male: 4, female: 26).
2.3. Statistical Analyses
Paredes et al. stated that the Beta variant led, percentual, to more hospitalizations than the Alpha and Omicron variants, with the Omicron variant being the least severe [24]. Under the assumption of severity, Alpha, Alpha + E484K, and Omicron were compared to Beta, and samples with vaccination were compared to samples without vaccination (Table 2).
Table 2.
Gene expression groups for statistics with log2foldchanges. Sixteen groups, with each group consisting of multiple samples, were used.
The z-scores were calculated using the following formula:
where µ is considered the mean of the group, σ is the standard deviation, and x is the datapoint, i.e., the median of the other group to be compared.
For calculating the precision and recall, the genes of the samples of each variant were compared with the same genes of the Beta variant, and the genes of each sample without vaccination were compared with the same genes of the vaccination samples. Log2fold changes were used.
True Positive (TP): current value Beta variant/Unvaccinated > arithmetic mean other variant/Vaccinated
False Positive (FP): current value Beta variant/Unvaccinated < arithmetic mean other variant/Vaccinated
True Negative (TN): arithmetic mean Beta variant/Unvaccinated > current value other variant/Vaccinated
False Negative (FN): arithmetic mean Beta variant/Unvaccinated < current value other variant/Vaccinated
Precision was calculated according to the following formula:
Recall was calculated using the following formula:
The F1 score was calculated as follows:
The following genes were extracted for statistical analysis: EEF1DP3, EEF1E1, EIF1, EIF2S3, EIF3I, EIF4A2, EIF4G1, EIF4G2, EIF4H, EIF5, EIF5A, EIF4E, EIF1AX, EIF3K, EIF3M, EIF1AY, EEF1B2, MRRF, EIF6, EIF3A, EIF3E, EIF3L, EEF1A1, EIF4B, EEF1D, EIF2B5, EIF2B4, EIF2S2, EIF3D, EIF3H, EIF5A2, EIF2A, EEF2, EEF1G, EIF3C, EIF3G, EIF2B1, EIF2S1, EIF5B, EIF2B3, EIF3J, MTOR, EIF3B, EEF1A2, and EIF2B2.
The package pcalg [25] (version 2.7.9) was used to create to a directed acyclic graph (DAG) using the functions skeleton and pc with gaussCItest to test for conditional independence and an alpha of 0.01 based on the log2fold changes.
The machine learning approach used in this study was based on the ML DotNet framework [26] (version 4.0.30319). The matrix of log2fold changes for each of the genes was used as the feature (type single) and the variant (type string, categorical), respectively, and the vaccination state (type string, categorical) was used as label for prediction. Finding the best model run took 10 min. The highest accuracy was achieved with the trainer LbfgsLogisticRegressionOva (prediction of SARS-CoV-2 variant). FastTreeOva led to the highest accuracy for the prediction of the vaccination state.
For the Restricted Boltzmann Machine (RBM) neural network, the R package [27] with the function darch (version 0.13.0) was used, including the following parameters: epochs = 50, layers (10, 10, 1), stopClassErr = 0, and retainData = TRUE. The CrossTable function was called using the R package gmodels (version 2.18.1.1).
2.4. Groups
The following samples were pooled to variant groups and to vaccination state groups of infected individuals. Samples were collected, and the data were obtained in the context of the following studies [28,29,30].
3. Results
Testing for conditional independence between the genetic expressions of eukaryotic translation factors revealed a direction from the elongation factors EEF1A1 to EEF1G and from EEF1G to EEF2. EIF3G pointed to EEF2. EIF2B1 and EIF2B4 directed to EIF2B5, and EIF2S1 and EIF4G2 pointed to EIF5. Unmeasured confounds were found for EEF1A1 and EIF4B, EEF1B2 and EIF3E, EEF1DP3 and EIF1AY, EIF1 and EIF5B, and EIF2S2 and EIF3H. No directions between variables were obtained for EEF1A2, EEF1D, EEF1E1, EIF1AX, EIF2A, EIF2B2, EIF2B3, EIF2S3, EIF3A, EIF3B, EIF3C, EIF3D, EIF3I, EIF3J, EIF3K, EIF3L, EIF3M, EIF4A2, EIF4E, EIF4G1, EIF4H, EIF5A, EIF5A2, EIF6, MRRF, and MTOR (Figure 1).
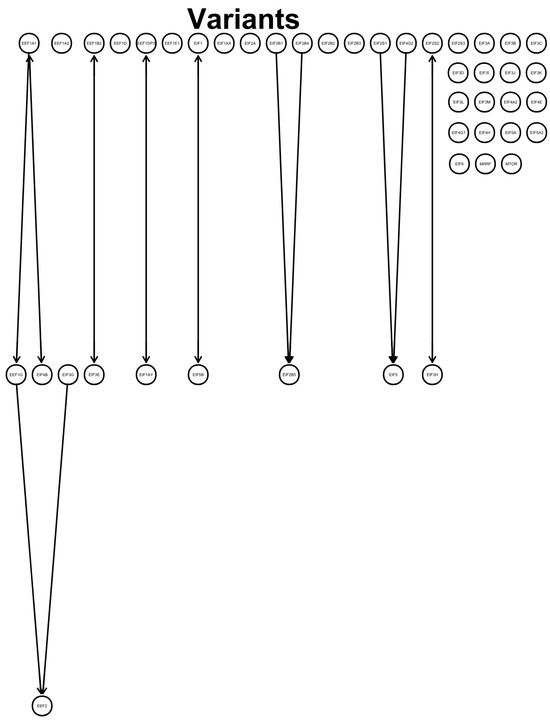
Figure 1.
Graph: directed acyclic graph (DAG) shows a defined directed flow (lines and arrows) between the investigated genes. Variables were tested for conditional independence based on log2fold changes using pooled SARS-CoV-2 variants that led to directions between variables. Each gene expression (circle with gene symbol) was tested against the others for conditional independence. Found relations indicate a flow from one gene to another, as indicated by an arrowhead towards the target variable. No connected line represents no found connection between the variables, and arrowheads both from the next variable to the previous variable and from the previous variable to the next variable indicate an unmeasured confound.
Vaccinated Samples Resulted in z-Scores Higher Than 1 for EIF1AY
EIF1AX, EIF2S3, and EIF4A2 showed a decrease of more than −1, and EEF1E1 led to a z-score of lower than −2 compared with the unvaccinated samples (Figure 2).
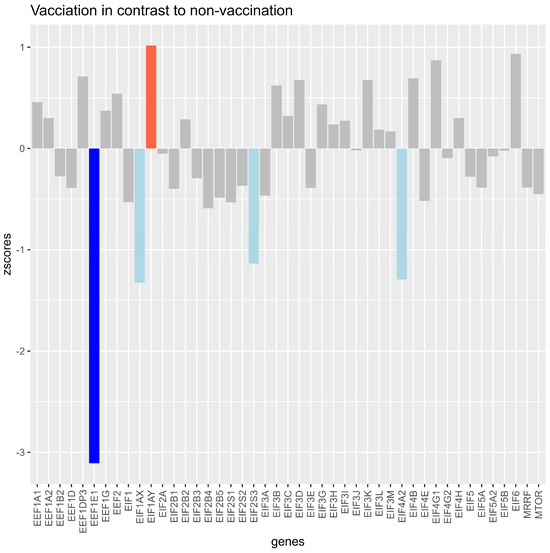
Figure 2.
Z-scores of log2fold changes in translation factors and mTOR between samples of unvaccinated versus vaccinated samples (median datapoint), with all variants pooled together. The bars show how much the expression of the vaccinated group differed from the expression of the unvaccinated group for each investigated gene. Light blue bars indicate that the z-score was between −1 and lower than −2 for the gene, indicating a standardized lower expression of the vaccinated group for the gene. The dark blue bar indicates a z-score higher than −1, showing that the expression of the vaccinated group was lower than −2 compared with the unvaccinated group for the gene. The light red bar indicates that the expression (z-score higher than 1 and lower than 2) for the gene was higher in the vaccinated group.
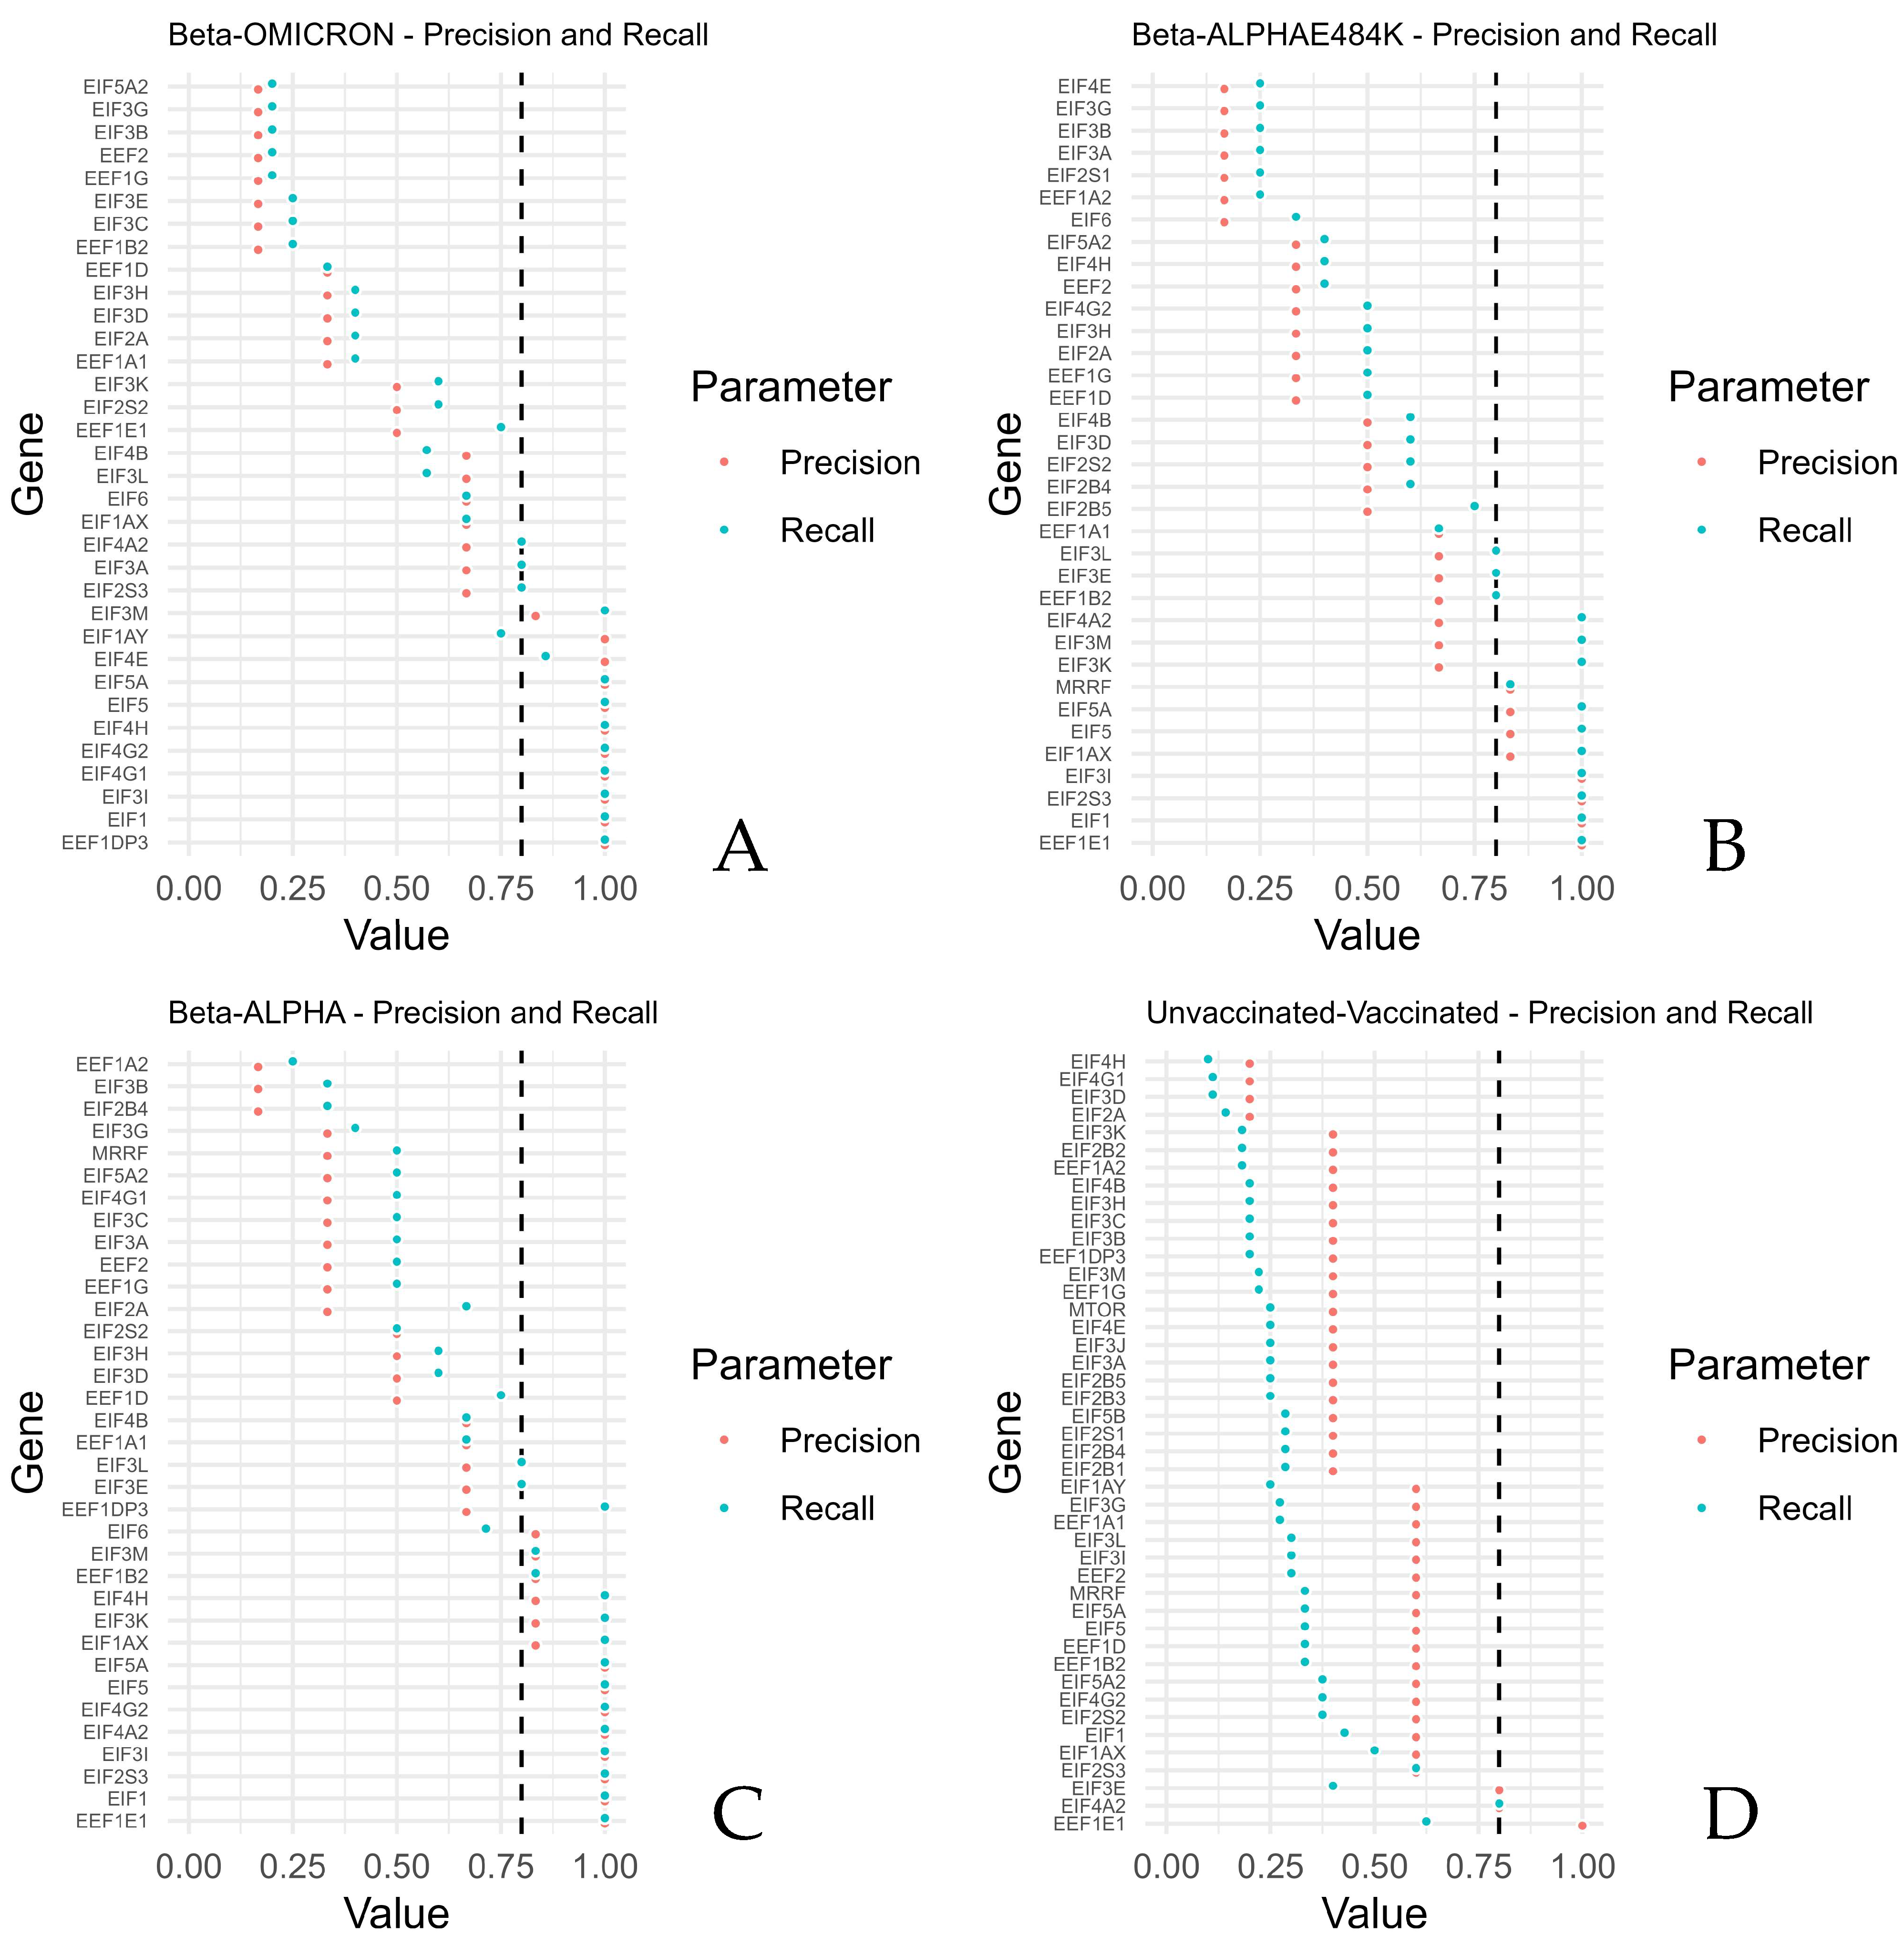
The highest precisions and recalls were calculated for EEF1E1, EIF1, EIF2S3, EIF3I, EIF4A2, EIF4G2, EIF5, and EIF5A (Beta compared with Alpha), reflecting generally higher expressions of the mRNAs of Beta, thus reflecting generally higher expressions of these mRNAs upon a SARS-CoV-2 Beta infection. EEF1E1, EIF1, EIF2S3, and EIF3I revealed the highest precisions when the Beta variant was compared with the Alpha variant in combination with the mutation E484K. Beta compared with Omicron revealed the highest precisions and recalls for EEF1DP3, EIF1, EIF3I, EIF4G1, EIF4G2, EIF4H, EIF5, EIF4E, and EIF5A.
In contrast, the lowest values of precisions and recalls were retrieved for EIF2B4, EIF3B, and EEF1A2 (Beta compared with Alpha). EIF6, EEF1A2, EIF2S1, EIF3A, EIF3B, EIF3G, and EIFEG showed the lowest precisions and recalls after Beta was compared with Alpha, including the mutation E484K. Beta versus Omicron revealed the lowest precision and recall for EEF1B2, EIF3C, EIF3E, EEF1G, EEF2, EIF3B, EIF3G, and EIF5A2.
The lowest precisions and recalls were obtained for EIF2A, EIF3D, EIF4G1, and EIF4H when the unvaccinated samples were compared with the vaccinated samples.
High precisions and recalls were calculated for EIF4A2 and EEF1E1 when samples of the unvaccinated group were compared with samples of the vaccinated group (Figure 3). Supplementary Table S1 shows the F1 scores.
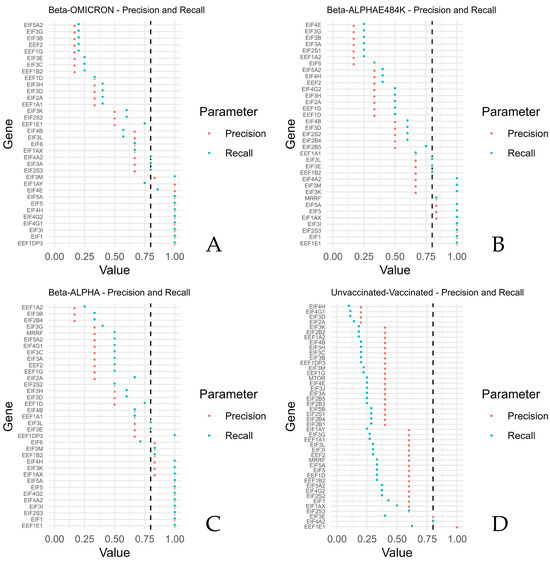
Figure 3.
Precision against recall for the translation factors and mTOR, grouped by comparisons of Beta versus ALPHA, Beta versus ALPHA and E484K, Beta versus OMICRON, and unvaccinated versus vaccinated. For each sample of the compared groups, higher values indicate that the expression of the unvaccinated group was more often higher than the vaccinated group, respectively, and that the expression of the Beta group was more often higher than the expression of each other group (ALPHA, E48K, or OMICRON) for the investigated genes. The figure shows the precision and recall per gene for (A) Beta–OMICRON, (B) Beta–ALPHAE484K, (C) Beta–ALPHA and (D) unvaccinated–vaccinated.
With machine learning, an accuracy of 0.75 based on the log2fold changes in the different translation factors and MTOR to predict the variant type was archived. Using the log2fold changes for the prediction of the vaccination status resulted in an accuracy of 0.60.
By using a Restricted Boltzmann Machine neural network, Beta (6/6) and Omicron (4/4) could be classified correctly. A distinction between Alpha and Alpha + E484K resulted in a false-classifying of Alpha as Alpha + E484K and vice versa.
4. Discussion
Despite extensive research efforts, an effective therapeutic intervention targeting the causative agent of COVID-19 remains elusive. Furthermore, there is an ongoing necessity for research to elucidate the underlying factors that drive the progression towards severe disease in COVID-19. The disruption of certain translation factors at the fundamental level of essential protein synthesis may prove adequate in impeding viral replication and propagation.
Viewed from the perspective of the Beta variant, the expression of the translation factors EIF1 and EIF3I was higher compared with the Alpha, Alpha + E484K, and Omicron variants. Additionally, the Beta variant harbored a higher expression of EEF1E1 and EIF2S3 compared with both Alpha variants. The Beta variant compared with the Omicron variant revealed a higher expression of EEF1DP3, EIF4G1, EIF4G2, EIF4H, EIF5, and EIF5A, whereas EIF5 and EIF5A were also expressed lower in the Alpha variant compared to the Beta variant (Figure 3).
Differences in eukaryotic translation factors between vaccinated and unvaccinated individuals were shown with z-scores higher and lower than 1 (Figure 2). Utilizing conditional independence, some directions and associations of the translation factors were found upon infection with the SARS-CoV-2 variants (Figure 1). Translation factors were differently expressed by counting true positives, true negatives, false positives, and false negatives and by deriving the precision and recall from the information (Figure 3).
The expression differences in some of the eukaryotic translation factors could be associated with a diverging severity response, respectively, with subtle differences in utilizing the extent of translation factors involved during the infection, and they could lead to a characteristic signature for identifying the variants and the clinical outcome.
The depicted directed effect of EIF5 (Figure 1) could be reflected by the high precision and recall of the Beta variant versus the Alpha and Omicron variants.
The machine learning (ML DotNet) approach performed relatively well using all the translation factors and MTOR as variables to predict the variant. In three out of four cases, the classification was correct, and the reliability of a correct discrimination was supported by the Restricted Boltzmann Machine neural network, which only failed to differentiate between the Alpha and Alpha E484K variants, which have genetically more in common than the Beta and Omicron variants. The rate of accurately classifying the state of the translation factors and MTOR was only 60%. Vaccinations could have a dampening effect on the extent of the translation machinery, and the differences between the percentage of hospitalizations depending on the variants could be reflected by the translation factor profile. We suggest that a more severe course upon infection could lead to a stronger response with a sharper increase in some of the translation factors.
The limitations of this study include the low sample size consisting of relatively many groups with fewer samples (confounding), leading to a requirement of pooling. Correlations and inference tests were not applicable based on the low sample size. EIF1AX and EIF2S3 are on the X-chromosome, and EI1AY is on the Y-chromosome.
Further research and more samples are required for clearer distinctions.
Supplementary Materials
The following supporting information can be downloaded at: https://www.mdpi.com/article/10.3390/microorganisms12040798/s1, Supplementary Table S1: F1 scores of the Beta variant versus the Alpha variant. Alpha + E484K and Omicron variant and unvaccinated versus vaccinated.
Author Contributions
Conceptualization, C.S.; methodology, C.S.; software, C.S.; validation, L.K., W.P. and E.L.; formal analysis, C.S. and L.K.; investigation, L.K. and H.K.L.; resources, L.K, D.v.L., W.B., H.M., F.P., D.W., W.P. and H.K.L.; data curation, C.S. and L.K.; writing—original draft preparation, C.S. and R.S.; writing—review and editing, C.S., J.H., L.K., R.S., E.L., H.M., F.P., W.P., D.W. and A.Q.; visualization, C.S.; supervision, J.H.; project administration, C.S.; funding acquisition, L.K. All authors have read and agreed to the published version of the manuscript.
Funding
This work was supported in part (H.K.L. and L.K.) by the Intramural Research Programs (IRPs) of the National Institute of Diabetes and Digestive and Kidney Diseases, USA.
Institutional Review Board Statement
This study was conducted in accordance with the Declaration of Helsinki and approved by the Ethics Committee of the University of Innsbruck (protocol code 1168/2021, 1121/2022) for studies involving humans.
Informed Consent Statement
Informed consent was obtained from all subjects involved in this study.
Data Availability Statement
Data are contained within the article and Supplementary Materials.
Conflicts of Interest
Authors Christoph Schatz and Ludwig Knabl were employed by the company Tyrolpath Obrist Brunhuber GmbH. The remaining authors declare that the research was conducted in the absence of any commercial or financial relationships that could be construed as a potential conflict of interest.
References
- Weiss, S.R.; Leibowitz, J.L. Coronavirus Pathogenesis. Adv. Virus Res. 2011, 81, 85–164. [Google Scholar] [CrossRef] [PubMed]
- Tang, Q.; Song, Y.; Shi, M.; Cheng, Y.; Zhang, W.; Xia, X.-Q. Inferring the Hosts of Coronavirus Using Dual Statistical Models Based on Nucleotide Composition. Sci. Rep. 2015, 5, 17155. [Google Scholar] [CrossRef] [PubMed]
- Weiss, S.R.; Navas-Martin, S. Coronavirus Pathogenesis and the Emerging Pathogen Severe Acute Respiratory Syndrome Coronavirus. Microbiol. Mol. Biol. Rev. 2005, 69, 635–664. [Google Scholar] [CrossRef] [PubMed]
- Su, S.; Wong, G.; Shi, W.; Liu, J.; Lai, A.C.K.; Zhou, J.; Liu, W.; Bi, Y.; Gao, G.F. Epidemiology, Genetic Recombination, and Pathogenesis of Coronaviruses. Trends Microbiol. 2016, 24, 490–502. [Google Scholar] [CrossRef] [PubMed]
- Mechanisms of SARS-CoV-2 Entry into Cells|Nature Reviews Molecular Cell Biology. Available online: https://www.nature.com/articles/s41580-021-00418-x (accessed on 27 August 2023).
- He, F.; Deng, Y.; Li, W. Coronavirus Disease 2019: What We Know? J. Med. Virol. 2020, 92, 719–725. [Google Scholar] [CrossRef] [PubMed]
- Martinez-Salas, E.; Francisco-Velilla, R.; Fernandez-Chamorro, J.; Embarek, A.M. Insights into Structural and Mechanistic Features of Viral IRES Elements. Front. Microbiol. 2017, 8, 2629. [Google Scholar] [CrossRef] [PubMed]
- Wang, X.; Kohalmi, S.E.; Svircev, A.; Wang, A.; Sanfaçon, H.; Tian, L. Silencing of the Host Factor eIF(Iso)4E Gene Confers Plum Pox Virus Resistance in Plum. PLoS ONE 2013, 8, e50627. [Google Scholar] [CrossRef] [PubMed]
- Bhardwaj, U.; Powell, P.; Goss, D.J. Eukaryotic Initiation Factor (eIF) 3 Mediates Barley Yellow Dwarf Viral mRNA 3′-5′ UTR Interactions and 40S Ribosomal Subunit Binding to Facilitate Cap-Independent Translation. Nucleic Acids Res. 2019, 47, 6225–6235. [Google Scholar] [CrossRef]
- Wuerth, J.D.; Habjan, M.; Kainulainen, M.; Berisha, B.; Bertheloot, D.; Superti-Furga, G.; Pichlmair, A.; Weber, F. eIF2B as a Target for Viral Evasion of PKR-Mediated Translation Inhibition. mBio 2020, 11, e00976-20. [Google Scholar] [CrossRef]
- Nicaise, V.; German-Retana, S.; Sanjuán, R.; Dubrana, M.-P.; Mazier, M.; Maisonneuve, B.; Candresse, T.; Caranta, C.; LeGall, O. The Eukaryotic Translation Initiation Factor 4E Controls Lettuce Susceptibility to the Potyvirus Lettuce Mosaic Virus. Plant Physiol. 2003, 132, 1272–1282. [Google Scholar] [CrossRef]
- Zhu, N.; Zhang, D.; Wang, W.; Li, X.; Yang, B.; Song, J.; Zhao, X.; Huang, B.; Shi, W.; Lu, R.; et al. A Novel Coronavirus from Patients with Pneumonia in China, 2019. N. Engl. J. Med. 2020, 382, 727–733. [Google Scholar] [CrossRef] [PubMed]
- Berche, P. Gain-of-Function and Origin of COVID19. Presse Med. 2023, 52, 104167. [Google Scholar] [CrossRef] [PubMed]
- Morens, D.M.; Breman, J.G.; Calisher, C.H.; Doherty, P.C.; Hahn, B.H.; Keusch, G.T.; Kramer, L.D.; LeDuc, J.W.; Monath, T.P.; Taubenberger, J.K. The Origin of COVID-19 and Why It Matters. Am. J. Trop. Med. Hyg. 2020, 103, 955–959. [Google Scholar] [CrossRef] [PubMed]
- Knabl, L.; Mitra, T.; Kimpel, J.; Roessler, A.; Volland, A.; Walser, A.; Ulmer, H.; Pipperger, L.; Binder, S.C.; Riepler, L.; et al. High SARS-CoV-2 Seroprevalence in Children and Adults in the Austrian Ski Resort Ischgl. Epidemiology 2020. [Google Scholar] [CrossRef] [PubMed]
- Dong, Y.; Mo, X.; Hu, Y.; Qi, X.; Jiang, F.; Jiang, Z.; Tong, S. Epidemiology of COVID-19 Among Children in China. Pediatrics 2020, 145, e20200702. [Google Scholar] [CrossRef] [PubMed]
- Walsh, D.; Mathews, M.B.; Mohr, I. Tinkering with Translation: Protein Synthesis in Virus-Infected Cells. Cold Spring Harb. Perspect. Biol. 2013, 5, a012351. [Google Scholar] [CrossRef] [PubMed]
- Krähling, V.; Stein, D.A.; Spiegel, M.; Weber, F.; Mühlberger, E. Severe Acute Respiratory Syndrome Coronavirus Triggers Apoptosis via Protein Kinase R but Is Resistant to Its Antiviral Activity. J. Virol. 2009, 83, 2298–2309. [Google Scholar] [CrossRef]
- de Breyne, S.; Vindry, C.; Guillin, O.; Condé, L.; Mure, F.; Gruffat, H.; Chavatte, L.; Ohlmann, T. Translational Control of Coronaviruses. Nucleic Acids Res. 2020, 48, 12502–12522. [Google Scholar] [CrossRef]
- Gordon, D.E.; Jang, G.M.; Bouhaddou, M.; Xu, J.; Obernier, K.; White, K.M.; O’Meara, M.J.; Rezelj, V.V.; Guo, J.Z.; Swaney, D.L.; et al. A SARS-CoV-2 Protein Interaction Map Reveals Targets for Drug Repurposing. Nature 2020, 583, 459–468. [Google Scholar] [CrossRef]
- Sa Ribero, M.; Jouvenet, N.; Dreux, M.; Nisole, S. Interplay between SARS-CoV-2 and the Type I Interferon Response. PLoS Pathog. 2020, 16, e1008737. [Google Scholar] [CrossRef]
- Xiao, H.; Xu, L.H.; Yamada, Y.; Liu, D.X. Coronavirus Spike Protein Inhibits Host Cell Translation by Interaction with eIF3f. PLoS ONE 2008, 3, e1494. [Google Scholar] [CrossRef]
- Liu, L.; Iketani, S.; Guo, Y.; Chan, J.F.-W.; Wang, M.; Liu, L.; Luo, Y.; Chu, H.; Huang, Y.; Nair, M.S.; et al. Striking Antibody Evasion Manifested by the Omicron Variant of SARS-CoV-2. Nature 2022, 602, 676–681. [Google Scholar] [CrossRef] [PubMed]
- Paredes, M.I.; Lunn, S.M.; Famulare, M.; Frisbie, L.A.; Painter, I.; Burstein, R.; Roychoudhury, P.; Xie, H.; Mohamed Bakhash, S.A.; Perez, R.; et al. Associations between SARS-CoV-2 Variants and Risk of COVID-19 Hospitalization among Confirmed Cases in Washington State: A Retrospective Cohort Study. medRxiv 2022. [Google Scholar] [CrossRef]
- Kalisch, M.; Mächler, M.; Colombo, D.; Maathuis, M.H.; Bühlmann, P. Causal Inference Using Graphical Models with the R Package Pcalg. J. Stat. Softw. 2012, 47, 1–26. [Google Scholar] [CrossRef]
- Rashidi, H.H.; Pepper, J.; Howard, T.; Klein, K.; May, L.; Albahra, S.; Phinney, B.; Salemi, M.R.; Tran, N.K. Comparative Performance of Two Automated Machine Learning Platforms for COVID-19 Detection by MALDI-TOF-MS. PLoS ONE 2022, 17, e0263954. [Google Scholar] [CrossRef] [PubMed]
- Smolander, J.; Dehmer, M.; Emmert-Streib, F. Comparing Deep Belief Networks with Support Vector Machines for Classifying Gene Expression Data from Complex Disorders. FEBS Open Bio 2019, 9, 1232–1248. [Google Scholar] [CrossRef] [PubMed]
- Lee, H.K.; Knabl, L.; Knabl, L.; Wieser, M.; Mur, A.; Zabernigg, A.; Schumacher, J.; Kapferer, S.; Kaiser, N.; Furth, P.A.; et al. Immune Transcriptome Analysis of COVID-19 Patients Infected with SARS-CoV-2 Variants Carrying the E484K Escape Mutation Identifies a Distinct Gene Module. Sci. Rep. 2022, 12, 2784. [Google Scholar] [CrossRef] [PubMed]
- Knabl, L.; Lee, H.K.; Wieser, M.; Mur, A.; Zabernigg, A.; Knabl, L.; Rauch, S.; Bock, M.; Schumacher, J.; Kaiser, N.; et al. BNT162b2 Vaccination Enhances Interferon-JAK-STAT-Regulated Antiviral Programs in COVID-19 Patients Infected with the SARS-CoV-2 Beta Variant. Commun. Med. 2022, 2, 17. [Google Scholar] [CrossRef]
- Rössler, A.; Knabl, L.; von Laer, D.; Kimpel, J. Neutralization Profile after Recovery from SARS-CoV-2 Omicron Infection. N. Engl. J. Med. 2022, 386, 1764–1766. [Google Scholar] [CrossRef]


Disclaimer/Publisher’s Note: The statements, opinions and data contained in all publications are solely those of the individual author(s) and contributor(s) and not of MDPI and/or the editor(s). MDPI and/or the editor(s) disclaim responsibility for any injury to people or property resulting from any ideas, methods, instructions or products referred to in the content. |
© 2024 by the authors. Licensee MDPI, Basel, Switzerland. This article is an open access article distributed under the terms and conditions of the Creative Commons Attribution (CC BY) license (https://creativecommons.org/licenses/by/4.0/).