Article

Lactic Acid Production by Lactiplantibacillus plantarum AC 11S—Kinetics and Modeling

by
Petya Popova-Krumova
1,
Svetla Danova
2,
Nikoleta Atanasova
2 and
Dragomir Yankov
1,*
1
Institute of Chemical Engineering, Bulgarian Academy of Sciences, 103 Acad. G. Bontchev Str., 1113 Sofia, Bulgaria
2
The Stephan Angeloff Institute of Microbiology, Bulgarian Academy of Sciences, 26 Acad. G. Bontchev Str., 1113 Sofia, Bulgaria
*
Author to whom correspondence should be addressed.
Microorganisms 2024, 12(4), 739; https://doi.org/10.3390/microorganisms12040739
Submission received: 7 March 2024 / Revised: 1 April 2024 / Accepted: 2 April 2024 / Published: 4 April 2024
(This article belongs to the Special Issue Beneficial Microorganisms and Antimicrobials 2.0)

Abstract

:
Lactic acid is a versatile chemical with wide application in many industries. It can be produced by the fermentation of different sugars by various lactobacilli and investigations on lactic acid production from different substrates and by different strains are still in progress. The present study aimed to study lactic acid production from lactose by Lactiplantibacillus plantarum AC 11S and to choose a mathematical model describing in the best way the experimental data obtained. The influence of initial substrate concentration was investigated, and optimal pH and temperature were determined. An unstructured mathematical model was developed comprising equations for bacterial growth, substrate consumption, and product formation. The model was solved with different terms for specific growth rates considering substrate and/or product inhibition. The best bacterial growth and lactic acid production were achieved at pH = 6.5 and 30 °C. Production of lactic acid was mainly growth-associated, and at initial substrate concentration over 15 g/L, a considerable product inhibition was observed. The parameters of different models were determined and compared. The modified Gompertz equation gave the best fit when solving only the equation for biomass growth at different initial substrate concentrations. Solving the entire set of differential equations for bacterial growth, substrate consumption, and product formation, the best results were obtained when using a variant of the logistic equation for biomass growth. This variant included a term for product inhibition and described in the best way all experimental data. Solving the model for different biomass concentrations showed that an increase in biomass led to a shorter lag phase and the stationary phase was reached faster. The results obtained, optimum conditions and the kinetic model, are good bases for studying pH-controlled fermentation, as well as a continuous process.

1. Introduction

Lactic acid bacteria (LAB) are a multitudinous microbial group of microorganisms with diverse beneficial applications in the food and pharmaceutical industry. LAB share the same characteristics of metabolism and physiology with strain-specific functionality and potential. One of their main common features is the production of lactic acid as an end-product of the fermentation of various carbohydrates. From a taxonomic point of view, they comprise a large variety of Gram-positive, catalase-negative, and anaerobic, non-sporulation bacteria belonging to the Lactobacillaceae family, with different G+C Firmicutes groups. They are producers of organic acids, polyols, bacteriocins, exopolysaccharides (EPSs), and aromatic compounds, among others [1]. Several LAB species are widely accepted as probiotics with functional characteristics and beneficial healthy effects based on their metabolic activity.
Lactiplantibacillus plantarum can be found in various ecological niches, such as in dairy products, fermented vegetables and cereals, meat, fish, silage, wine, and gastrointestinal, urogenital, and vaginal tracts [2]. It is one of the most exploited LAB for producing various postmetabolites. L. plantarum is well known for its versatility in substrate utilization [3]. Various L. plantarum strains are capable of utilizing different monosaccharides, either hexoses or pentoses [4], as well as different lignocellulosic hydrolysates from rice straw [5], corncobs [6], sugarcane bagasse [7], Opuntia ficus indica waste [8], and algal biomass [3], among others. These species are considered the most advantageous among LAB in the production of lactic acid (LA) from lactose and they are also capable of utilizing other nutrients presented in whey [9].
L. plantarum has a larger genome than other LAB species (size of about 3.3 Mbp and more than 3000 genes), which indicates its strong adaptability, high versatility, enormous diversity in phenotypic properties, metabolic capacity, and industrial applications [10]. According to Zheng et al. [11], the L. plantarum group represents the evolutionary link between heterofermentative and homofermentative LAB. Though L. plantarum is phylogenetically related to heterofermentative lactobacilli, it shares different metabolic features with homofermentative lactobacilli. The main difference between homo- and heterofermentative lactobacilli is the existing difference in the metabolic pathways leading to variation in the main end-product of the fermentation. While homofermentative lactobacilli produce lactic acid as the sole product, the heterofermentative LAB produce a mixture of lactic acid, ethanol, acetic acid, and carbon dioxide during fermentation. Other differences also exist in the ability of various LAB to decompose macromolecular substances (polysaccharides and proteins), as well as in the production of bacteriocins, short-chain fatty acids, amines, etc.
LAB have been used by humans for centuries. Several metabolic end-products of lactic acid fermentation have practical applications. Lactic acid is a very useful chemical with numerous applications in pharmaceuticals, foods, cosmetics, and other industries. In recent years, the use of LAB in drug delivery systems, fermented foods, and beverages, as well as probiotics and vaccines, has gained more and more interest. L. plantarum has been widely used as a model species for ecological, genetic, and metabolic studies in lactobacilli. The major commercial use of L. plantarum is as a starter culture for various food fermentations and in recent years as a probiotic culture [11].
L. plantarum is considered to belong to the group of facultatively heterofermentative lactobacilli. Via the Embden–Meyerhof–Parnas pathway, hexoses are almost completely converted to lactic acid. On the other hand, pentoses are converted to acetic and lactic acids via the 6-phosphogluconate/phosphoketolase pathway by the induction of phosphoketolase [12]. L. plantarum, like other LAB, possesses specific nutritional requirements and thus, a complex growth media, which must contain peptides, vitamins, and nucleic, fatty, and amino acids, besides the carbon source is needed. Another particular characteristic of the process of lactic acid production is the end-product inhibition. Due to the lactic acid accumulation, the fast acidification of the fermentation medium leads to low substrate utilization, low conversion, and low final product concentration.
In the process of a comprehensive investigation of lactic acid production, kinetic studies are an indispensable step. A proper mathematical model is very useful in understanding, describing, evaluating, and predicting the fermentation process. Mathematical models help disclose the relationship between cell growth, substrate consumption, and product formation and can be used for control optimization and scale-up of a fermentation process. Mathematical models have been classified according to different criteria [13]. One of these criteria distinguishes between structured and unstructured mathematical models. Structured models are more accurate and take into account cell functions, structure, and composition. Unstructured models, on the other hand, treat the cells as a black box, a sole component without involving any cells’ physiological characteristics. Although the structured models are more detailed and precise, providing a better understanding of the system, unstructured models are widely used, because of their applicability and simplicity in describing bacterial kinetics. Different models have been used in the modeling of lactic acid production from various substrates. Some of them are summarized in the works of Zacharof & Lovitt [13], Bouguettoucha et al. [14], and Gordeev et al. [15].
The present work aims to investigate Lactiplantibacillus plantarum strain AC 11S, as a promising producer of lactic acid from lactose, to determine the optimum conditions for growth and production, and to compare some kinetics models describing the fermentation dynamics.

2. Materials and Methods

2.1. Strain, Growth Media, and Culture Conditions

L. plantarum AC 11S was isolated from a homemade white brined cheese [16]. It was cultured in de Man, Rogosa, and Sharpe broth (MRS Merck, Darmstadt, Germany) and stored at −20 °C in MRS broth supplemented with glycerol 20% v/v. Before the experiments, the strain was pre-cultured twice in modified MRS broth with lactose. The strain was cultured in growth medium containing 11 g/L lactose monohydrate, 5.5 g/L yeast extract, 12.5 g/L peptone from casein, 10 g/L sodium acetate, 0.25 g/L KH2PO4, 0.25 g/L K2HPO4, 0.1 g/L MgSO4·7H2O, 0.05 g/L MnSO4·7H2O, 0.05 g/L Fe2(SO4)3. All chemicals were p.a. grade (Fluka, Darmstadt, Germany). The inoculum (10% v/v) was prepared from overnight culture in MRS broth with lactose monohydrate (11 g/L). All experiments were carried out in flasks (100 mL growth medium in 300 mL Erlenmeyer flasks at 30 °C with an initial pH of 6.5) using a WiseCube® WIS30 shaking incubator (Witeg Labortechnik GmbH, Wertheim, Germany).

2.2. The LAB Species Identification

The strain AC 11S was identified as L. plantarum by classical phenotypic methods including Gram staining, oxidase (kit HiMedia, Mumbai, India), catalase tests, and a carbohydrate fermentation test with 49 carbon sources (using API 50 CHL, bioMérieux, Marcy l’Etoile, France). The species affiliation was confirmed by Multiplex PCR amplification with primers targeting the recA gene, according to Torriani et al. [17]. The PCR analysis was performed on a PCR thermocycler (BioRad, laboratories, Inc. group Hercules, CA, USA), using a ready to use PCR mix (IllistraTM PuRe TaqTM Ready To GoTM PCR beads; Amersham Biosciences, Amersham, UK). The target DNA was isolated from an overnight LAB culture of the strain AC 11S using the Gene Matrix Bacterial and Yeast Genomic DNA Purification Kit (EURx Ltd., Gdańsk, Poland), following the manufacturer’s instructions. The PCR reaction conditions were as previously described [18].

2.3. In Vitro Assessment of Acid Tolerance of L. plantarum AC 11S

An in vitro test, in 96-well U-bottomed, polystyrene microtiter plates (Corning, NY, USA) with a final volume of 150 µL, was carried out. The cells from 10 mL overnight culture were harvested by centrifugation (centrifuge 9000× g, Hermle Labortechnik GmbH, Wehingen, Germany) and washed twice with sterile saline. Washed cells re-suspended in 10 mL were adjusted to 6.0 × 10⁸ CFU/mL (2× McFarland). The cells from 5 mL were harvested and re-suspended in 5 mL simulated gastric fluid with a low pH of 1.5, 0.8% NaCl (w/v), and 3 mg/mL pepsin from porcine gastric mucosa (Sigma-Aldrich, Saint Louis, MO, USA). The resting 5 mL was used as a control re-suspended in sterile saline of pH 6.5. They were incubated for 3 h at 30 °C. After treatment, they were washed 2 times, with sterile saline. Following the treated culture, the control was used as an inoculum (10% v/v) in modified MRS broth (with lactose 20 g/L) in 96-well microplates. Viability, after treatment, was monitored spectrophotometrically (OD 600 nm) during 24 h cultivation at 30 °C using an Elisa Plate Reader (INNO, Seongnam-si, Republic of Korea). The results are presented as a means of triplicate.

2.4. Analytical Procedures

For biomass determination, optical density (OD) was measured at 620 nm (UV-VIS spectrophotometer Milton Roy 401, Rochester, NY, USA). From OD data, by using a previously prepared calibration curve, the biomass concentration was calculated. An HPLC system composed of a Knauer Smartline-100 pump, a Perkin-Elmer LC-25RI refractometric detector, and data processing software Eurochrome v. 3.05 (Knauer, Berlin, Germany) were used for lactic acid and lactose measurements. An Aminex HPX-87H (Bio-Rad, Hercules, CA, USA) column was used. A 0.005 M solution of H2SO4 at a flow rate of 0.6 mL/min was used as the mobile phase. For standard solutions preparation, pure (98% mass, Sigma, Darmstadt, Germany), crystalline L (+)-lactic acid was used. All measurements were taken in triplicate. The pH was measured using a pH meter HI2211 (HANNA instruments, Bedfordshire, UK). Correction of pH to pH = 1.5 was achieved with hydrochloric acid.

2.5. Fermentation

All experiments for lactic acid production were carried out in MRS broth with lactose as a carbon source in 300 mL flasks at 30 °C and a 6.5 initial pH of the medium (except those for optimum pH and temperature determination).

2.6. Modeling

The main goal in a fermentation process is complete substrate utilization, leading to a maximum product yield. The development of a proper mathematical model and correct determination of model parameters will permit us to conduct the fermentation in its optimal conditions. The mathematical model should contain equations describing cell growth, substrate consumption, and product formation and their interrelationship. In an unstructured mathematical model, only the total cell concentration is considered. In general, the bacterial growth rate can be described as follows:
d X d t = μ X k d X
where X is the biomass concentration, g/L; t is time, h; μ is the specific growth rate, h−1; and kd is the specific cell death rate, h−1. In many cases, cell death was not observed or µ >> kd and the second term can be omitted.
The simplest model representing the specific growth rate as a function of substrate concentration is the Monod equation:
μ = μ m a x S K S + S
where μmax is the maximum specific growth rate, h−1; S is the initial substrate concentration, g/L; and KS is the substrate saturation constant, g/L. KS represents substrate concentration at which the growth rate is equal to half of the maximum growth rate. The Monod equation describes the increase in cell concentration with time and considers limiting substrate concentration [13,14,15]. It is widely accepted that lactic acid fermentation is limited by the substrate and inhibited by the product. Many authors insert different terms in the Monod equation to take inhibition effects into account. Some of them are presented in Table 1.
Other authors have used different sigmoidal models for the description of microbial growth. The most utilized are the logistic equation and the modified Gompertz model:
ln X X 0 = a 1 e x p b c t
ln X X 0 = a   e x p e x p b c t
These models do not include the consumption of the substrate and describe only the number of cells.
With the aim to give a biological meaning to the parameters a, b, and c, Zwietering [26] reparametrized the above equations to
X t = X 0 + A 1 + e x p 4 μ m a x A λ t + 2
X t = X 0 + A e x p e x p μ m a x e A λ t + 1
In these equations, X0 is the initial biomass concentration, g/L; t is time, h; A is the asymptotic level of biomass, g/L; λ is the duration of the lag phase, h; and µmax is the maximum specific growth rate, h−1.
The models listed in Table 1, as well as the logistic and Gompertz equation, were chosen in view to include different types of inhibition.
The Luedeking–Piret equation [27] is the most used for the description of lactic acid formation. It takes into account the fact that the rate of product accumulation dP/dt depends on bacterial growth dX/dt, as well as on the bacterial density X.
d P d t = α d X d t + β X  
α and β are coefficients related to growth and non-growth product formation.
The rate of substrate consumption is closely related to the cell’s growth rate and the rate of product formation. This relationship is usually given by the following equation:
d S d t = 1 Y X / S d X d t 1 Y P / S d P d t m s X
where YX/S and YP/S are yield coefficients for biomass on substrate and product on substrate, respectively, g/g, while mS is the biomass maintenance energy coefficient, g/g.h. In many cases, the latter was neglected.

3. Results and Discussion

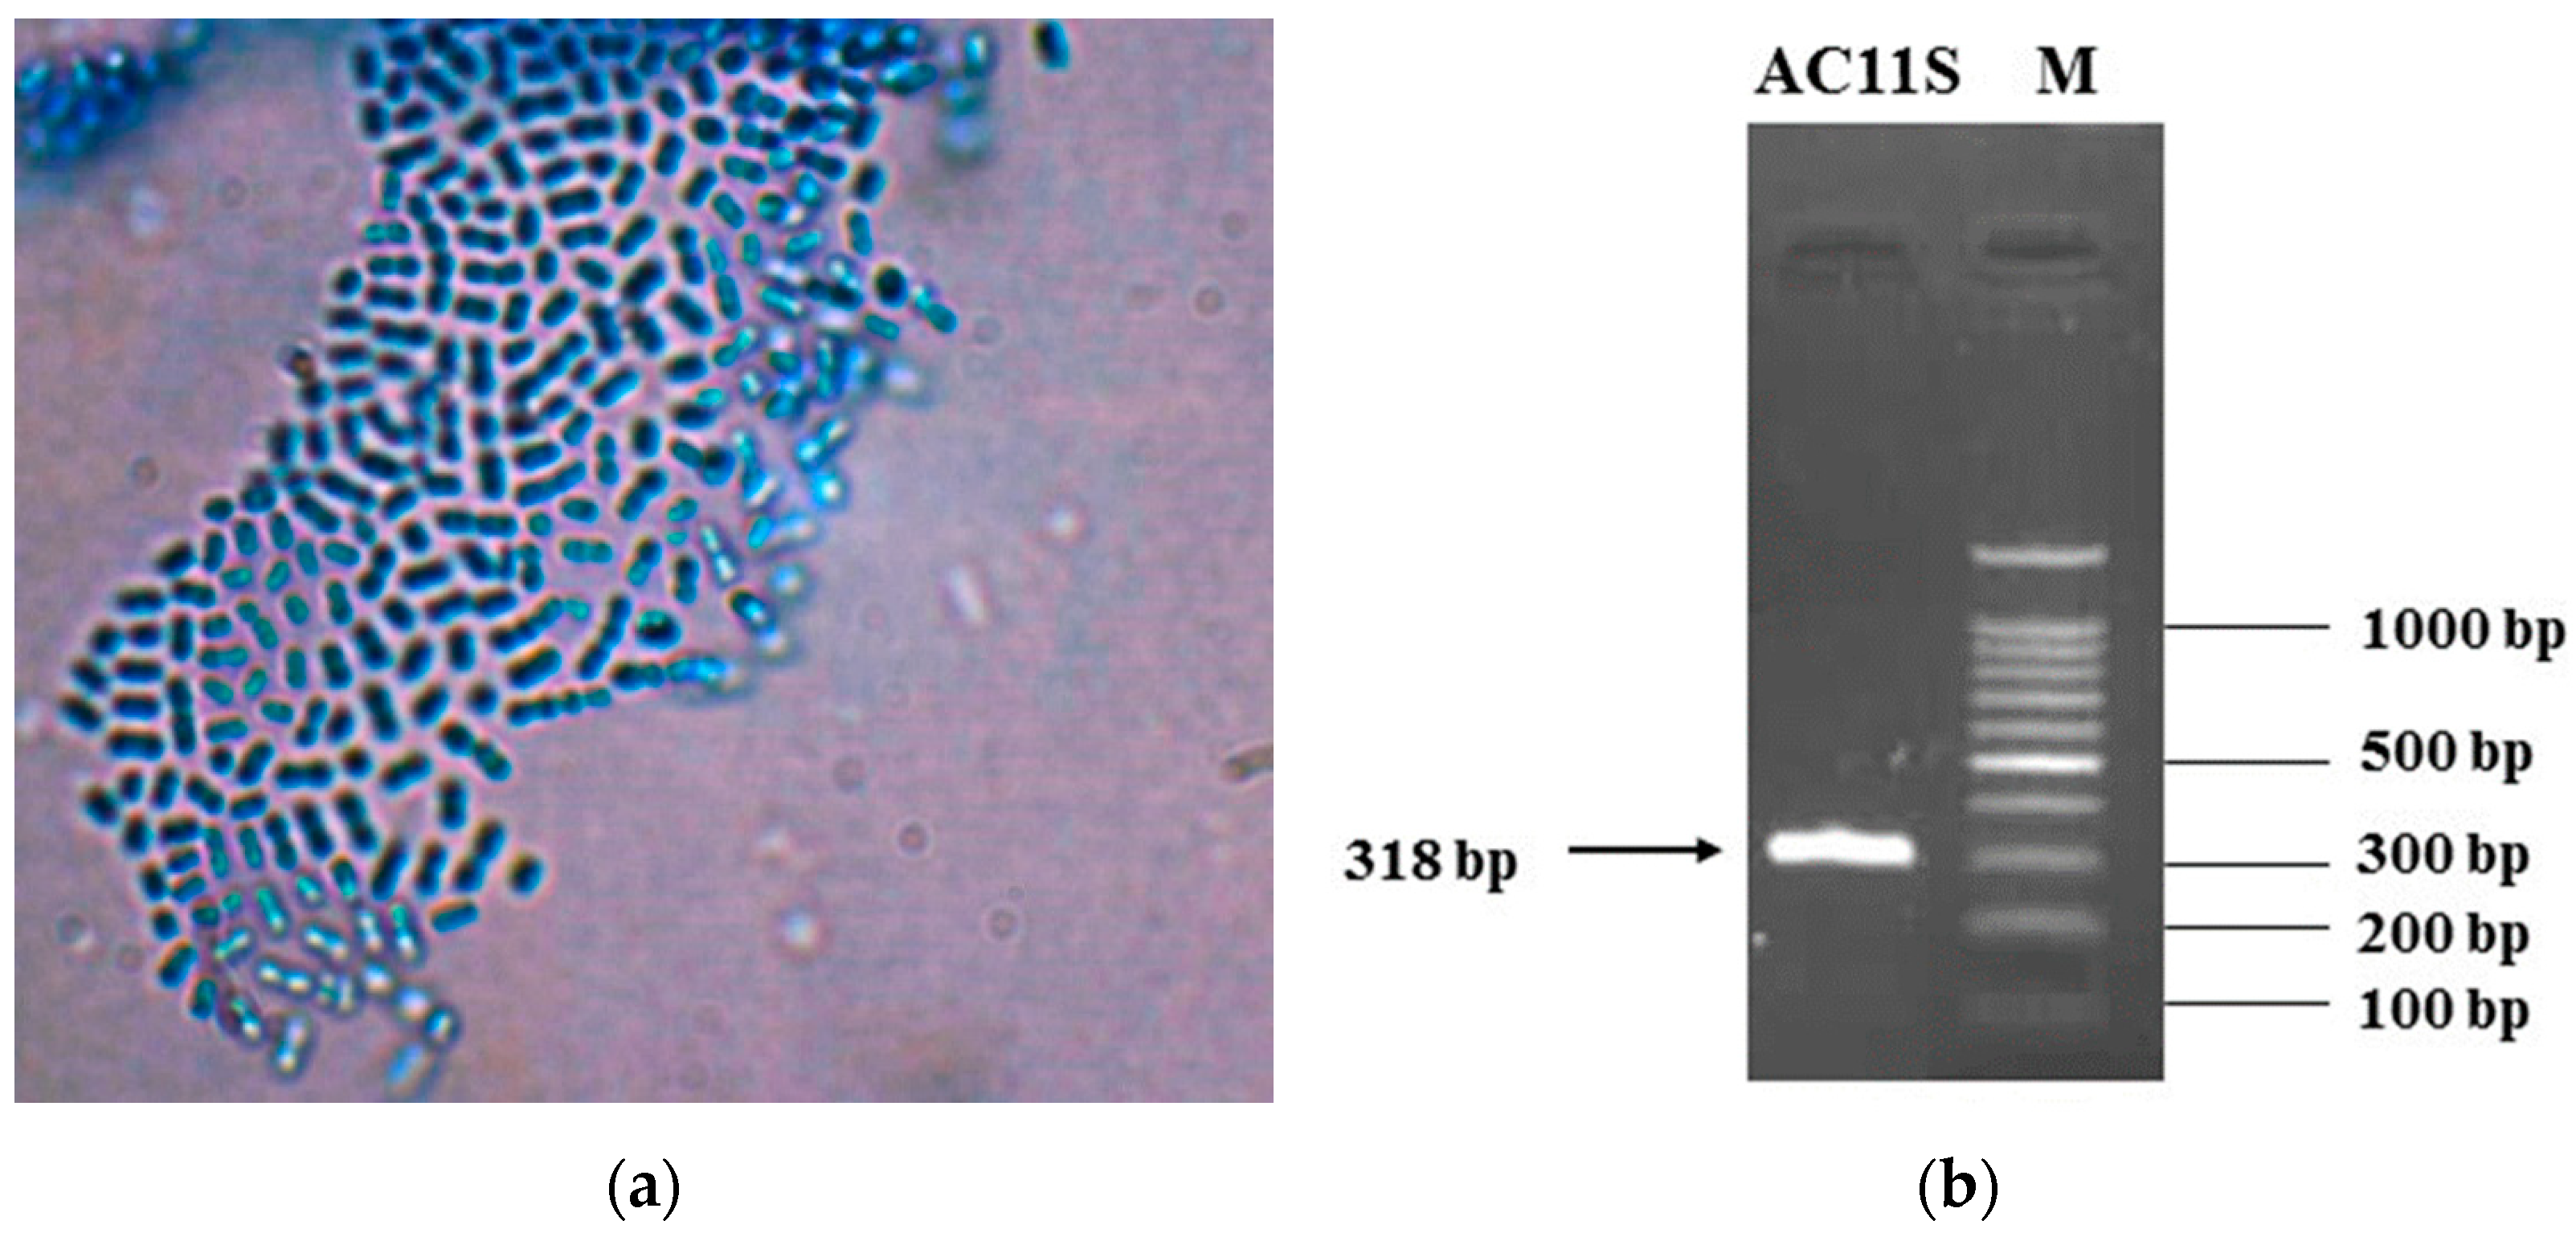
3.1. Isolation and Identification of Lactiplantibacillus plantarum AC 11S

L. plantarum AC 11S was isolated from a sample of white brined cheese, homemade on a small farm, in the village of Arda, Rodopa mountain, Bulgaria, near the border with Turkey. The strain is a part of the laboratory collection of the “Stephan Angeloff” Institute of Microbiology, BAS, Bulgaria.
The strain AC 11S was characterized as a Gram-positive, catalase, and oxidase-negative rod-shaped cell morphology (Figure 1a), non-motile, non-spore-forming facultative anaerobe. It was initially identified as a mesophilic bacterium presumptive Lactiplantibacillus plantarum by carbohydrate fermentation test with 49 carbon sources (using API 50 CHL, bioMérieux, Marcy l’Etoile, France). The 16S rDNA sequence also showed a similarity with the L. plantarum phylogenetic group of the Lactobacillaceae. The accurate species affiliation was achieved by multiplex PCR (Figure 1b), according to Torriani et al. [17]. With primers, targeting the rec A gene, a PCR product 318 bp was obtained corresponding to the species L. plantarum. This molecular method was preferred as a discriminative approach for three highly similar species from the group of LactiplantibacillusL. plantarum, L. pentosus, and L. paraplantarum as reported by Toriani et al. [17] and Georgieva et al. [18].

3.2. Viability of L. plantarum AC 11S in an Acidic Environment

L. plantarum is one of the most often employed as a starter LAB species and/or as an adjunct for various biotechnological processes and food production [28]. So, it may be exposed to various stress conditions, such as temperature and osmotic stress freeze-drying in fermented food [29]. In addition, probiotics must withstand extremely high acidity levels and a variety of digestive enzymes throughout the entire gastrointestinal tract [30]. Acid stress is a pivotal issue for microbial survival.
L. plantarum AC 11S showed extremely high viability under in vitro passage in simulated stomach juice. After 3 h exposure to pH 1.5 and pepsin, the growth dynamics are similar to the control. The growth was monitored spectrophotometrically (by INNO reader) and the obtained data were summarized (Figure 2). Just a small difference with a longer lag phase was observed. Moreover, the control showed an earlier stationary phase (Figure 2—red line).

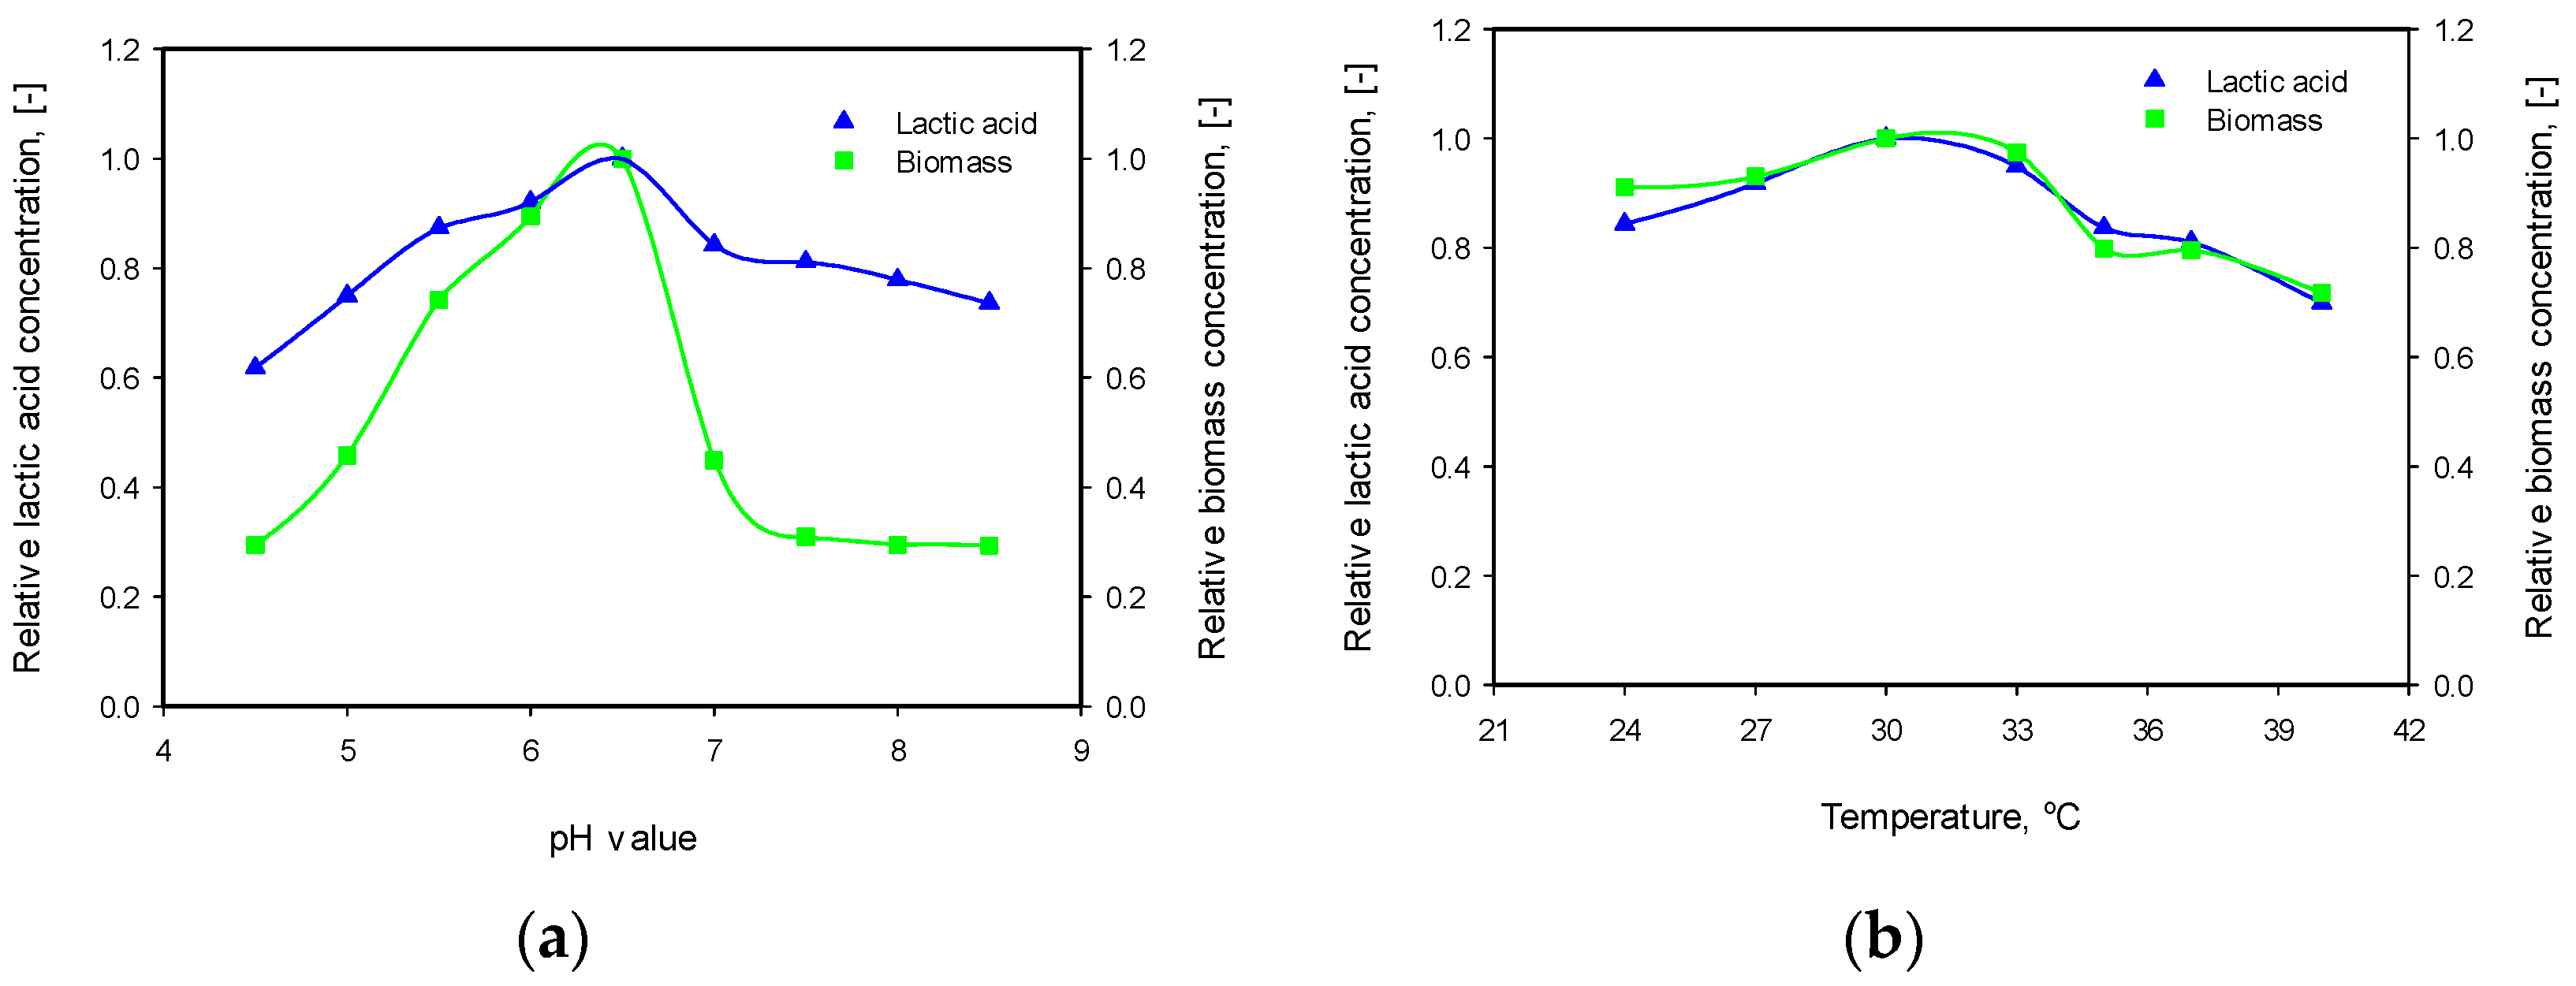
3.3. Influence of pH and Temperature

Fermentation productivity is strongly influenced by the medium pH value and temperature. Although LAB can grow in a broad range of temperatures and pH levels, their growth rate and population density are affected by these factors [12].
With the aim of determining optimum conditions for L. plantarum AC 11S, two series of experiments were carried out. In the first one, the initial medium pH varied from 4.5 to 8.5 at 30 °C, and in the second set of experiments, conducted at pH 6.5, the temperature was changed from 24 to 40 °C. Then, 100 mL LA broth was inoculated with 10% seeding culture and fermentation was carried out at appropriate temperature and pH value under anaerobic and static conditions for 24 h.
The results of these experiments are presented in Figure 3. As can be seen from the figure, the optimum conditions for lactic acid production are pH = 6.5 and temperature of 30 °C. The influence of pH is more pronounced, especially on the cell concentration.
L. plantarum is a mesophilic bacterium, capable of growing at temperatures between 10 and 40 °C. In support of our findings, other researchers also cultivated L. plantarum at 30 °C as an optimal temperature [31,32,33,34,35], but there are enough investigations in which the strain was cultivated at 37 °C—see for example [5,6,9].
L. plantarum possesses high acidity tolerance and can grow in pH values between 4 and 7. It is generally accepted that lactic acid production is a growth-associated process. During the fermentation, due to the lactic acid accumulation, the pH value of the broth decreases to about 3.0–3.5 in pH uncontrolled mode [36,37]. Many authors assumed that both dissociated and undissociated forms of the acid could exhibit an inhibition effect on cell growth, as the undissociated form is the stronger inhibitor [9,13,15]. It is logical because at low pH (below pKa), the acid is mainly in undissociated form. As pointed out by Peetermans et al. [38], other factors besides pKa, like volatility and lipophilicity of the acid, as well as medium pH or acid concentration, influence the microbial growth inhibition in the presence of weak acids. Mercier et al. [39] investigated lactic acid fermentation with glucose as a substrate in the pH range of 5.4–7.8. Based on experimental results, the authors suggested a pH value between 6.0 and 6.5 as optimal for maximal yields for biomass and lactic acid production. W. Fu and A.P. Mathews [9] studied the lactic acid production from lactose with L. plantarum in the pH range of 4.0–7.0 and found optimal values for cell growth and acid production between 5.0 and 6.0. Yetiman et al. [4] characterized a new L. plantarum strain isolated from shalgam—a traditional fermented beverage. The authors investigated the cell growth at different pH values (2, 3, 4, 5, and 7) at two temperatures—30 and 37 °C. Maximum cell density was achieved at pH = 7.0 for both temperatures, but the lag phase was shorter, and the specific growth rate was higher at 37 °C. The same behavior was observed in the presence of different concentrations of bile salts. It is worth mentioning that despite a longer lag phase and lower specific growth rate, the final cell densities were higher at 30 °C, especially in the presence of bile salts.

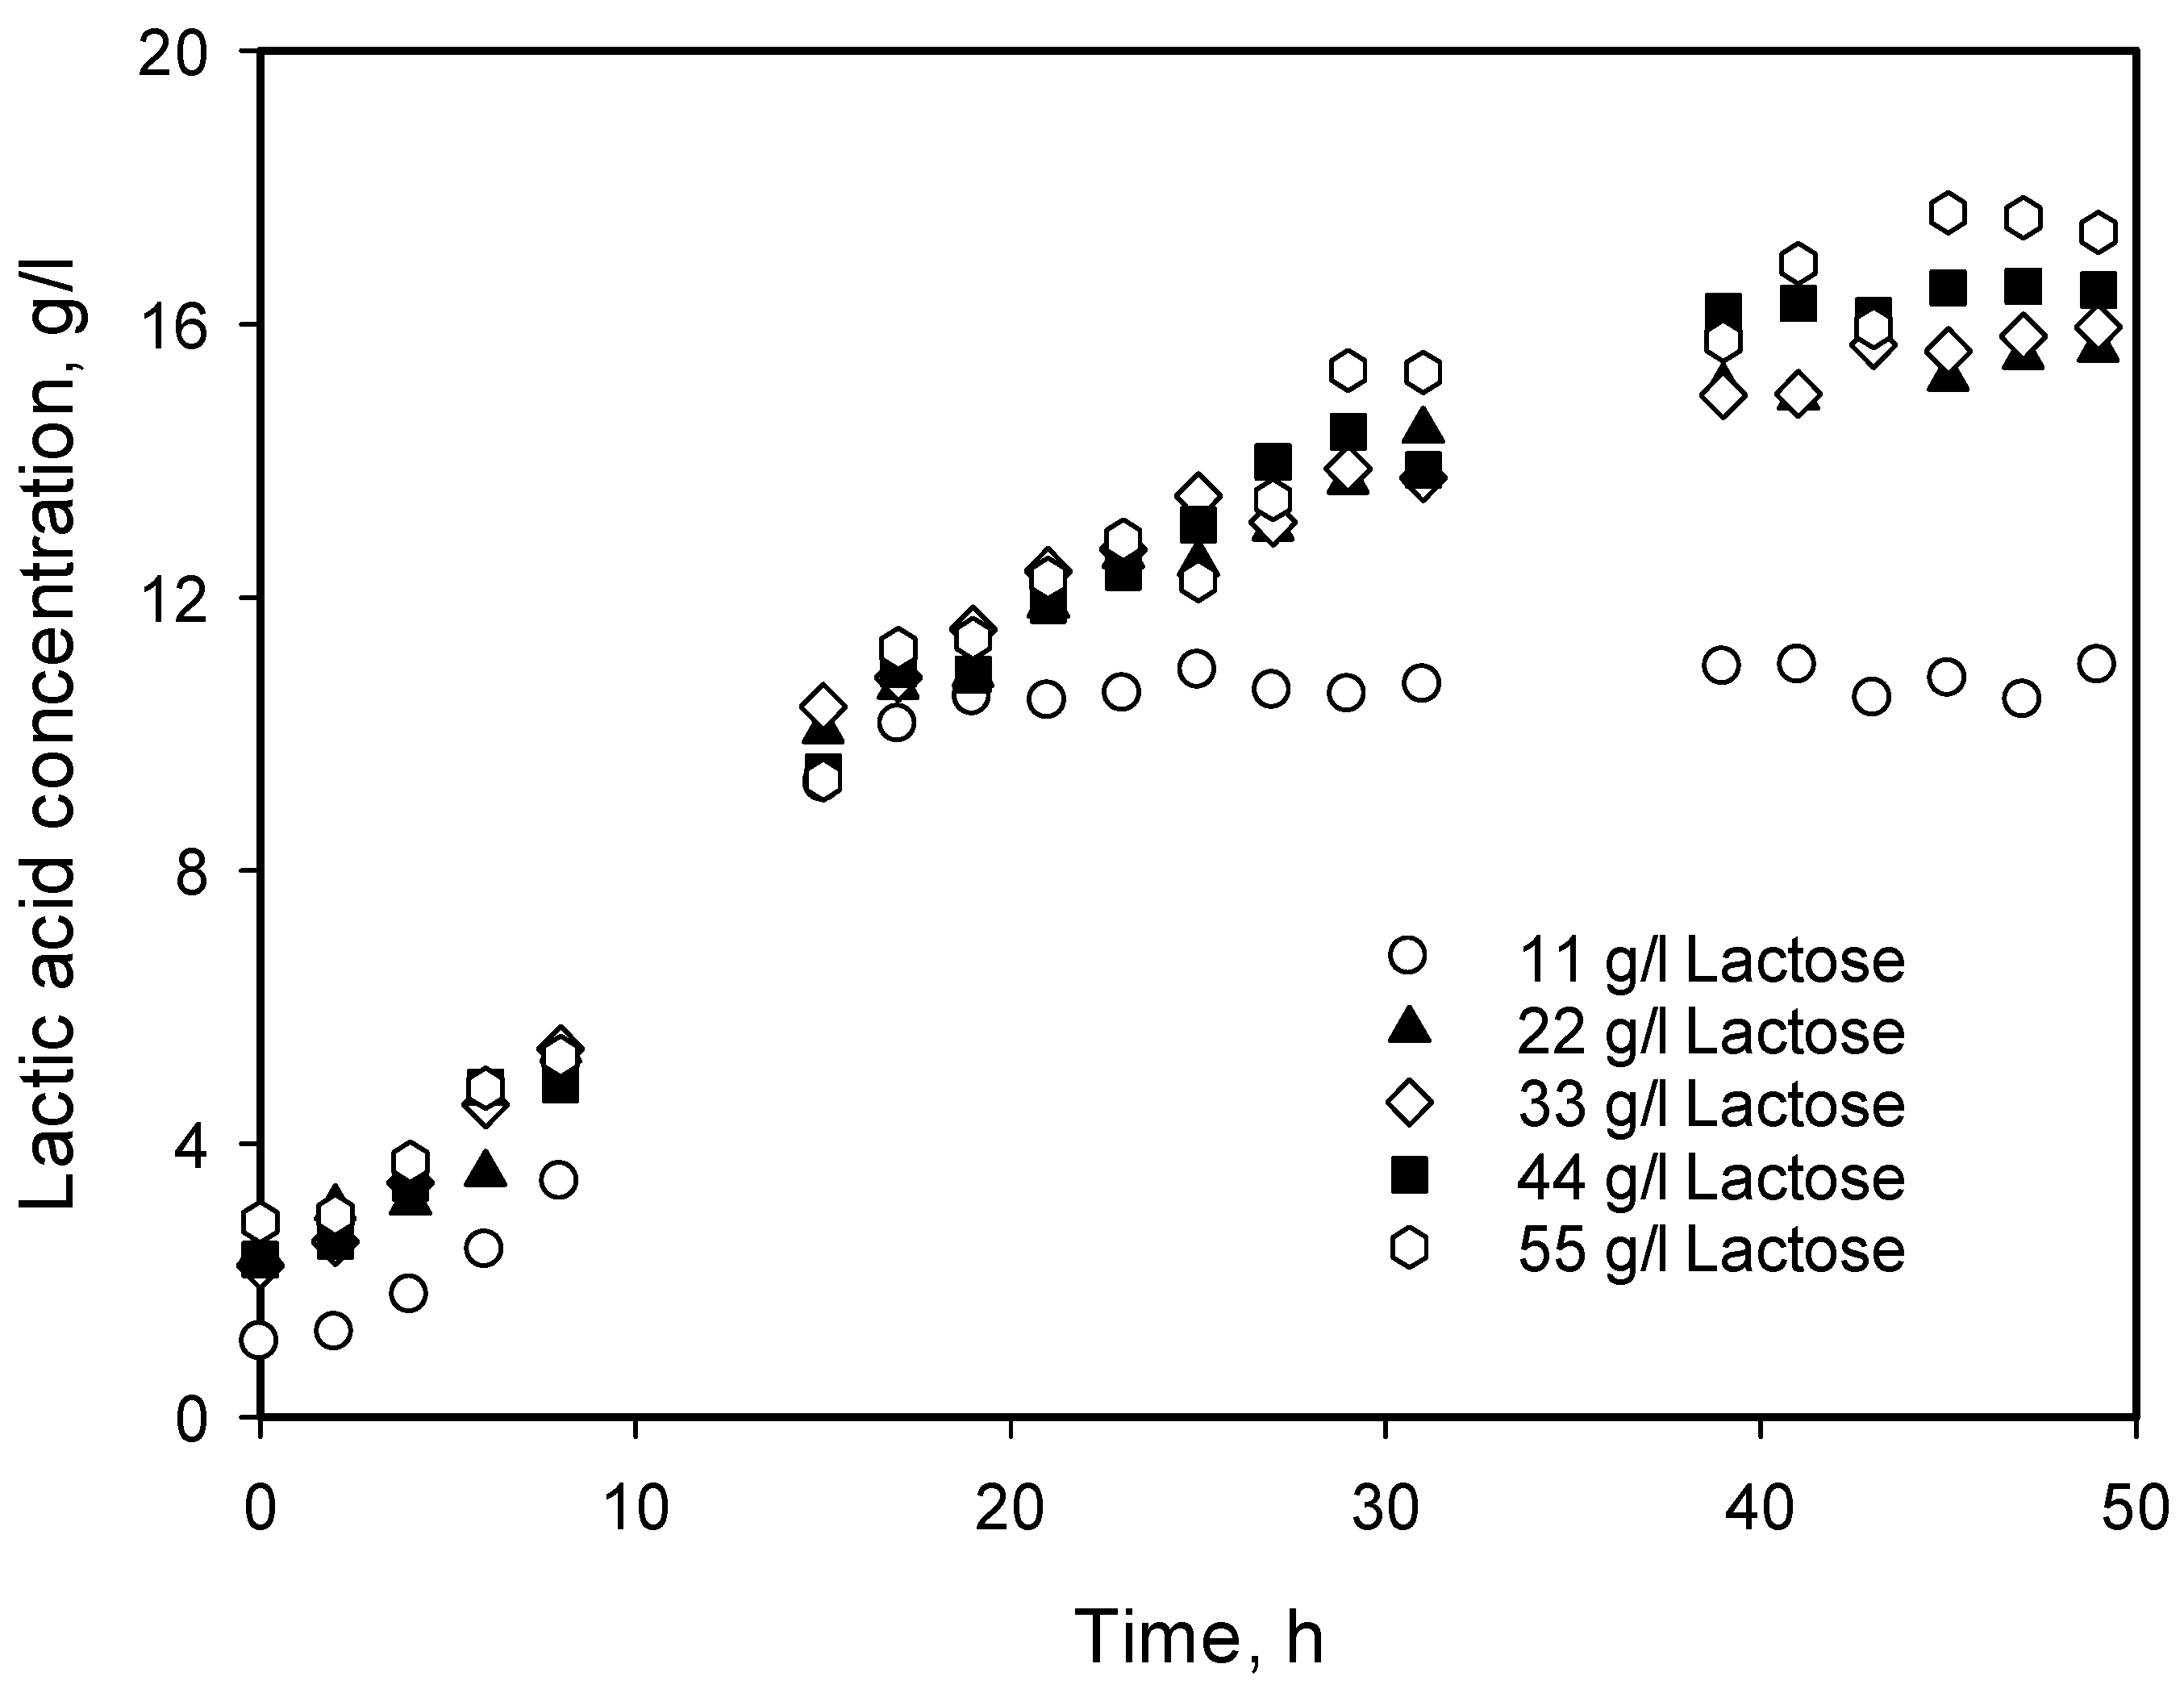
3.4. Influence of Initial Substrate Concentration

In order to elucidate the influence of substrate concentration on cell growth and lactic acid production, a set of experiments was carried out at 30 °C and initial pH 6.5 with lactose monohydrate concentrations of 11, 22, 33, 44, and 55 g/L without pH control during fermentation. The results obtained are presented in Figure 4. From the figure, it is clearly seen that while at 11 g/L substrate concentration, the conversion is almost complete, and close to the theoretical. The degree of conversion decreased with increasing substrate concentration, probably due to the inhibition of high substrate concentration and/or product accumulation. The values of degree of conversion were 100, 76, 51, 39, and 34%, respectively. It is worth mentioning that during the fermentation period (about 50 h), a decrease in the biomass concentration was not observed.

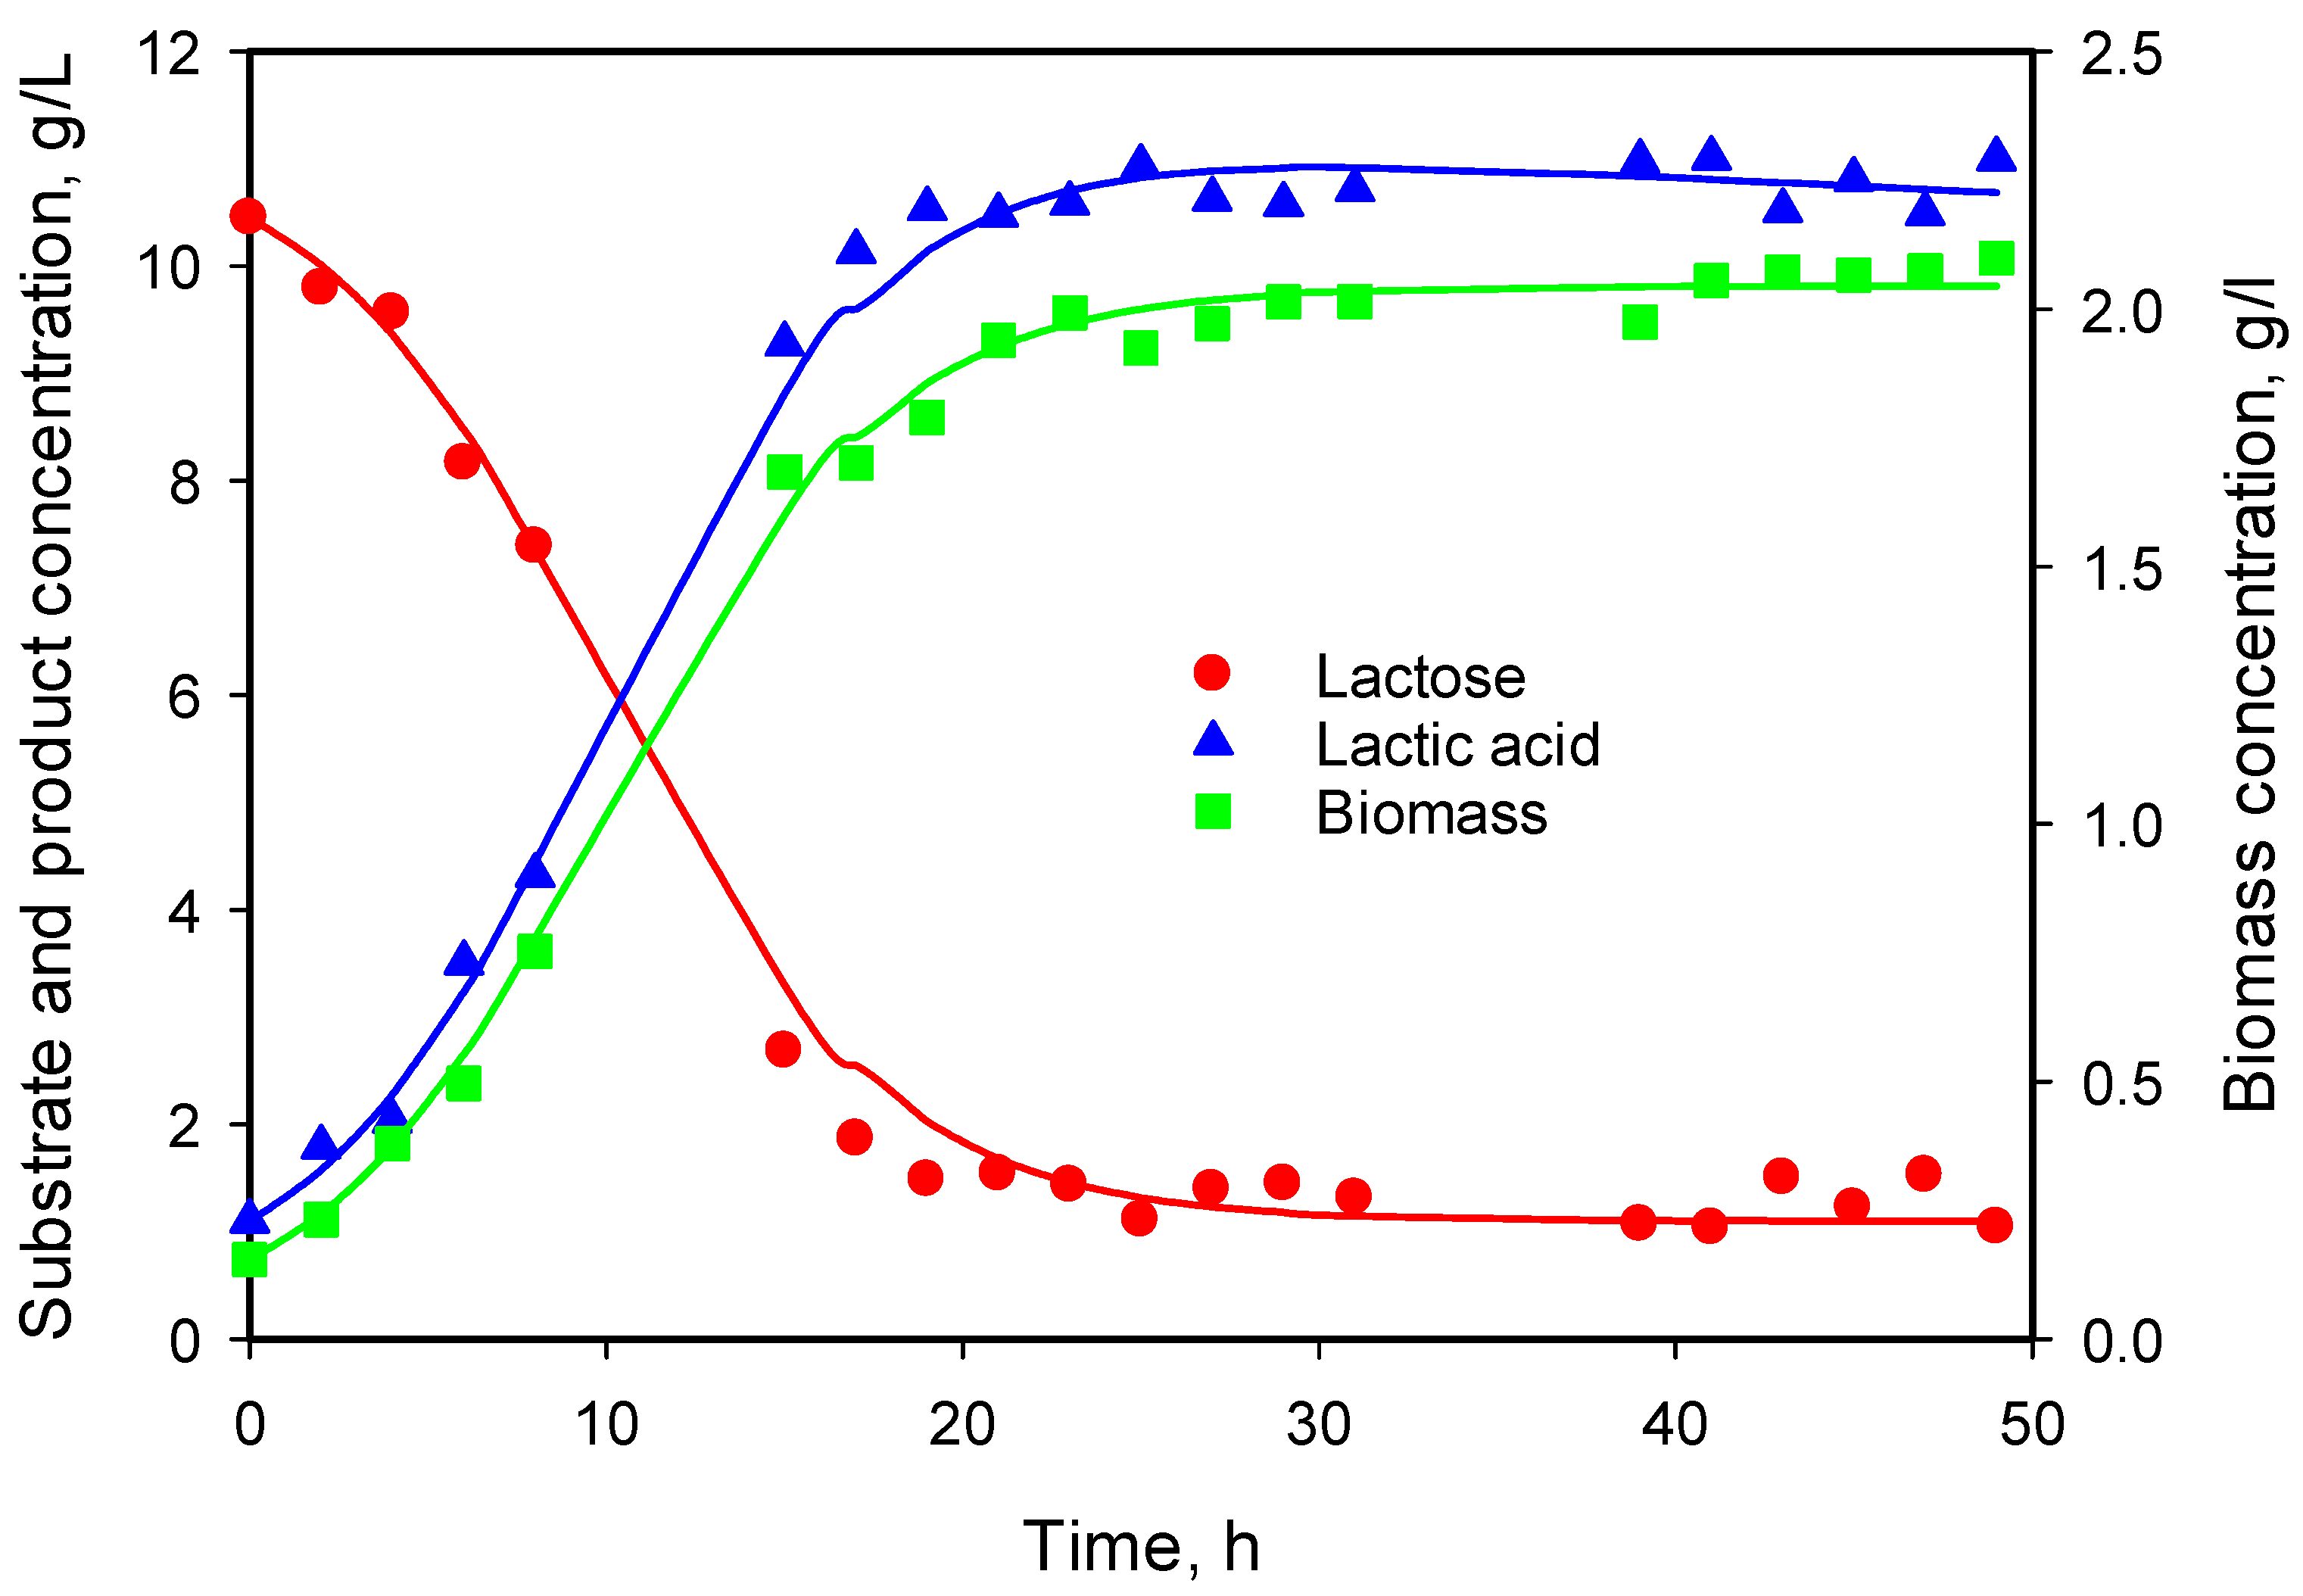
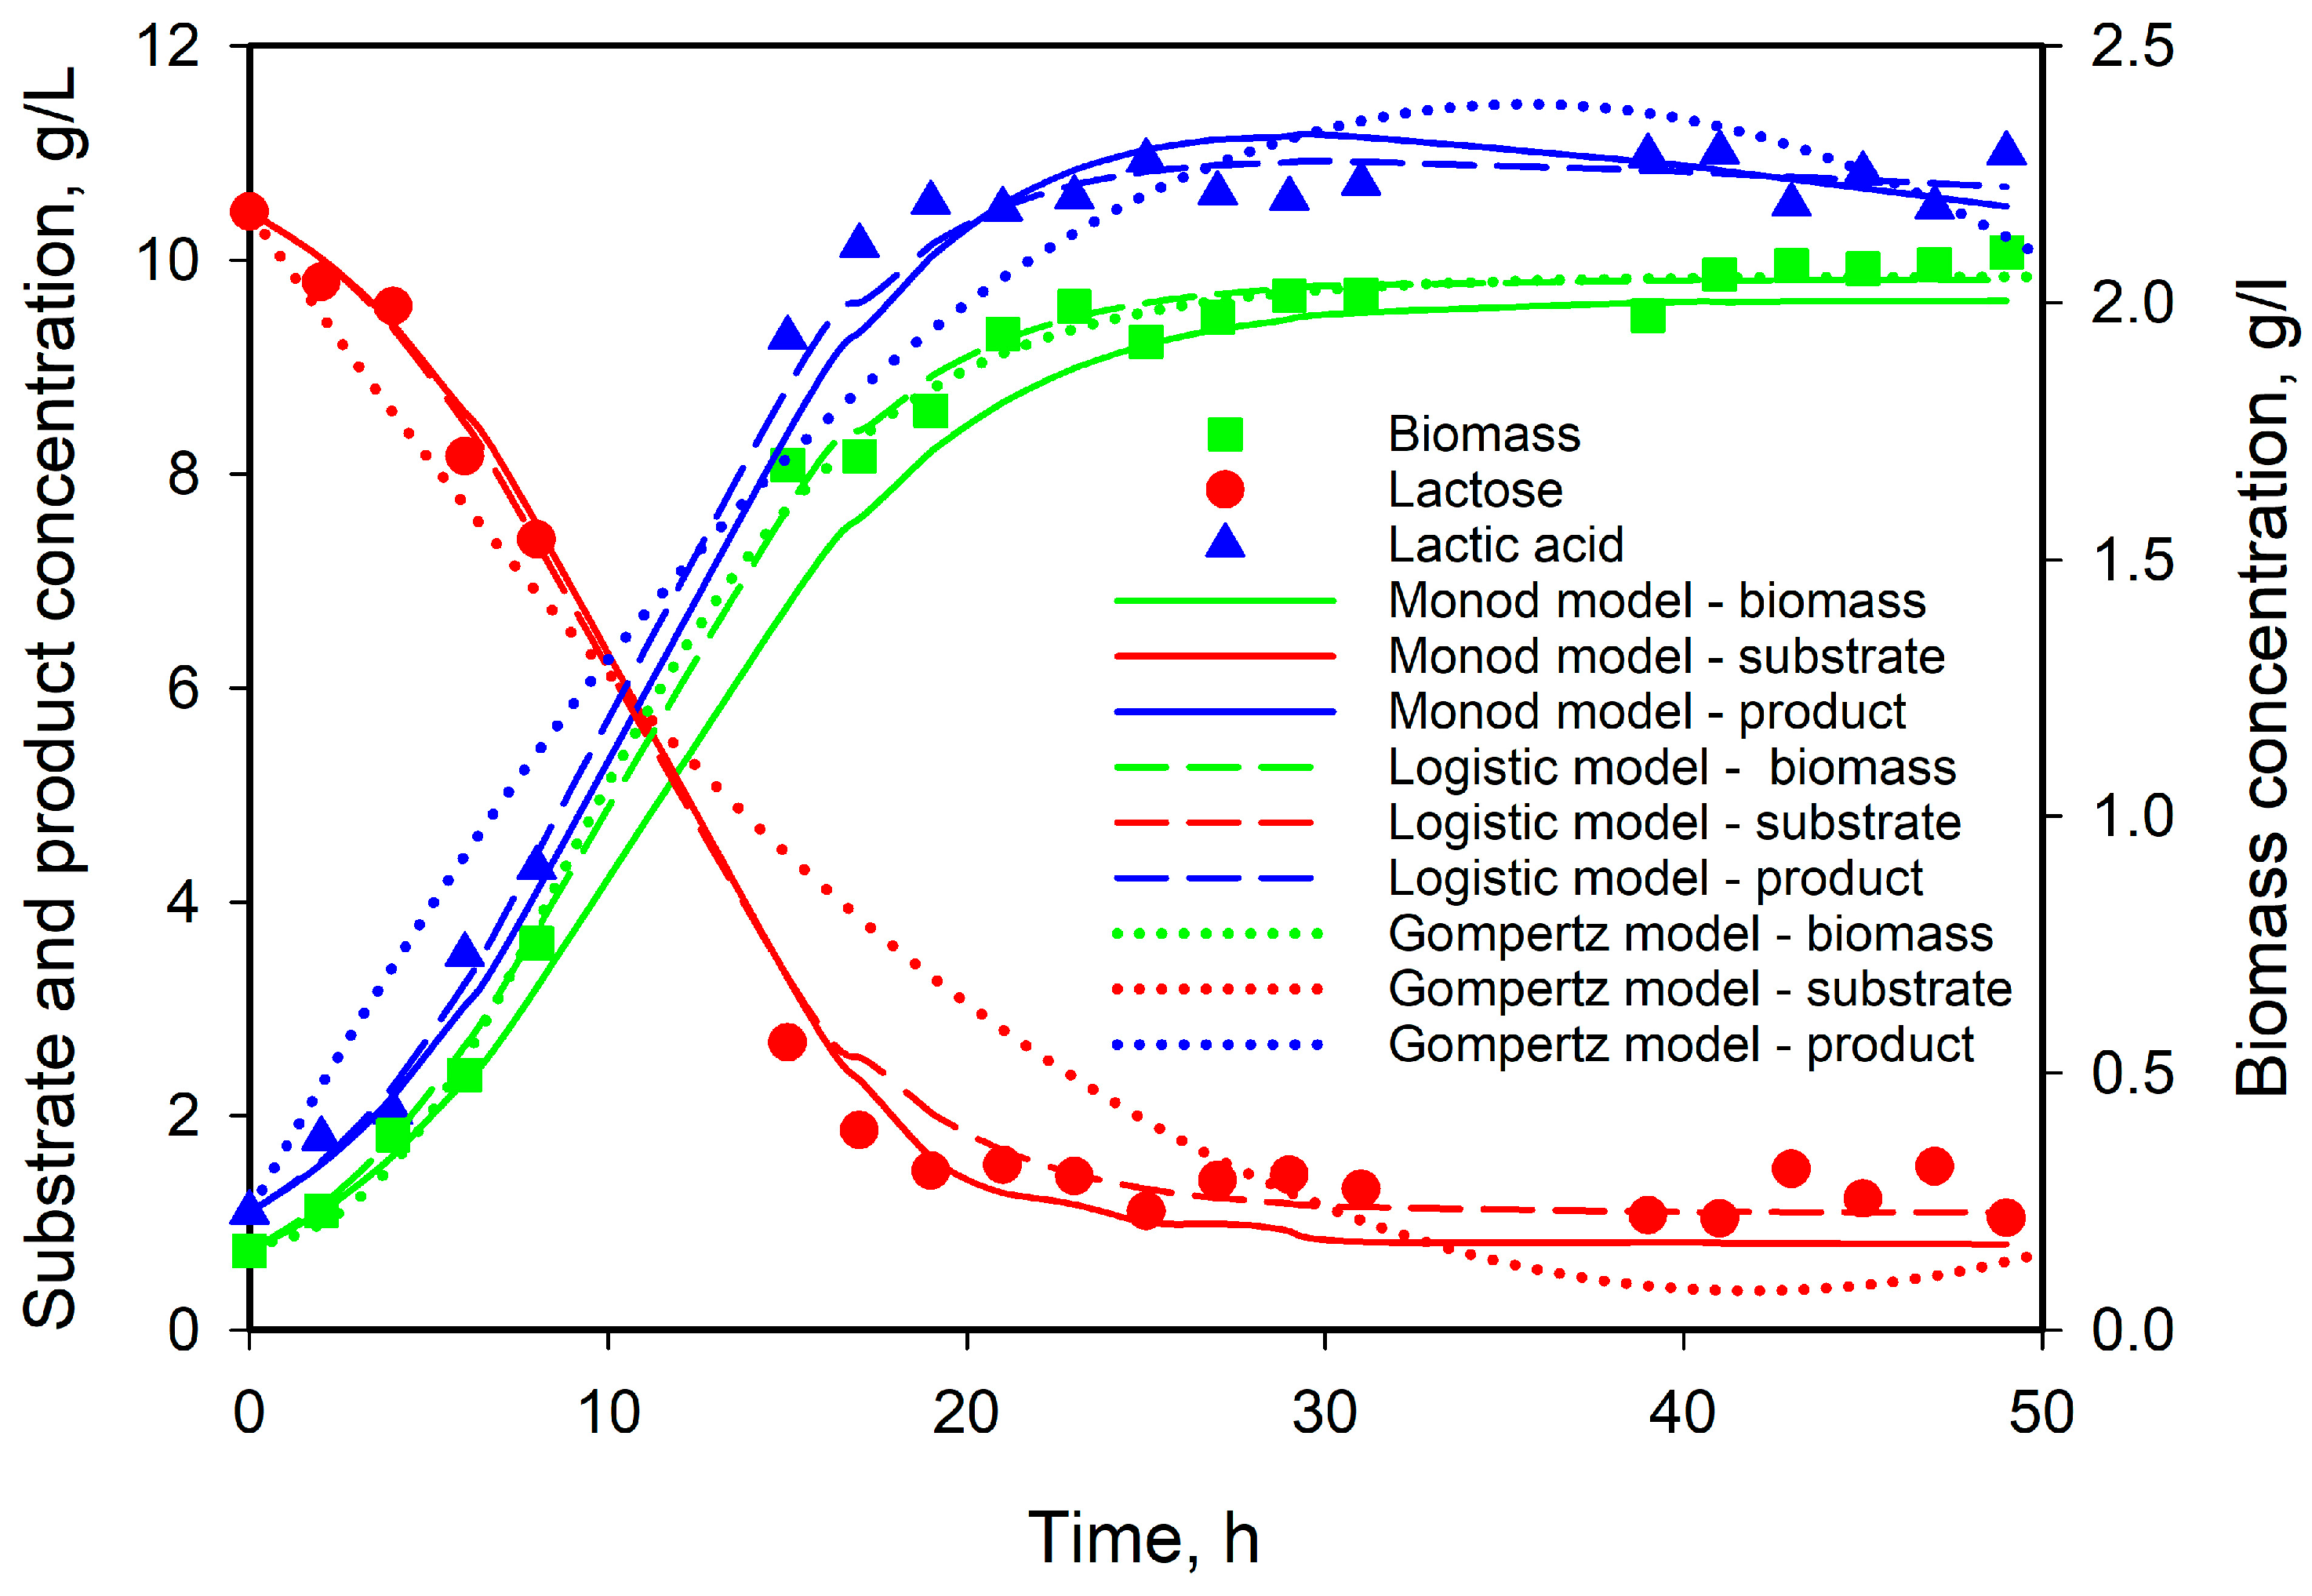
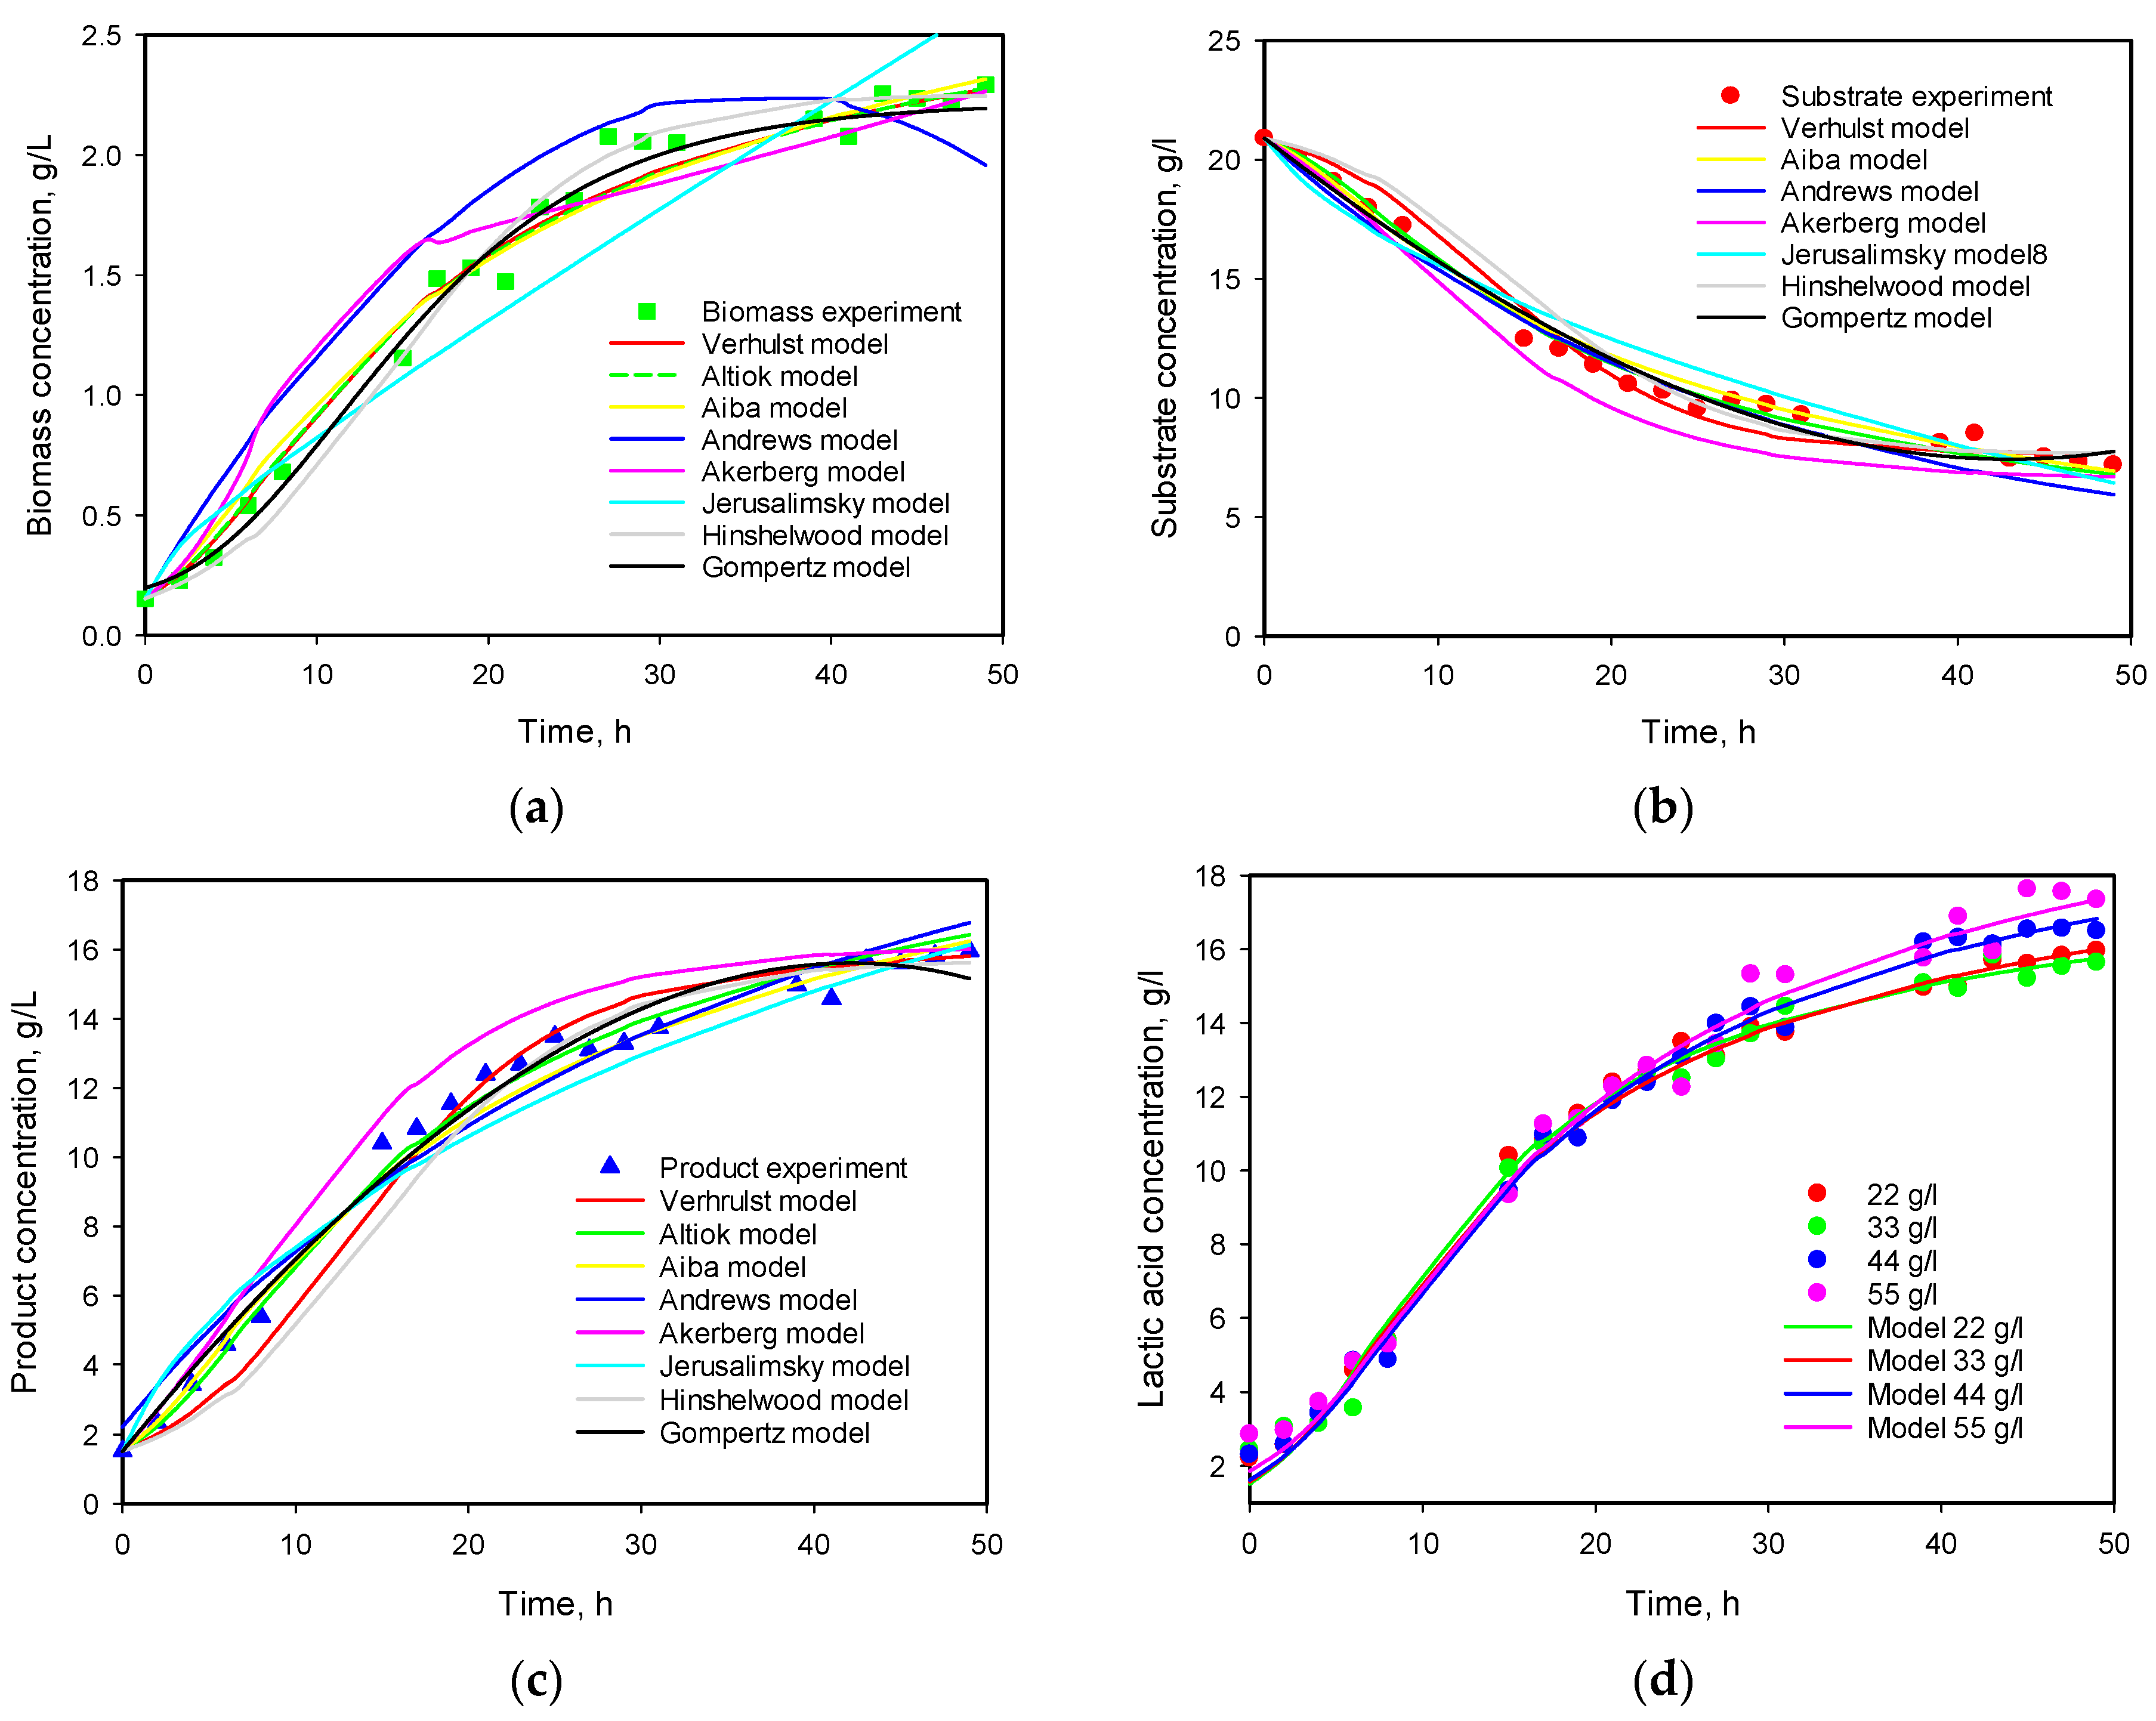
3.5. Modeling of Cell Growth, Substrate Consumption, and Product Accumulation

An algorithm for simultaneously solving the model equations describing the fermentation process at different initial substrate concentrations was developed.
Using this algorithm, our experimental data were used to calculate parameters’ values μ m a x , K S , K P , K i , X m a x , Y X / S , α , β , Y P / S in the model equations.
For this purpose, the experimental data were processed by minimization procedure of the target function Q, being the sum of the squares of the differences between the measured biomass, substrate, and lactic acid concentrations and calculated concentrations from the models:
Q μ m a x , K S , K P , K i , X m a x , Y X / S , α , β , Y P / S = 1 N i = 1 N X t i X e x p t i 2 + 1 N i = 1 N S t i S e x p t i 2 + 1 N i = 1 N P t i P e x p t i 2
where i is the experimental point number; X, S, and P are values of biomass, substrate, and product concentration calculated by the model; Xexp, Sexp, and Pexp are experimental values; t i i = 1 , , N are the times in which the biomass (X), substrate (S), and lactic acid (P) concentrations are quantified; and N is the experimental data number.
A derivative-free method (fminsearch) is used to find the minimum of the target function Q (least square function) of several variables on an unbounded domain, using MATLAB 2013A software.
As can be seen in Figure 5, no cell death phase was observed during the process. The same holds for other initial substrate concentrations.
Therefore, in Equation (1), the second term was omitted as well as the last term in Equation (4) and the set of differential equations describing the process became
d X d t = μ X d S d t = 1 Y X / S d X d t 1 Y P / S d P d t   d P d t = α d X d t + β X
with initial conditions t = 0, X = X0, S = S0, P = P0.
With the aim of finding the best expression for specific biomass growth rate, all kinetic models listed in Table 1, as well as the modified logistic and Gompertz equations, were used.
The attempt to solve the model with the data for all five substrate concentrations was not very successful. The discrepancies between the model and experimental data were large and the Q function value was too big, over 5, and in some cases, the model did not converge.
Analyzing the data for product accumulation in Figure 4, it can be concluded that while at 11 g/L substrate concentration, the conversion is almost complete, increasing the substrate concentration from 22 to 55 g/L leads to strong inhibition of the process and the conversion drops up to about 30%. It was decided to solve the model for 11 g/L separately, using an expression for μ without any additional terms for substrate and product inhibition. Four equations were used—the Monod equation, Verhulst equation, and the modified logistic and modified Gompertz equations.
The results are presented in Figure 6 and the values of the model’s parameters are given in Table 2. All four equations described very well the biomass growth, and Gompertz and Verhulst’s equations gave the best fit. Solving together the system for biomass growth, substrate consumption, and product formation, however, the results were a little bit different—the best fit was obtained with the Verhulst equation. At the same time, the value of the Q function was higher in the case of the Gompertz equation and the discrepancies between model and experimental data were high for substrate and product. The obtained values for maximum cell concentration (Xmax and A) were very close, as well as some other model parameters. A very short lag phase was observed, and the modified Gompertz and logistic models predicted 3–4 h. From the values of the parameters α and β, it is evident that the production of lactic acid with L. plantarum AC 11S is related to biomass growth and there is practically no lactic acid production during the stationary phase.
As for the rest of the experimental data (from 22 to 55 g/L initial substrate concentration), the mathematical model was solved using all the equations listed in Table 1, including different types of inhibition in the terms for specific growth rate μ.
Calculated values of model parameters from simultaneous solutions for all four initial substrate concentrations are listed in Table 3 and presented in Figure 7.
One can see that the best fit (lowest Q value) was obtained with the model proposed by Altıok [20]. The models of Verhulst [19] and Aiba [21] also described the growth and production kinetics very well.
None of the two models including substrate inhibition produce good agreement with experimental data. The same observation was made also by Altıok et al. [20]. Åkerberg et al. [23] also reported that the substrate inhibition was very small compared to the product one.
The values of the yield coefficients YX/S and YP/S are of the same magnitude, except for those obtained by the Monod–Jerusalimsky model. The ratio between values of the parameters α and β is also high, which confirms that product formation is growth-related in this concentration range.
Analyzing the literature data, it is obvious that kinetics constant values are not only strain and substrate specific but also depend on other factors like temperature, pH, media composition, etc. Some of the published data for values of maximal growth rate μ are summarized in Table 4.
Because other authors have solved models separately for each initial substrate concentration, similar calculations were made with the proposed model (Equation (10)). Some of the calculated values are presented in Table 5. Experimental values of α were calculated from experimental data for biomass and product according to the following equation:
α = P f P 0 X f X 0
where index f denotes final and 0 denotes the initial value.

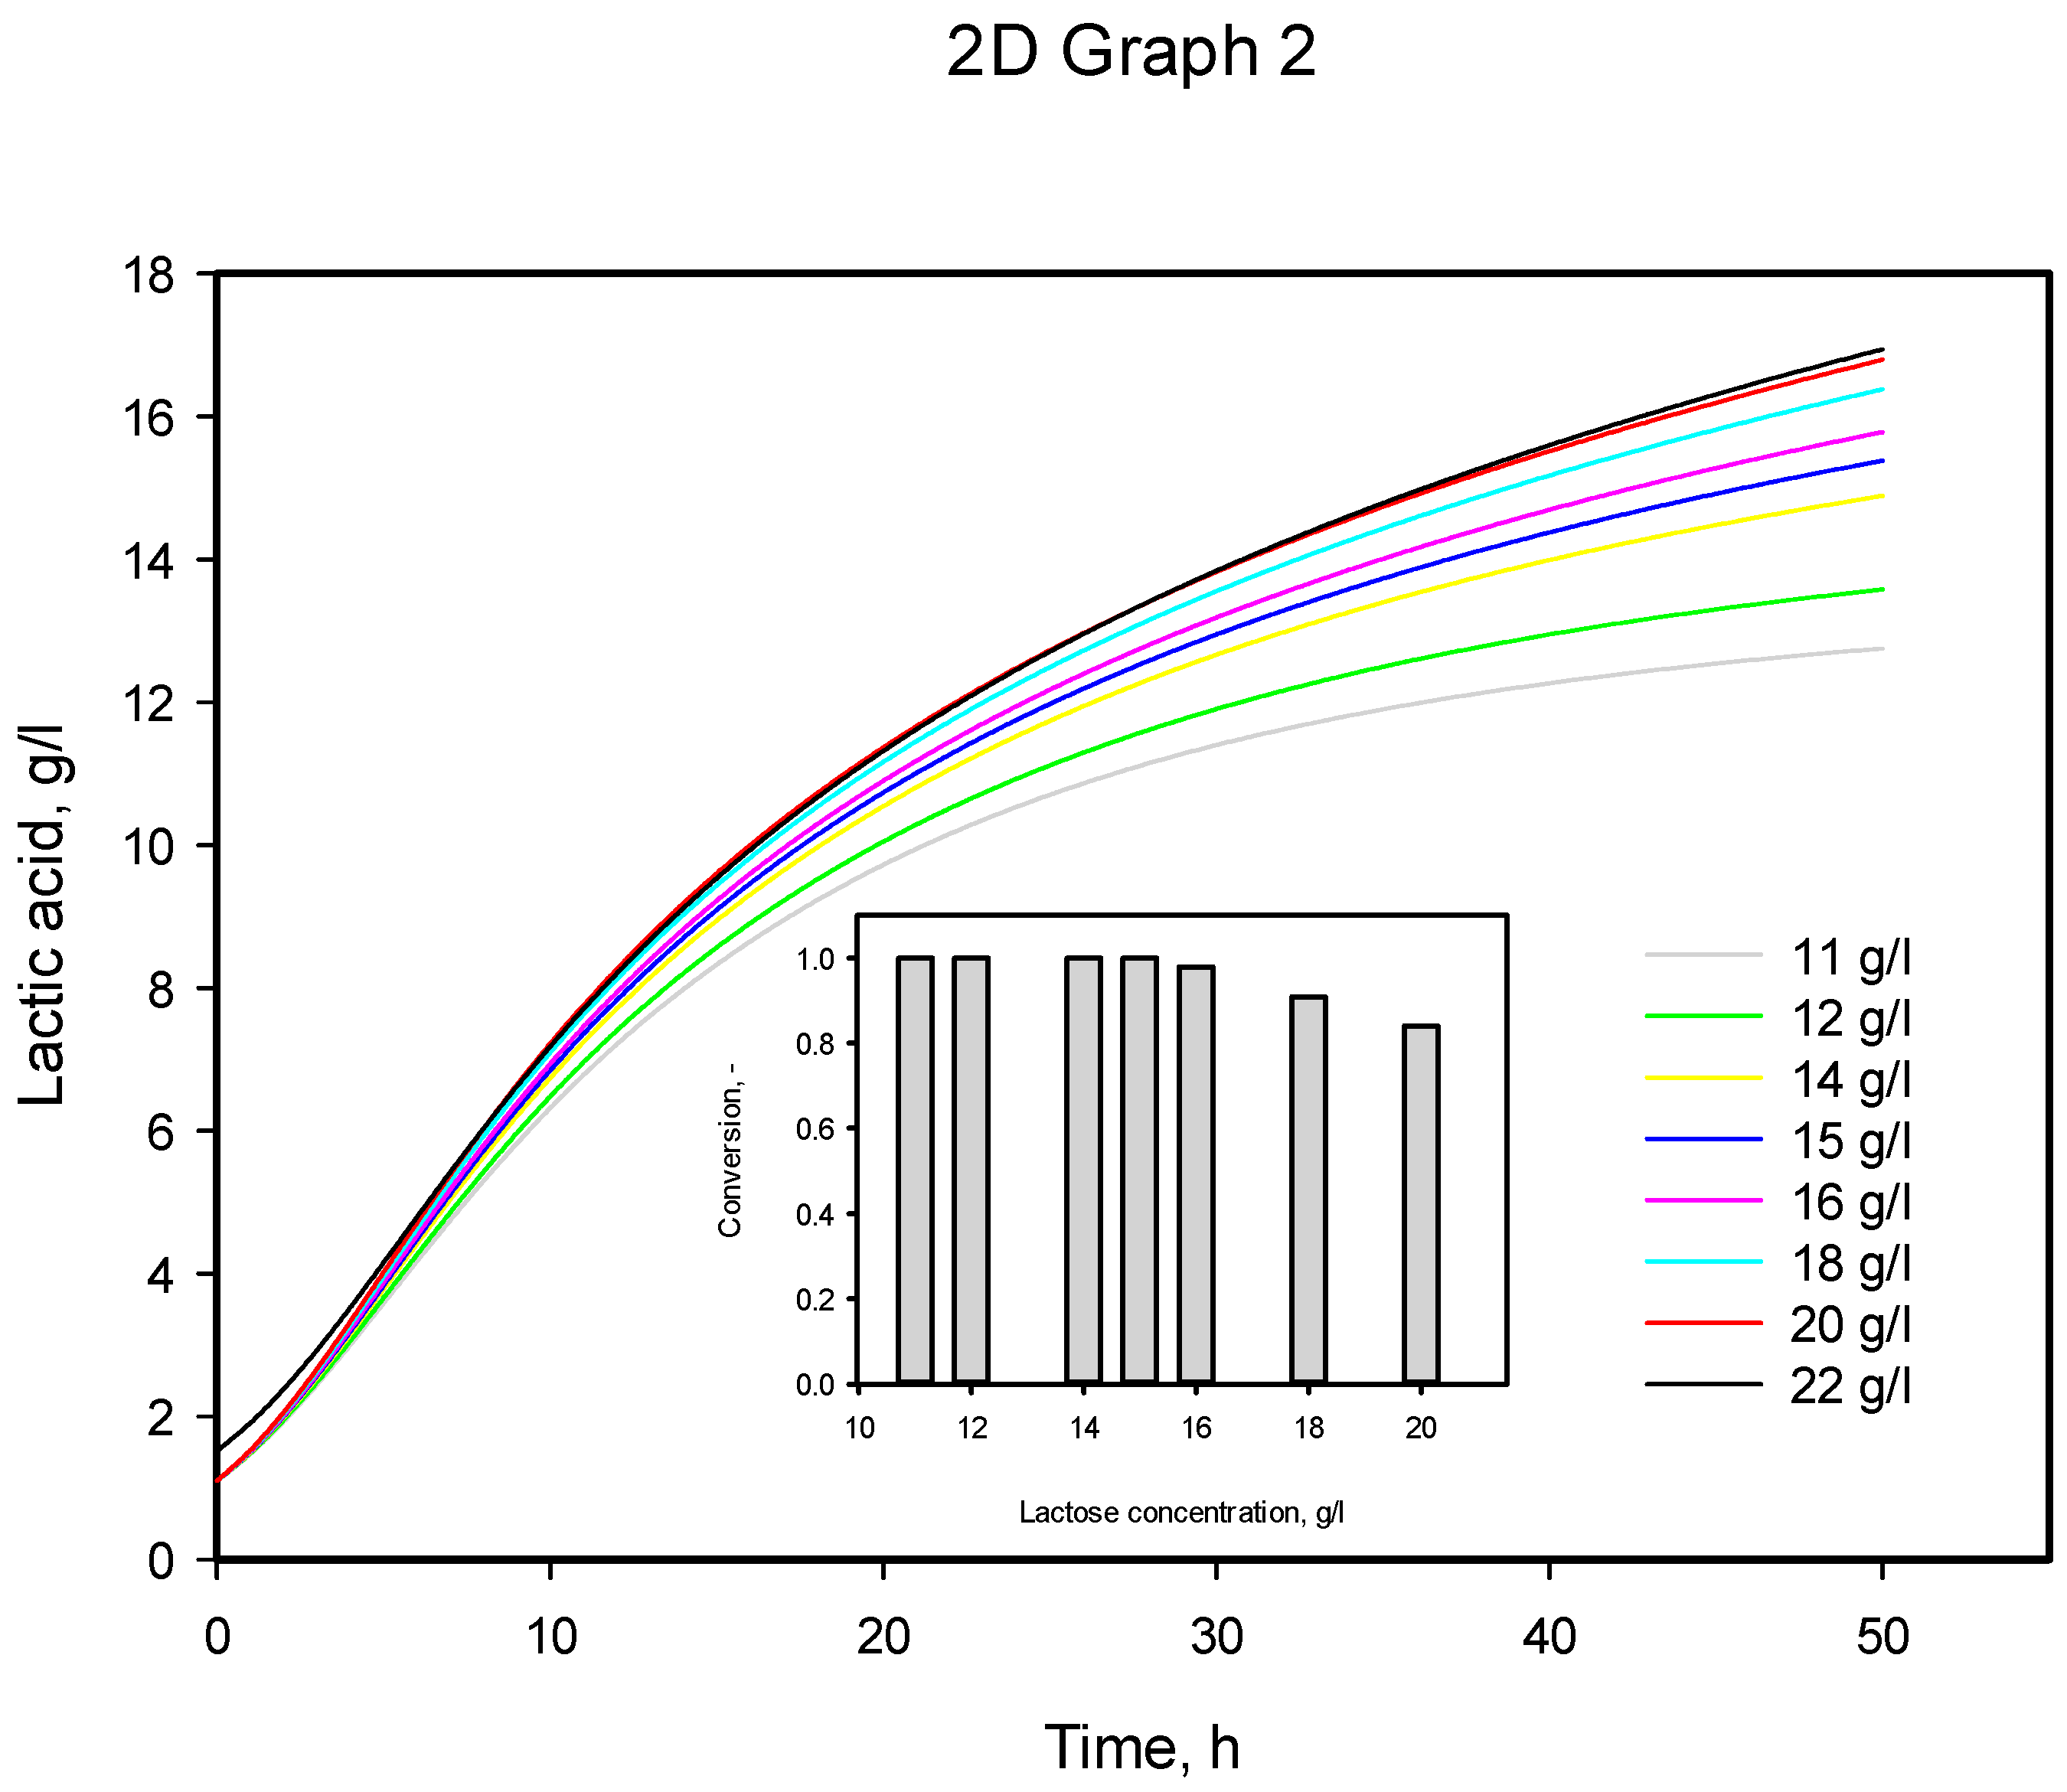
3.6. Model Predictions

One of the advantages of the proper mathematical models of a fermentation process is its ability to predict the system behavior in various conditions. With determined model parameters, some calculations were made with a view to predict the influence of the initial biomass concentration, e.g., inoculum volume, starting point of the inhibition, and lactic acid production at high substrate concentrations. To elucidate the influence of biomass on the growth and lactic acid production, the model was solved for four initial biomass concentrations—1, 2, 5, and 8% v/v inoculum. The results are presented in Figure 8. As can be seen from the figure, an increase in inoculum volume led to a shortening of the lag phase, as well as a reduction in the time necessary to reach the stationary phase. As lactic acid production is growth-associated, an increase in the initial biomass resulted in an increase in lactic acid produced. From the inner figure, it is evident that lactic acid production increased from about 60% to 98% (compared to 10% used in all experiments) when seed volume increased from 1 to 8%.
The model was also solved for six initial substrate concentrations between 11 and 22 g/L. The model predictions are presented in Figure 9. From the inner picture, one can see that the inhibition starts between 15 and 16 g/L.
Finally, the model was solved for higher initial substrate concentrations—from 60 to 100 g/L—and the results are presented in Figure 10. The model predicted a very low increase in product concentration—from 17.07 g/L at 55 g/L to 18.00 at 100 g/L. These values are close to the Pmax value determined according to model 3 (see Table 3).

4. Conclusions

Lactic acid fermentation on lactose by means of Lactiplantibacillus plantarum strain AC 11S was investigated in batch mode without pH control. The optimum pH and temperature were determined to be 6.5 and 30 °C. Lactic acid production by L. plantarum is growth-associated, and at these conditions, maximum lactic acid production (about 18 g/L) was achieved at 55 g/L initial lactose concentration. The strain is extremely acid-resistant. After 3 h exposure to pH = 1.5 and pepsin, it preserved high viability. A mathematical model was developed including equations describing biomass growth, substrate consumption, and product formations. When solving the model only for bacterial growth, the modified Gompertz equation gave the best fit for all initial substrate concentrations in the investigated range. Including this equation in the system with equations for substrate depletion and product accumulation, however, did not produce a good fit with experimental data. The best fit was achieved with a modified Verhulst equation with an added product inhibition term. Solving the model for initial substrate concentrations from 10 to 20 g/L, it was calculated that the product inhibition starts at 15 g/L. The model results for the influence of initial biomass concentration on bacterial growth showed that an increase in inoculum volume led to a shortening of the lag phase duration and time for reaching the stationary phase. The best results were obtained with 10% inoculum volume. The results obtained are a good base for further investigation of the strain capabilities and the investigations will continue with comparison of model predictions and experimental results in pH-controlled fermentation and at fed-batch and continuous mode.

Author Contributions

Conceptualization, D.Y. and S.D.; methodology, D.Y. and P.P.-K.; software, P.P.-K. and D.Y.; validation, D.Y. and S.D.; formal analysis, N.A. and P.P.-K.; resources, D.Y. and S.D.; data curation, P.P.-K.; writing—original draft preparation, D.Y. and S.D.; writing—review and editing, S.D. and D.Y.; visualization, P.P.-K. and N.A. All authors have read and agreed to the published version of the manuscript.

Funding

This research received no external funding.

Institutional Review Board Statement

Not applicable.

Informed Consent Statement

Not applicable.

Data Availability Statement

Not applicable.

Conflicts of Interest

The authors declare no conflicts of interest.

References

  1. Hatti-Kaul, R.; Chen, L.; Dishisha, T.; El Enshasy, H. Lactic acid bacteria: From starter cultures to producers of chemicals. FEMS Microbiol. Lett. 2018, 365, fny213. [Google Scholar] [CrossRef]
  2. Filannin, P.; De Angelis, M.; Di Cagno, R.; Gozzi, G.; Riciputi, Y.; Gobbetti, M. How Lactobacillus plantarum shapes its transcriptome in response to contrasting habitats. Environ. Microbiol. 2018, 20, 3700–3716. [Google Scholar] [CrossRef]
  3. Chen, P.-T.; Hong, Z.-S.; Cheng, C.-L.; Ng, I.-S.; Lo, Y.-C.; Nagarajan, D.; Chang, J.-S. Exploring fermentation strategies for enhanced lactic acid production with polyvinyl alcohol-immobilized Lactobacillus plantarum using microalgae as feedstock. Bioresour. Technol. 2020, 308, 123266. [Google Scholar] [CrossRef]
  4. Yetiman, A.E.; Keskin, A.; Nur, D.B.; Kotil, S.E.; Ortakci, F.; Dogan, M. Characterization of genomic, physiological, and probiotic features Lactiplantibacillus plantarum DY46 strain isolated from traditional lactic acid fermented shalgam beverage. Food Biosci. 2022, 46, 101499. [Google Scholar] [CrossRef]
  5. Yadav, N.; Nain, L.; Khare, K.S. One-pot production of lactic acid from rice straw pretreated with ionic liquid. Bioresour. Technol. 2021, 323, 124563. [Google Scholar] [CrossRef]
  6. David, A.N.; Sewsynker-Sukai, Y.; Gueguim Kana, E.B. Co-valorization of corn cobs and dairy wastewater for simultaneous sacharification and lactic acid production: Process optimization and kinetic assessment. Bioresour. Technol. 2022, 348, 126815. [Google Scholar] [CrossRef]
  7. Haokok, C.; Lunprom, S.; Reungsang, A.; Salakkam, A. Efficient production of lactic acid from cellulose and xylan in sugarcane bagasse by newly isolated Lactiplantibacillus plantarum and Levilactobacillus brevis through simultaneous saccharification and co-fermentation process. Heliyon 2023, 9, e17935. [Google Scholar] [CrossRef] [PubMed]
  8. Derabli, B.; Nancib, A.; Nancib, N.; Aníbal, J.; Raposo, S.; Rodrigues, B.; Boudrant, J. Opuntia ficus indica waste as a cost effective carbon source for lactic acid production by Lactobacillus plantarum. Food Chem. 2022, 370, 131005. [Google Scholar] [CrossRef] [PubMed]
  9. Fu, W.; Mathews, A.P. Lactic acid production from lactose by Lactobacillus plantarum: Kinetic model and effects of pH, substrate, and oxygen. Biochem. Eng. J. 1999, 3, 163–170. [Google Scholar] [CrossRef]
  10. Seddik, H.A.; Bendali, F.; Gancel, F.; Fliss, I.; Spano, G.; Drider, D. Lactobacillus plantarum and Its Probiotic and Food Potentialities. Probiotics Antimicrob. Prot. 2017, 9, 111–122. [Google Scholar] [CrossRef]
  11. Zheng, J.; Wittouck, S.; Salvetti, E.; Franz, C.M.A.P.; Harris, H.M.B.; Mattarelli, P.; O’Toole, P.W.; Pot, B.; Vandamme, P.; Walter, J.; et al. A taxonomic note on the genus Lactobacillus: Description of 23 novel genera, emended description of the genus Lactobacillus Beijerinck 1901, and union of Lactobacillaceae and Leuconostocaceae. Int. J. Syst. Evol. Microbiol. 2020, 70, 2782–2858. [Google Scholar] [CrossRef] [PubMed]
  12. Corsetti, A.; Ciarrocchi, A.; Prete, R. Lactic Acid Bacteria: Lactobacillus spp. In Lactobacillus plantarum. Reference Module in Food Sciences; Elsevier: Amsterdam, The Netherlands, 2016. [Google Scholar] [CrossRef]
  13. Zacharof, M.-P.; Lovitt, R.W. Modelling and Simulation of Cell Growth Dynamics, Substrate Consumption, and Lactic Acid Production Kinetics of Lactococcus lactis. Biotechnol. Bioprocess. Eng. 2013, 18, 52–64. [Google Scholar] [CrossRef]
  14. Bouguettoucha, A.; Balannec, B.; Amrane, A. Unstructured Models for Lactic Acid Fermentation—A Review. Food Technol. Biotechnol. 2011, 49, 3–12. [Google Scholar]
  15. Gordeev, L.S.; Koznov, A.V.; Skichko, A.S.; Gordeeva, Y.L. Unstructured Mathematical Models of Lactic Acid Biosynthesis Kinetics: A Review. Theor. Found. Chem. Eng. 2017, 51, 175–190. [Google Scholar] [CrossRef]
  16. Danova, S.; Georgieva, R.; Koleva, P.; Tropcheva, R.; Manasiev, J.; Nikolova, D. Biodiversity and activity of Lactic acid bacteria from traditional Bulgarian milk products. Sci. Work. UFT—Plovdiv. 2009, 56, 275–280. [Google Scholar]
  17. Torriani, S.; Felis, G.E.; Dellaglio, F. Differentiation of Lactobacillus plantarum, L. pentosus, and L. paraplantarum by recA gene sequence analysis and multiplex PCR assay with recA gene-derived primers. Appl. Environ. Microbiol. 2001, 67, 3450–3454. [Google Scholar] [CrossRef]
  18. Georgieva, R.N.; Iliev, I.N.; Chipeva, V.A.; Dimitonova, S.P.; Samelis, J.; Danova, S.T. Identification and in vitro characterisation of Lactobacillus plantarum strains from artisanal Bulgarian white brined cheeses. J. Basic Microbiol. 2008, 48, 234–244. [Google Scholar] [CrossRef]
  19. Verhulst, P.-F. Notice sur la loi que la population suit dans son accroissement. Corr. Math. Phys. 1838, 10, 113–121. [Google Scholar]
  20. Altıok, D.; Tokatlı, F.; Harsa, Ş. Kinetic modelling of lactic acid production from whey by Lactobacillus casei (NRRL B-441). J. Chem. Technol. Biotechnol. 2006, 81, 1190–1197. [Google Scholar] [CrossRef]
  21. Aiba, S.; Shoda, M.; Nagatani, M. Kinetics of product inhibition in alcohol fermentation. Biotechnol. Bioeng. 1968, 10, 845–864. [Google Scholar] [CrossRef]
  22. Andrews, J.F. A mathematical model for the continuous culture of microorganisms utilizing inhibitory substrates. Biotechnol. Bioeng. 1968, 10, 707–723. [Google Scholar] [CrossRef]
  23. Åkerberg, C.; Hofvendahl, K.; Zacchi, G.; Hahn-Hägerdal, B. Modelling the infuence of pH, temperature, glucose and lactic acid concentrations on the kinetics of lactic acid production by Lactococcus lactis ssp. lactis ATCC 19435 in whole-wheat flour. Appl. Microbiol. Biotechnol. 1998, 49, 682–690. [Google Scholar]
  24. Ierusalimskiĭ, N.D.; Neronova, N.M. Quantitative relationship between the concentration of metabolic products and the rate of growth of microorganisms. Dokl. Akad. Nauk. SSSR 1965, 161, 1437–1440. (In Russian) [Google Scholar]
  25. Hinshelwood, C.N. The Chemical Kinetics of the Bacterial Cell, 1st ed.; Clarendon Press: Oxford, UK, 1946. [Google Scholar]
  26. Zwietering, M.H.; Jongenburger, I.; Rombouts, F.M.; van ‘t Riet, K. Modeling of the Bacterial Growth Curve. Appl. Environ. Microbiol. 1990, 56, 1875–1881. [Google Scholar] [CrossRef] [PubMed]
  27. Luedeking, R.; Piret, E.L. A Kinetic Study of the Lactic Acid Fermentation. Batch Process at Controlled pH. J. Biochem. Microbiol. Technol. Eng. 1959, 1, 393–412. [Google Scholar] [CrossRef]
  28. Brinques, G.B.; Ayub, M.A.Z. Effect of microencapsulation on survival of Lactobacillus plantarum in simulated gastrointestinal conditions, refrigeration, and yogurt. J. Food Eng. 2011, 103, 123–128. [Google Scholar] [CrossRef]
  29. van de Guchte, M.; Serror, P.; Chervaux, C.; Smokvina, T.; Ehrlich, S.D.; Maguin, E. Stress responses in lactic acid bacteria. Antonie Leeuwenhoek 2002, 82, 187–216. [Google Scholar] [CrossRef]
  30. Wall, T.; Båth, K.; Britton, R.A.; Jonsson, H.; Versalovic, J.; Roos, S. The early response to acid shock in Lactobacillus reuteri involves the ClpL chaperone and a putative Cell Wall-altering esterase. Appl. Environ. Microbiol. 2007, 73, 3924–3935. [Google Scholar] [CrossRef] [PubMed]
  31. Barbosa, J.; Albano, H.; Silva, B.; Almeida, M.H.; Nogueira, T.; Teixeira, P. Caracterization of a Lactiplantibacillus plantarum R23 Isolated from Arugula by Whole-Genome Sequencing and Its Bacteriocin Production Ability. Int. J. Environ. Res. Public Health 2021, 18, 5515. [Google Scholar] [CrossRef]
  32. Bomrungnok, W.; Sonomoto, K.; Pinitglang, S.; Wongwicharn, A. Single Step Lactic Acid Production from Cassava Starch by Lactobacillus plantarum SW14 in Conventional Continuous and Continuous with High Cell Density. APCBEE Procedia 2012, 2, 97–103. [Google Scholar] [CrossRef]
  33. Jang, H.-Y.; Kim, M.J.; Bae, M.; Hwang, I.M.; Lee, J.-H. Transcriptional analysis of the molecular mechanism underlying the response of Lactiplantibacillus plantarum to lactic acid stress conditions. Heliyon 2023, 9, e16520. [Google Scholar] [CrossRef] [PubMed]
  34. Baltà-Foix, R.; Serrano-Adrover, C.; López-Cano, A.; Gifre-Renom, L.; Sanchez-Chardi, A.; Arís, A.; Garcia-Fruitós, E. Lactiplantibacillus plantarum: A new example of inclusion body producing bacteria. Microb. Cell Factories 2023, 22, 111. [Google Scholar] [CrossRef] [PubMed]
  35. Adesokan, I.A.; Odetoyinbo, B.B.; Okanlawon, B.M. Optimization of lactic acid production by lactic acid bacteria isolated from some traditional fermented food in Nigeria. Pak. J. Nutr. 2009, 8, 611–615. [Google Scholar]
  36. Venkatesh, K.V.; Okos, M.R.; Wankat, P.C. Kinetic Model of Growth and Lactic Acid Production from Lactose by Lactobacillus bulgaricus. Process Biochem. 1993, 28, 231–241. [Google Scholar] [CrossRef]
  37. Lunelli, B.H.; Melo, D.N.C.; de Morais, E.R.; Victorino, I.R.S.; Vasco de Toledo, E.C.; Maciel, M.R.W.; Filho, R.M. Real-time optimization for lactic acid production from sucrose fermentation by Lactobacillus plantarum. Comput. Aided Chem. Eng. 2011, 29, 1396–1400. [Google Scholar]
  38. Peetermans, A.; Foulquié-Moreno, M.R.; Thevelein, J.M. Mechanisms underlying lactic acid tolerance and its influence on lactic acid production in Saccharomyces cerevisiae. Microb. Cell 2021, 8, 111–130. [Google Scholar] [CrossRef] [PubMed]
  39. Mercier, P.; Yerushalmi, L.; Rouleau, D.; Dochain, D. Kinetics of Lactic Acid Fermentation on Glucose and Corn by Lactobacillus amylophilus. J. Chem. Technol. Biotechnol. 1992, 55, 111–121. [Google Scholar] [CrossRef]
  40. Kostov, G.; Angelov, M.; Denkova, Z.; Dobrev, I.; Goranov, B. Lactic acid production with Lactobacillus casei ssp. rhamnosus NBIMCC 1013: Modeling and optimization of the nutrient medium. Eng. Life Sci. 2011, 11, 517–527. [Google Scholar] [CrossRef]
  41. Liu, B.; Yang, M.; Qi, B.; Chen, X.; Su, Z.; Wan, Y. Optimizing l-(+)-lactic acid production by thermophile Lactobacillus plantarum As.1.3 using alternative nitrogen sources with response surface method. Biochem. Eng. J. 2010, 52, 212–219. [Google Scholar] [CrossRef]
  42. Tomás, M.S.J.; Ocaña, V.S.; Wiese, B.; Nader-Macías, M.E. Growth and lactic acid production by vaginal Lactobacillus acidophilus CRL 1259, and inhibition of uropathogenic Escherichia coli. J. Med. Microbiol. 2003, 52, 1117–1124. [Google Scholar] [CrossRef]
  43. Amrane, A.; Prigent, Y. Mathematical Model for Lactic Acid Production from Lactose in Batch Culture: Model Development and Simulation. J. Chem. Technol. Biotechnol. 1994, 60, 241–246. [Google Scholar] [CrossRef]
  44. Colucci Cante, R.; Gallo, M.; Nigro, F.; Passannanti, F.; Budelli, A.; Nigro, R. Mathematical Modeling of Lactobacillus paracasei CBA L74 Growth during Rice Flour Fermentation Performed with and without pH Control. Appl. Sci. 2021, 11, 2921. [Google Scholar] [CrossRef]
  45. Barragán, P.J.; Sánchez, Ó.J.; Henao-Rojas, J.C. Evaluation of the Growth Kinetics of Lactobacillus Plantarum ATCC 8014 on a Medium Based on Hydrolyzed Bovine Blood Plasma at Laboratory and Bench-Scale Levels and Its Application as a Starter Culture in a Meat Product. Fermentation 2020, 6, 45. [Google Scholar] [CrossRef]
  46. Palaniraj, R.; Nagarajan, P. Kinetic Studies in Production of Lactic Acid from Waste Potato Starch Using Lactobacillus casei. Int. J. Chem. Technol. Res. 2012, 4, 1601–1614. [Google Scholar]
  47. Vázquez, J.A.; Murado, M.A. Unstructured mathematical model for biomass, lactic acid and bacteriocin production by lactic acid bacteria in batch fermentation. J. Chem. Technol. Biotechnol. 2008, 83, 91–96. [Google Scholar] [CrossRef]
  48. Trontel, A.; Baršić, V.; Slavica, A.; Šantek, B.; Novak, S. Modelling the Effect of Different Substrates and Temperature on the Growth and Lactic Acid Production by Lactobacillus amylovorus DSM 20531T in Batch Process. Food Technol. Biotechnol. 2010, 48, 352–361. [Google Scholar]
  49. Goranov, B.; Shopska, V.; Denkova, R.; Kostov, G. Kinetics of Batch Fermentation in the Cultivation of a Probiotic Strain Lactobacillus delbrueckii ssp. Bulgaricus B1. Acta Univ. Cibiniensis Ser. E Food Technol. 2015, 19, 61–72. [Google Scholar] [CrossRef]
  50. Gonçalves, L.M.D.; Xavier, A.M.R.B.; Almeida, J.S.; Carrondo, M.J.T. Concomitant substrate and product inhibition kinetics in lactic acid production. Enzym. Microb. Technol. 1991, 13, 314–319. [Google Scholar] [CrossRef]
  51. Anuradha, R.; Suresh, A.K.; Venkatesh, K.V. Simultaneous saccharification and fermentation of starch to lactic acid. Process Biochem. 1999, 35, 367–375. [Google Scholar] [CrossRef]
  52. Balannec, B.; Bouguettoucha, A.; Amrane, A. Unstructured model for batch cultures without pH control of Lactobacillus helveticus—Inhibitory effect of the undissociated lactic acid. Biochem. Eng. J. 2007, 35, 289–294. [Google Scholar] [CrossRef]
  53. Biazar, J.; Tango, M.; Babolian, E.; Islam, R. Solution of the kinetic modeling of lactic acid fermentation using Adomian decomposition method. Appl. Math. Comput. 2003, 144, 433–439. [Google Scholar] [CrossRef]
  54. Ben Youssef, C.; Goma, G.; Olmos-Dichara, A. Kinetic modelling of Lactobacillus casei ssp. rhamnosus growth and lactic acid production in batch cultures under various medium conditions. Biotechnol. Lett. 2005, 27, 1785–1789. [Google Scholar] [CrossRef] [PubMed]
  55. Gupta, S.; Abu-Ghannam, N.; Scannell, A.G.M. Growth and kinetics of Lactobacillus plantarum in the fermentation of edible Irish brown seaweeds. Food Bioprod. Process. 2011, 89, 346–355. [Google Scholar] [CrossRef]
  56. Sharma, V.; Mishra, H.N. Unstructured kinetic modeling of growth and lactic acid production by Lactobacillus plantarum NCDC 414 during fermentation of vegetable juices. LWT Food Sci. Technol. 2014, 59, 1123–1128. [Google Scholar] [CrossRef]
Figure 1. (a) Cell morphology of the strain AC 11S (a Gram staining protocol, 1000× dimension light microscopy Boeco, China microscope); (b) identification of the strain as L. plantarum, with Multiplex PCR using primers targeting recA gene, according to Torriani et al. [17].
Microorganisms 12 00739 g001
Figure 2. Growth curve of L. plantarum AC 11S in mMRS broth with lactose (pH 6.5) at 30 °C after an acidic shock in simulated stomach juice. ΔOD = OD(tx) − OD(t0), where tx = OD600nm at corresponding time point and t0 = OD600nm at 0 h.
Microorganisms 12 00739 g002
Figure 3. (a) Influence of initial pH value on biomass growth and lactic acid production at 30 °C; (b) influence of temperature on biomass growth and lactic acid production at initial pH 6.5.
Microorganisms 12 00739 g003
Figure 4. Influence of initial substrate concentration on the lactic acid production at 30 °C and initial pH value 6.5 without pH control.
Microorganisms 12 00739 g004
Figure 5. Time course of substrate consumption, biomass growth, and lactic acid production from 11 g/L lactose monohydrate at 30 °C and initial pH value 6.5 without pH control.
Microorganisms 12 00739 g005
Figure 6. Experimental and model results for microbial growth, substrate consumption, and lactic acid production from 11 g/L initial substrate concentration.
Microorganisms 12 00739 g006
Figure 7. (a) Comparison of various model data for biomass growth—22 g/L initial substrate concentration; (b) comparison of various model data for substrate consumption—22 g/L initial substrate concentration; (c) comparison of various model data for product formation—22 g/L initial substrate concentration; (d) comparison of experimental data and Altıok model predictions for lactic acid production—22–55 g/L initial substrate concentration.
Microorganisms 12 00739 g007
Figure 8. Model predictions by modified Verhulst model for initial biomass concentrations on the cell’s growth and lactic acid production at 11 g/L initial lactose concentration.
Microorganisms 12 00739 g008
Figure 9. Model predictions by modified Verhulst model for initial substrate concentrations in the range of 11–22 g/L.
Microorganisms 12 00739 g009
Figure 10. Model predictions by modified Verhulst model for initial substrate concentrations in the range of 55–100 g/L.
Microorganisms 12 00739 g010
Table 1. Modified Monod models describing cell growth.
No.Model NameEquation of Biomass Specific Growth RateReference
1Verhulst μ = μ m a x 1 X X m a x n    if n = 1
μ = μ m a x 1 X X m a x
[19]
2Altıok μ = μ m a x 1 X X m a x n 1 1 P P m a x n 2 if n1, n2 = 1
μ = μ m a x 1 X X m a x 1 P P m a x
[20]
3Aiba μ = μ m a x S K S + S e k P P [21]
4Andrews μ = μ m a x S K S + S + S 2 / K i [22]
5Akerberg μ = μ m a x S K S + S + S 2 / K i 1 K P P n [23]
6Monod–Jerusalimsky μ = μ m a x S K S + S K P K P + P [24]
7Hinshelwood μ = μ m a x S K S + S 1 K P P [25]
μmax—maximum growth rate, h−1; X—biomass concentration, g/L; Xmax—maximum biomass concentration, g/L; P—product concentration, g/L; Pmax—maximum product concentration, g/L; S—substrate concentration, g/L; KS—the substrate saturation constant, g/L; KP—product formation constant, g/L; Ki—product inhibition constant, g/L.
Table 2. Model parameters determined by solving the system 10 for 11 g/L initial substrate concentrations.
Model μmaxKSXmaxλAYX/SYP/SαβQ
Monod0.4205.511 0.1754.0165.9650.01971.019
Verhulst0.253 2.045 0.2026.3945.3960.00770.352
Gompertz0.048 2.9591.9250.2055.9866.0860.00423.846
Logistic0.138 4.07051.8750.2292.0114.5910.01.949
μmax—maximum growth rate, h−1; KS—substrate saturation constant, g/L; Xmax—maximum biomass concentration, g/L; A—the asymptotic level of biomass, g/L; λ—duration of the lag phase, h; YX/S and YP/S—yield coefficients for biomass on substrate and product on substrate, respectively, g/g; α [-] and β [h−1]—growth-associated constants for product formation and the non-growth-associated constant for product formation, h−1; Q—target function.
Table 3. Model parameters determined by solving the system 10 for 22–55 g/L initial substrate concentrations.
Model NoμmaxKSKPKiXmaxPmaxn1n2YX/SYP/SαβQ
10.179 1.754 0.1213.6508.3370.01560.991
0.3223.6732.0600.1543.3467.0150.00140.348
20.257 2.26819.389 0.4193.8037.2630.00690.494
0.3023.01317.0872.2481.7670.1512.9516.9480.00290.305
30.3653.4640.247 0.1551.8556.7840.0050.463
40.1680.550 0.077 0.1445.2696.2320.05494.099
50.11317.3062.5066.406 0.01158.2729.071.23674.71
60.1854.2931.052 0.1141.2317.2870.02313.287
70.2334.8470.064 0.1583.2626.5240.00281.348
μmax—maximum growth rate, h−1; KS—substrate saturation constant, g/L; KP—product formation constant, g/L; Ki—product inhibition constant, g/L; Xmax—maximum biomass concentration, g/L; Pmax—maximum product concentration, g/L; n1, n2—coefficients, YX/S and YP/S—yield coefficients for biomass on substrate and product on substrate, respectively, g/g; α [-] and β [h−1]—growth-associated constant for product formation and the non-growth-associated constant for product formation, h−1, Q—target function.
Table 4. Values of the maximal growth rate determined by other authors.
MicroorganismSubstrateGrowth Modelμmax (h−1)Reference
L. amylophilusGlucose 20 g/L μ = μ m a x   1 X X m a x 0.32 (pH 6.5)[39]
L. caseiLactose 20 g/L μ = μ m a x   1 X X m a x 0.511[40]
L. plantarumGlucose 100 g/L μ = μ m a x   1 X X m a x 0.64[41]
L. lactisGlucose 20 g/L μ = μ m a x S K P + P / K S + S P 0.66 (pH 6.5)[13]
L. acidophilusGlucose 10 g/LFour-parameter Gompertz model0.35 (pH 6.5, 30 °C)[42]
0.43 (pH 6.5, 37 °C)
L. helveticusWhey ultrafiltrate powder μ = μ m a x 1 / 1 + c e d t / μ m c 0.56[43]
L. paracaseiRice flour μ = μ m a x S / S + K S X
μ = μ m a x 1 X / X m a x
μ = μ m a x S / K S + S
0.993[44]
0.619
0.811
L. plantarumSucrose 20 g/L μ = μ m a x   1 X X m a x n .0.0545[45]
L. plantarumHydrolyzed wheat flour μ = μ m a x S / K S + S + S 2 / K i 1 K P P n 0.403[23]
L. plantarumLactose 40 g/L μ = μ m a x S / K S + S 0.364 (pH 6.0)[9]
L. plantarumDairy waste water μ = μ m a x   1 X X m a x 0.35[6]
L. caseiWaste potato starch μ = μ m a x S / K S + S 0.115[46]
L. lactisGlucose μ = μ m a x   1 X X m a x 0.687[47]
L. amylovorusGlucose μ = μ m a x S / K S + S K I / K I + P 0.58[48]
Sucrose0.32
Starch0.61
L. delbrueckiiGlucose 10 g/LLogistic equation0.031[49]
L. delbrueckiiGlucose μ = μ m a x / 1 + S / K I
μ = μ m a x e S / K I
μ = μ m a x   1 S / S m n
0.55[50]
0.59
0.58
L. caseiWhey lactose μ = μ m a x   S / K S + S 1 X X m a x 0.265[20]
L. delbrueckiiPotato starch μ = μ m a x e K P P K S + S + S 2 / K i 0.372 (pH 5.5)[51]
L. helveticusWhey lactose μ = μ m a x   1 X X m a x 0.64[52]
L. helveticusLactose 50 g/L μ = μ m a x S / K S + S e S / K I n 1 e P / K P n 2 0.25[53]
L. caseiGlucose 50 g/L μ = μ m a x K P / K P + P S / K S + S 1 P / P c 0.45[54]
L. plantarumIrish brown seaweedsModified Gompertz equation [55]
L. digitata0.4
L. saccharina0.29
L. plantarumGlucose—20 g/L
Vegetable juice—3 g/L RS
Modified Gompertz equation0.6[56]
0.45
L. plantarumGlucose—20 g/L
Vegetable juice—3 g/L RS
Logistic equation0.62[56]
0.53
μmax—maximum growth rate, h−1; S—substrate concentration, g/L; Sm—maximum substrate concentration, g/L; KS—substrate saturation constant, g/L; KP—product formation constant, g/L; Ki—product inhibition constant, g/L; X—biomass concentration, g/L; Xmax—maximum biomass concentration, g/L; P—product concentration, g/L, Pc—critical product concentration, g/L; A—the asymptotic level of biomass, g/L; λ—the duration of the lag phase, h; YX/S and YP/S—yield coefficients for biomass on substrate and product on substrate, respectively, g/g; α [-] and β [h−1]—growth-associated constants for product formation and the non-growth-associated constant for product formation, h−1.
Table 5. Experimental and calculated values of α and µmax.
Initial Substrate Concentration, g/Lα expα calcµmax, calc
115.0916.8500.249
226.7486.7820.334
336.9596.7680.343
446.9477.1970.311
557.6517.1950.309
Mean value6.6796.9580.309
Both mean values are very close to the value predicted by the model solving all data for different substrate concentrations simultaneously.
Disclaimer/Publisher’s Note: The statements, opinions and data contained in all publications are solely those of the individual author(s) and contributor(s) and not of MDPI and/or the editor(s). MDPI and/or the editor(s) disclaim responsibility for any injury to people or property resulting from any ideas, methods, instructions or products referred to in the content.

