
Coccomyxa subellipsoidea KJ Components Enhance the Expression of Metallothioneins and Th17 Cytokines during Human T Cell Activation
 , and
, and 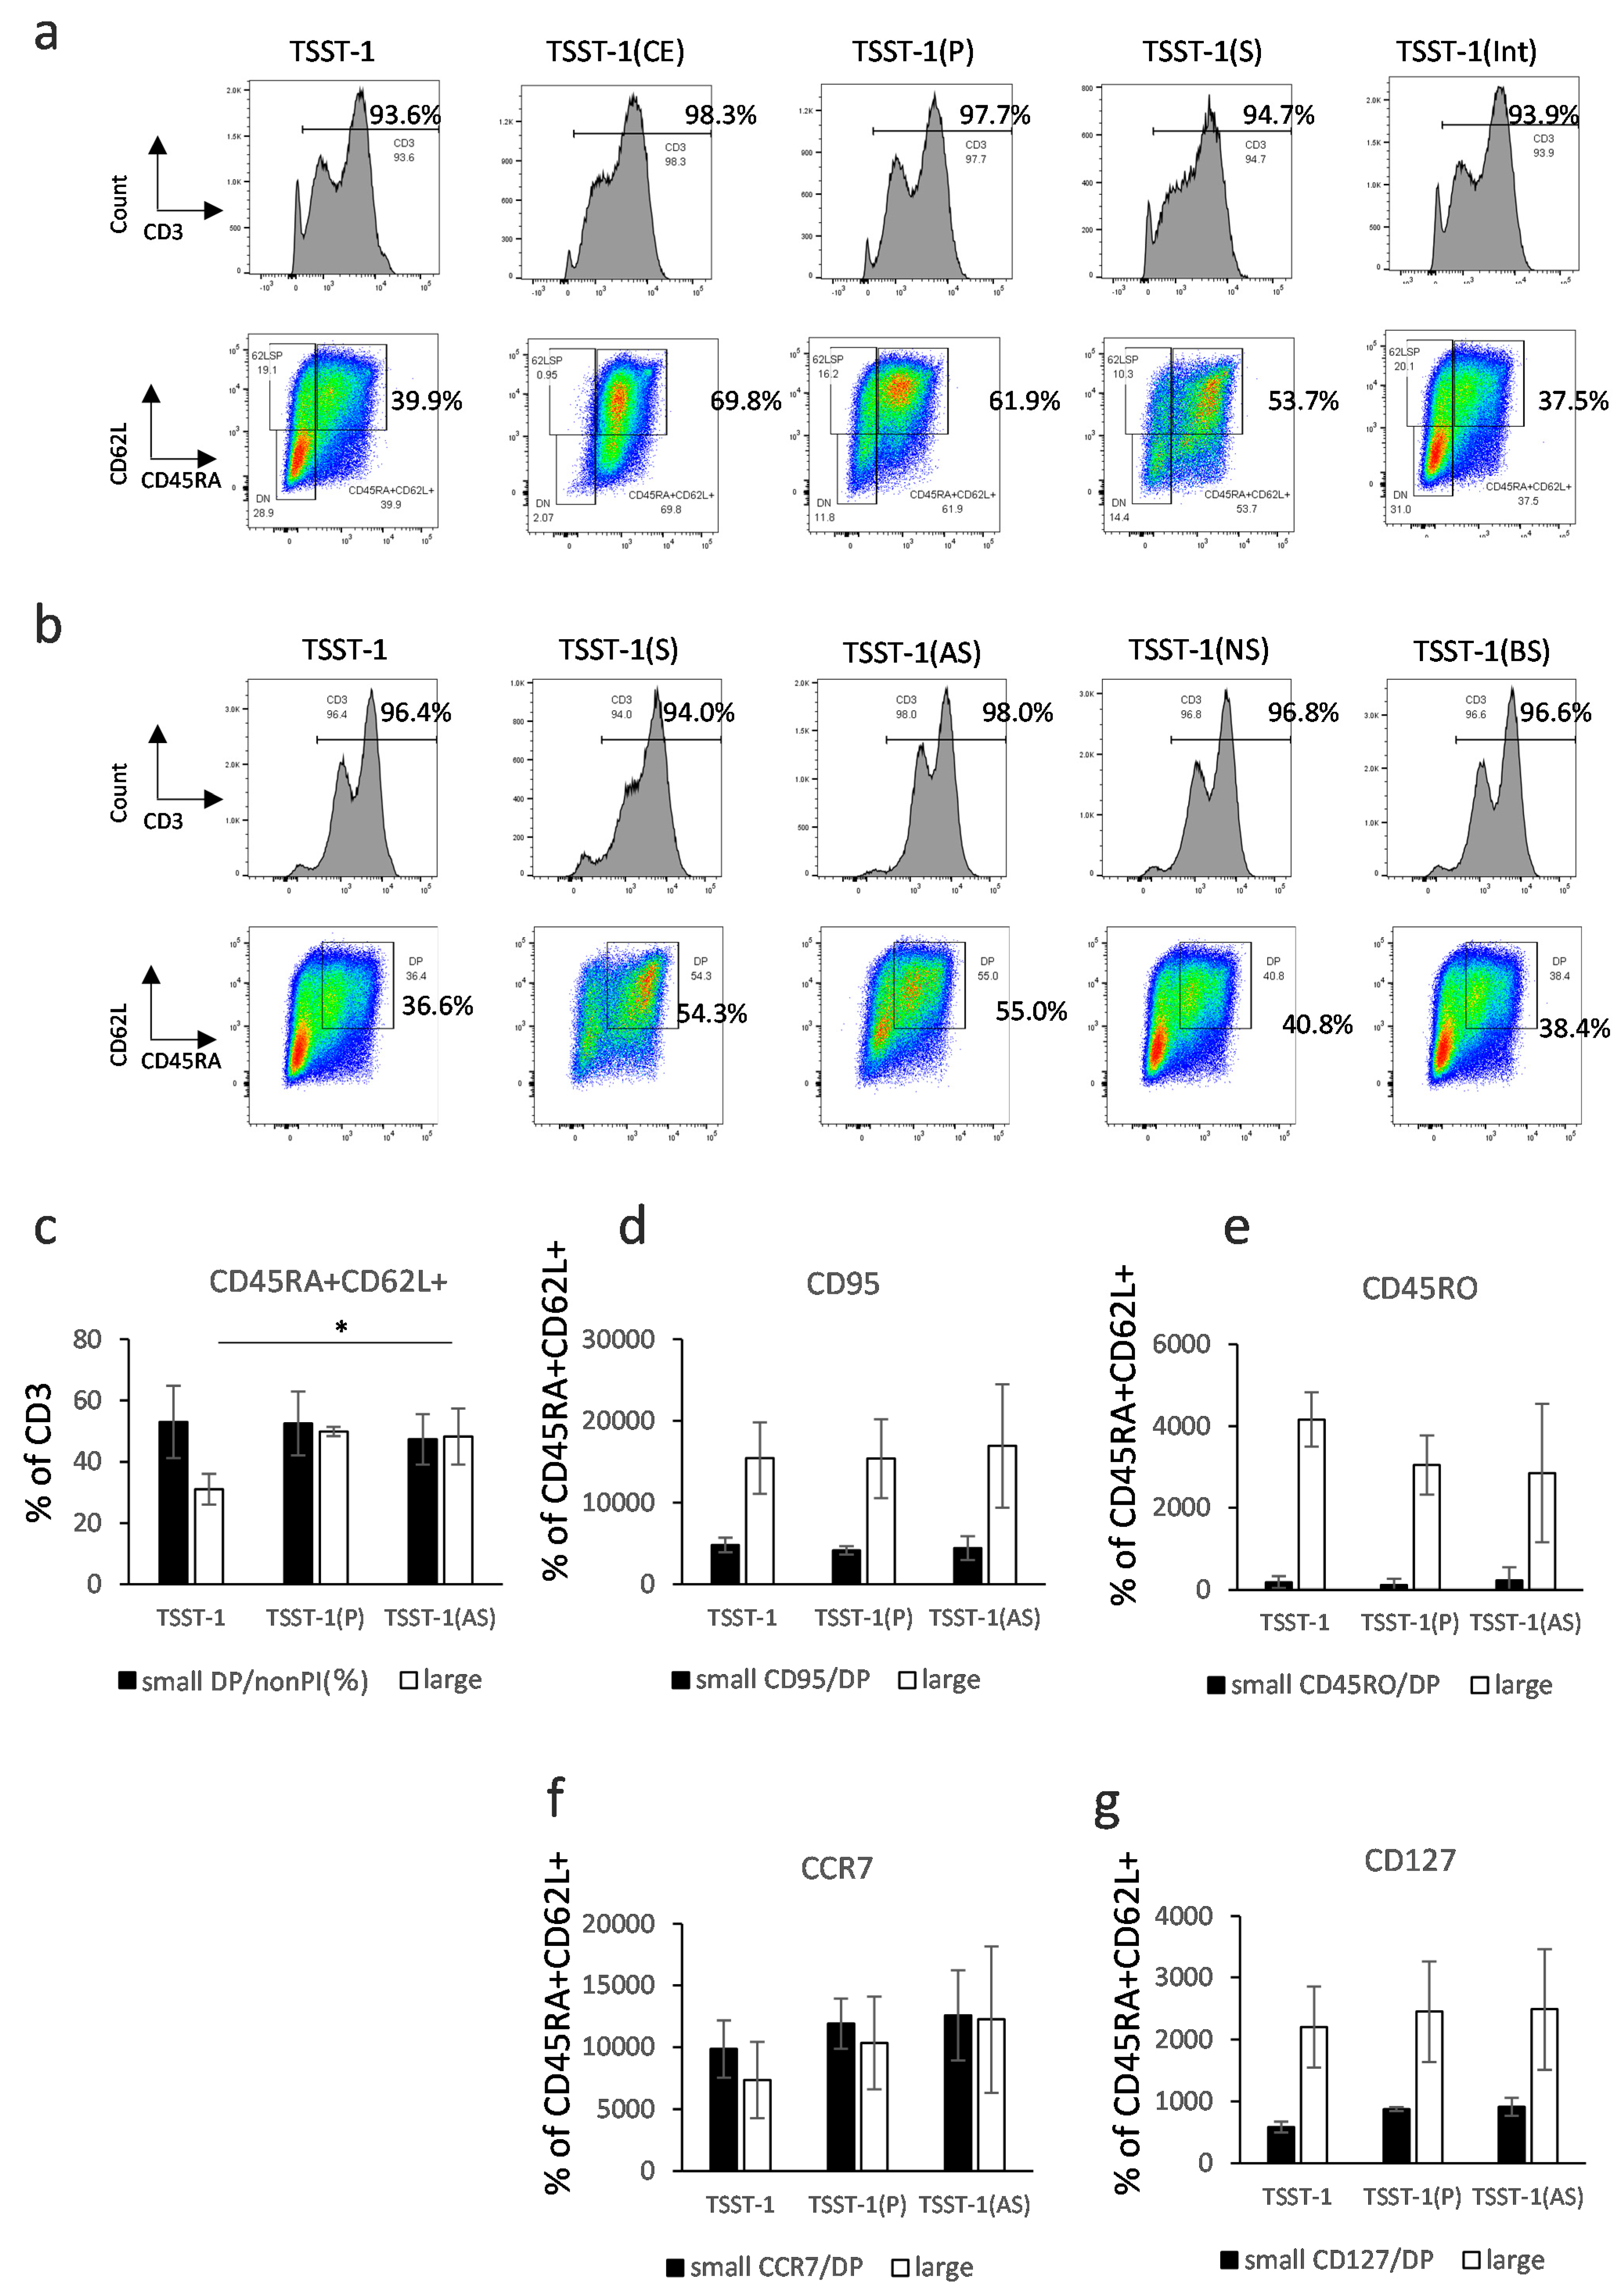
Abstract
:1. Introduction
2. Materials and Methods
2.1. Ethical Approval
2.2. Preparation of Human PBMCs
2.3. Preparation of C-KJ Fractions
2.4. Culture of Human PBMCs
2.5. Analysis of Immune Cell Composition Using FCM
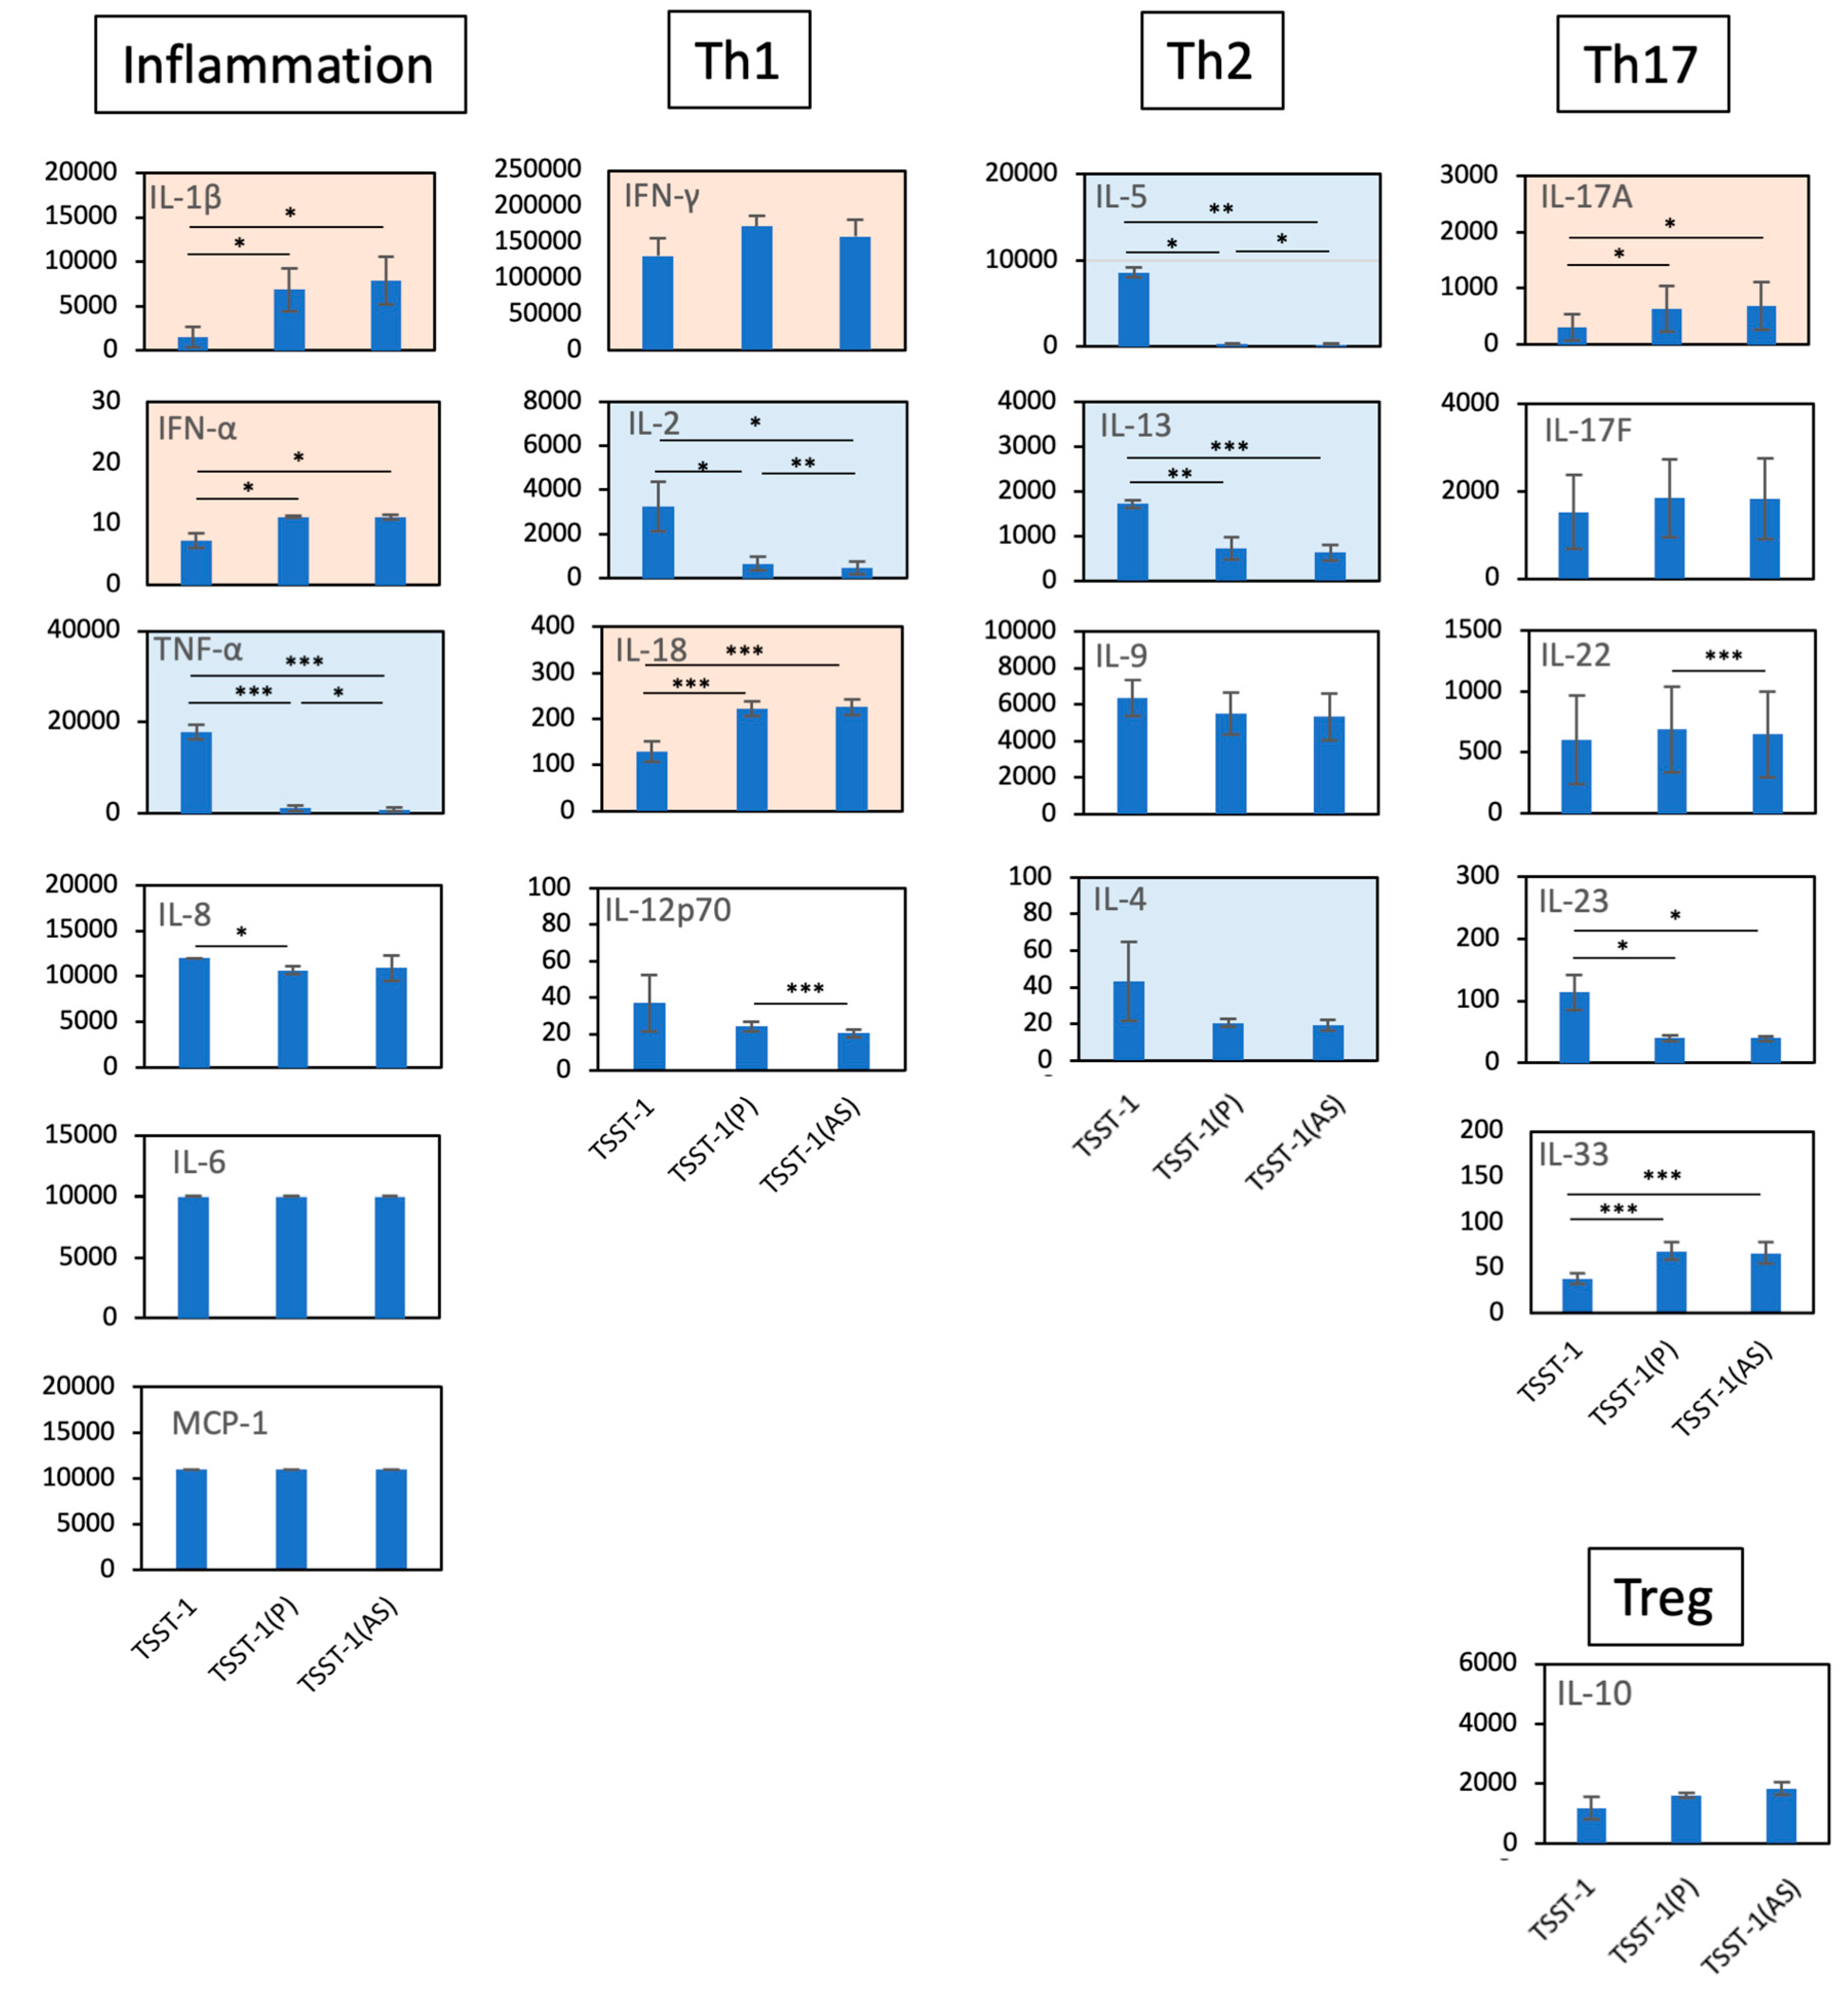
2.6. Quantification of Cytokines Secreted by Cultured PBMCs
2.7. Purification of T Cells
2.8. Microarray and Quantitative Real-Time PCR (qRT-PCR) Analysis
2.9. Zinc Quantification
2.10. Data Analysis
2.11. Statistical Analyses
3. Results
3.1. C-KJ Fractionation
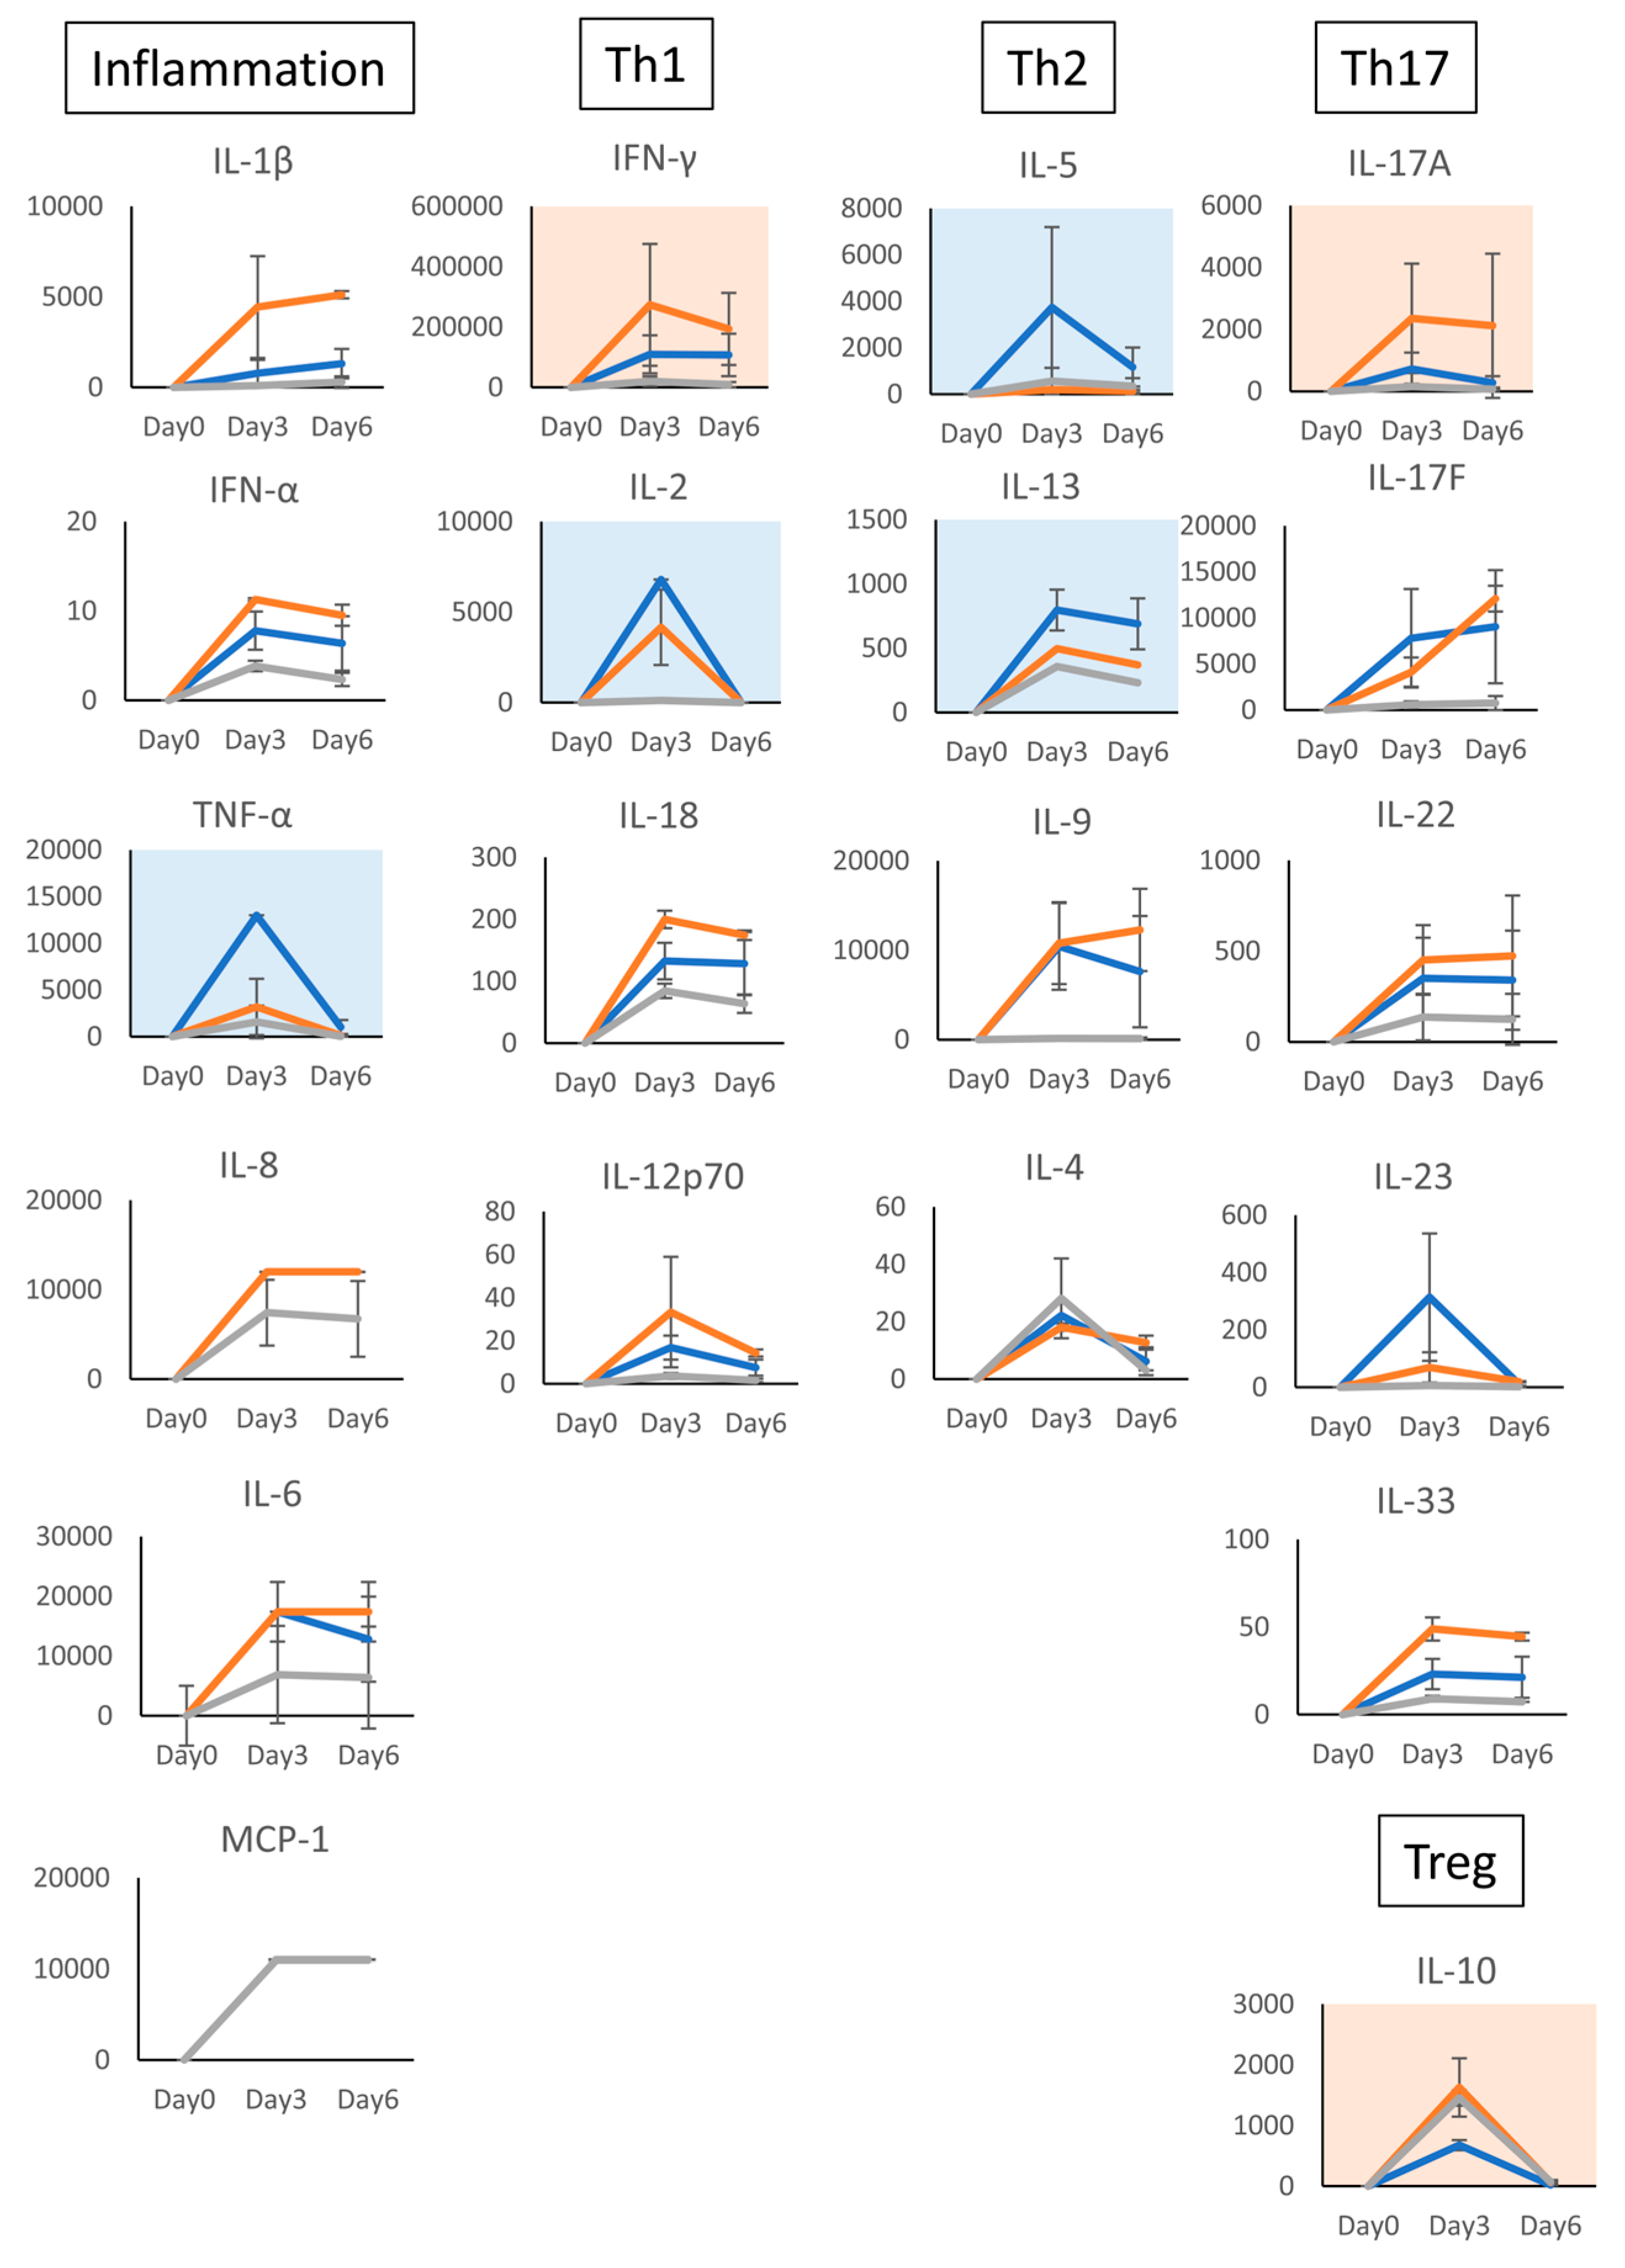
3.2. Characterization of T Cells Differentiated in the Presence of C-KJ Fraction
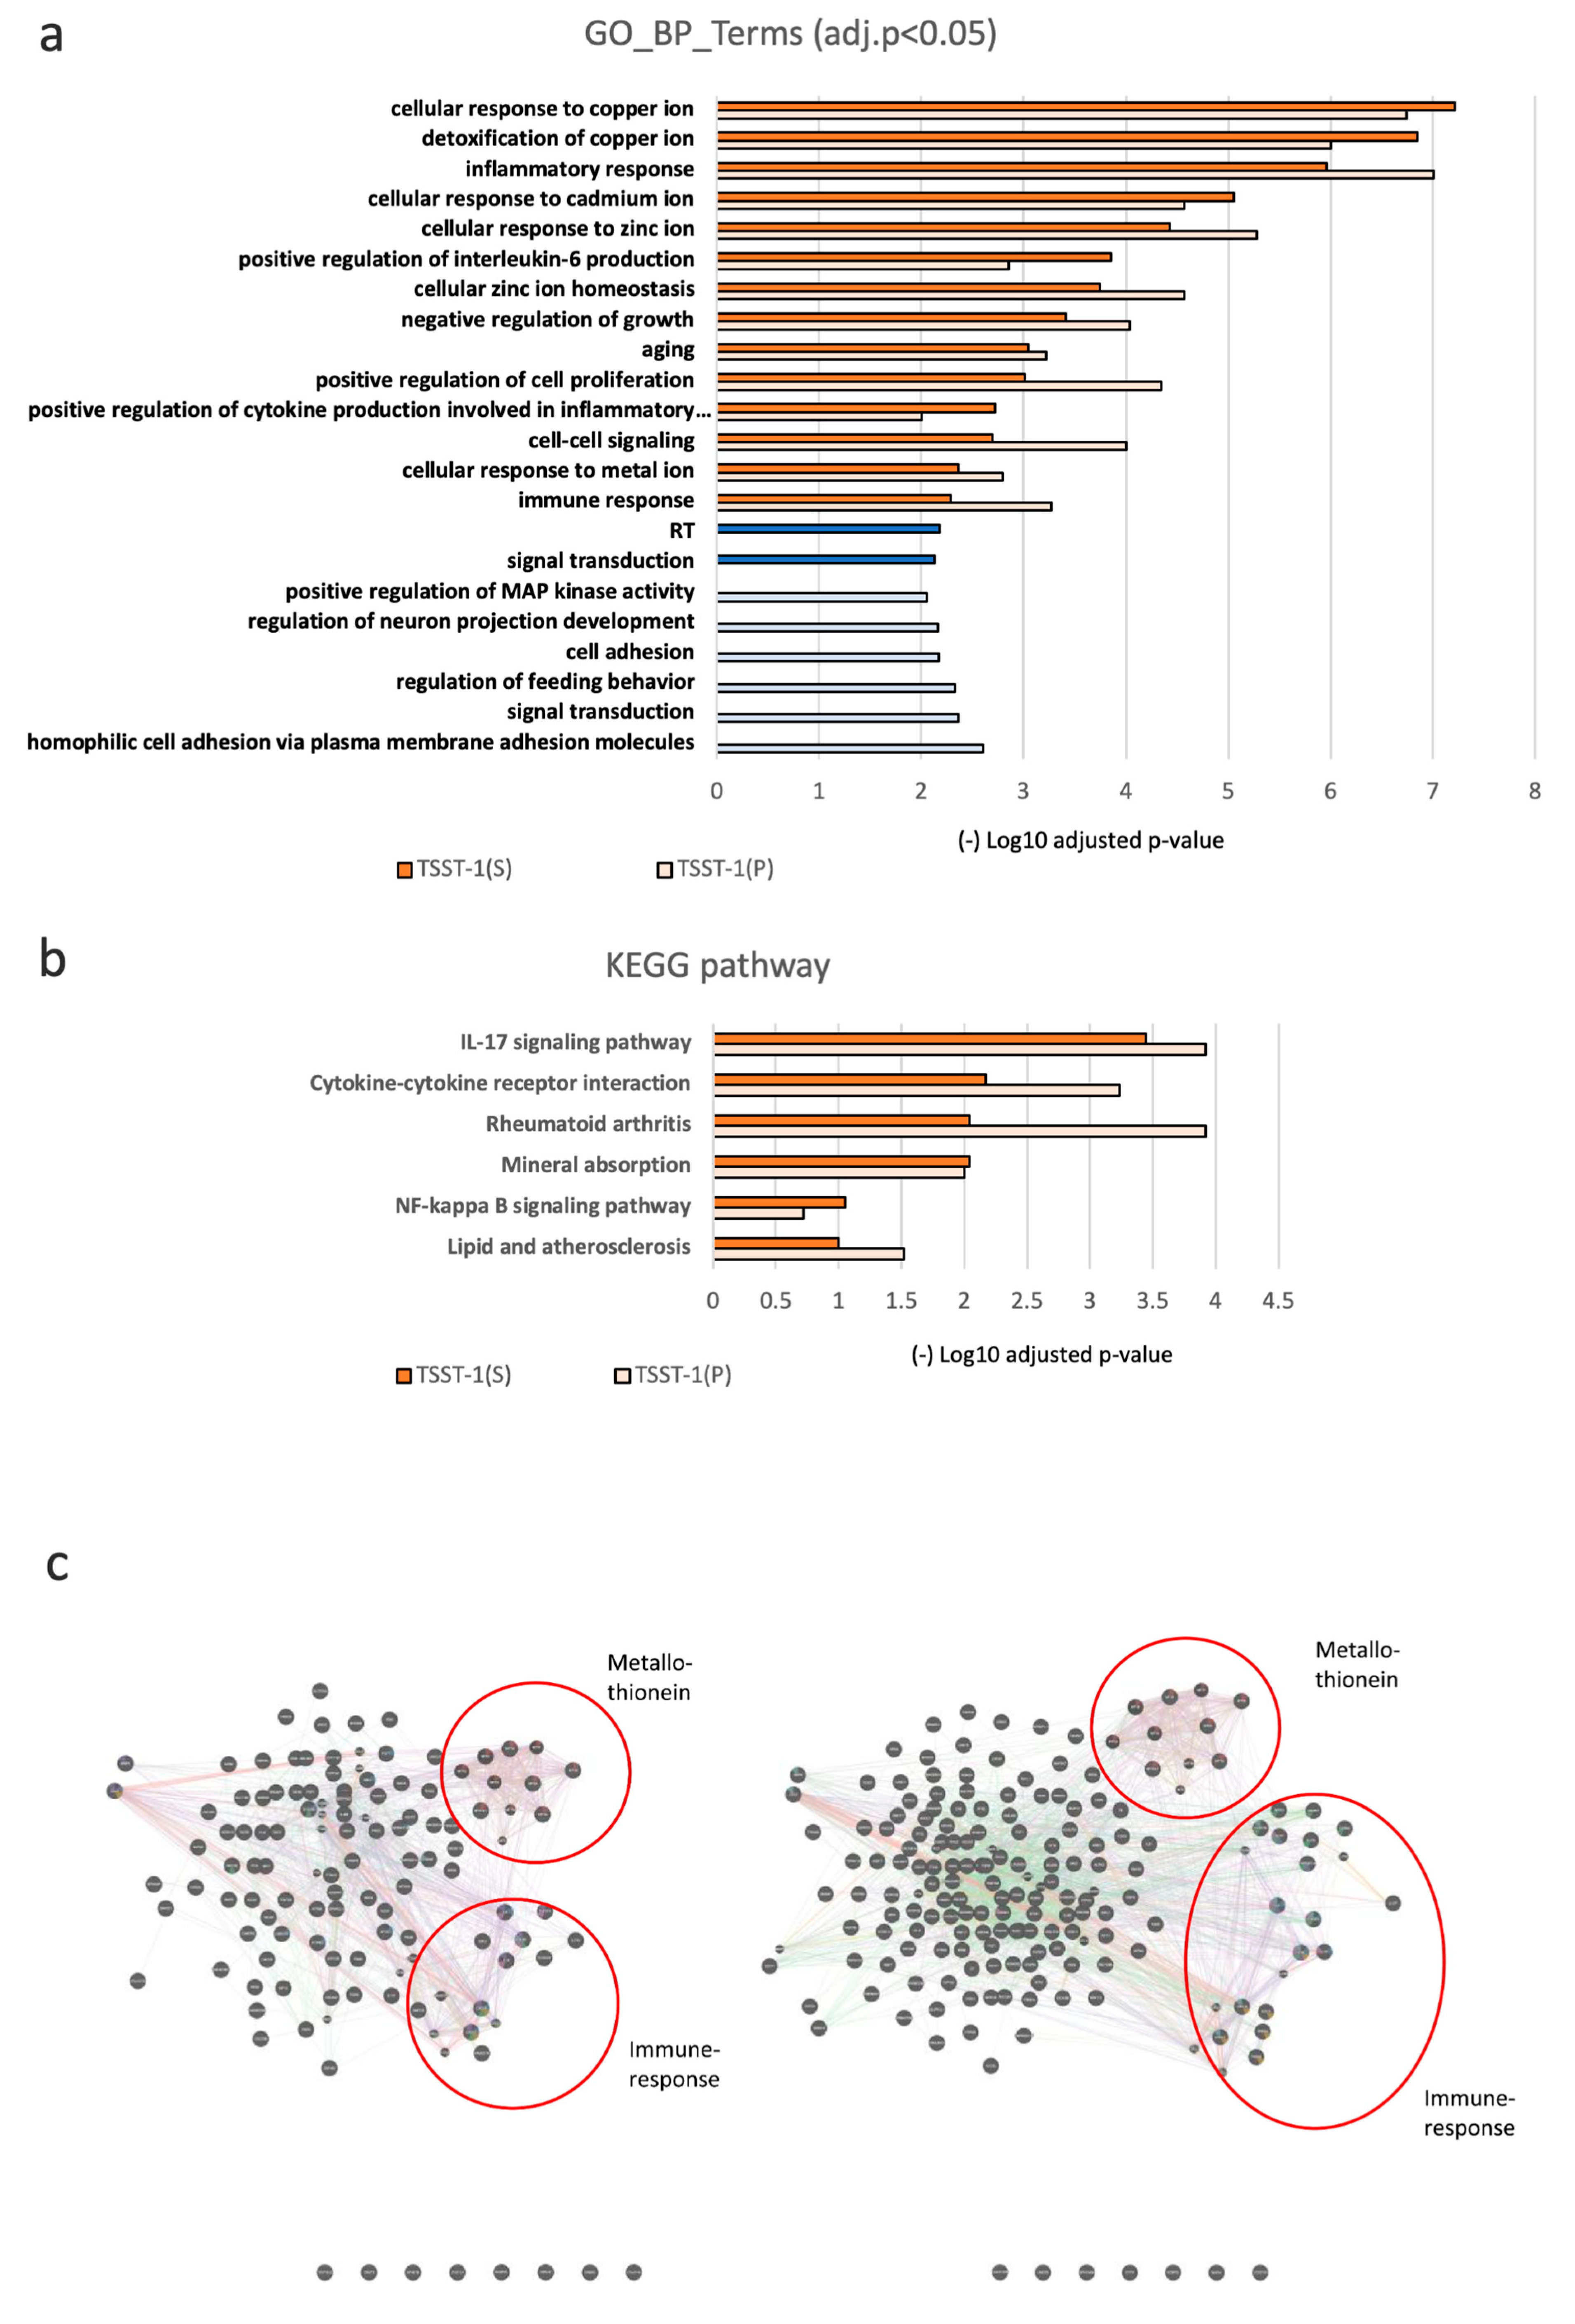
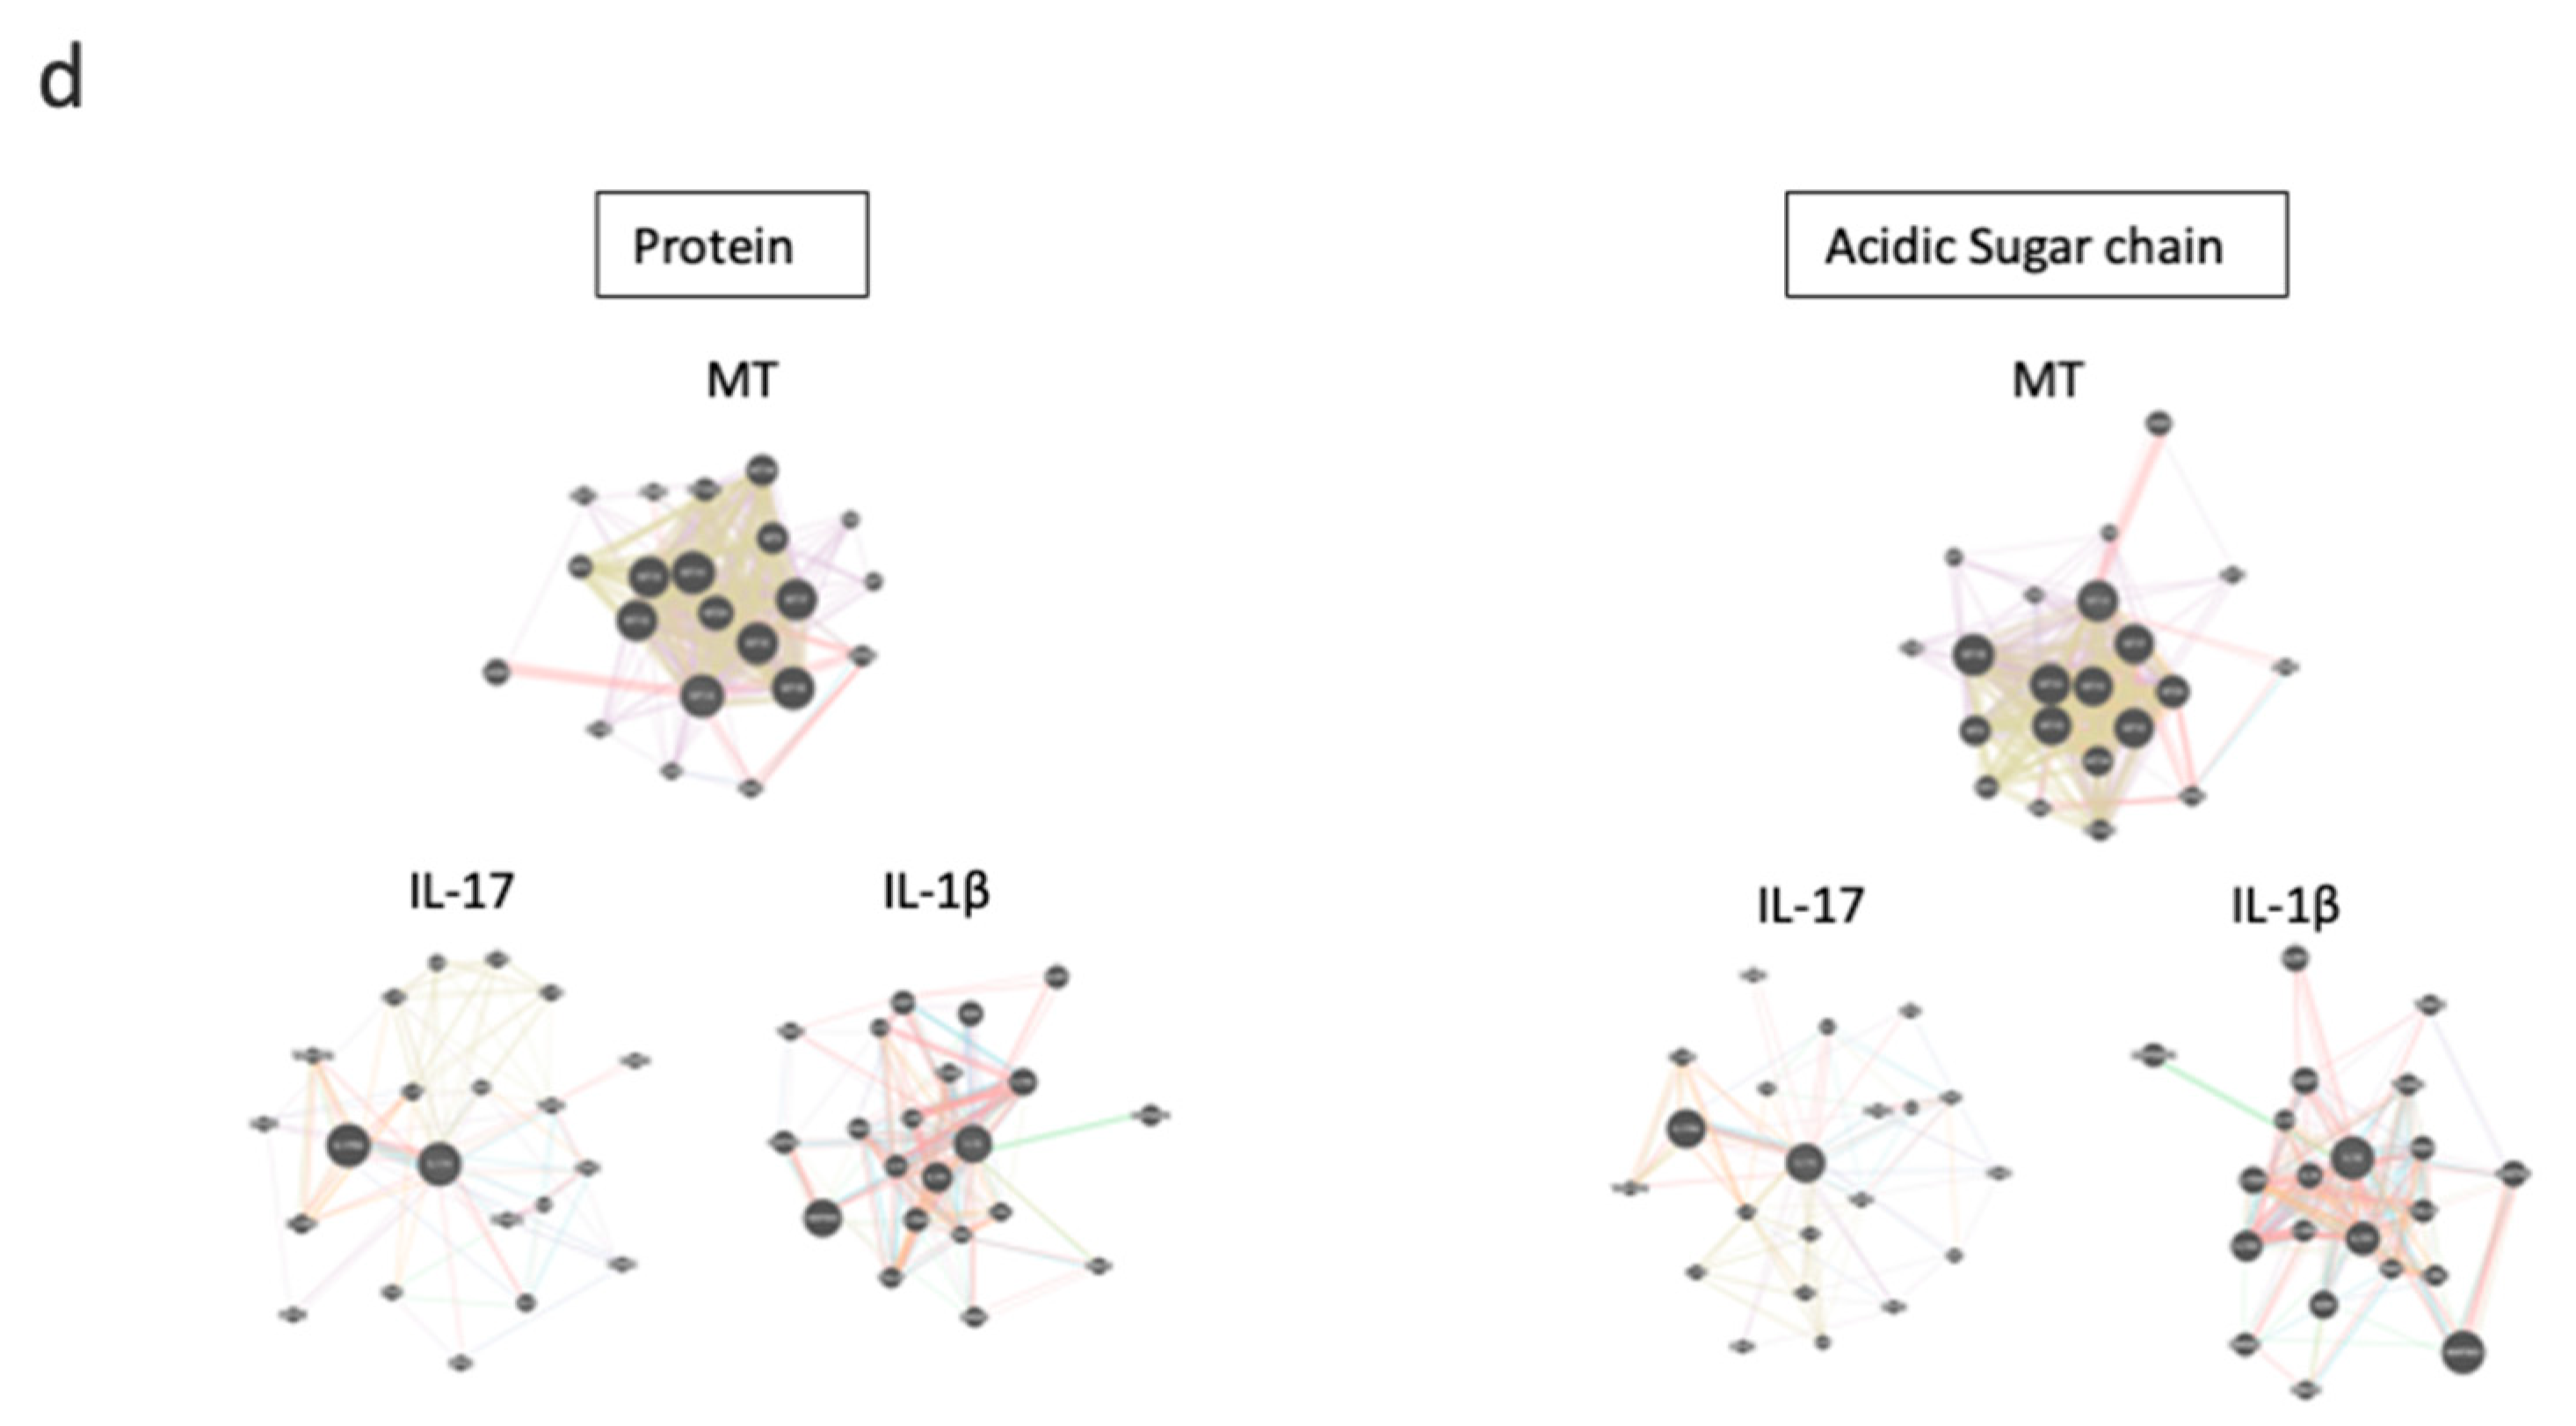
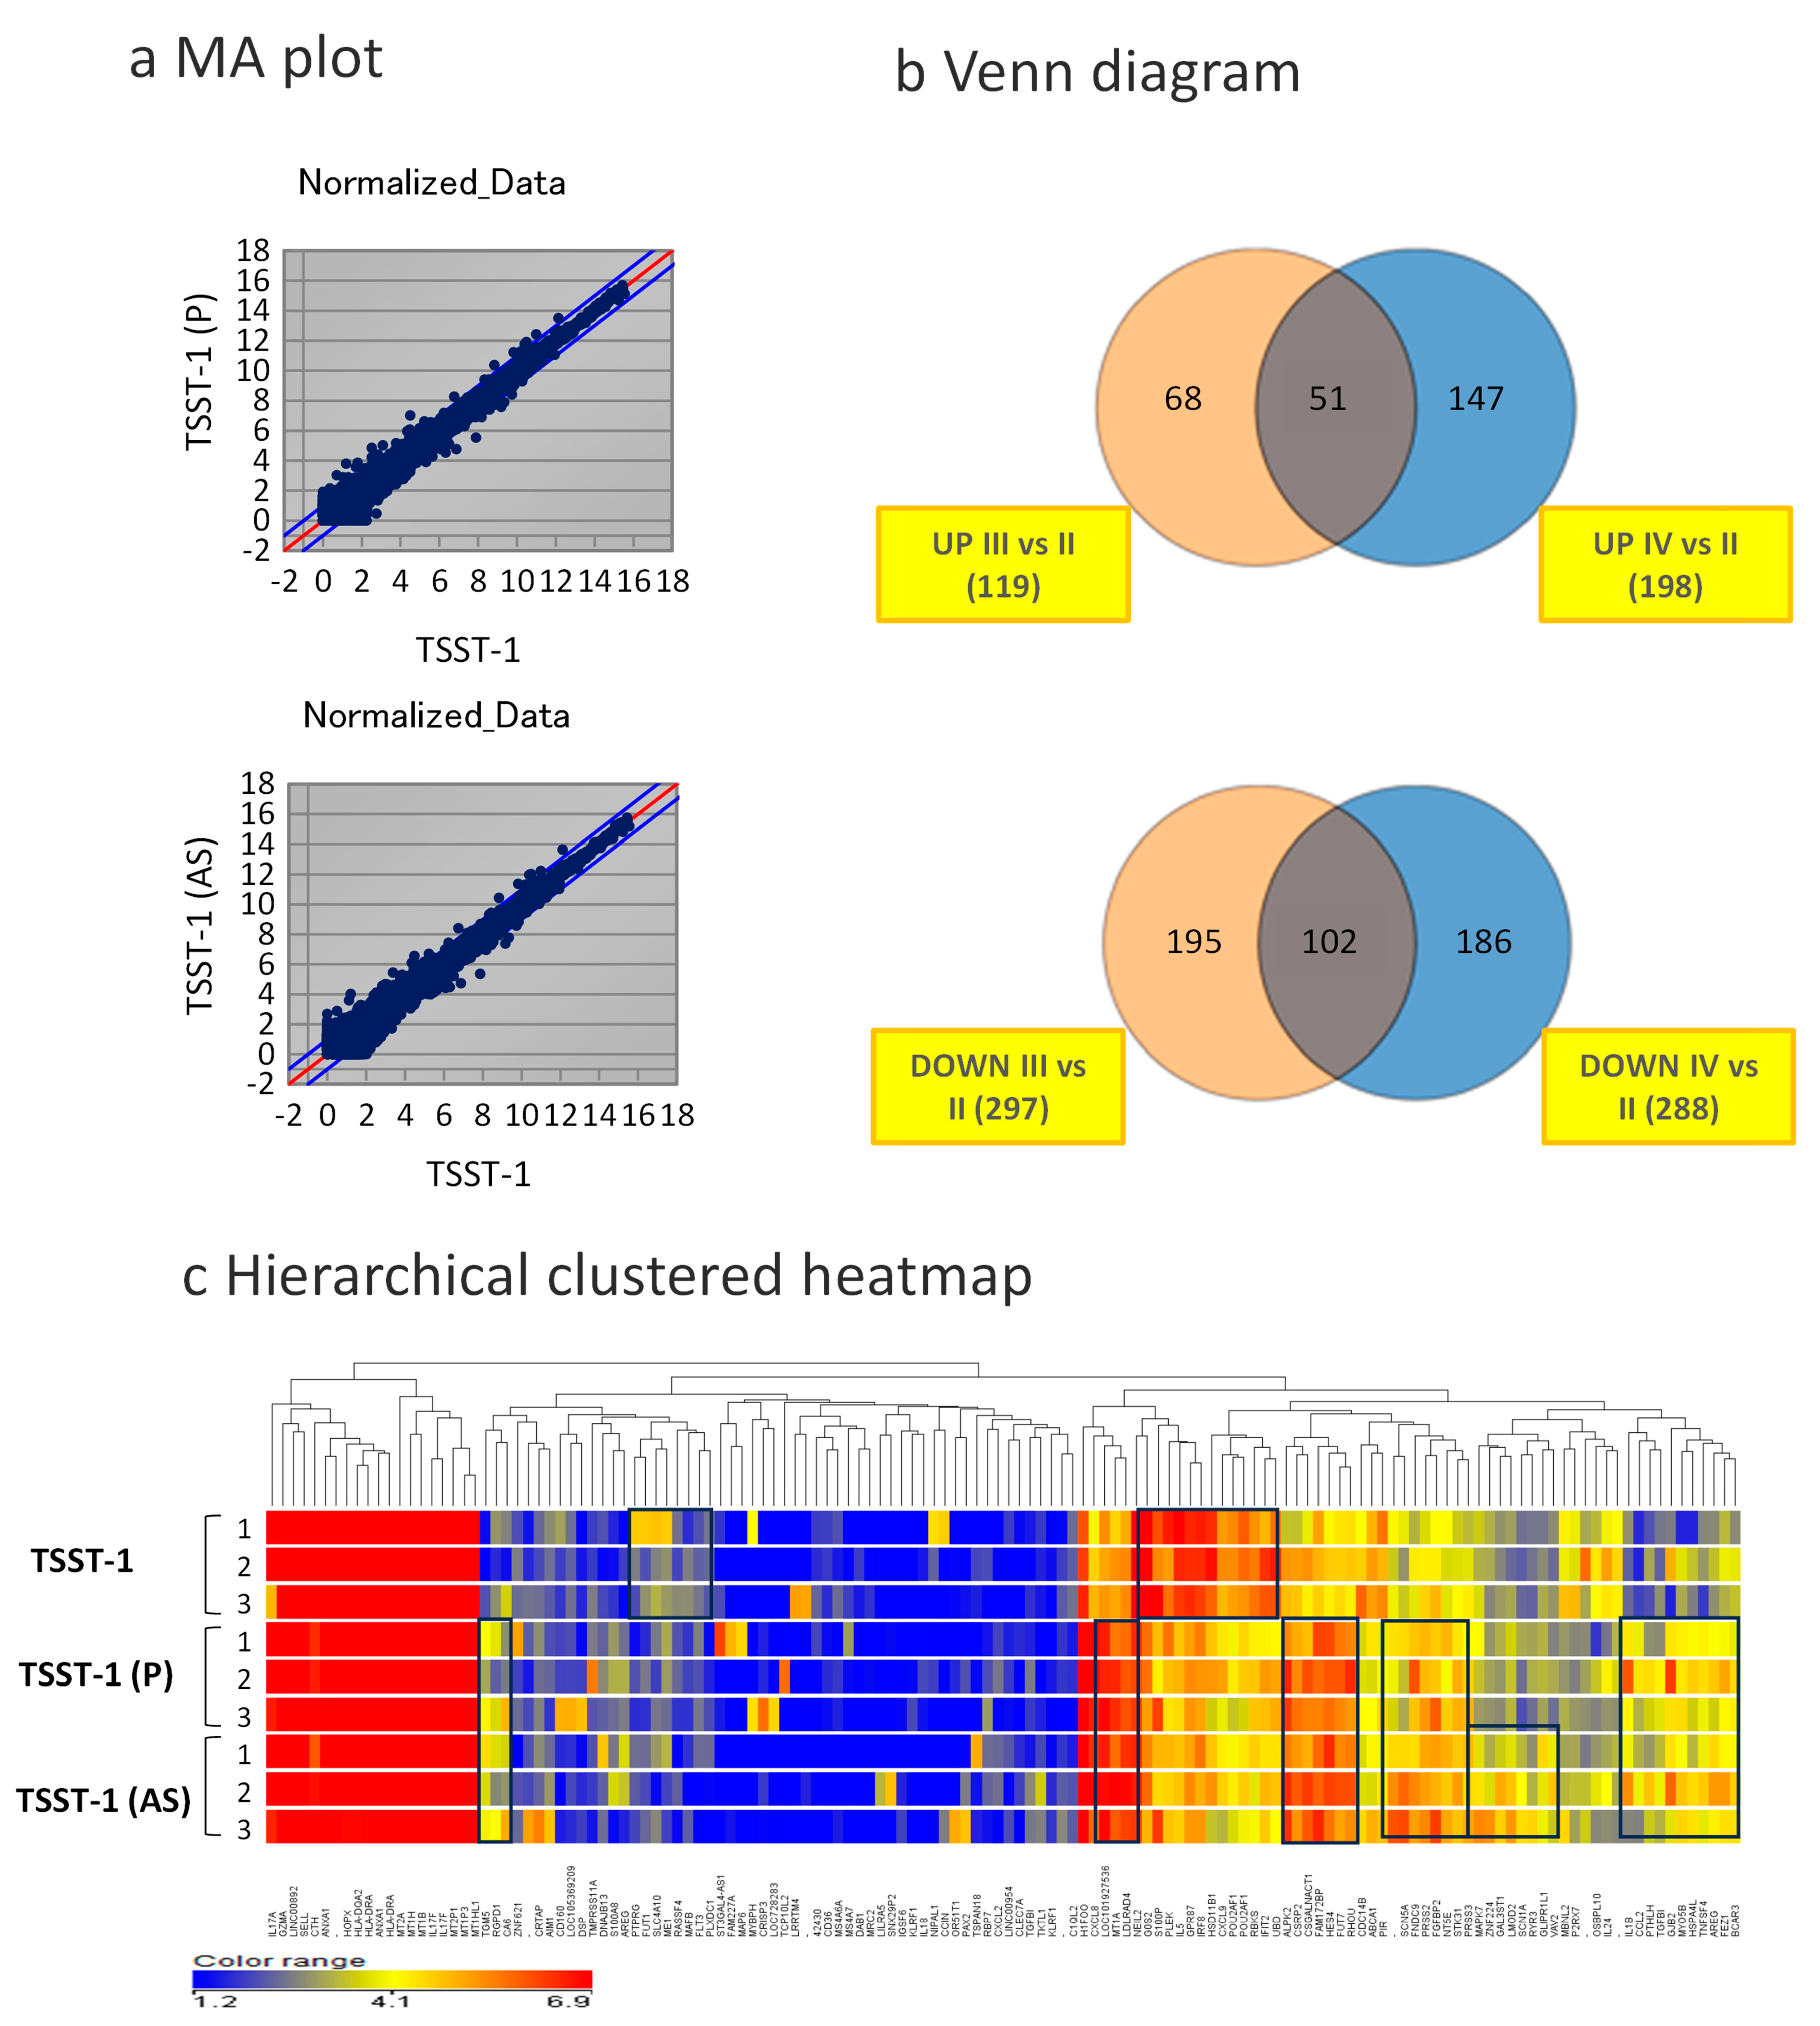
3.3. Changes in Global Gene Expression in the Presence of C-KJ Components
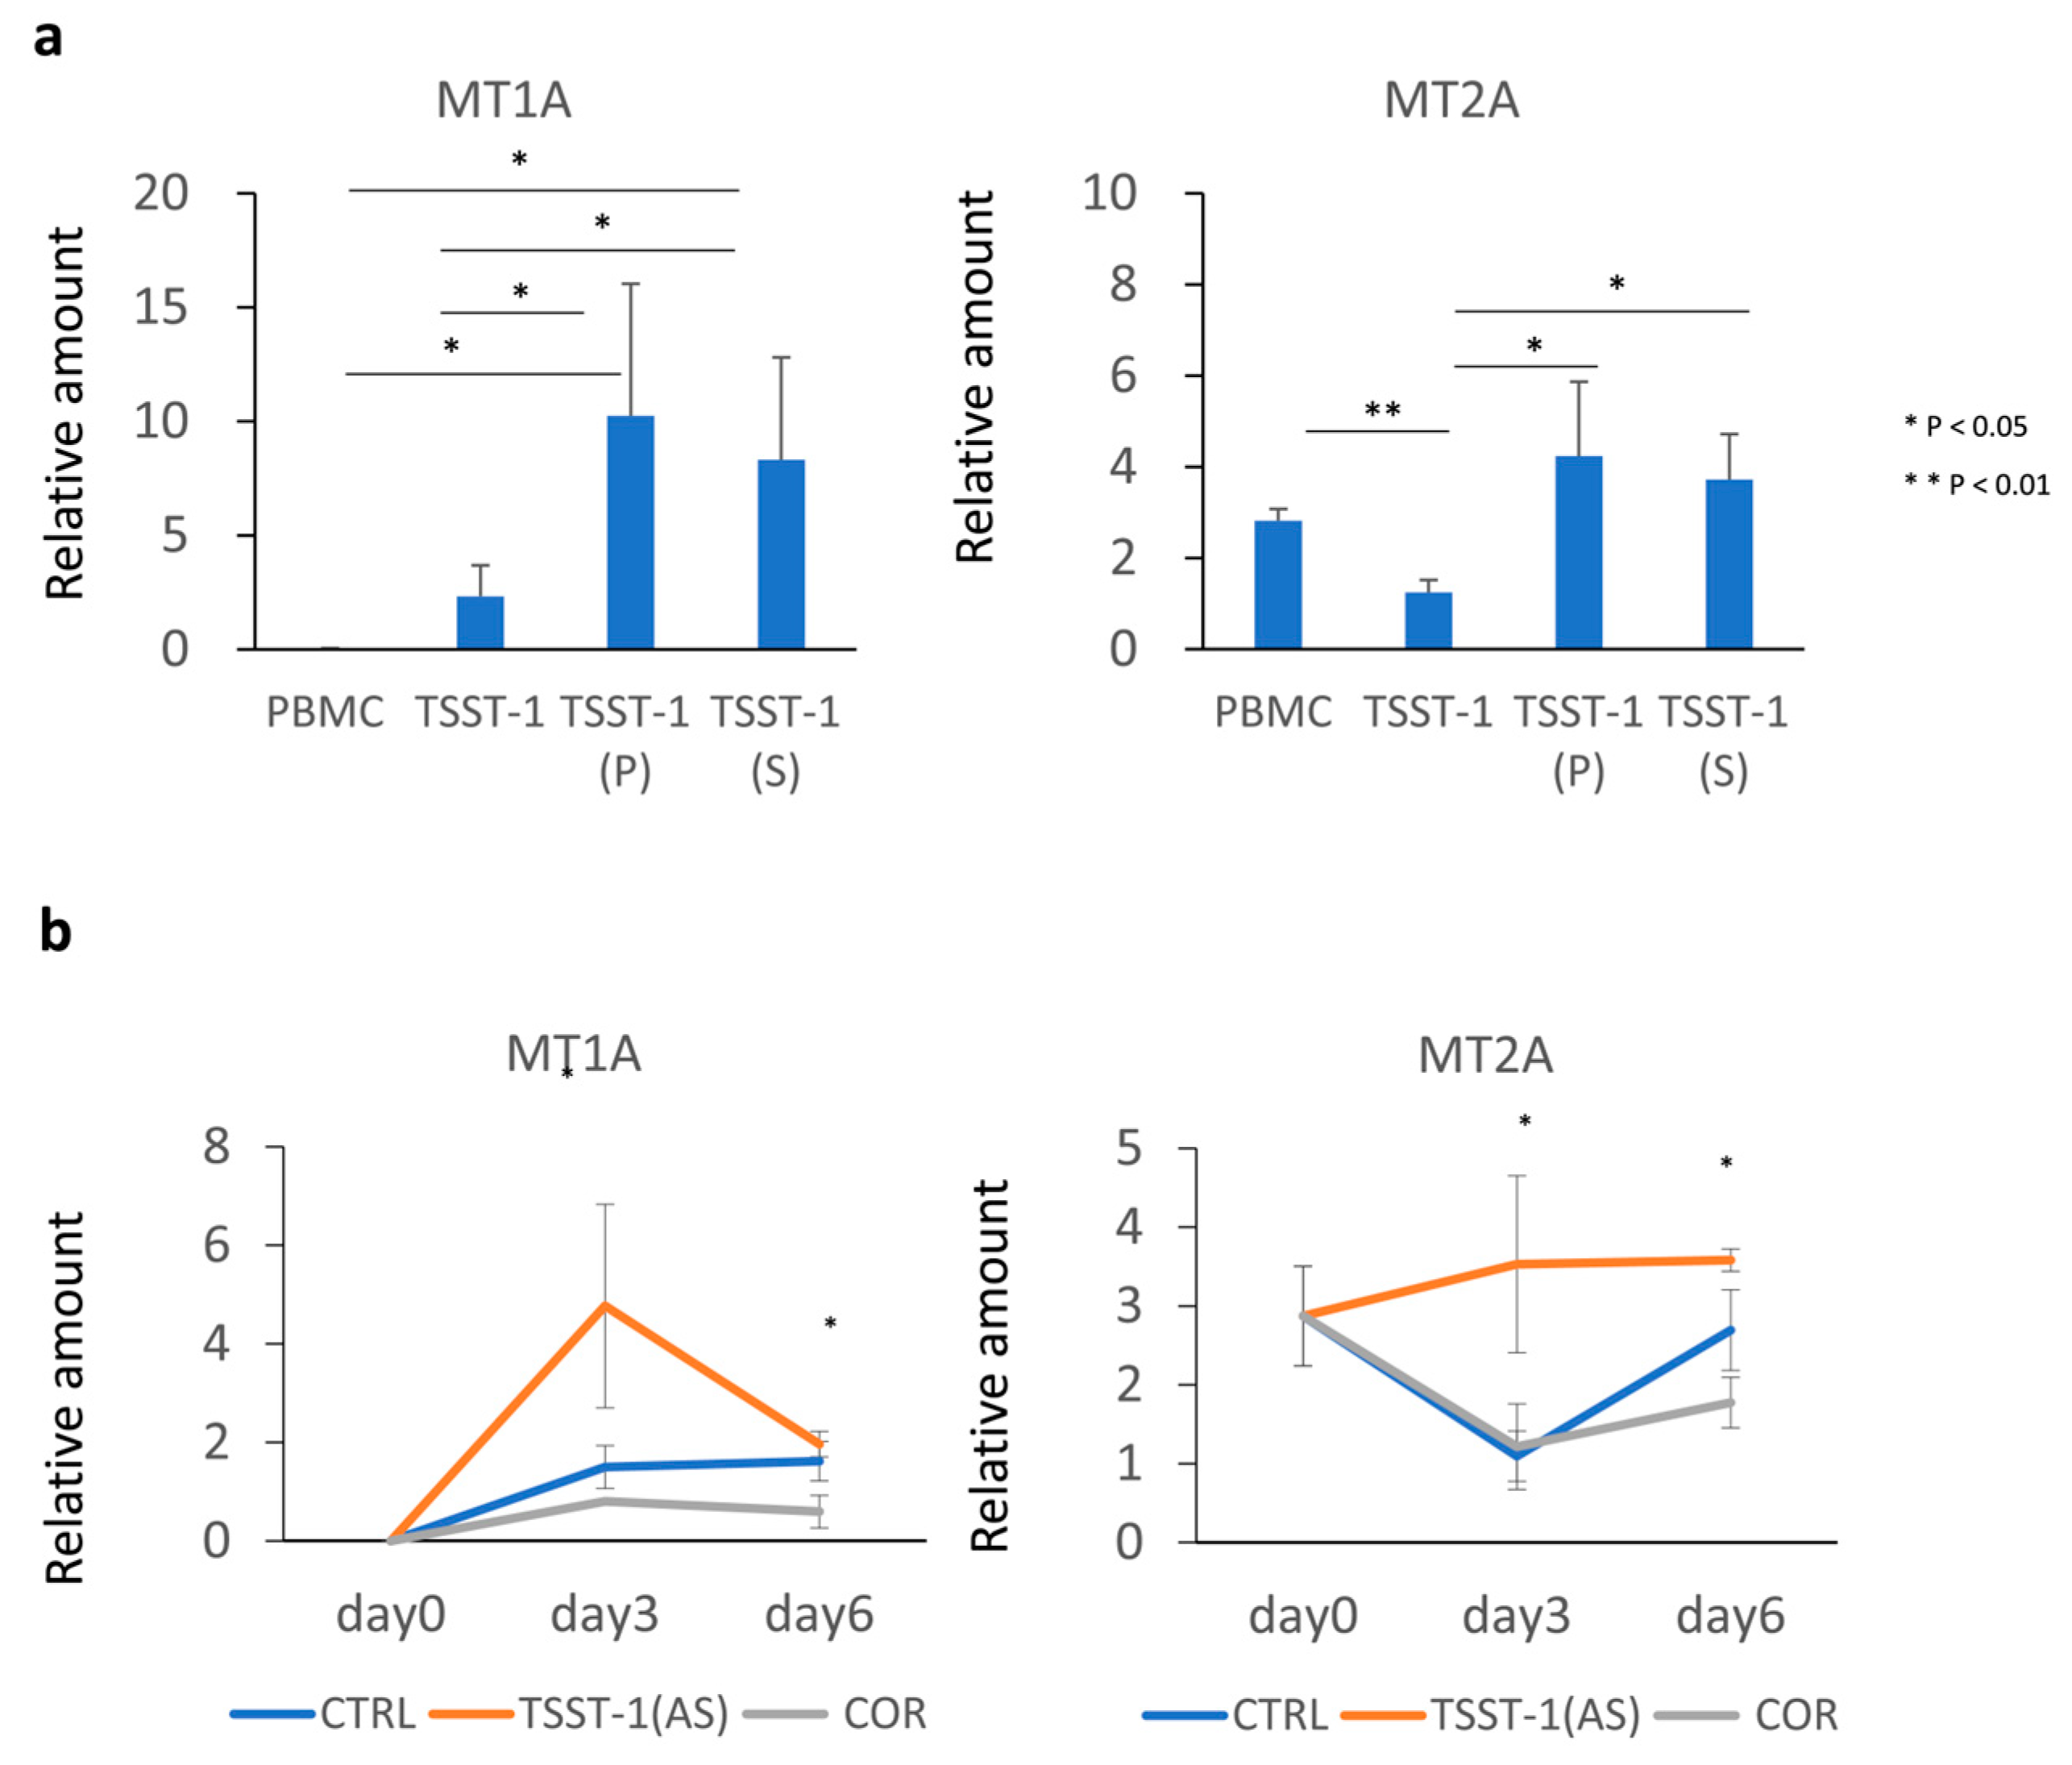
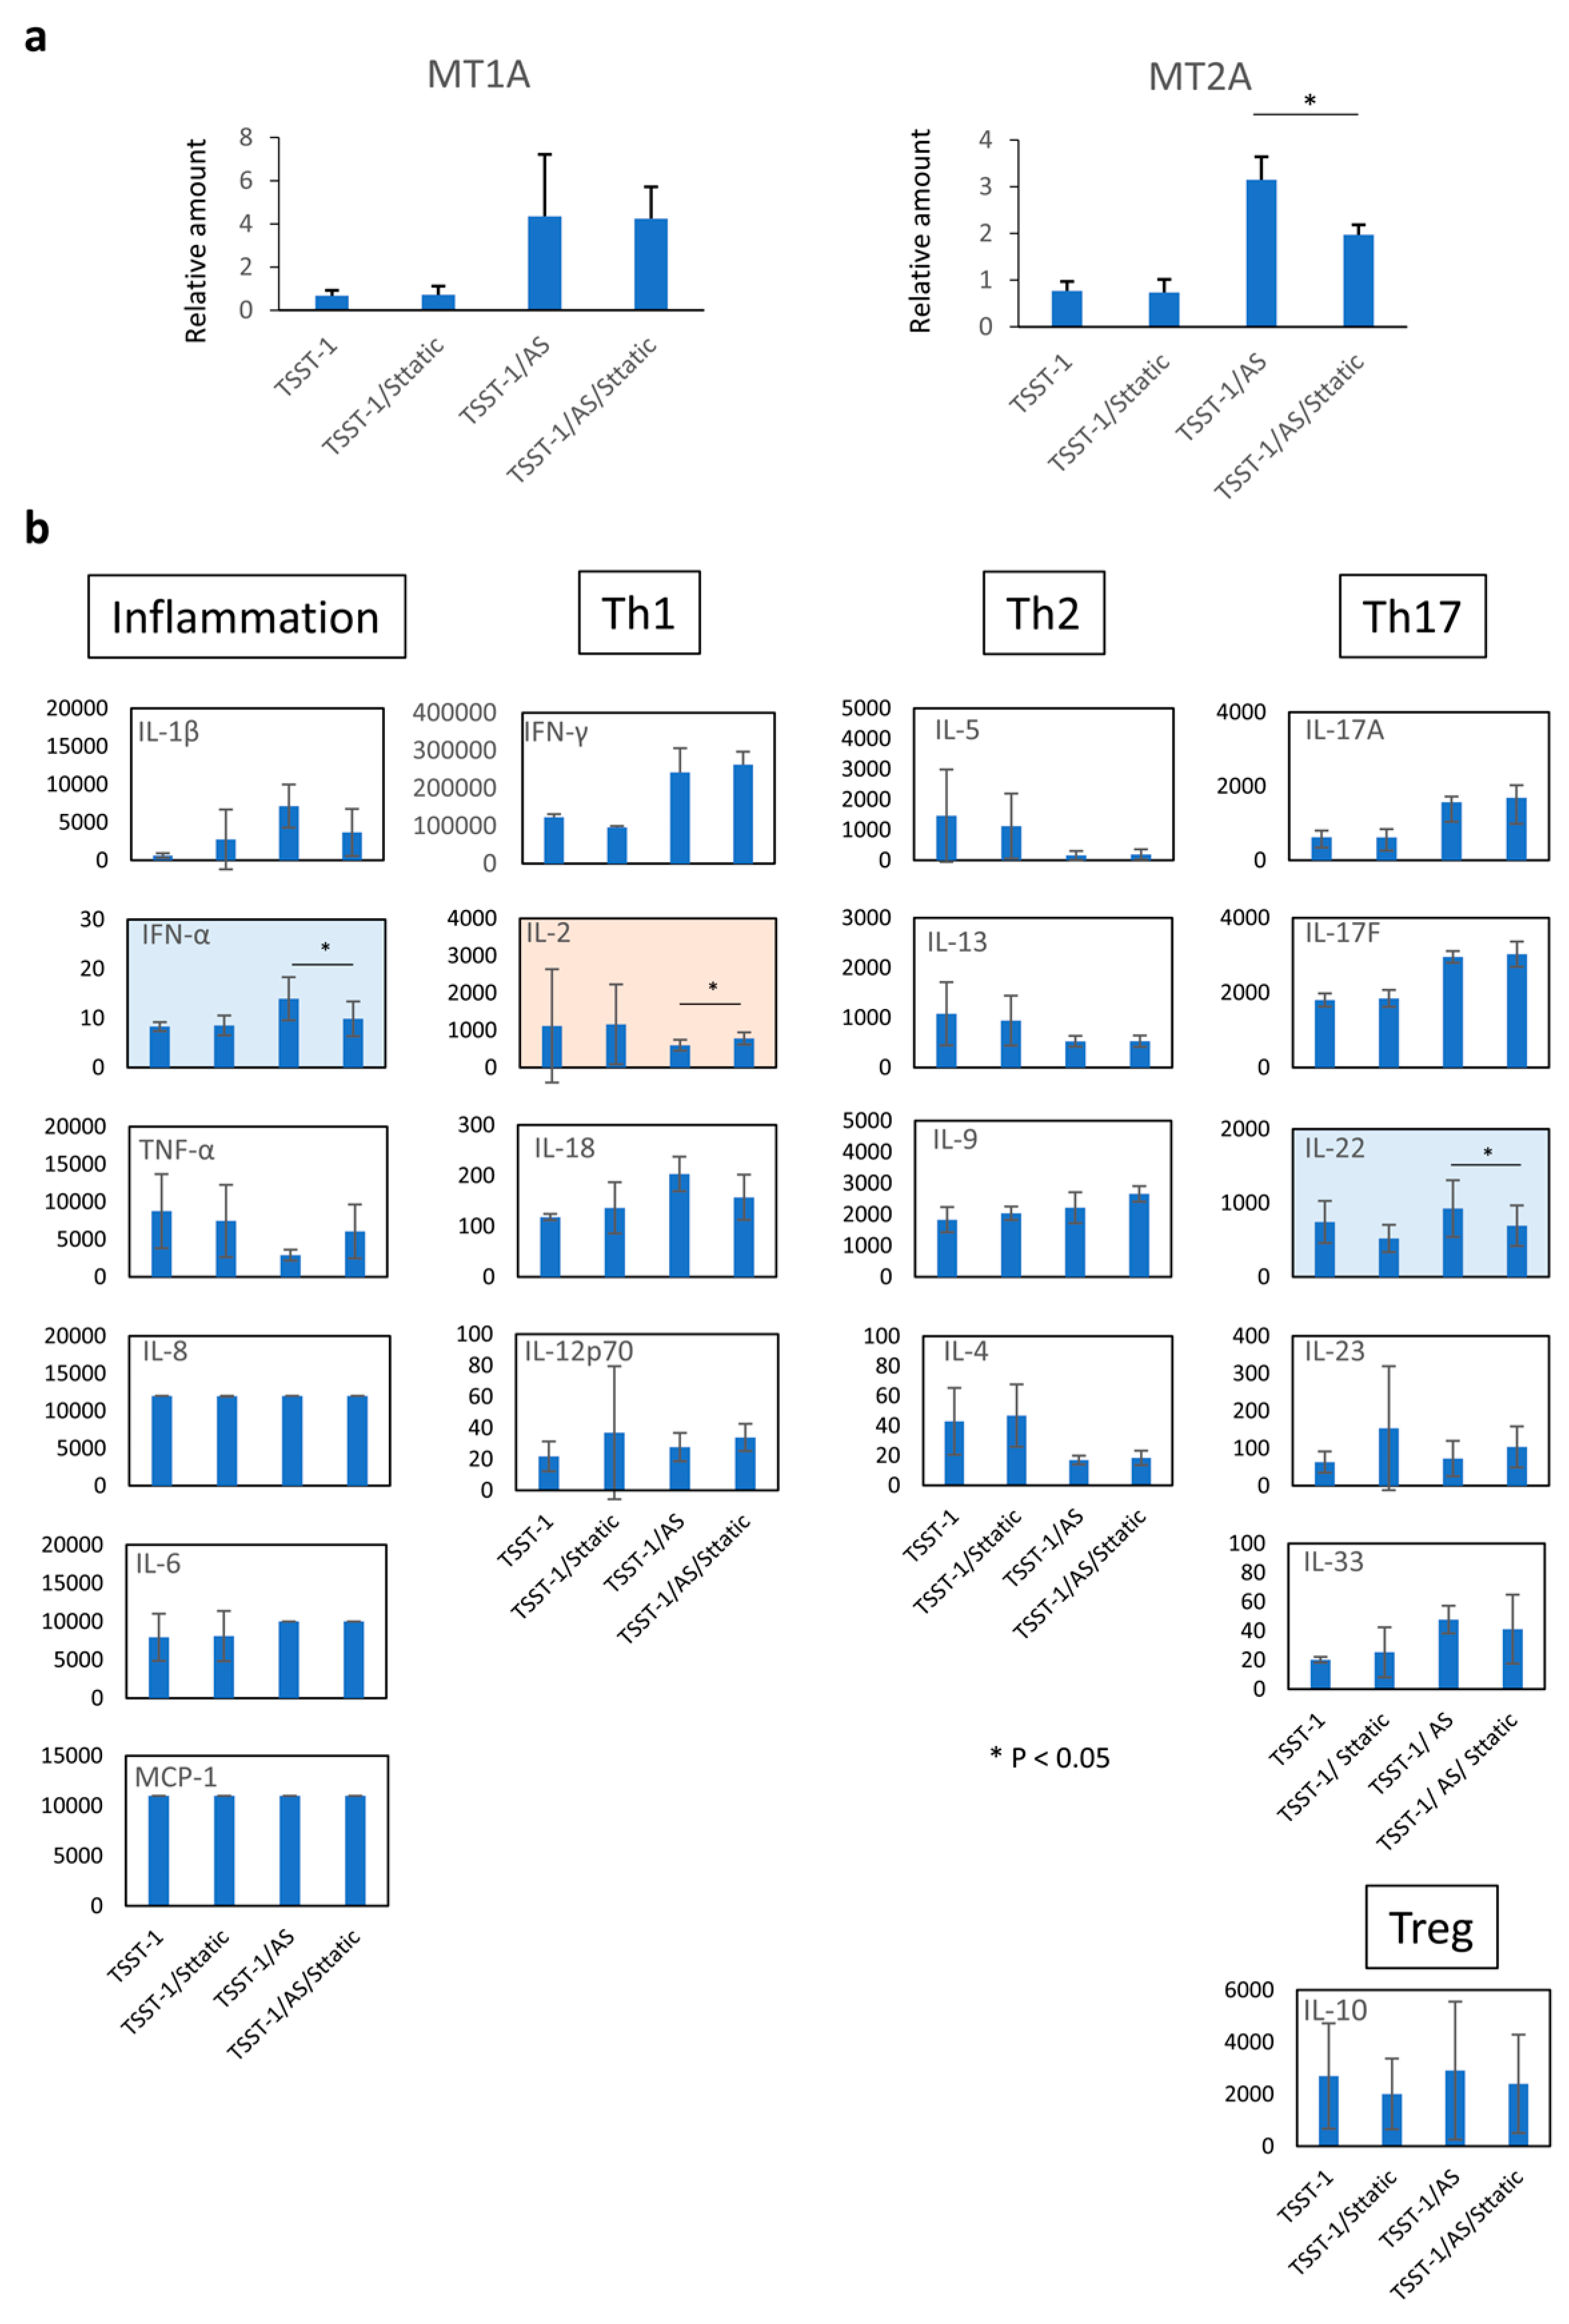
3.4. MTs Are Differentially Expressed upon T Cell Stimulation in the Presence of C-KJ Fractions
3.5. MT Expression Is Partially Controlled by STAT-3
4. Discussion
5. Conclusions
Supplementary Materials
Author Contributions
Funding
Data Availability Statement
Acknowledgments
Conflicts of Interest
References
- Hwang, J.; Yadav, D.; Lee, P.C.; Jin, J.O. Immunomodulatory effects of polysaccharides from marine algae for treating cancer, infectious disease, and inflammation. Phytother. Res. 2022, 36, 761–777. [Google Scholar] [CrossRef] [PubMed]
- Xia, D.; Qiu, W.; Wang, X.; Liu, J. Recent Advancements and Future Perspectives of Microalgae-Derived Pharmaceuticals. Mar. Drugs 2021, 19, 703. [Google Scholar] [CrossRef] [PubMed]
- Gao, C.; Wang, Y.; Shen, Y.; Yan, D.; He, X.; Dai, J.; Wu, Q. Oil accumulation mechanisms of the oleaginous microalga Chlorella protothecoides revealed through its genome, transcriptomes, and proteomes. BMC Genom. 2014, 15, 582. [Google Scholar] [CrossRef] [PubMed]
- Rivasseau, C.; Farhi, E.; Atteia, A.; Couté, A.; Gromova, M.; de Gouvion Saint Cyr, D.; Boisson, A.-M.; Féret, A.-S.; Compagnone, E.; Blignyabcd, R. An extremely radioresistant green eukaryote for radionuclide bio-decontamination in the nuclear industry. Energy Environ. Sci. 2013, 6, 1230–1239. [Google Scholar] [CrossRef]
- Hayashi, K.; Lee, J.B.; Atsumi, K.; Kanazashi, M.; Shibayama, T.; Okamoto, K.; Kawahara, T.; Hayashi, T. In vitro and in vivo anti-herpes simplex virus activity of monogalactosyl diacylglyceride from Coccomyxa sp. KJ (IPOD FERM BP-22254), a green microalga. PLoS ONE 2019, 14, e0219305. [Google Scholar] [CrossRef] [PubMed]
- Weyh, C.; Kruger, K.; Peeling, P.; Castell, L. The Role of Minerals in the Optimal Functioning of the Immune System. Nutrients 2022, 14, 644. [Google Scholar] [CrossRef] [PubMed]
- Guo, Q.; Shao, Q.; Xu, W.; Rui, L.; Sumi, R.; Eguchi, F.; Li, Z. Immunomodulatory and Anti-IBDV Activities of the Polysaccharide AEX from Coccomyxa gloeobotrydiformis. Mar. Drugs 2017, 15, 36. [Google Scholar] [CrossRef] [PubMed]
- Dai, B.; Wei, D.; Zheng, N.-N.; Chi, Z.-H.; Xin, N.; Ma, T.-X.; Zheng, L.-Y.; Sumi, R.; Sun, L. Coccomyxa Gloeobotrydiformis Polysaccharide Inhibits Lipopolysaccharide-Induced Inflammation in RAW 264.7 Macrophages. Cell Physiol. Biochem. 2018, 51, 2523–2535. [Google Scholar] [CrossRef] [PubMed]
- Saravia, J.; Chapman, N.M.; Chi, H. Helper T cell differentiation. Cell Mol. Immunol. 2019, 16, 634–643. [Google Scholar] [CrossRef]
- Takeda, K.; Akira, S. Toll-like receptors. Curr. Protoc. Immunol. 2015, 109, 335–376. [Google Scholar] [CrossRef]
- Maeda, K.; Caldez, M.J.; Akira, S. Innate immunity in allergy. Allergy 2019, 74, 1660–1674. [Google Scholar] [CrossRef]
- Kondo, T.; Imura, Y.; Chikuma, S.; Hibino, S.; Omata-Mise, S.; Ando, M.; Akanuma, T.; Iizuka, M.; Sakai, R.; Morita, R.; et al. Generation and application of human induced-stem cell memory T cells for adoptive immunotherapy. Cancer Sci. 2018, 109, 2130–2140. [Google Scholar] [CrossRef] [PubMed]
- Ohshima, S.; Komatsu, S.; Kashiwagi, H.; Goto, Y.; Ohno, Y.; Yamada, S.; Kanno, A.; Shimizu, T.; Seki, T.; Yasuda, A.; et al. Coccomyxa sp. KJ extract affects the fate of T cells stimulated by toxic shock syndrome toxin-1, a superantigen secreted by Staphylococcus aureus. Microbiol. Immunol. 2022, 66, 394–402. [Google Scholar] [CrossRef]
- Kanno, A.; Komatsu, S.; Miura, A.; Yamada, T.; Kuno, H. The Effect of Coccomyxa sp. KJ on Physical and Mental Conditions and Immune Function in Healthy Adults-A Placebo-controlled, Randomized, Double-blind Clinical Trial. Jpn. Pharmacol. Therapeut 2022, 50, 9. [Google Scholar]
- Reboldi, A.; Dang, E. Cholesterol metabolism in innate and adaptive response. F1000Res 2018, 7, F1000, Faculty Rev-1647. [Google Scholar] [CrossRef]
- Wang, H.; Wang, Z.; Zhang, Z.; Liu, J.; Hong, L. β-Sitosterol as a Promising Anticancer Agent for Chemoprevention and Chemotherapy: Mechanisms of Action and Future Prospects. Adv. Nutr. 2023, 14, 1085–1110. [Google Scholar] [CrossRef] [PubMed]
- Voshall, A.; Christie, N.T.M.; Rose, S.L.; Khasin, M.; Van Etten, J.L.; Markham, J.E.; Riekhof, W.R.; Nickerson, K.W. Sterol Biosynthesis in Four Green Algae: A Bioinformatic Analysis of the Ergosterol Versus Phytosterol Decision Point. J. Phycol. 2021, 57, 1199–1211. [Google Scholar] [CrossRef]
- Mocchegiani, E.; Romeo, J.; Malavolta, M.; Costarelli, L.; Giacconi, R.; Diaz, L.E.; Marcos, A. Zinc: Dietary intake and impact of supplementation on immune function in elderly. Age 2013, 35, 839–860. [Google Scholar] [CrossRef]
- Haase, H.; Rink, L. Functional significance of zinc-related signaling pathways in immune cells. Annu. Rev. Nutr. 2009, 29, 133–152. [Google Scholar] [CrossRef]
- Baarz, B.; Rink, L. Rebalancing the unbalanced aged immune system—A special focus on zinc. Aging Res. Rev. 2022, 74, 101541. [Google Scholar] [CrossRef]
- Harris, M.A.; Clark, J.; Ireland, A.; Lomax, J.; Ashburner, M.; Foulger, R.; Eilbeck, K.; Lewis, S.; Marshall, B.; Mungall, C.; et al. The Gene Ontology (GO) database and informatics resource. Nucleic Acids Res. 2004, 32, D258–D261. [Google Scholar] [CrossRef]
- Kanehisa, M.; Goto, S.; Hattori, M.; Aoki-Kinoshita, K.F.; Itoh, M.; Kawashima, S.; Katayama, T.; Araki, M.; Hirakawa, M. From genomics to chemical genomics: New developments in KEGG. Nucleic Acids Res. 2006, 34, D354–D357. [Google Scholar] [CrossRef] [PubMed]
- Sun, J.; Li, L.; Li, L.; Ding, L.; Liu, X.; Chen, X.; Zhang, J.; Qi, X.; Du, J.; Huang, Z. Metallothionein-1 suppresses rheumatoid arthritis pathogenesis by shifting the Th17/Treg balance. Eur. J. Immunol. 2018, 48, 1550–1562. [Google Scholar] [CrossRef]
- Eyerich, K.; Dimartino, V.; Cavani, A. IL-17 and IL-22 in immunity: Driving protection and pathology. Eur. J. Immunol. 2017, 47, 607–614. [Google Scholar] [CrossRef]
- Ku, C.S.; Pham, T.X.; Park, Y.; Kim, B.; Shin, M.S.; Kang, I.; Lee, J. Edible blue-green algae reduce the production of pro-inflammatory cytokines by inhibiting NF-kappaB pathway in macrophages and splenocytes. Biochim. Biophys. Acta 2013, 1830, 2981–2988. [Google Scholar] [CrossRef]
- Le Goff, M.; Le Ferrec, E.; Mayer, C.; Mimouni, V.; Lagadic-Gossmann, D.; Schoefs, B.; Ulmann, L. Microalgal carotenoids and phytosterols regulate biochemical mechanisms involved in human health and disease prevention. Biochimie 2019, 167, 106–118. [Google Scholar] [CrossRef] [PubMed]
- Ishiguro, S.; Roth, M.; Welti, R.; Loyd, M.; Thakkar, R.; Phillips, M.; Robben, N.; Upreti, D.; Nakashima, A.; Suzuki, K.; et al. A Water Extract from Chlorella sorokiniana Cell Walls Stimulates Growth of Bone Marrow Cells and Splenocytes. Nutrients 2022, 14, 2901. [Google Scholar] [CrossRef] [PubMed]
- George, M.M.; Subramanian Vignesh, K.; Landero Figueroa, J.A.; Caruso, J.A.; Deepe, G.S., Jr. Zinc Induces Dendritic Cell Tolerogenic Phenotype and Skews Regulatory T Cell-Th17 Balance. J. Immunol. 2016, 197, 1864–1876. [Google Scholar] [CrossRef]
- Sirvent, S.; Vallejo, A.F.; Corden, E.; Teo, Y.; Davies, J.; Clayton, K.; Seaby, E.G.; Lai, C.; Ennis, S.; Alyami, R.; et al. Impaired expression of metallothioneins contributes to allergen-induced inflammation in patients with atopic dermatitis. Nat. Commun. 2023, 14, 2880. [Google Scholar] [CrossRef]
- Chen, J.; Guan, L.; Tang, L.; Liu, S.; Zhou, Y.; Chen, C.; He, Z.; Xu, L. T Helper 9 Cells: A New Player in Immune-Related Diseases. DNA Cell Biol. 2019, 38, 1040–1047. [Google Scholar] [CrossRef]
- Mesas-Fernandez, A.; Bodner, E.; Hilke, F.J.; Meier, K.; Ghoreschi, K.; Solimani, F. Interleukin-21 in autoimmune and inflammatory skin diseases. Eur. J. Immunol. 2023, 53, e2250075. [Google Scholar] [CrossRef]
- Fan, X.; Shu, P.; Wang, Y.; Ji, N.; Zhang, D. Interactions between neutrophils and T-helper 17 cells. Front. Immunol. 2023, 14, 1279837. [Google Scholar] [CrossRef] [PubMed]
- Leonardo, T.; Farhi, E.; Boisson, A.; Vial, J.; Cloetens, P.; Bohic, S.; Rivasseau, C. Determination of elemental distribution in green micro-algae using synchrotron radiation nano X-ray fluorescence (SR-nXRF) and electron microscopy techniques—Subcellular localization and quantitative imaging of silver and cobalt uptake by Coccomyxa actinabiotis. Metallomics 2014, 6, 316–329. [Google Scholar]
- Dai, H.; Wang, L.; Li, L.; Huang, Z.; Ye, L. Metallothionein 1: A New Spotlight on Inflammatory Diseases. Front. Immunol. 2021, 12, 739918. [Google Scholar] [CrossRef]
- Rahman, M.T.; Karim, M.M. Metallothionein: A Potential Link in the Regulation of Zinc in Nutritional Immunity. Biol. Trace Elem. Res. 2018, 182, 1–13. [Google Scholar] [CrossRef]
- Subramanian Vignesh, K.; Deepe, G.S., Jr. Metallothioneins: Emerging Modulators in Immunity and Infection. Int. J. Mol. Sci. 2017, 18, 2197. [Google Scholar] [CrossRef]
- Sanz, R.L.; Ferraro, G.B.; Kacervosky, J.; Salesse, C.; Gowing, E.; Hua, L.; Rambaldi, I.; Beaubien, F.; Holmbeck, K.; Cloutier, J.F.; et al. MT3-MMP Promotes Excitatory Synapse Formation by Promoting Nogo-66 Receptor Ectodomain Shedding. J. Neurosci. 2018, 38, 518–529. [Google Scholar] [CrossRef] [PubMed]
- Chen, A.; Gao, G.; Lian, G.; Gong, J.; Luo, L.; Liu, J.; Chen, W.; Xu, C.; Wang, H.; Xie, L. Zinc promotes cell proliferation via regulating metal-regulatory transcription factor 1 expression and transcriptional activity in pulmonary arterial hypertension. Cell Cycle 2023, 22, 1284–1301. [Google Scholar] [CrossRef] [PubMed]
- Vignesh, K.; Deepe, G., Jr. Immunological orchestration of zinc homeostasis: The battle between host mechanisms and pathogen defenses. Arch. Biochem. Biophys. 2016, 611, 66–78. [Google Scholar] [CrossRef]
- Chen, B.; Yu, P.; Chan, W.N.; Xie, F.; Zhang, Y.; Liang, L.; Leung, K.T.; Lo, K.W.; Yu, J.; Tse, G.M.K.; et al. Cellular zinc metabolism and zinc signaling: From biological functions to diseases and therapeutic targets. Signal Transduct. Target. Ther. 2024, 9, 6. [Google Scholar] [CrossRef]
- Bao, B.; Prasad, A.S.; Beck, F.W.; Bao, G.W.; Singh, T.; Ali, S.; Sarkar, F.H. Intracellular free zinc up-regulates IFN-gamma and T-bet essential for Th1 differentiation in Con-A stimulated HUT-78 cells. Biochem. Biophys. Res. Commun. 2011, 407, 703–707. [Google Scholar] [CrossRef] [PubMed]
- Kitamura, H.; Morikawa, H.; Kamon, H.; Iguchi, M.; Hojyo, S.; Fukada, T.; Yamashita, S.; Kaisho, T.; Akira, S.; Murakami, M.; et al. Toll-like receptor-mediated regulation of zinc homeostasis influences dendritic cell function. Nat. Immunol. 2006, 7, 971–977. [Google Scholar] [CrossRef] [PubMed]
- Nishimura, N.; Reeve, V.E.; Nishimura, H.; Satoh, M.; Tohyama, C. Cutaneous metallothionein induction by ultraviolet B irradiation in interleukin-6 null mice. J. Investig. Dermatol. 2000, 114, 343–348. [Google Scholar] [CrossRef] [PubMed]
- Yin, X.; Knecht, D.A.; Lynes, M.A. Metallothionein mediates leukocyte chemotaxis. BMC Immunol. 2005, 6, 21. [Google Scholar] [CrossRef] [PubMed]
- Kitabayashi, C.; Fukada, T.; Kanamoto, M.; Ohashi, W.; Hojyo, S.; Atsumi, T.; Ueda, N.; Azuma, I.; Hirota, H.; Murakami, M.; et al. Zinc suppresses Th17 development via inhibition of STAT3 activation. Int. Immunol. 2010, 22, 375–386. [Google Scholar] [CrossRef] [PubMed]
- Bonaventura, P.; Lamboux, A.; Albarède, F.; Miossec, P. A Feedback Loop between Inflammation and Zn Uptake. PLoS ONE 2016, 11, e0147146. [Google Scholar] [CrossRef]
- Lundin, K.; Brinchmann, J.; Hansen, T. Interactions between staphylococcal superantigens and human T-cell clones are predominantly but not exclusively governed by their T-cell receptor V beta usage. Scand J. Immunol. 1994, 39, 387–394. [Google Scholar] [CrossRef]


Disclaimer/Publisher’s Note: The statements, opinions and data contained in all publications are solely those of the individual author(s) and contributor(s) and not of MDPI and/or the editor(s). MDPI and/or the editor(s) disclaim responsibility for any injury to people or property resulting from any ideas, methods, instructions or products referred to in the content. |
© 2024 by the authors. Licensee MDPI, Basel, Switzerland. This article is an open access article distributed under the terms and conditions of the Creative Commons Attribution (CC BY) license (https://creativecommons.org/licenses/by/4.0/).
Share and Cite
Seki, T.; Ohshima, S.; Komatsu, S.; Yamada, S.; Kashiwagi, H.; Goto, Y.; Tsuda, B.; Kanno, A.; Yasuda, A.; Kuno, H.; et al. Coccomyxa subellipsoidea KJ Components Enhance the Expression of Metallothioneins and Th17 Cytokines during Human T Cell Activation. Microorganisms 2024, 12, 741. https://doi.org/10.3390/microorganisms12040741
Seki T, Ohshima S, Komatsu S, Yamada S, Kashiwagi H, Goto Y, Tsuda B, Kanno A, Yasuda A, Kuno H, et al. Coccomyxa subellipsoidea KJ Components Enhance the Expression of Metallothioneins and Th17 Cytokines during Human T Cell Activation. Microorganisms. 2024; 12(4):741. https://doi.org/10.3390/microorganisms12040741
Chicago/Turabian StyleSeki, Toshiro, Shino Ohshima, Satoko Komatsu, Soga Yamada, Hirofumi Kashiwagi, Yumiko Goto, Banri Tsuda, Akiko Kanno, Atsushi Yasuda, Hitoshi Kuno, and et al. 2024. "Coccomyxa subellipsoidea KJ Components Enhance the Expression of Metallothioneins and Th17 Cytokines during Human T Cell Activation" Microorganisms 12, no. 4: 741. https://doi.org/10.3390/microorganisms12040741