Communication

Biogenic Phosphonate Utilization by Globally Distributed Diatom Thalassiosira pseudonana

1
State Key Laboratory of Marine Environmental Science, Xiamen University, Xiamen 361005, China
2
College of the Environment and Ecology, Xiamen University, Xiamen 361005, China
3
College of Ocean and Earth Sciences, Xiamen University, Xiamen 361005, China
4
College of Life Sciences, Jiangxi Normal University, Nanchang 330022, China
*
Author to whom correspondence should be addressed.
Microorganisms 2024, 12(4), 761; https://doi.org/10.3390/microorganisms12040761
Submission received: 28 February 2024 / Revised: 29 March 2024 / Accepted: 5 April 2024 / Published: 10 April 2024
(This article belongs to the Special Issue State-of-the-Art Environmental Microbiology in China (2023–2024))

Abstract

:
Phosphonates are a class of organic phosphorus (P) compounds that contribute ~25% of dissolved organic P. Recent studies reveal the important role of phosphonates mediated by prokaryotes in the marine P redox cycle. However, its bioavailability by eukaryotic phytoplankton is under debate. 2-Aminoethylphosphonic acid (2-AEP) and 2-amino-3-phosphonopropionic acid (2-AP3) are two biogenic phosphonates in the marine environment. Here, Thalassiosira pseudonana, a common diatom species in the ocean, is able to recover growth from P starvation when provided with 2-AEP and 2-AP3. Moreover, 2-AEP cultures exhibited a more similar growth rate at 12 °C than at 25 °C when compared with inorganic P cultures. The cellular stoichiometry of 2-AEP groups was further determined, the values of which are in-between the P-depleted and DIP-replete cultures. This study provides evidence that biogenic phosphonates could be adopted as alternative P sources to support diatom growth and may provide physiological adaptation.

1. Introduction

Phosphorus (P) is an essential nutrient for the growth of living organisms. Dissolved inorganic P (DIP), the preferred form of P used by phytoplankton, is often a limiting nutrient for phytoplankton in marine environments [1,2,3]. Thus, dissolved organic P (DOP) has emerged as a prominent alternative P source [4,5].
Phosphonates are a class of organic P with a chemically stable C-P bond. Besides synthetic compounds (e.g., herbicide glyphosate), biogenic phosphonates produced by various organisms are present in the ocean [6,7]. Two biogenic phosphonate compounds, 2-aminoethylphosphonate (2-AEP) and its derivative, 2-amino-3-phosphonopropionic acid (2-AP3), are the composition of membrane phospholipids in many organisms, such as prokaryotes and mollusks [8,9]. A recent study shows that Prochlorococcus likely allocates over 40% of cellular P towards phosphonate production in the ocean [10]. Genome surveys suggest that de novo synthesis of 2-AEP is performed in corals [11]. Therefore, exploring the bioavailability of biogenic phosphonates by phytoplankton has considerable importance.
Compared with the well-elucidated metabolism of phosphonates in prokaryotes [12,13,14], discrepancies were found in a few studies of eukaryotic phytoplankton [15,16]. Picoprasinophyte Micromonas commode and coccolithophore Emiliania huxleyi are able to utilize 2-AEP, whereas diatom Phaeodactylum tricornutum failed [17]. However, our recent study showed that P-starvation-treated P. tricornutum can recover growth with a 2-AEP supplement, and the utilization is mediated by endocytosis and integration into membrane phospholipids (DAG-2-AEP, diacylglyceryl-2-AEP) [16]. Furthermore, an in silico analysis of the global meta-omic atlas suggests that the associated utilization functional genes are prevalent in diatom assemblages and actively expressed in the cold regions [16].
On these grounds, a hypothesis that the cosmopolitan diatom Thalassiosira pseudonana [18,19,20] is able to utilize biogenic phosphonates and the metabolic activity is temperature-sensitive is proposed. Here, the bioavailability of 2-AEP and 2-AP3, which share similar chemical structures and are components of membrane phospholipids, was investigated [8,9]. Then, the physiological responses of algae grown with phosphonate supplements were examined at different temperatures.

2. Materials and Methods

2.1. Cell Culture and Experiment Setup

T. pseudonana was provided by the Center for Collections of Marine Bacteria and Phytoplankton of Xiamen University, China. Two batch experiments were conducted to (batch 1) examine the bioavailability of 2-AEP and 2-AP3 (Sigma-Aldrich, St. Louis, MO, USA) and (batch 2) explore the physiological response under the conditions of significant temperature differences (Table 1). As documented in other studies, 12 °C and 25 °C (comparable to those of 20 °C) represent the temperatures with the lowest growth rate and the highest growth rate, respectively [21]. Before the experiments, seed cultures were subject to P starvation for 8~10 days until the ambient phosphate concentration was below ~0.3 μM and the cell growth ceased. Antibiotics were applied to inhibit the growth of bacteria (Table 1).

2.2. Determination of Cell Density and Fv/Fm

Cell density was measured daily by using a CytoFLEX flow cytometer (Beckman Coulter, Brea, CA, USA) and estimated by gating areas in the chlorophyll A versus SSC-A dot plot generated from a 1 mL cell sample. Fv/Fm was determined using a FIRe Fluorometer System (Satlantic, Halifax, NS, Canada). Prior to the measurement, 1 mL of the cell sample was subject to dark adaption for 20 min and then processed following the manufacturer’s protocol [22].

2.3. Cellular C and N Content

Cells were collected using pretreated GF/F membranes. The collected cells were dried at 60 °C for 8 h. Then, 500 μL of 1% HCl was dripped onto the filters, and the filters were dried at 60 °C for 12 h again. After the cells were pretreated [16], the cellular C and N contents were determined using a Vario EL cube analyzer (Elementar Analysensysteme GmbH, Langenselbold, Germany) in accordance with the reported method [23].

2.4. Determination of DIP and P Content

Cells were filtered onto GF/F membranes and resuspended in 25 mL of distilled water. The suspension was digested by adding 4 mL of 50 g/L potassium persulfate and autoclaving at 121 °C for 30 min [24]. Then, the cellular P content of the digested suspension and the DIP concentration of the filtrate were determined using the molybdenum method [24].

2.5. Statistical Analysis

Differences among different P and temperature treatment groups were measured with t-tests.

3. Results and Discussion

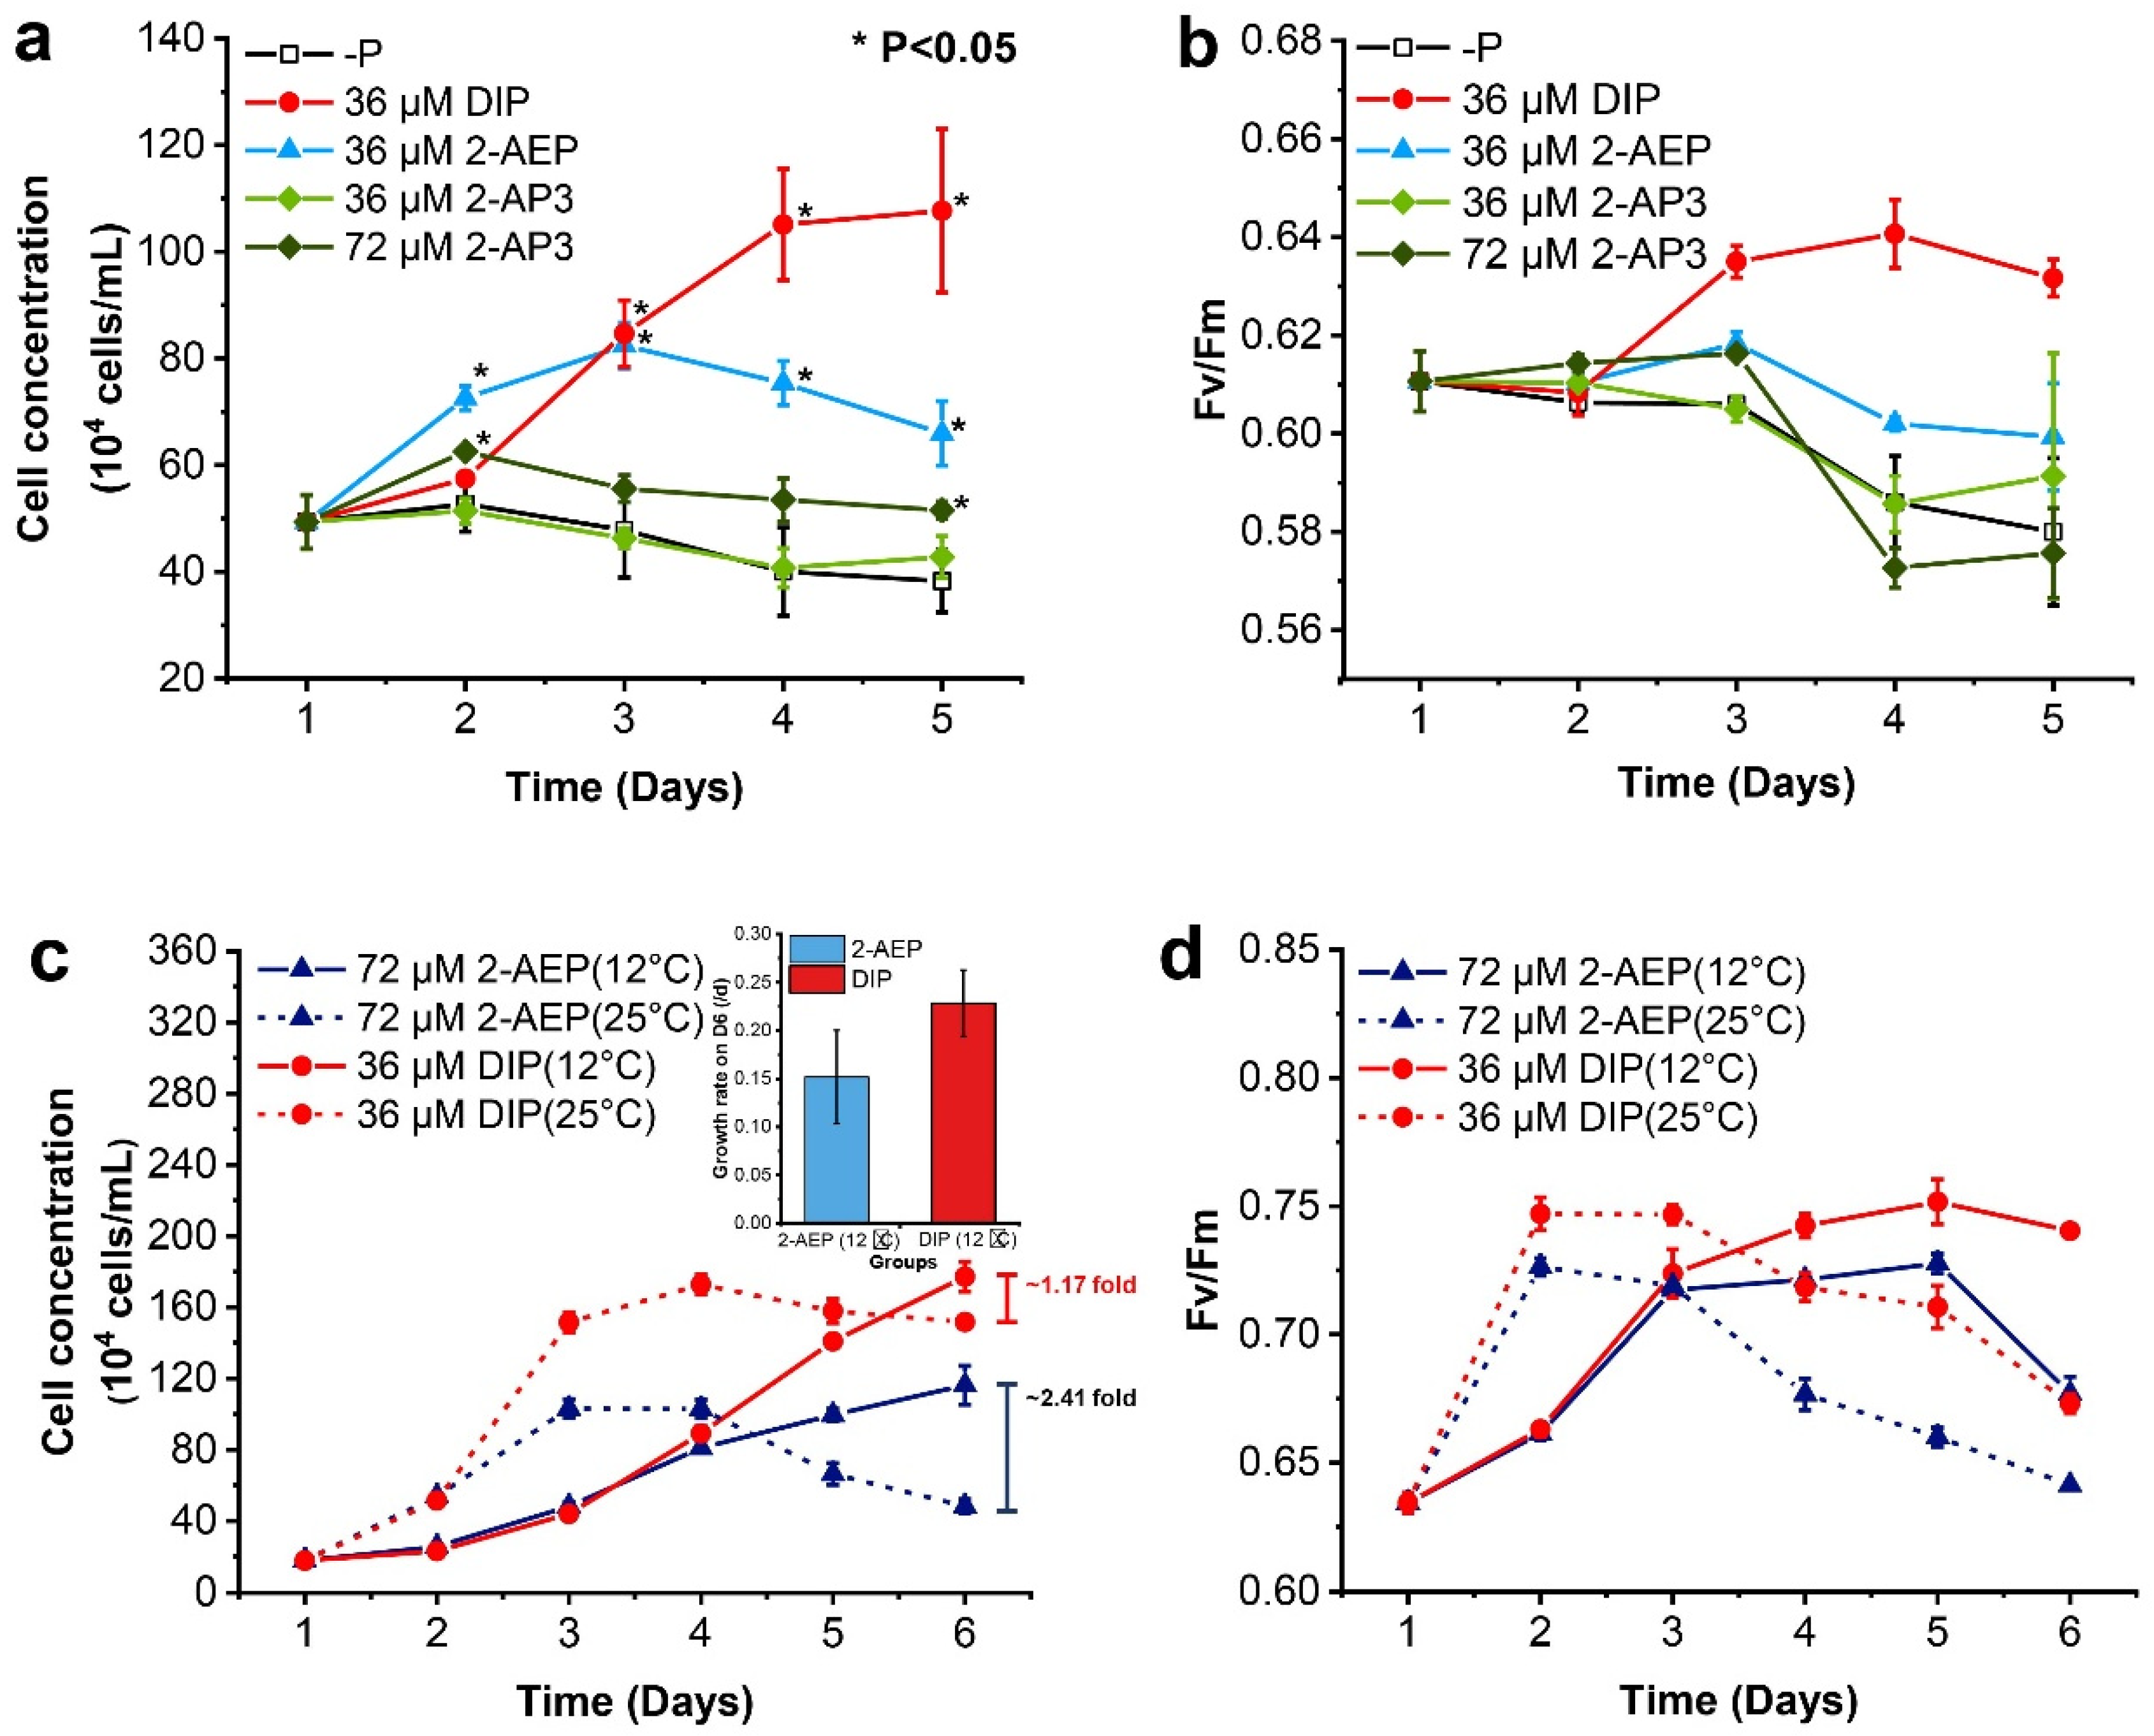
3.1. Differential Growth-Promoting Effects between 2-AEP and 2-AP3

Different growth-promoting effects were observed in the batch 1 culture. After P starvation, T. pseudonana was able to recover growth significantly in the medium supplied with 2-AEP (36 μM) and 2-AP3 (72 μM), respectively (p < 0.05), while failing to grow in the 2-AP3 supplement (36 μM, Figure 1a). The cells in the 2-AEP (36 μM) group continued growth and peaked at the maximum cell concentration of 8.24 × 10⁵ cells mL−1 at Day 3, then declined gradually, and Fv/Fm exhibited a similar pattern accordingly (Figure 1a,b). In comparison, we observe mild growth promotion in the 2-AP3 group. After the supplement of 72 μM 2-AP3, instant cell growth was recovered in 24 h, showing a growth rate of 0.24 μ d−1, which is about half of that in the 2-AEP (36 μM) group (Figure 1a). After then, cells ceased growth and declined towards the end of this experiment, accompanied by an abrupt decline in Fv/Fm (Figure 1b). Maximum cell density observed on D2 was 6.26 × 10⁵ cells mL−1, about half of that in the 2-AEP (36 μM) group.
DIP was barely detected (lower than the detection limit; ~0.3 mM) in the 2-AEP and 2-AP3 groups, demonstrating that 2-AEP and 2-AP3 can be utilized as an alternative P source by T. pseudonana. Though provided in the same or higher concentration, lower cell density acquired in both phosphonate groups suggests limited utilization efficiency compared with DIP, which is common according to previous reports [15,17]. Furthermore, lower Fv/Fm indicates repressed photosynthesis, suggesting that T. pseudonana cells were under P stress in both phosphonate groups.
2-AP3 is the derivative of 2-AEP, known as a component of phospholipids in cell membranes. Studies have demonstrated that 2-AEP and its derivatives can be incorporated into phospholipids in cell membranes [25,26,27]. 2-AP3 can be decomposed via a transamination reaction and decarboxylation to 2-AEP in Tetrahymena [28]. Given the limited utilization of 2-AP3 observed in the present study, the other possible metabolic pathways cannot be completely excluded. The underlying mechanism of 2-AP3 utilization by T. pseudonana and its potential bioavailability need to be further investigated to address the knowledge gap in eukaryotic phytoplankton.

3.2. Different Growth Strategies under Variable P Nutrients and Temperatures

A recent study of the global ocean gene atlas shows an enriched distribution of representative genes of the proposed 2-AEP utilization mechanism by diatoms in low-temperature waters [16]. Therefore, the batch 2 experiment was conducted to further explore the cellular physiological response grown with different P nutrients and temperatures, in which 72 μM of 2-AEP was provided to obtain more significant differences for the comparative analysis.
Different growth patterns that are temperature-dependent were observed (Figure 1c,d). T. pseudonana cells exhibited sustained growth at 12 °C with higher cell density, and a short-time rapid growth at 25 °C with lower cell density regardless of P condition. At 12 °C, the cell density almost showed no change during the first 24 h and then increased steadily in the 2-AEP and DIP groups until D6, sharing no difference in the first 4 days (Figure 1c). When cultured at 25 °C, the cell density exhibited a rapid growth in the first 48 h and then entered the stationary phase after D4 in the DIP group. The cells ceased growth after D3 in the 2-AEP group and then decreased significantly. Consistently, the growth rate of T. pseudonana is higher under 8 °C~17 °C than that under 17 °C~25 °C with sufficient DIP supply [29].
A significant difference was found in the promotion effect under different P conditions (Figure 1c). In the DIP-replete groups, the final cell concentration at 12 °C was slightly higher than at 25 °C. Meanwhile, in the 2-AEP groups, the final cell concentration in the 12 °C culture was about three times higher than that in the 25 °C culture. When cultured at 12 °C, the highest growth rate on D6 in the 2-AEP group was 0.152 ± 0.049 μ d−1, which is 66.4% of that in the DIP-replete group (0.228 ± 0.034 μ d−1, Figure 1c).
Variations of Fv/Fm showed a comparable pattern in accordance with the growth curve (Figure 1d). The dramatic increase in Fv/Fm values in the first 24 h indicated that instant recovery of photosynthetic capacity accounts for the rapid growth in both cultures under 25 °C. After day 3, the Fv/Fm values declined continuously along with the cells entering the stationary phase in 25 °C cultures. In contrast, the Fv/Fm values increased steadily to meet sustained cell growth under 12 °C, and they were higher in the DIP-replete group than in the 2-AEP group.
These results showed that T. pseudonana cells cultured with 2-AEP exhibited better physiological adaptability under lower temperatures, resulting in significantly increased cell density. Meanwhile, the Fv/Fm value represents a good consensus of higher photosynthetic capacity and a higher growth rate.

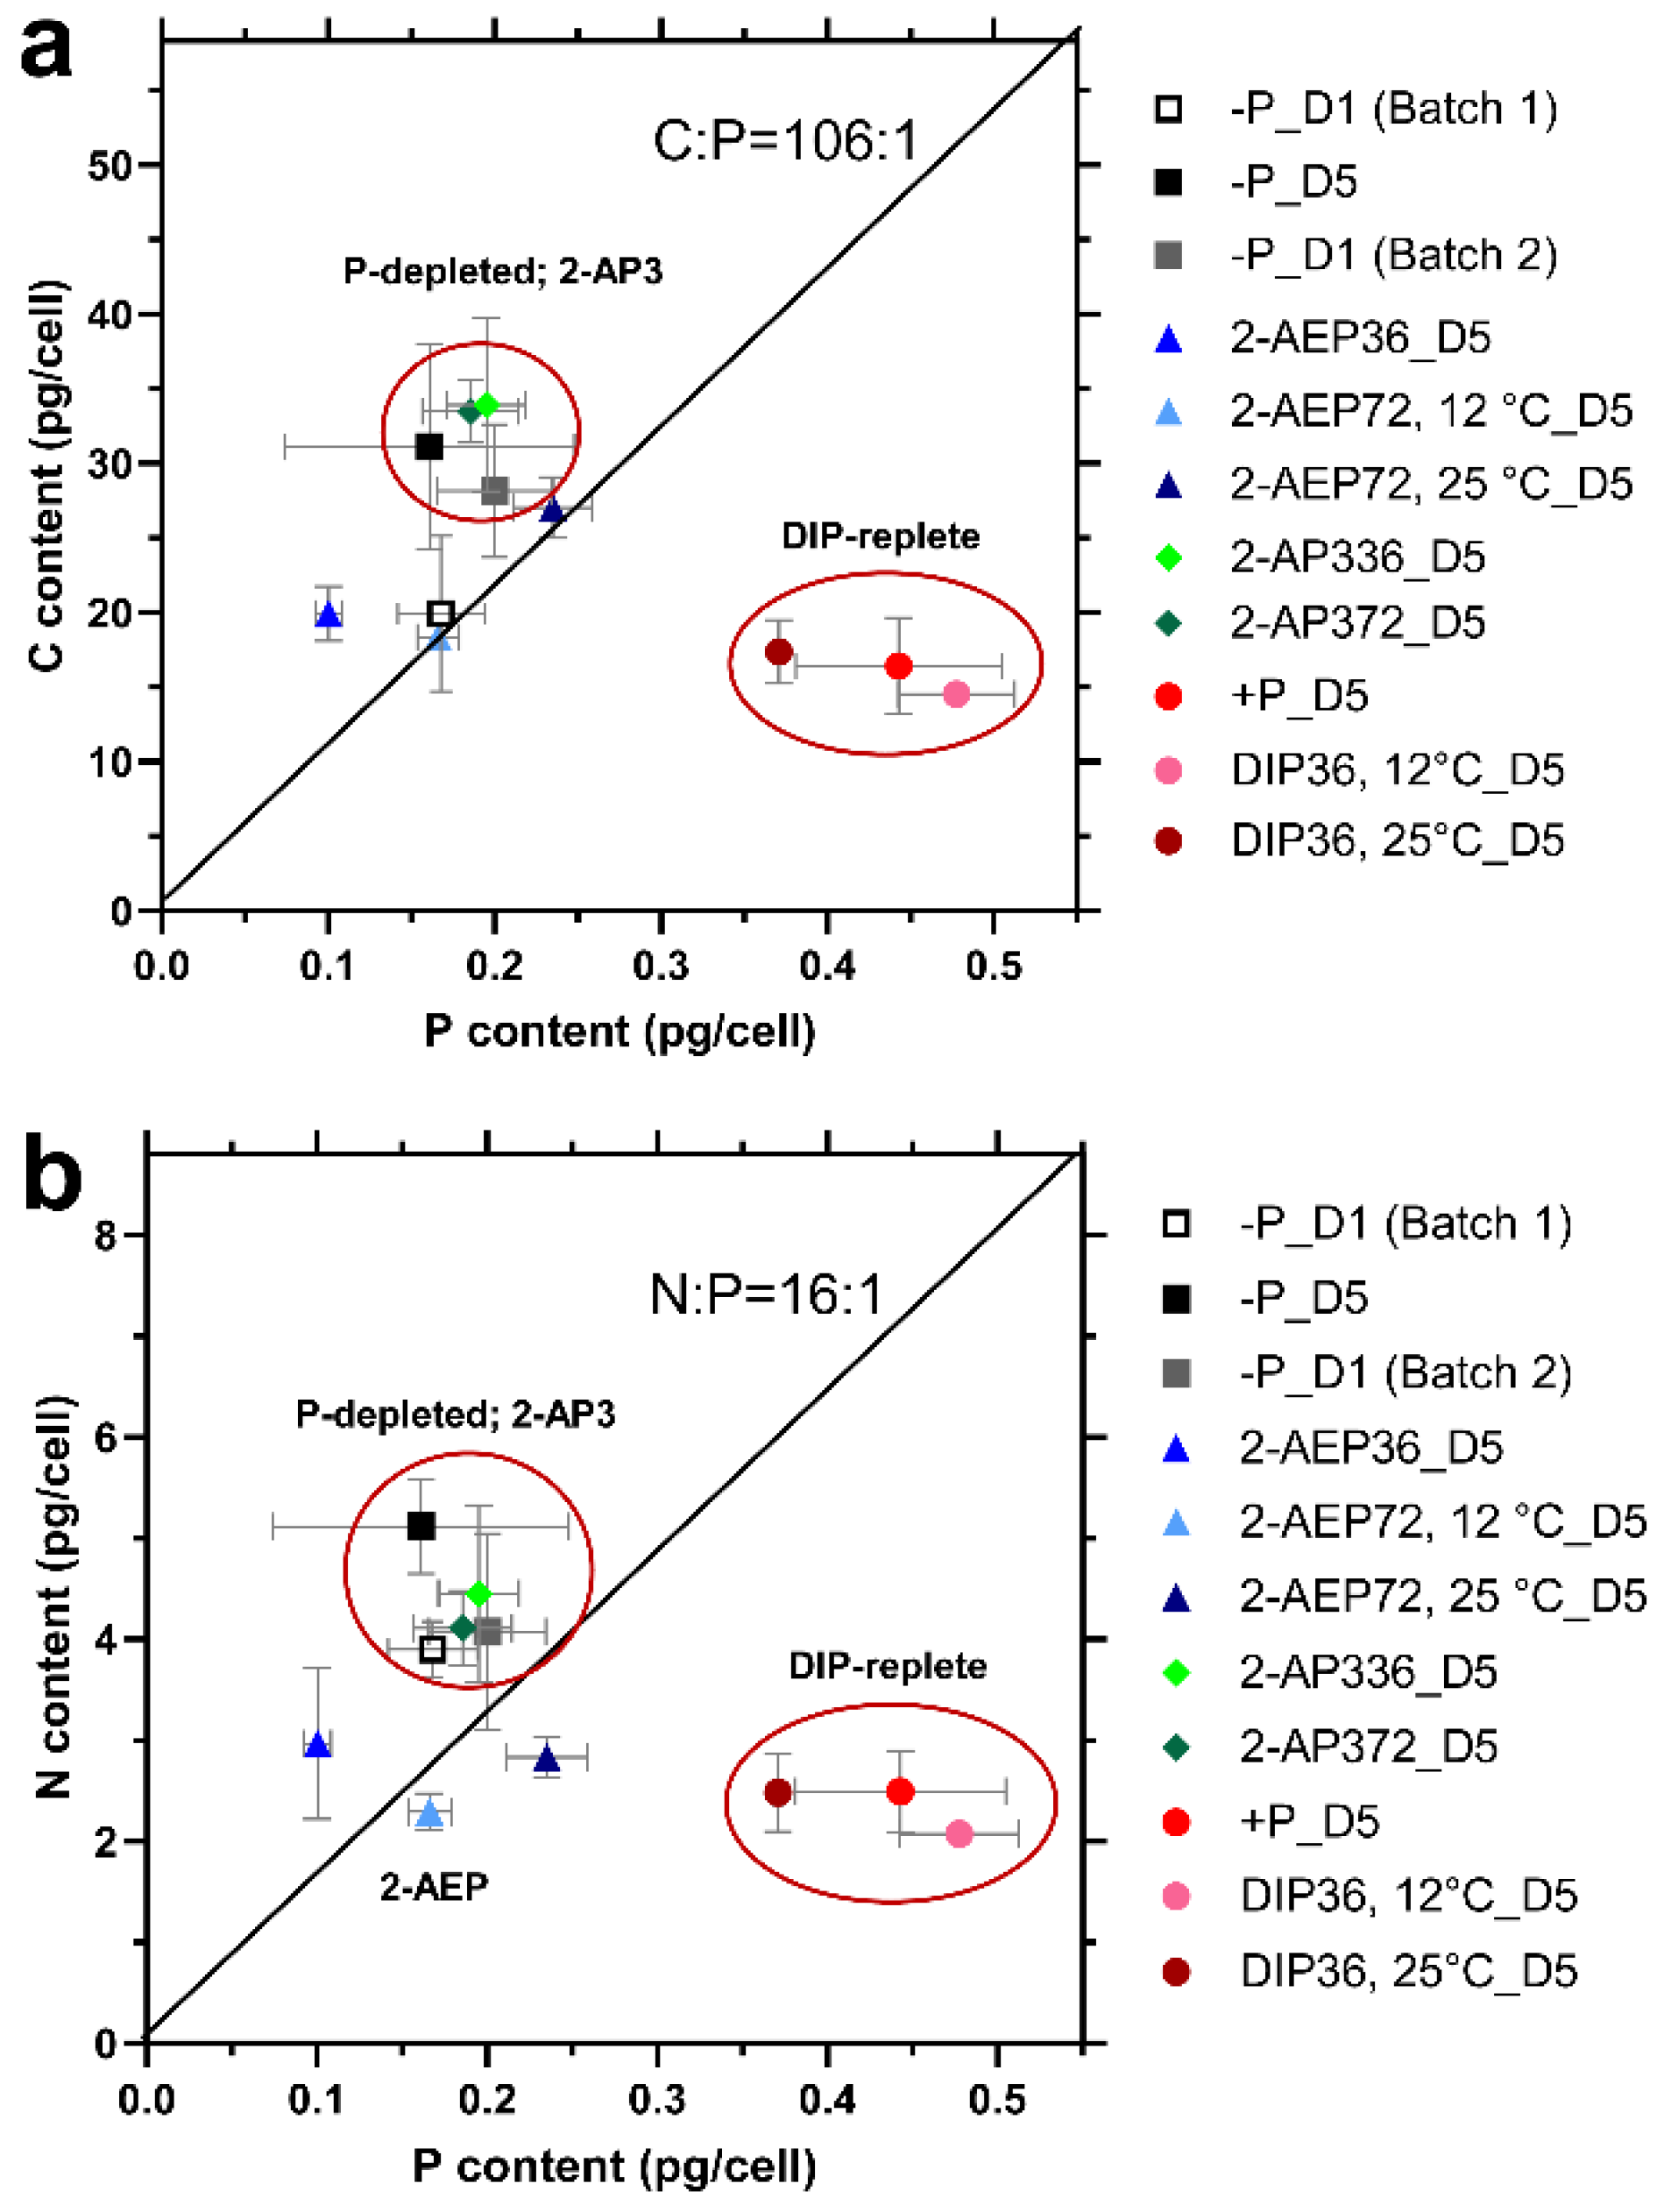
3.3. Changes in Cellular Elemental Stoichiometry of T. pseudonana

Many studies have revealed that marine phytoplankton elemental stoichiometric ratios deviate from the empirical Redfield ratio of 106C:16N:1P [30], thus playing a major role in shaping the environmental stoichiometry ratio [31].

3.3.1. Stoichiometry Variation under Different P Conditions

In this study, the N:P ratio of the DIP-replete group (~6:1) (Figure 2b) was far below that of the Redfield ratio and the group-specific optimal value of 14:1 [32]. This finding can be explained by the luxury uptake of DIP and storage in the form of polyP after P starvation, which is typical in diatoms [33,34]. Regarding the initial P starvation state, the C:P and N:P ratios were 117.72 ± 23.14 and 24.25 ± 7.94, respectively, consistent with reported cellular stoichiometry in diatoms under insufficient nutrient conditions [35]. Afterwards, the C:P and N:P ratios decreased significantly to 36.93 ± 3.96 and 5.63 ± 0.56, respectively, at D5 in the DIP-replete group, whereas they barely changed or increased under other different P conditions (Figure S2a).
The stoichiometry of 2-AP3 groups (36 μM and 72 μM) was similar to that of the P-depleted group (Figure 2), in line with the growth pattern. The P-depleted cells and those treated with 2-AP3 were grouped together, showing higher C:P and N:P ratios, mainly because of higher cellular C and N contents and lower cell P content than that in the DIP-replete groups (Figure S3a).

3.3.2. Effect of Temperature on Cellular Stoichiometry

In the DIP-replete groups, no significant difference was identified between 12 °C and 25 °C (Figure 2 and Figure S2b). In the 2-AEP group, the C:P and N:P ratios were lower than those in P-depleted T. pseudonana and higher than those in the DIP-replete group. In the 72 μM 2-AEP cultures (12 °C and 25 °C), the C:P and N:P values were 111.2 ± 11.1~115.8 ± 12.1 and 13.9 ± 1.8~12.1 ± 0.6, respectively, closer to the Redfield ratio with higher 2-AEP concentration and lower temperature.
The interactions between environmental conditions and cell growth are the key factors driving stoichiometric variation [36]. Temperature is the major factor due to its direct effect on cell growth [34,37]. Global research on phytoplankton stoichiometry has found that C:P and N:P ratios decrease with temperature [37,38,39], but laboratory evidence regarding species differences is insufficient. The findings of the present study show the synergetic effect of temperature and phosphonates on cellular stoichiometry in T. pseudonana, higher N:P ratios when cultured with 2-AEP under lower temperature. In the DIP-replete group, the lower temperature significantly decreased the C:P and N:P ratios of T. pseudonana, consistent with previous reports [37,40,41].
Cells increase ribosome concentration and cellular P content to compensate for low translation efficiency of ribosomes at low temperature [42]. Such a hypothesis is consistent with the observation of the strong temperature dependency of C:P and N:P in high-latitude ecosystems [43]. In this study, the cellular P content of the DIP-replete groups was significantly higher at 12 °C than at 25 °C (Figure S3b), indicating that low temperature may increase the P demand and promote the P absorption of T. pseudonana. In addition, temperature had a significant effect on the C:P and N:P ratios in the DIP group. In the 2-AEP group, temperature effects were barely observed on the stoichiometry of T. pseudonana. This finding may be attributed to the stable chemical properties of 2-AEP, which is hard to be hydrolyzed into phosphate during cellular P determination.

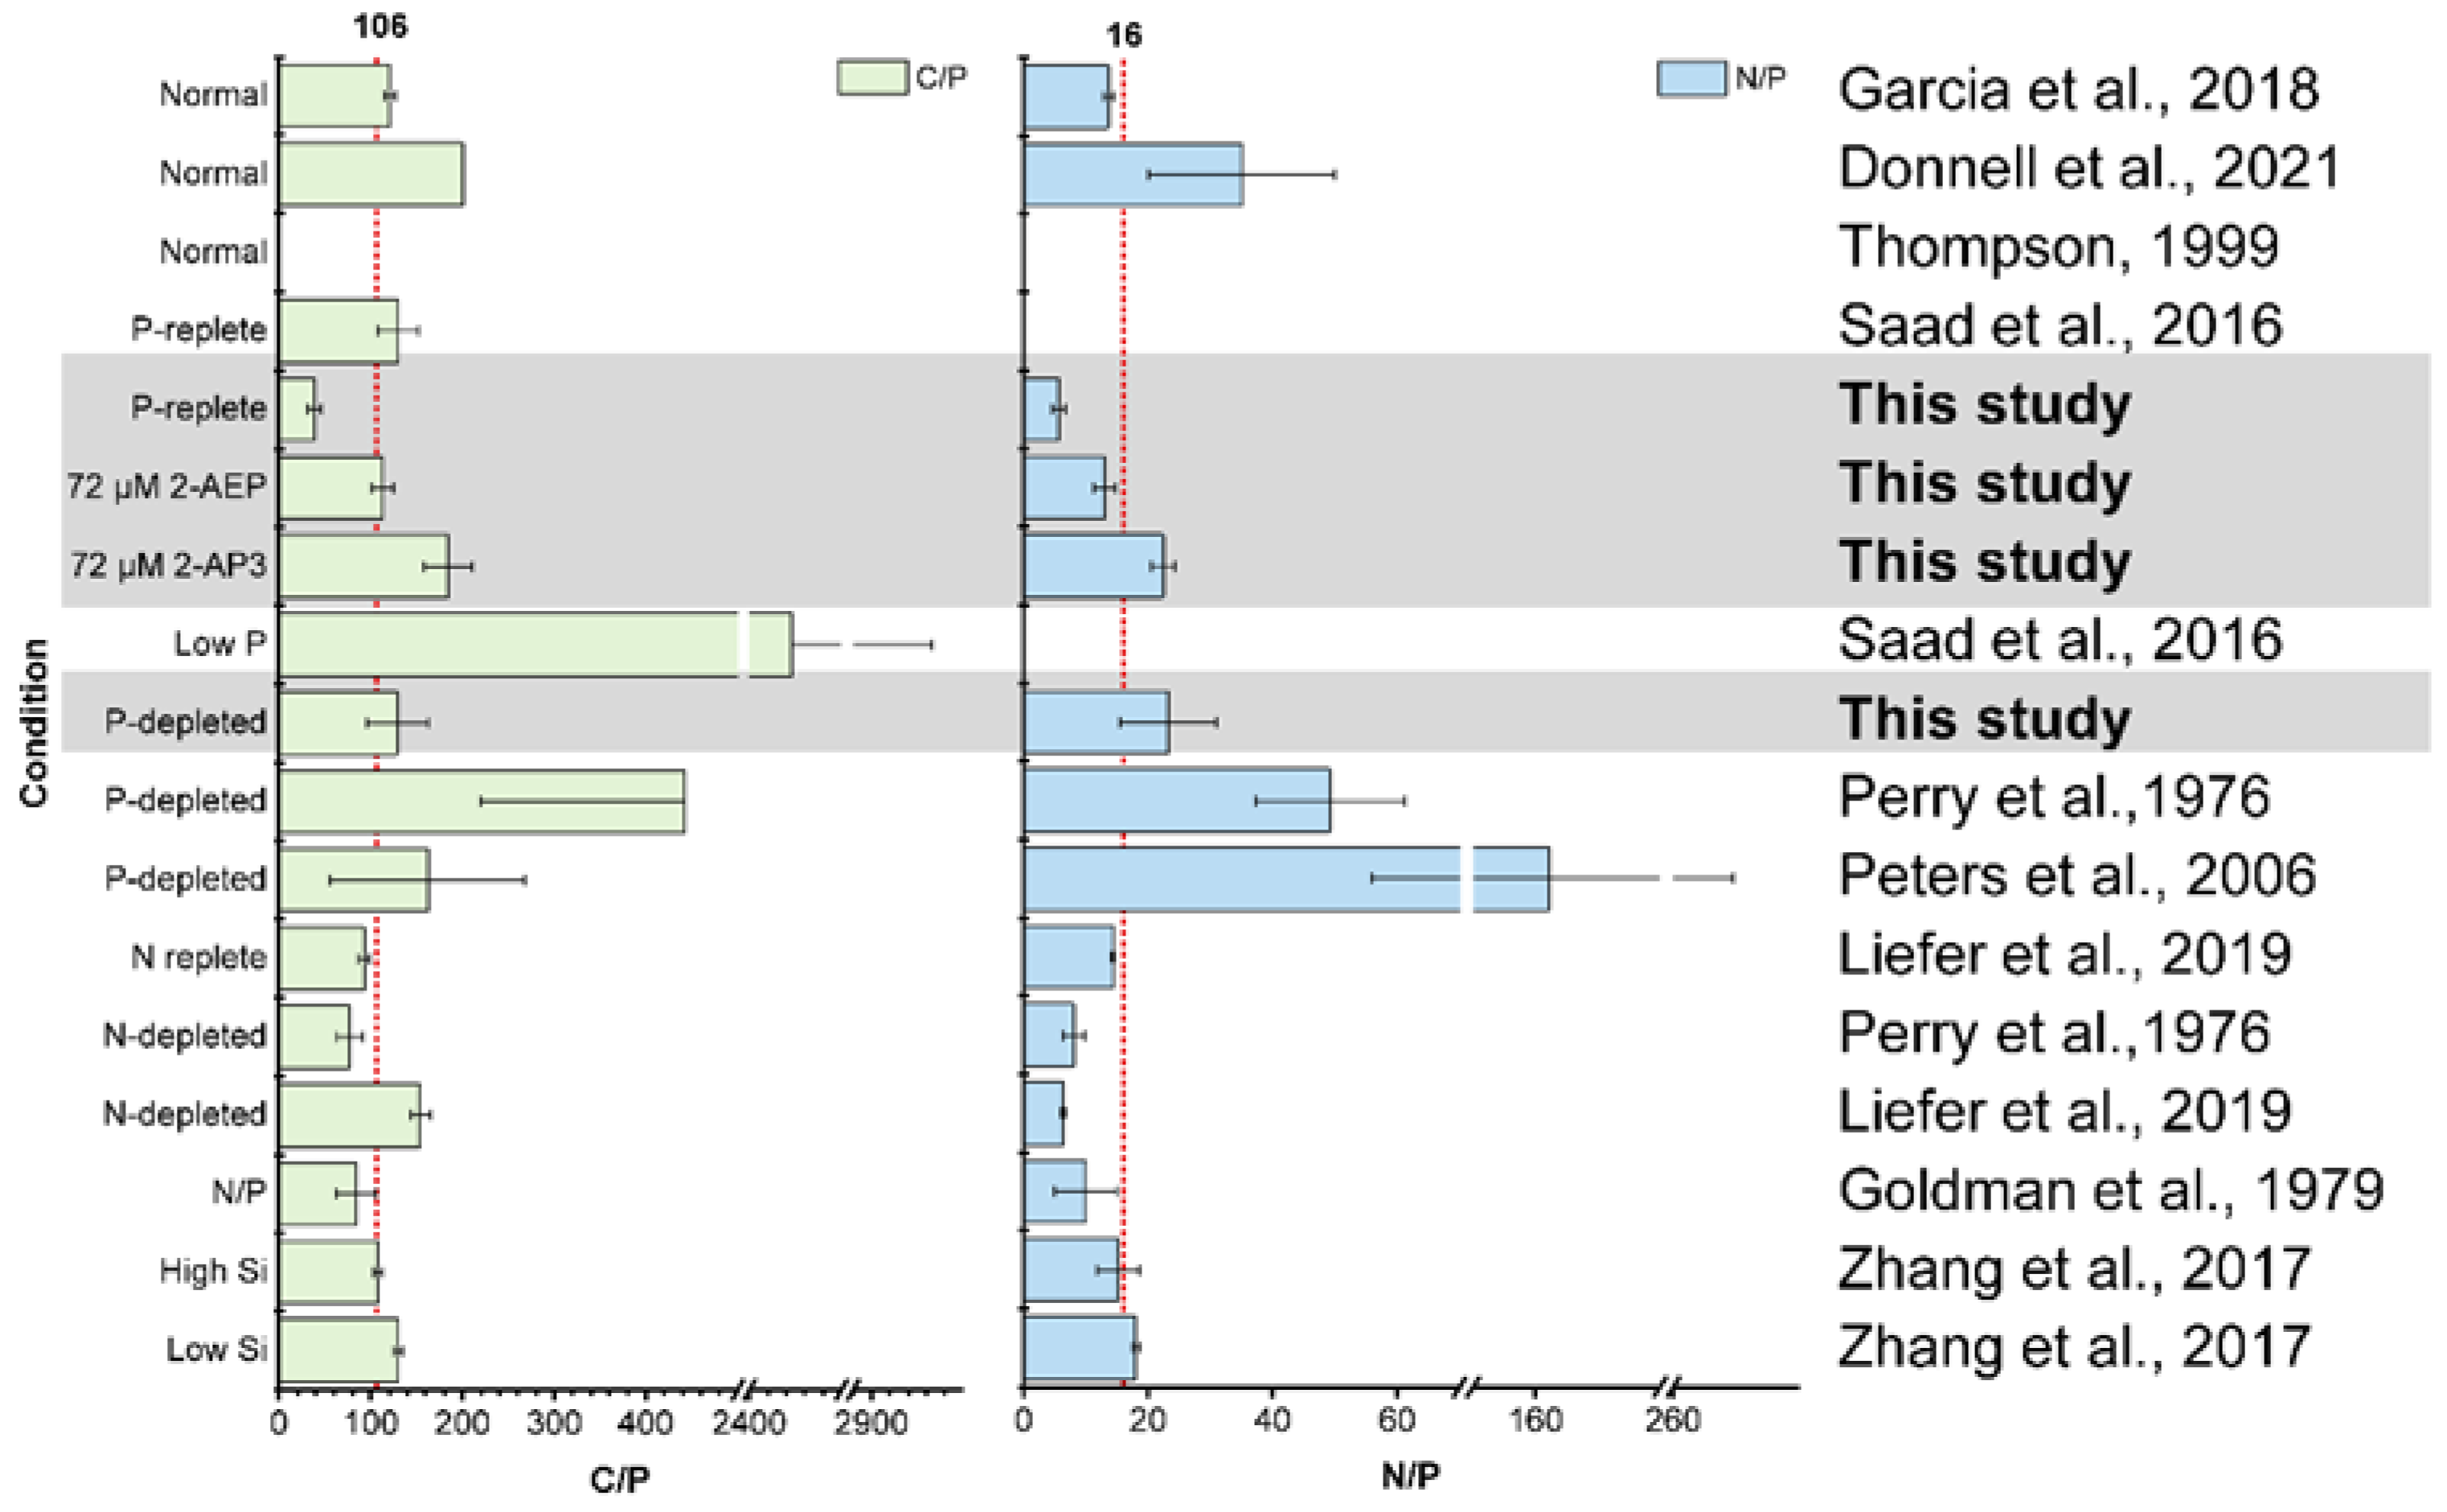
3.4. High Variability of Stoichiometry in Diatom

Nutrient availability is considered to be the major driver shaping phytoplankton stoichiometry; for example, P limitation accounts for the increase in C:P and N:P ratios of phytoplankton [44,45]. In this research, the C:P and N:P ratios of T. pseudonana declined rapidly after 36 μM DIP supplementation. The C:P and N:P in this study were much lower under the same or similar P conditions than those in other studies (Figure 3) [37,45,46,47]. In agreement with the previous results, the C:P and N:P ratios of DIP-depleted T. pseudonana were higher than the Redfield ratio [45,48,49]. According to the observation data from ALOHA and BATS stations, the C:P ratio of suspended particles varies mostly from 100 to 200 and below the P-stressed threshold [50]. Our results show that T. pseudonana grown with 2-AEP is close to the classical Redfield ratio.
The effects of other nutrients, such as N or Si, have been studied. N deficiency leads to a decreased N:P ratio [48,51,52], and Si concentration has no significant effect on both C:P and N:P ratios (Figure 3) [53]. Through summarizing and comparing with previous reports, our study provides fundamental information for addressing temperature and P nutrient effects on stoichiometry variation in T. pseudonana.

4. Conclusions

Overall, this study has three major findings. (1) Biogenic phosphonates 2-AEP and 2-AP3 can be utilized by diatom T. pseudonana to support cell growth, and 2-AEP is more preferable than 2-AP3, as evidenced by higher cell density. (2) Disparate growth strategies are identified under different temperatures, and the significantly promoted cell growth of the 2-AEP culture under lower temperature than mild temperature indicates its adaptive function. (3) The mediate value of C:P and N:P ratios in the 2-AEP groups between that in P-depleted (2-AP3) and DIP-replete groups suggests the potential effect on environmental elemental stoichiometry.
The results of this study provide new insights into interpreting the alternative P nutrient strategy adopted by diatoms in different scenarios. In sub-polar regions, diatoms represent the major primary producers and may benefit from taking 2-AEP to support growth. Another bold hypothetical scenario is in inorganic nutrient-scarce coral reef ecosystems, where diatoms may obtain advantages by using biogenic phosphonates released by metazoans [54], which require further study. The findings of stoichiometry variation of T. pseudonana under different P and temperature conditions provide further understanding of the diatom ecophysiology in marine biogeochemical cycling.

Supplementary Materials

The following supporting information can be downloaded at: https://www.mdpi.com/article/10.3390/microorganisms12040761/s1, Figure S1: Growth curve of P. tricornutum under 2-AP3 treatment. Figure S2: Stoichiometry of T. pseudonana under different phosphorus and temperature conditions. Figure S3: Variations of cellular C, N, and P of T. pseudonana under different phosphorus and temperature conditions.

Author Contributions

H.S., J.M. and X.L. designed the experiments. H.S., H.W. and X.S. performed the experiments. H.S. and X.L. analyzed the data. H.S., Y.S., J.M. and X.L. wrote the manuscript. All authors have read and agreed to the published version of the manuscript.

Funding

This research was supported by the National Key R&D Program of China grant 2022YFC3105302, and National Natural Science Foundation of China (NSFC) 42322602, 42106040.

Data Availability Statement

Data are contained within the article and Supplementary Materials. They are available on request from the authors.

Acknowledgments

We wish to thank Junhui Chen for assisting in cellular C and N determination.

Conflicts of Interest

The authors declare no conflicts of interest.

References

  1. Karl, D.M.; Tien, G. Temporal variability in dissolved phosphorus concentrations in the subtropical North Pacific Ocean. Mar. Chem. 1997, 56, 77–96. [Google Scholar] [CrossRef]
  2. Wu, J.F.; Sunda, W.; Boyle, E.A.; Karl, D.M. Phosphate depletion in the western North Atlantic Ocean. Science 2000, 289, 759–762. [Google Scholar] [CrossRef] [PubMed]
  3. Mills, M.M.; Ridame, C.; Davey, M.; La Roche, J.; Geider, R.J. Iron and phosphorus co-limit nitrogen fixation in the eastern tropical North Atlantic. Nature 2004, 429, 292–294. [Google Scholar] [CrossRef]
  4. Lomas, M.W.; Burke, A.L.; Lomas, D.A.; Bell, D.W.; Shen, C.; Dyhrman, S.T.; Ammerman, J.W. Sargasso Sea phosphorus biogeochemistry: An important role for dissolved organic phosphorus (DOP). Biogeosciences 2010, 7, 695–710. [Google Scholar] [CrossRef]
  5. Torres-Valdes, S.; Roussenov, V.M.; Sanders, R.; Reynolds, S.; Pan, X.; Mather, R.; Landolfi, A.; Wolff, G.A.; Achterberg, E.P.; Williams, R.G. Distribution of dissolved organic nutrients and their effect on export production over the Atlantic Ocean. Glob. Biogeochem. Cycles 2009, 23, GB4019. [Google Scholar] [CrossRef]
  6. Dawson, R.; Kemp, P. The aminoethylphosphonate-containing lipids of rumen protozoa. Biochem. J. 1967, 105, 837–842. [Google Scholar] [CrossRef]
  7. Taro, H.; Ikuko, A. Isolation and characterization of new sphingolipids containing N, N-acylmethylaminoethylphosphonic acid and N-acylaminoethylphosphonic acid from the mussel, Corbicula sandai. BBA-Lipids Lipid Metab. 1969, 176, 898–900. [Google Scholar] [CrossRef]
  8. Quin, L.D.; Quin, G.S. Screening for carbon-bound phosphorus in marine animals by high-resolution 31P-NMR spectroscopy: Coastal and hydrothermal vent invertebrates. Comp. Biochem. Phys. B 2001, 128, 173–185. [Google Scholar] [CrossRef] [PubMed]
  9. Hilderbrand, R.L. The Role of Phosphonates in Living Systems; CRC Press Inc: Boca Raton, FL, USA, 1983. [Google Scholar]
  10. Acker, M.; Hogle, S.L.; Berube, P.M.; Hackl, T.; Coe, A.; Stepanauskas, R.; Chisholm, S.W.; Repeta, D.J. Phosphonate production by marine microbes: Exploring new sources and potential function. Proc. Natl. Acad. Sci. USA 2022, 119, e2113386119. [Google Scholar] [CrossRef]
  11. Shoguchi, E.; Tanaka, M.; Takeuchi, T.; Shinzato, C.; Satoh, N. Probing a Coral Genome for Components of the Photoprotective Scytonemin Biosynthetic Pathway and the 2-Aminoethylphosphonate Pathway. Mar. Drugs 2013, 11, 559–570. [Google Scholar] [CrossRef]
  12. Rott, E.; Steinmetz, H.; Metzger, J.W. Organophosphonates: A review on environmental relevance, biodegradability and removal in wastewater treatment plants. Sci. Total Environ. 2018, 615, 1176–1191. [Google Scholar] [CrossRef] [PubMed]
  13. Dyhrman, S.T.; Chappell, P.D.; Haley, S.T.; Moffett, J.W.; Orchard, E.D.; Waterbury, J.B.; Webb, E.A. Phosphonate utilization by the globally important marine diazotroph Trichodesmium. Nature 2006, 439, 68–71. [Google Scholar] [CrossRef] [PubMed]
  14. Chin, J.P.; Quinn, J.P.; McGrath, J.W. Phosphate insensitive aminophosphonate mineralisation within oceanic nutrient cycles. ISME J. 2018, 12, 973–980. [Google Scholar] [CrossRef] [PubMed]
  15. Wang, C.; Lin, X.; Li, L.; Lin, S. Differential growth responses of marine phytoplankton to herbicide glyphosate. PLoS ONE 2016, 11, e0151633. [Google Scholar] [CrossRef] [PubMed]
  16. Shu, H.L.; You, Y.C.; Wang, H.W.; Wang, J.T.; Li, L.; Ma, J.; Lin, X. Transcriptomic-guided phosphonate utilization analysis unveils evidence of clathrin-mediated endocytosis and phospholipid synthesis in the model diatom, Phaeodactylum tricornutum. Msystems 2022, 7, e00563. [Google Scholar] [CrossRef] [PubMed]
  17. Whitney, L.P.; Lomas, M.W. Phosphonate utilization by eukaryotic phytoplankton. Limnol. Oceanogr. Lett. 2019, 4, 18–24. [Google Scholar] [CrossRef]
  18. Lim, A.S.; Jeong, H.J.; Jang, T.Y.; Jang, S.H.; Franks, P.J. Inhibition of growth rate and swimming speed of the harmful dinoflagellate Cochlodinium polykrikoides by diatoms: Implications for red tide formation. Harmful Algae 2014, 37, 53–61. [Google Scholar] [CrossRef]
  19. Kang, Y.Y.; Liang, J.R.; Gao, Y.H.; Lin, R.C.; Gao, H.; Xing, X.L.; Ma, J.; Luo, Q.Q. Influence of the concentration ratio of nitrogen to phosphorus on the growth and interspecies competition of two red tide algae. Acta Oceanol. Sin. 2007, 26, 107–115. [Google Scholar]
  20. Zheng, J.W.; Mao, X.T.; Ye, M.H.; Li, H.Y.; Liu, J.S.; Yang, W.D. Allelopathy and underlying mechanism of Karenia mikimotoi on the diatom Thalassiosira pseudonana under laboratory condition. Algal Res. 2021, 54, 102229. [Google Scholar] [CrossRef]
  21. Sheehan, C.E.; Baker, K.G.; Nielsen, D.A.; Petrou, K. Temperatures above thermal optimum reduce cell growth and silica production while increasing cell volume and protein content in the diatom Thalassiosira pseudonana. Hydrobiologia 2020, 847, 4233–4248. [Google Scholar] [CrossRef]
  22. Li, M.Z.; Shi, X.G.; Guo, C.T.; Lin, S.J. Phosphorus deficiency inhibits cell division but not growth in the dinoflagellate Amphidinium carterae. Front. Microbiol. 2016, 7, 826. [Google Scholar] [CrossRef] [PubMed]
  23. Sharp, J.H. Improved analysis for “particulate” organic carbon and nitrogen from seawater 1. Limnol. Oceanogr. 1974, 19, 984–989. [Google Scholar] [CrossRef]
  24. Jeffries, D.S.; Dieken, F.; Jones, D. Performance of the autoclave digestion method for total phosphorus analysis. Water Res. 1979, 13, 275–279. [Google Scholar] [CrossRef]
  25. Tamari, M. Digestion, absorption and excretion of free-form-ciliatine in rats. J. Agric. Chem. Soc. Jpn. 1971, 45, 433–440. [Google Scholar]
  26. Curley, J.M.; Henderson, T.O. The incorporation of 2-aminoethylphosphonic acid into rat liver diacylglyceroaminoethylphosphonate. Lipids 1972, 7, 676–679. [Google Scholar] [CrossRef] [PubMed]
  27. Horigane, A.; Horiguchi, M.; Matsumoto, T. Metabolism of 2-amino-3-phosphonopropionic acid in rats. BBA-Lipids Lipid Metab. 1979, 572, 385–394. [Google Scholar] [CrossRef] [PubMed]
  28. Akira, H.; Masaaki, H.; Tatsuro, M. Metabolism of 2-amino-3-phosphono [3-14C] propionic acid in cell-free preparations of Tetrahymena. BBA-Lipids Lipid Metab. 1980, 618, 383–388. [Google Scholar] [CrossRef]
  29. Berges, J.A.; Varela, D.E.; Harrison, P.J. Effects of temperature on growth rate, cell composition and nitrogen metabolism in the marine diatom Thalassiosira pseudonana (Bacillariophyceae). Mar. Ecol. Prog. Ser. 2002, 225, 139–146. [Google Scholar] [CrossRef]
  30. Redfield, A.C. The biological control of chemical factors in the environment. Am. Sci. 1958, 46, 205–221. [Google Scholar]
  31. Chien, C.T.; Pahlow, M.; Schartau, M.; Li, N.; Oschlies, A. Effects of phytoplankton physiology on global ocean biogeochemistry and climate. Sci. Adv. 2023, 9, eadg1725. [Google Scholar] [CrossRef]
  32. Sharoni, S.; Halevy, I. Nutrient ratios in marine particulate organic matter are predicted by the population structure of well-adapted phytoplankton. Sci. Adv. 2020, 6, eaaw9371. [Google Scholar] [CrossRef] [PubMed]
  33. Dyhrman, S.T.; Jenkins, B.D.; Rynearson, T.A.; Saito, M.A.; Mercier, M.L.; Alexander, H.; Whitney, L.P.; Drzewianowski, A.; Bulygin, V.V.; Bertrand, E.M. The transcriptome and proteome of the diatom Thalassiosira pseudonana reveal a diverse phosphorus stress response. PLoS ONE 2012, 7, e33768. [Google Scholar] [CrossRef] [PubMed]
  34. Cruz de Carvalho, M.H.; Sun, H.X.; Bowler, C.; Chua, N.H. Noncoding and coding transcriptome responses of a marine diatom to phosphate fluctuations. New Phytol. 2016, 210, 497–510. [Google Scholar] [CrossRef]
  35. Quigg, A.; Finkel, Z.V.; Irwin, A.J.; Rosenthal, Y.; Ho, T.Y.; Reinfelder, J.R.; Schofield, O.; Morel, F.M.M.; Falkowski, P.G. The evolutionary inheritance of elemental stoichiometry in marine phytoplankton. Nature 2003, 425, 291–294. [Google Scholar] [CrossRef] [PubMed]
  36. Moreno, A.R.; Martiny, A.C. Ecological stoichiometry of ocean plankton. Ann. Rev. Mar. Sci. 2018, 10, 43–69. [Google Scholar] [CrossRef] [PubMed]
  37. Garcia, N.S.; Sexton, J.; Riggins, T.; Brown, J.; Lomas, M.W.; Martiny, A.C. High variability in cellular stoichiometry of carbon, nitrogen, and phosphorus within classes of marine eukaryotic phytoplankton under sufficient nutrient conditions. Front. Microbiol. 2018, 9, 241843. [Google Scholar] [CrossRef] [PubMed]
  38. Martiny, A.C.; Pham, C.T.; Primeau, F.W.; Vrugt, J.A.; Moore, J.K.; Levin, S.A.; Lomas, M.W. Strong latitudinal patterns in the elemental ratios of marine plankton and organic matter. Nat. Geosci. 2013, 6, 279–283. [Google Scholar] [CrossRef]
  39. Yvon-Durocher, G.; Dossena, M.; Trimmer, M.; Woodward, G.; Allen, A.P. Temperature and the biogeography of algal stoichiometry. Glob. Ecol. Biogeogr. 2015, 24, 562–570. [Google Scholar] [CrossRef]
  40. Arrigo, K.R.; Robinson, D.H.; Worthen, D.L.; Dunbar, R.B.; DiTullio, G.R.; VanWoert, M.; Lizotte, M.P. Phytoplankton community structure and the drawdown of nutrients and CO2 in the Southern Ocean. Science 1999, 283, 365–367. [Google Scholar] [CrossRef]
  41. Arrigo, K.R.; Dunbar, R.B.; Lizotte, M.P.; Robinson, D.H. Taxon-specific differences in C/P and N/P drawdown for phytoplankton in the Ross Sea, Antarctica. Geophys. Res. Lett. 2002, 29, 44-1–44-4. [Google Scholar] [CrossRef]
  42. Toseland, A.; Daines, S.J.; Clark, J.R.; Kirkham, A.; Strauss, J.; Uhlig, C.; Lenton, T.M.; Valentin, K.; Pearson, G.A.; Moulton, V. The impact of temperature on marine phytoplankton resource allocation and metabolism. Nat. Clim. Chang. 2013, 3, 979–984. [Google Scholar] [CrossRef]
  43. Tanioka, T.; Garcia, C.A.; Larkin, A.A.; Garcia, N.S.; Fagan, A.J.; Martiny, A.C. Global patterns and predictors of C:N:P in marine ecosystems. Commun. Earth Environ. 2022, 3, 271. [Google Scholar] [CrossRef] [PubMed]
  44. Sanudo-Wilhelmy, S.A.; Tovar-Sanchez, A.; Fu, F.X.; Capone, D.G.; Carpenter, E.J.; Hutchins, D.A. The impact of surface-adsorbed phosphorus on phytoplankton Redfield stoichiometry. Nature 2004, 432, 897–901. [Google Scholar] [CrossRef] [PubMed]
  45. Saad, E.M.; Longo, A.F.; Chambers, L.R.; Huang, R.; Benitez-Nelson, C.; Dyhrman, S.T.; Diaz, J.M.; Tang, Y.; Ingall, E.D. Understanding marine dissolved organic matter production: Compositional insights from axenic cultures of Thalassiosira pseudonana. Limnol. Oceanogr. 2016, 61, 2222–2233. [Google Scholar] [CrossRef]
  46. Thompson, P. The response of growth and biochemical composition to variations in daylength, temperature, and irradiance in the marine diatom Thalassiosira pseudonana (Bacillariophyceae). J. Phycol. 1999, 35, 1215–1223. [Google Scholar] [CrossRef]
  47. O'Donnell, D.R.; Beery, S.M.; Litchman, E. Temperature-dependent evolution of cell morphology and carbon and nutrient content in a marine diatom. Limnol. Oceanogr. 2021, 66, 4334–4346. [Google Scholar] [CrossRef]
  48. Perry, M. Phosphate utilization by an oceanic diatom in phosphorus-limited chemostat culture and in the oligotrophic waters of the central North Pacific 1. Limnol. Oceanogr. 1976, 21, 88–107. [Google Scholar] [CrossRef]
  49. Peters, F.; Arin, L.; Marrasé, C.; Berdalet, E.; Sala, M.M. Effects of small-scale turbulence on the growth of two diatoms of different size in a phosphorus-limited medium. J. Mar. Syst. 2006, 61, 134–148. [Google Scholar] [CrossRef]
  50. Kwon, E.Y.; Sreeush, M.G.; Timmermann, A.; Karl, D.M.; Church, M.J.; Lee, S.S.; Yamaguchi, R. Nutrient uptake plasticity in phytoplankton sustains future ocean net primary production. Sci. Adv. 2022, 8, eadd2475. [Google Scholar] [CrossRef]
  51. Goldman, J.C.; McCarthy, J.J.; Peavey, D.G. Growth rate influence on the chemical composition of phytoplankton in oceanic waters. Nature 1979, 279, 210–215. [Google Scholar] [CrossRef]
  52. Liefer, J.D.; Garg, A.; Fyfe, M.H.; Irwin, A.J.; Benner, I.; Brown, C.M.; Follows, M.J.; Omta, A.W.; Finkel, Z.V. The macromolecular basis of phytoplankton C:N:P under nitrogen starvation. Front. Microbiol. 2019, 10, 763. [Google Scholar] [CrossRef] [PubMed]
  53. Zhang, S.W.; Liu, H.B.; Ke, Y.; Li, B. Effect of the silica content of diatoms on protozoan grazing. Front. Mar. Sci. 2017, 4, 202. [Google Scholar] [CrossRef]
  54. Thomas, S.; Burdett, H.; Temperton, B.; Wick, R.; Snelling, D.; McGrath, J.W.; Quinn, J.P.; Munn, C.; Gilbert, J.A. Evidence for phosphonate usage in the coral holobiont. ISME J. 2010, 4, 459–461. [Google Scholar] [CrossRef] [PubMed]
Figure 1. Physiological responses of T. pseudonana to different phosphorus levels ((a), growth curve; (b), Fv/Fm) and temperatures ((c), growth curve; (d), Fv/Fm). The culture temperature was 20 °C (a,b) and 12/25 °C (c,d). Each culture group was set up in biological triplicate. The error bar represents the standard deviation of the mean values. The inner panel of (c) represents the growth rate on D6 at 12 °C, and * represents a significant difference (p < 0.05) between P-depleted and other groups.
Microorganisms 12 00761 g001
Figure 2. Cellular stoichiometry of T. pseudonana under different conditions. (-P, 2-AEP36, 2-AEP72, 2-AP336, and 2-AP372 represent P-depleted, 36 μM 2-AEP, 72 μM 2-AEP, 36 μM 2-AP3, and 72 μM 2-AP3 groups, respectively. D1 and D5 represent the first day and fifth day of the cultural period, respectively). (a) C:P ratio; (b) N:P ratio. Each culture group was set up in biological triplicate. The error bar represents the standard deviation of the mean values.
Microorganisms 12 00761 g002
Figure 3. Comparison between the elemental stoichiometry of T. pseudonana in this study and that in previous research. Normal represents the nutrients in adequate culture conditions, P-replete represents DIP resupplied to the phosphorus-starvation cells, P-depleted represents the phosphorus-starvation condition, and low P represents a very low phosphorus concentration in the medium [37,45,46,47,48,49,51,52,53].
Microorganisms 12 00761 g003
Table 1. Culture conditions (a, b: control groups in batch 1, b: control group in batch 2).
CultureT (°C)P Nutrient ConcentrationCulture Condition
Seed Starvation treated
8–10 days (<0.3 μM)
  • f/2 medium (salinity = 30)
  • 14:10 light: dark cycle
  • photon flux: 180 μmol m−2 s−1
  • Antibiotics cocktail (final concentration in medium: 100 mg L−1 ampicillin, 50 mg L−1 streptomycin, and 50 mg L−1 kanamycin)
−P a No addition
+P b DIP (36 μM)
Batch 1202-AEP (36 μM)
2-AP3 (36, 72 μM)
Batch 212/252-AEP (72 μM)
Disclaimer/Publisher’s Note: The statements, opinions and data contained in all publications are solely those of the individual author(s) and contributor(s) and not of MDPI and/or the editor(s). MDPI and/or the editor(s) disclaim responsibility for any injury to people or property resulting from any ideas, methods, instructions or products referred to in the content.

