_Di_Marco.png)
Women Skin Microbiota Modifications during Pregnancy

 , ,
, ,
Abstract
1. Introduction
2. Materials and Methods
2.1. Patients Enrolment/Study Design and Participants Population
2.2. Samples Collection
2.3. DNA Extraction
2.4. Quality Control of the Sequences and OTU Picking
2.5. Alpha and Beta-Diversity Analysis
2.6. Taxonomy Assignment
2.7. Putative Functional Profiling
2.8. Network Analysis
2.9. Statistical Analysis
3. Results
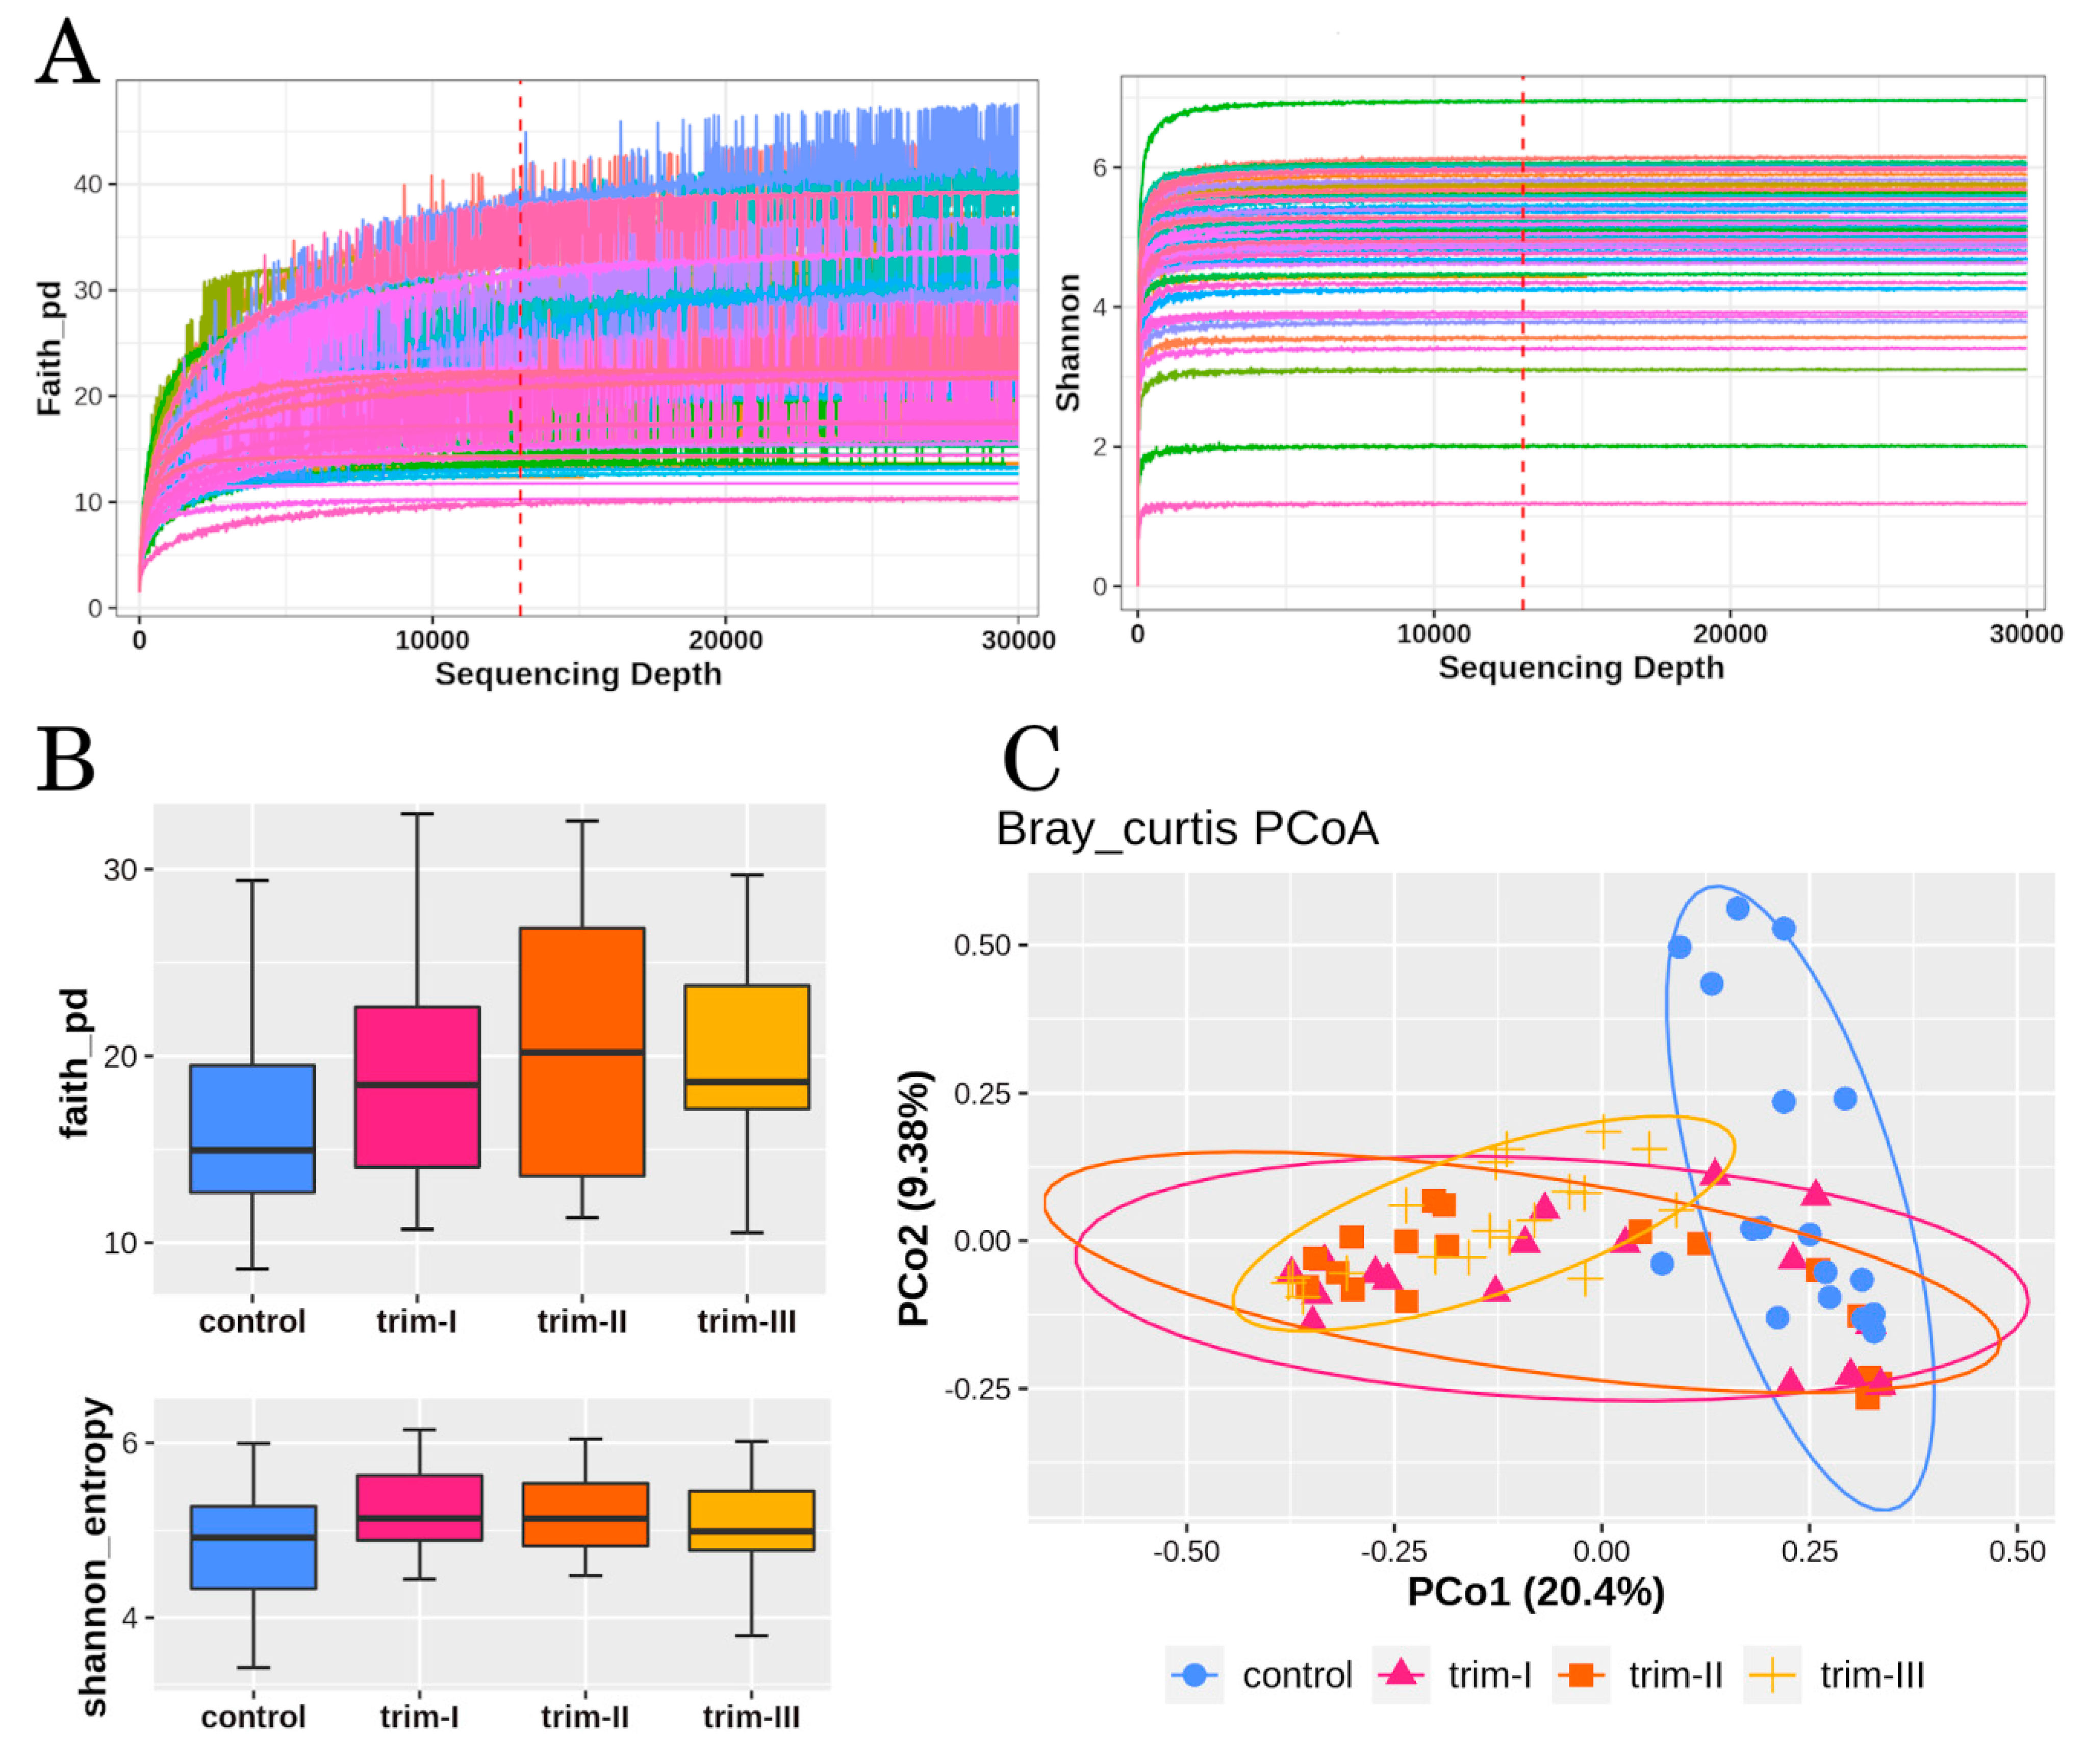
3.1. Diversity
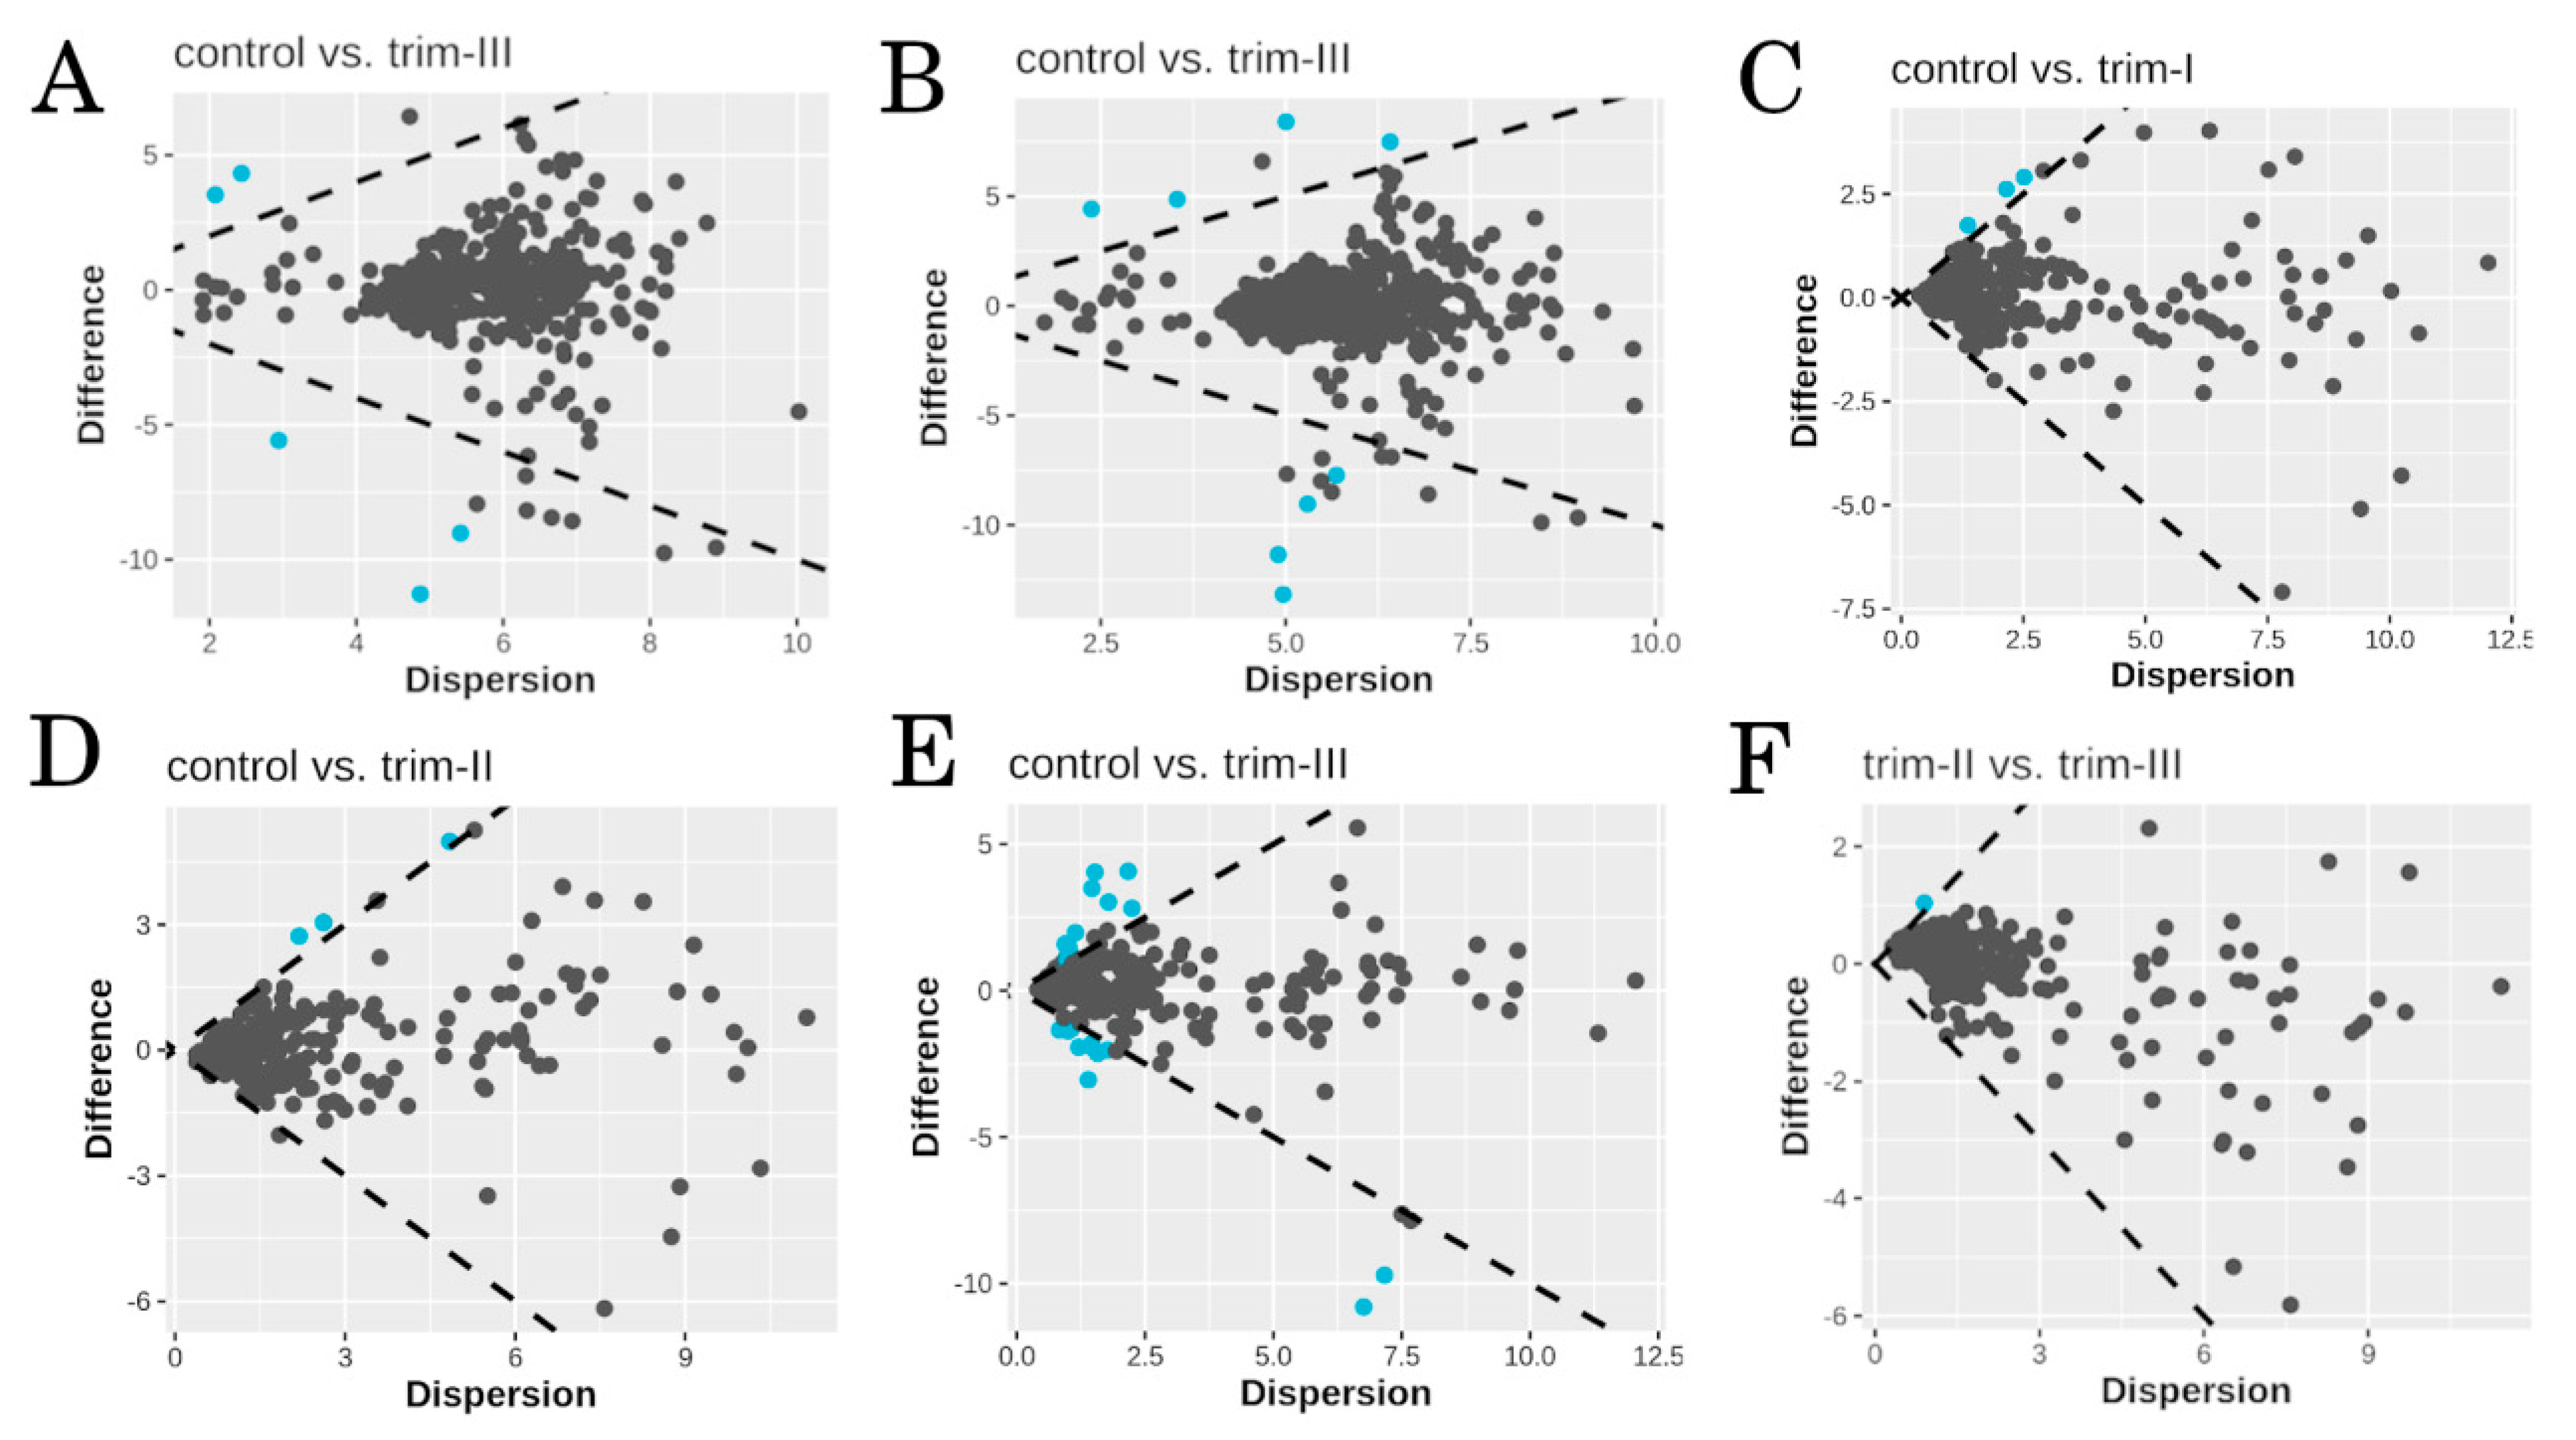
3.2. Taxonomy and Differential Abundance Analysis
3.3. Functional Profiling
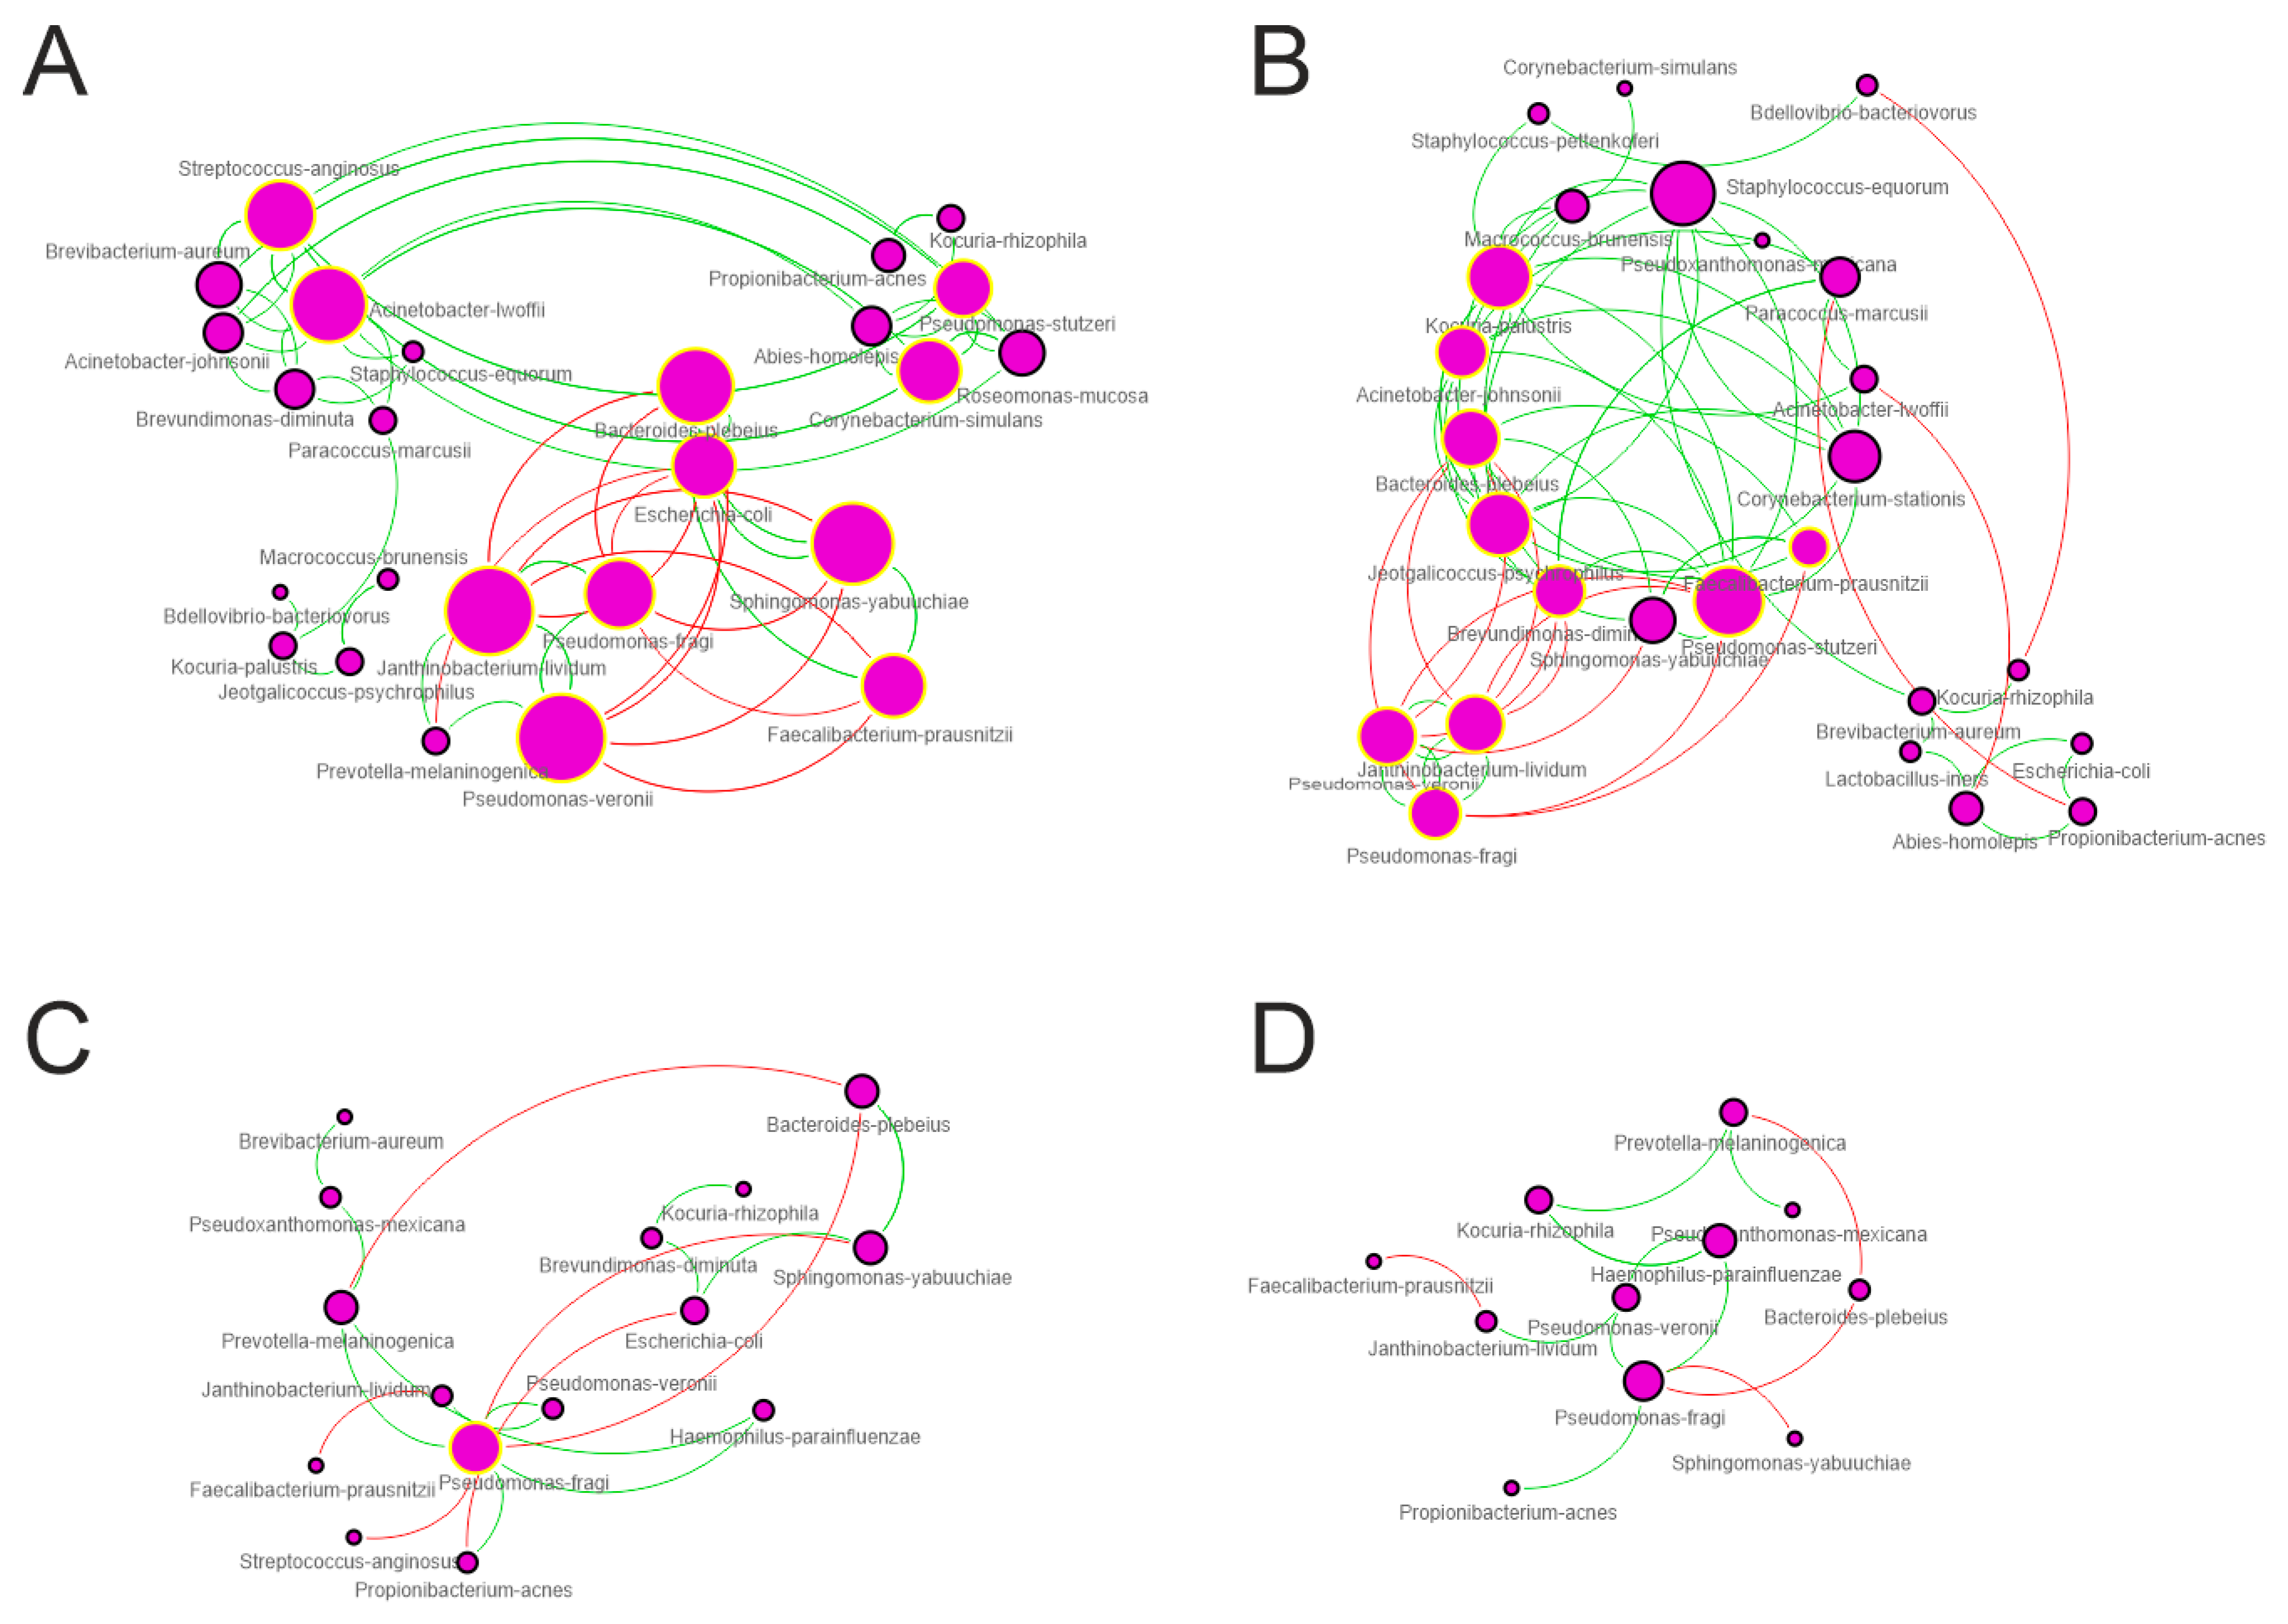
3.4. Network Analysis
4. Discussion
5. Conclusions
Supplementary Materials
Author Contributions
Funding
Informed Consent Statement
Data Availability Statement
Conflicts of Interest
References
- Giannella, L.; Grelloni, C.; Quintili, D.; Fiorelli, A.; Montironi, R.; Alia, S.; Delli Carpini, G.; Di Giuseppe, J.; Vignini, A.; Ciavattini, A. Microbiome Changes in Pregnancy Disorders. Antioxidants 2023, 12, 463. [Google Scholar] [CrossRef] [PubMed]
- Koren, O.; Goodrich, J.K.; Cullender, T.C.; Spor, A.; Laitinen, K.; Bäckhed, H.K.; Gonzalez, A.; Werner, J.J.; Angenent, L.T.; Knight, R.; et al. Host Remodeling of the Gut Microbiome and Metabolic Changes during Pregnancy. Cell 2012, 150, 470–480. [Google Scholar] [CrossRef] [PubMed]
- Cortez, R.V.; Taddei, C.R.; Sparvoli, L.G.; Ângelo, A.G.S.; Padilha, M.; Mattar, R.; Daher, S. Microbiome and Its Relation to Gestational Diabetes. Endocrine 2019, 64, 254–264. [Google Scholar] [CrossRef] [PubMed]
- Walters, W.A.; Xu, Z.; Knight, R. Meta-Analyses of Human Gut Microbes Associated with Obesity and IBD. FEBS Lett. 2014, 588, 4223–4233. [Google Scholar] [CrossRef] [PubMed]
- Nuriel-Ohayon, M.; Neuman, H.; Koren, O. Microbial Changes during Pregnancy, Birth, and Infancy. Front. Microbiol. 2016, 7, 1031. [Google Scholar] [CrossRef] [PubMed]
- Neuman, H.; Koren, O. The Pregnancy Microbiome. Nestle Nutr. Inst. Workshop Ser. 2017, 88, 1–9. [Google Scholar] [CrossRef] [PubMed]
- Jin, M.; Li, D.; Ji, R.; Liu, W.; Xu, X.; Li, Y. Changes in Intestinal Microflora in Digestive Tract Diseases during Pregnancy. Arch. Gynecol. Obstet. 2020, 301, 243–249. [Google Scholar] [CrossRef]
- Gomez-Arango, L.F.; Barrett, H.L.; McIntyre, H.D.; Callaway, L.K.; Morrison, M.; Dekker Nitert, M. SPRING Trial Group Connections Between the Gut Microbiome and Metabolic Hormones in Early Pregnancy in Overweight and Obese Women. Diabetes 2016, 65, 2214–2223. [Google Scholar] [CrossRef] [PubMed]
- Mesa, M.D.; Loureiro, B.; Iglesia, I.; Fernandez Gonzalez, S.; Llurba Olivé, E.; García Algar, O.; Solana, M.J.; Cabero Perez, M.J.; Sainz, T.; Martinez, L.; et al. The Evolving Microbiome from Pregnancy to Early Infancy: A Comprehensive Review. Nutrients 2020, 12, 133. [Google Scholar] [CrossRef]
- Siena, M.D.; Laterza, L.; Matteo, M.V.; Mignini, I.; Schepis, T.; Rizzatti, G.; Ianiro, G.; Rinninella, E.; Cintoni, M.; Gasbarrini, A. Gut and Reproductive Tract Microbiota Adaptation during Pregnancy: New Insights for Pregnancy-Related Complications and Therapy. Microorganisms 2021, 9, 473. [Google Scholar] [CrossRef]
- Amabebe, E.; Anumba, D.O. Diabetogenically Beneficial Gut Microbiota Alterations in Third Trimester of Pregnancy. Reprod. Fertil. 2021, 2, R1–R12. [Google Scholar] [CrossRef] [PubMed]
- Ravel, J.; Gajer, P.; Abdo, Z.; Schneider, G.M.; Koenig, S.S.K.; McCulle, S.L.; Karlebach, S.; Gorle, R.; Russell, J.; Tacket, C.O.; et al. Vaginal Microbiome of Reproductive-Age Women. Proc. Natl. Acad. Sci. USA 2011, 108 (Suppl. S1), 4680–4687. [Google Scholar] [CrossRef] [PubMed]
- Perera, M.; Al-Hebshi, N.N.; Speicher, D.J.; Perera, I.; Johnson, N.W. Emerging Role of Bacteria in Oral Carcinogenesis: A Review with Special Reference to Perio-Pathogenic Bacteria. J. Oral. Microbiol. 2016, 8, 32762. [Google Scholar] [CrossRef] [PubMed]
- DiGiulio, D.B.; Callahan, B.J.; McMurdie, P.J.; Costello, E.K.; Lyell, D.J.; Robaczewska, A.; Sun, C.L.; Goltsman, D.S.A.; Wong, R.J.; Shaw, G.; et al. Temporal and Spatial Variation of the Human Microbiota during Pregnancy. Proc. Natl. Acad. Sci. USA 2015, 112, 11060–11065. [Google Scholar] [CrossRef] [PubMed]
- Balan, P.; Chong, Y.S.; Umashankar, S.; Swarup, S.; Loke, W.M.; Lopez, V.; He, H.G.; Seneviratne, C.J. Keystone Species in Pregnancy Gingivitis: A Snapshot of Oral Microbiome During Pregnancy and Postpartum Period. Front. Microbiol. 2018, 9, 2360. [Google Scholar] [CrossRef] [PubMed]
- Goltsman, D.S.A.; Sun, C.L.; Proctor, D.M.; DiGiulio, D.B.; Robaczewska, A.; Thomas, B.C.; Shaw, G.M.; Stevenson, D.K.; Holmes, S.P.; Banfield, J.F.; et al. Metagenomic Analysis with Strain-Level Resolution Reveals Fine-Scale Variation in the Human Pregnancy Microbiome. Genome Res. 2018, 28, 1467–1480. [Google Scholar] [CrossRef] [PubMed]
- Dunlop, A.L.; Knight, A.K.; Satten, G.A.; Cutler, A.J.; Wright, M.L.; Mitchell, R.M.; Read, T.D.; Mulle, J.; Hertzberg, V.S.; Hill, C.C.; et al. Stability of the Vaginal, Oral, and Gut Microbiota across Pregnancy among African American Women: The Effect of Socioeconomic Status and Antibiotic Exposure. PeerJ 2019, 7, e8004. [Google Scholar] [CrossRef] [PubMed]
- Fujiwara, N.; Tsuruda, K.; Iwamoto, Y.; Kato, F.; Odaki, T.; Yamane, N.; Hori, Y.; Harashima, Y.; Sakoda, A.; Tagaya, A.; et al. Significant Increase of Oral Bacteria in the Early Pregnancy Period in Japanese Women. J. Investig. Clin. Dent. 2017, 8, e12189. [Google Scholar] [CrossRef]
- Borgo, P.V.; Rodrigues, V.A.A.; Feitosa, A.C.R.; Xavier, K.C.B.; Avila-Campos, M.J. Association between Periodontal Condition and Subgingival Microbiota in Women during Pregnancy: A Longitudinal Study. J. Appl. Oral. Sci. 2014, 22, 528–533. [Google Scholar] [CrossRef]
- Sanford, J.A.; Gallo, R.L. Functions of the Skin Microbiota in Health and Disease. Semin. Immunol. 2013, 25, 370–377. [Google Scholar] [CrossRef]
- Di Simone, N.; Santamaria Ortiz, A.; Specchia, M.; Tersigni, C.; Villa, P.; Gasbarrini, A.; Scambia, G.; D’Ippolito, S. Recent Insights on the Maternal Microbiota: Impact on Pregnancy Outcomes. Front. Immunol. 2020, 11, 528202. [Google Scholar] [CrossRef]
- Ogai, K.; Nagase, S.; Mukai, K.; Iuchi, T.; Mori, Y.; Matsue, M.; Sugitani, K.; Sugama, J.; Okamoto, S. A Comparison of Techniques for Collecting Skin Microbiome Samples: Swabbing Versus Tape-Stripping. Front. Microbiol. 2018, 9, 2362. [Google Scholar] [CrossRef] [PubMed]
- Rushing, J. Obtaining a Wound Culture Specimen. Nursing 2007, 37, 18. [Google Scholar] [CrossRef] [PubMed]
- Edgar, R.C. Search and Clustering Orders of Magnitude Faster than BLAST. Bioinformatics 2010, 26, 2460–2461. [Google Scholar] [CrossRef] [PubMed]
- Martin, M. Cutadapt Removes Adapter Sequences from High-Throughput Sequencing Reads. EMBnet. J. 2011, 17, 10–12. [Google Scholar] [CrossRef]
- Bolger, A.M.; Lohse, M.; Usadel, B. Trimmomatic: A Flexible Trimmer for Illumina Sequence Data. Bioinformatics 2014, 30, 2114–2120. [Google Scholar] [CrossRef]
- Bolyen, E.; Rideout, J.R.; Dillon, M.R.; Bokulich, N.A.; Abnet, C.C.; Al-Ghalith, G.A.; Alexander, H.; Alm, E.J.; Arumugam, M.; Asnicar, F.; et al. Author Correction: Reproducible, Interactive, Scalable and Extensible Microbiome Data Science Using QIIME 2. Nat. Biotechnol. 2019, 37, 1091. [Google Scholar] [CrossRef] [PubMed]
- Callahan, B.J.; McMurdie, P.J.; Rosen, M.J.; Han, A.W.; Johnson, A.J.A.; Holmes, S.P. DADA2: High-Resolution Sample Inference from Illumina Amplicon Data. Nat. Methods 2016, 13, 581–583. [Google Scholar] [CrossRef] [PubMed]
- Ortiz-Burgos, S. Shannon-Weaver Diversity Index. In Encyclopedia of Estuaries; Kennish, M.J., Ed.; Springer: Dordrecht, The Netherlands, 2016; pp. 572–573. ISBN 978-94-017-8801-4. [Google Scholar]
- Faith, D.P. Conservation Evaluation and Phylogenetic Diversity. Biol. Conserv. 1992, 61, 1–10. [Google Scholar] [CrossRef]
- Bray, J.R.; Curtis, J.T. An Ordination of the Upland Forest Communities of Southern Wisconsin. Ecol. Monogr. 1957, 27, 326–349. [Google Scholar] [CrossRef]
- Douglas, G.M.; Maffei, V.J.; Zaneveld, J.R.; Yurgel, S.N.; Brown, J.R.; Taylor, C.M.; Huttenhower, C.; Langille, M.G.I. PICRUSt2 for Prediction of Metagenome Functions. Nat. Biotechnol. 2020, 38, 685–688. [Google Scholar] [CrossRef] [PubMed]
- Caspi, R.; Billington, R.; Keseler, I.M.; Kothari, A.; Krummenacker, M.; Midford, P.E.; Ong, W.K.; Paley, S.; Subhraveti, P.; Karp, P.D. The MetaCyc Database of Metabolic Pathways and Enzymes—A 2019 Update. Nucleic Acids Res. 2020, 48, D445–D453. [Google Scholar] [CrossRef] [PubMed]
- Faust, K.; Raes, J. CoNet App: Inference of Biological Association Networks Using Cytoscape. F1000Research 2016, 5, 1519. [Google Scholar] [CrossRef] [PubMed]
- Shannon, P.; Markiel, A.; Ozier, O.; Baliga, N.S.; Wang, J.T.; Ramage, D.; Amin, N.; Schwikowski, B.; Ideker, T. Cytoscape: A Software Environment for Integrated Models of Biomolecular Interaction Networks. Genome Res. 2003, 13, 2498–2504. [Google Scholar] [CrossRef] [PubMed]
- Su, G.; Kuchinsky, A.; Morris, J.H.; States, D.J.; Meng, F. GLay: Community Structure Analysis of Biological Networks. Bioinformatics 2010, 26, 3135–3137. [Google Scholar] [CrossRef] [PubMed]
- Marazzato, M.; Zicari, A.M.; Aleandri, M.; Conte, A.L.; Longhi, C.; Vitanza, L.; Bolognino, V.; Zagaglia, C.; De Castro, G.; Brindisi, G.; et al. 16S Metagenomics Reveals Dysbiosis of Nasal Core Microbiota in Children With Chronic Nasal Inflammation: Role of Adenoid Hypertrophy and Allergic Rhinitis. Front. Cell. Infect. Microbiol. 2020, 10, 458. [Google Scholar] [CrossRef] [PubMed]
- Lockitch, G. Clinical Biochemistry of Pregnancy. Crit. Rev. Clin. Lab. Sci. 1997, 34, 67–139. [Google Scholar] [CrossRef] [PubMed]
- Soma-Pillay, P.; Nelson-Piercy, C.; Tolppanen, H.; Mebazaa, A. Physiological Changes in Pregnancy. Cardiovasc. J. Afr. 2016, 27, 89–94. [Google Scholar] [CrossRef]
- Costello, E.K.; Carlisle, E.M.; Bik, E.M.; Morowitz, M.J.; Relman, D.A. Microbiome Assembly across Multiple Body Sites in Low-Birthweight Infants. mBio 2013, 4, e00782-13. [Google Scholar] [CrossRef]
- Underwood, M.A.; Sohn, K. The Microbiota of the Extremely Preterm Infant. Clin. Perinatol. 2017, 44, 407–427. [Google Scholar] [CrossRef]
- Visscher, M.O.; Adam, R.; Brink, S.; Odio, M. Newborn Infant Skin: Physiology, Development, and Care. Clin. Dermatol. 2015, 33, 271–280. [Google Scholar] [CrossRef]
- Evans, N.J.; Rutter, N. Development of the Epidermis in the Newborn. Biol. Neonate 1986, 49, 74–80. [Google Scholar] [CrossRef] [PubMed]
- Erdemir, A.; Kahramaner, Z.; Yuksel, Y.; Cosar, H.; Turkoglu, E.; Sutcuoglu, S.; Ozer, E.A.; Kose, S. The Effect of Topical Ointment on Neonatal Sepsis in Preterm Infants. J. Matern. Fetal Neonatal Med. 2015, 28, 33–36. [Google Scholar] [CrossRef]
- Ogasawara, M.; Matsuhisa, T.; Kondo, T.; Sato, J. Clinical Characteristics of Corynebacterium Simulans. Nagoya J. Med. Sci. 2021, 83, 269–276. [Google Scholar] [CrossRef]
- Duggleby, S.L.; Jackson, A.A. Protein, Amino Acid and Nitrogen Metabolism during Pregnancy: How Might the Mother Meet the Needs of Her Fetus? Curr. Opin. Clin. Nutr. Metab. Care 2002, 5, 503–509. [Google Scholar] [CrossRef]
- Yew, Y.W. Relationship of Atopic Dermatitis with Obesity and Its Related Inflammatory Metabolic Disturbances in an Adult General Population Cohort. Ph.D. Thesis, Nanyang Technological University, Singapore, 2020. [Google Scholar] [CrossRef]


| Topological Parameter | Control | Trim-I | Trim-II | Trim-III |
|---|---|---|---|---|
| Nodes | 25 | 26 | 15 | 11 |
| Edges | 83 | 67 | 19 | 13 |
| Edges/node ratio | 3.32 | 2.57 | 1.27 | 1.18 |
| Synergisms | 60 | 53 | 13 | 9 |
| Exclusions | 23 | 14 | 6 | 4 |
| Syn/Escl ratio | 2.61 | 3.78 | 2.1 | 2.2 |
| Average number of neighbors | 3.76 | 4.23 | 2.4 | 2.1 |
Disclaimer/Publisher’s Note: The statements, opinions and data contained in all publications are solely those of the individual author(s) and contributor(s) and not of MDPI and/or the editor(s). MDPI and/or the editor(s) disclaim responsibility for any injury to people or property resulting from any ideas, methods, instructions or products referred to in the content. |
© 2024 by the authors. Licensee MDPI, Basel, Switzerland. This article is an open access article distributed under the terms and conditions of the Creative Commons Attribution (CC BY) license (https://creativecommons.org/licenses/by/4.0/).
Share and Cite
Radocchia, G.; Brunetti, F.; Marazzato, M.; Totino, V.; Neroni, B.; Bonfiglio, G.; Conte, A.L.; Pantanella, F.; Ciolli, P.; Schippa, S. Women Skin Microbiota Modifications during Pregnancy. Microorganisms 2024, 12, 808. https://doi.org/10.3390/microorganisms12040808
Radocchia G, Brunetti F, Marazzato M, Totino V, Neroni B, Bonfiglio G, Conte AL, Pantanella F, Ciolli P, Schippa S. Women Skin Microbiota Modifications during Pregnancy. Microorganisms. 2024; 12(4):808. https://doi.org/10.3390/microorganisms12040808
Chicago/Turabian StyleRadocchia, Giulia, Francesca Brunetti, Massimiliano Marazzato, Valentina Totino, Bruna Neroni, Giulia Bonfiglio, Antonietta Lucia Conte, Fabrizio Pantanella, Paola Ciolli, and Serena Schippa. 2024. "Women Skin Microbiota Modifications during Pregnancy" Microorganisms 12, no. 4: 808. https://doi.org/10.3390/microorganisms12040808
APA StyleRadocchia, G., Brunetti, F., Marazzato, M., Totino, V., Neroni, B., Bonfiglio, G., Conte, A. L., Pantanella, F., Ciolli, P., & Schippa, S. (2024). Women Skin Microbiota Modifications during Pregnancy. Microorganisms, 12(4), 808. https://doi.org/10.3390/microorganisms12040808