
Two-Year Study on the Intra-Individual Dynamics of Gut Microbiota and Short-Chain Fatty Acids Profiles in Healthy Adults

 , , , , , ,
Abstract
1. Introduction
2. Materials and Methods
2.1. Design of the Study
- Refusal to give informed consent.
- Presence of diseases/conditions such as recent surgery, current cancer or infectious disease, inflammatory bowel disease, acute relapse of any chronic disease, mental illness, type 1 and 2 diabetes, malabsorption syndrome associated with established disease of the small intestine or pancreas.
- Immunodeficiency conditions.
- Presence of diarrhea (with a stool frequency of more than 3 times a day) for at least 3 consecutive days during the last month.
- Taking of probiotics, prebiotics, antibiotics, cytostatics, glucocorticosteroids, and immunosuppressants 6 months before the start of the study.
- Donation of blood or its components within three months before the start of the study.
- Regular smoking and/or alcohol consumption (2 weeks prior to screening).
- Pregnancy or lactation.
2.2. 16S rRNA Sequencing and Analysis
2.3. Determination of SCFA in Feces
2.4. Statistical Analysis
3. Results
3.1. Gut Microbial Community Analysis
3.1.1. Alpha Diversity Indices
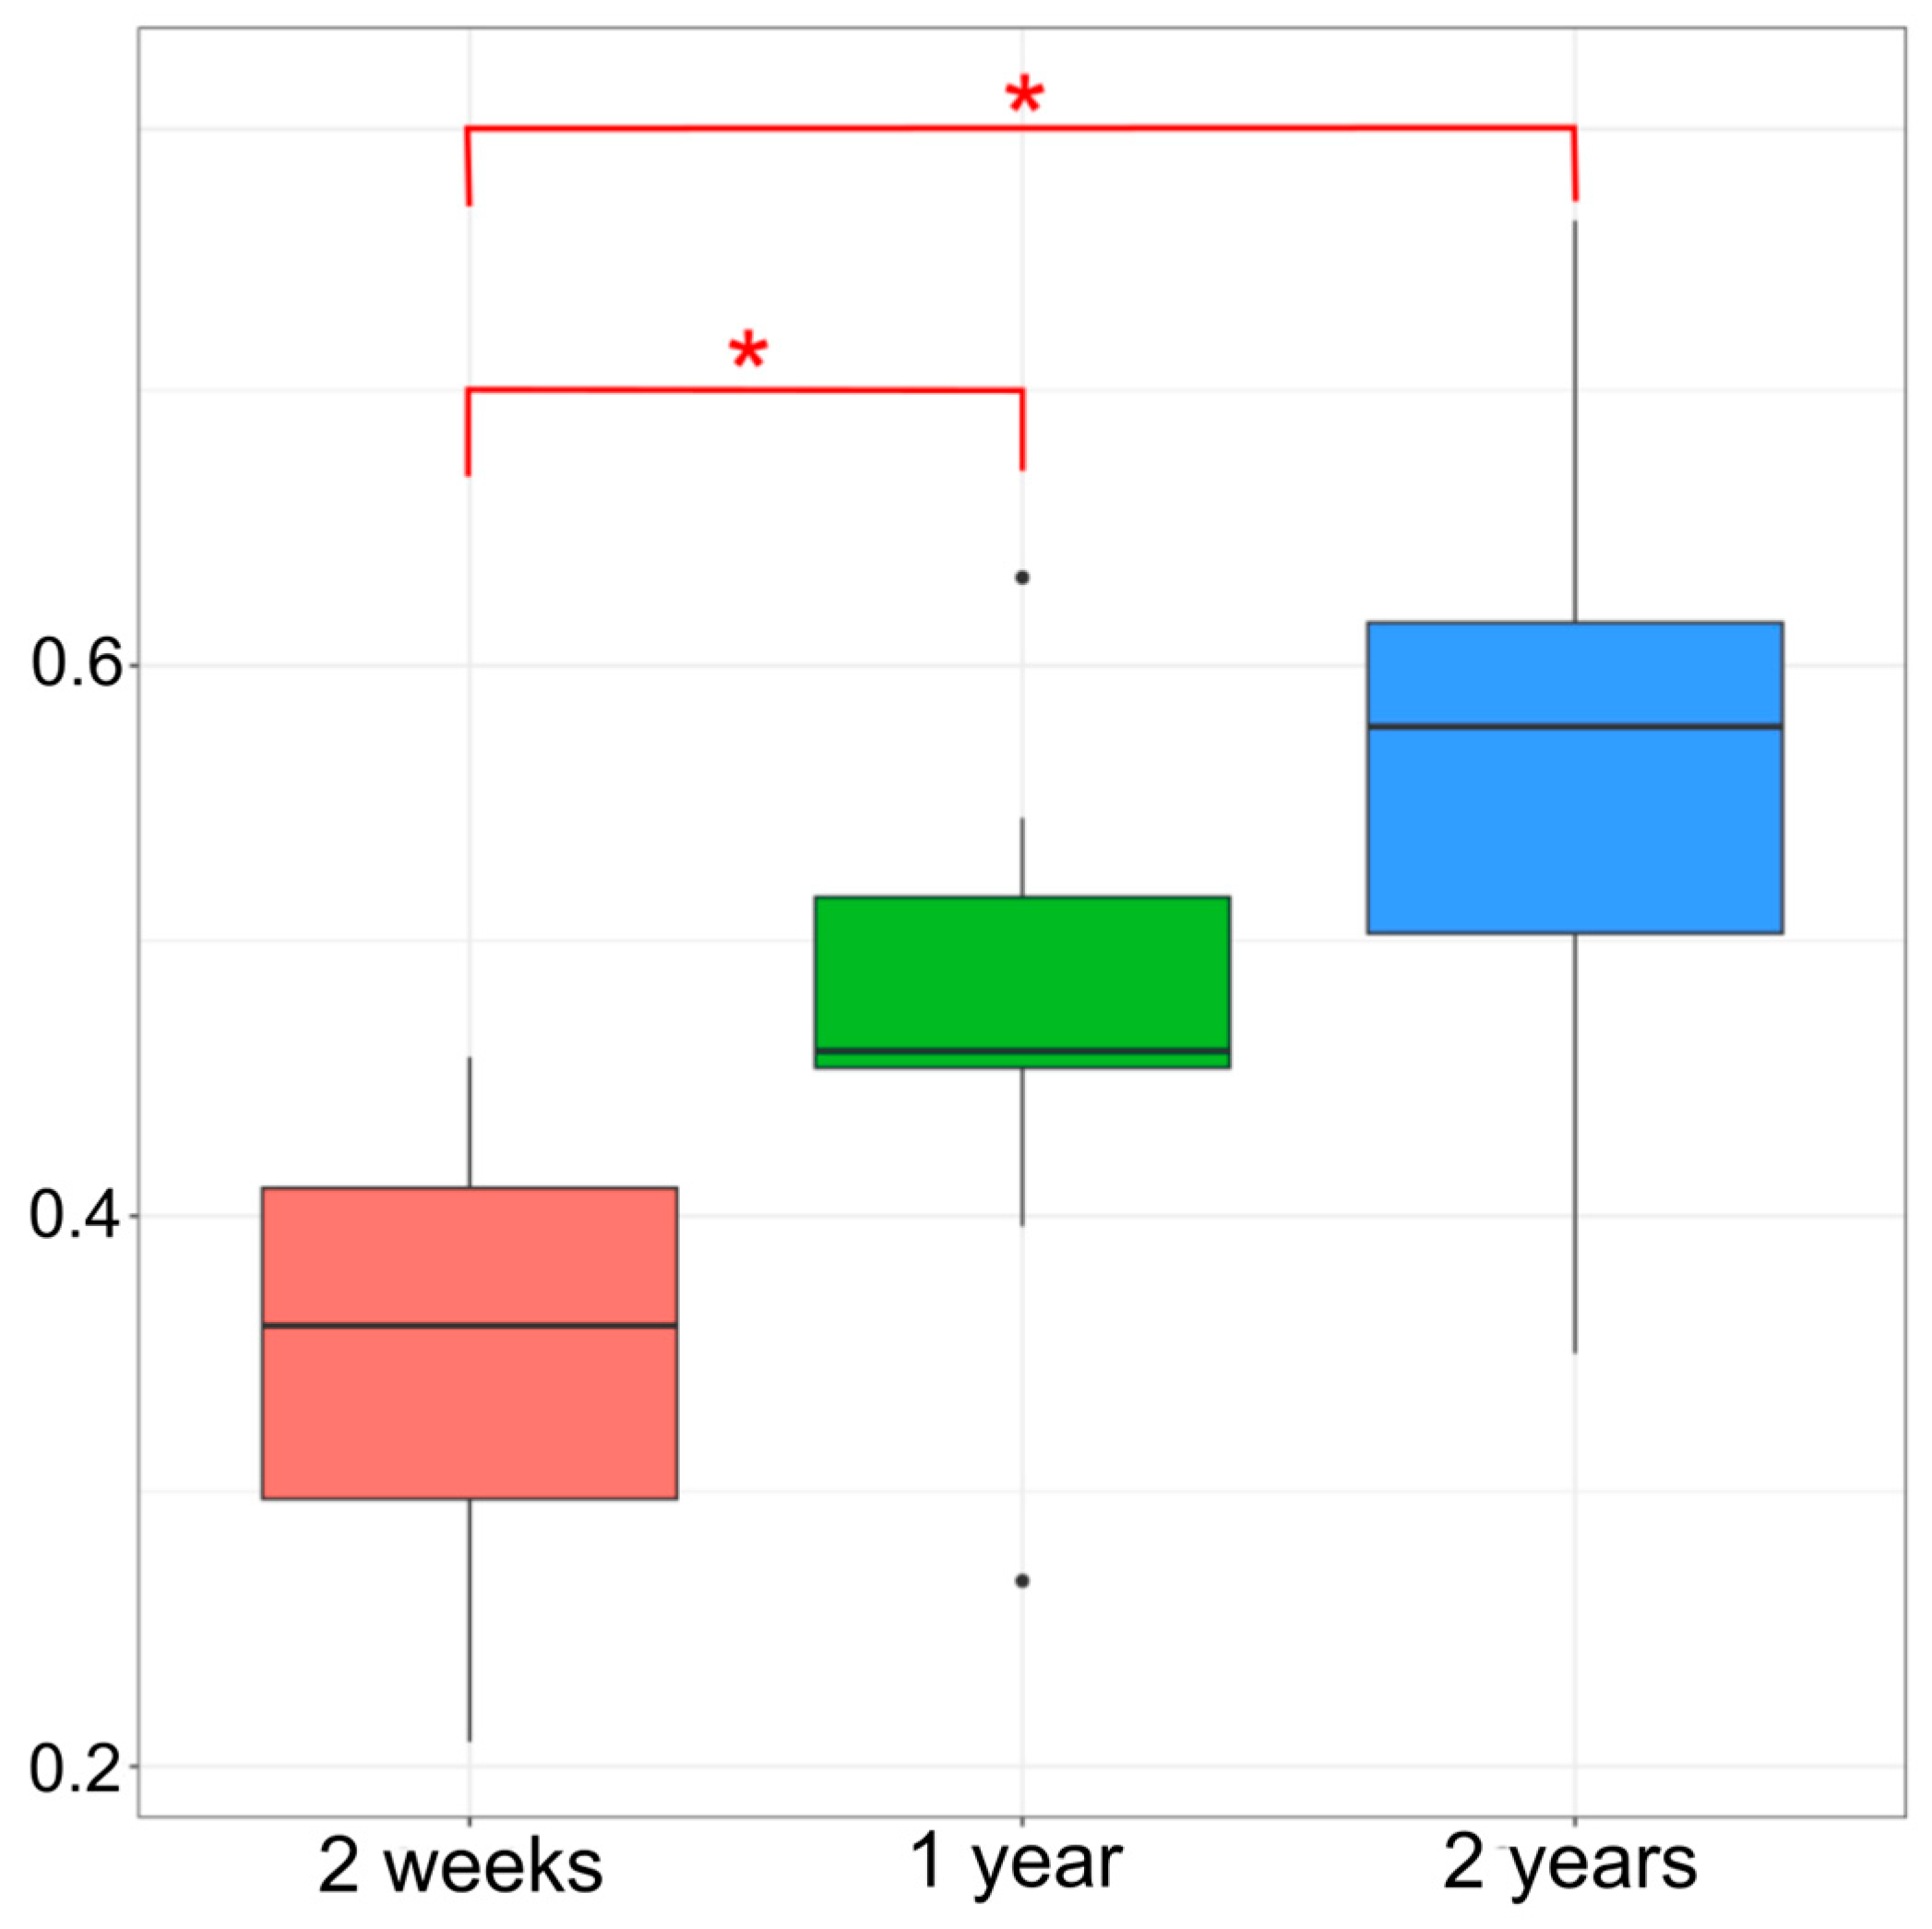
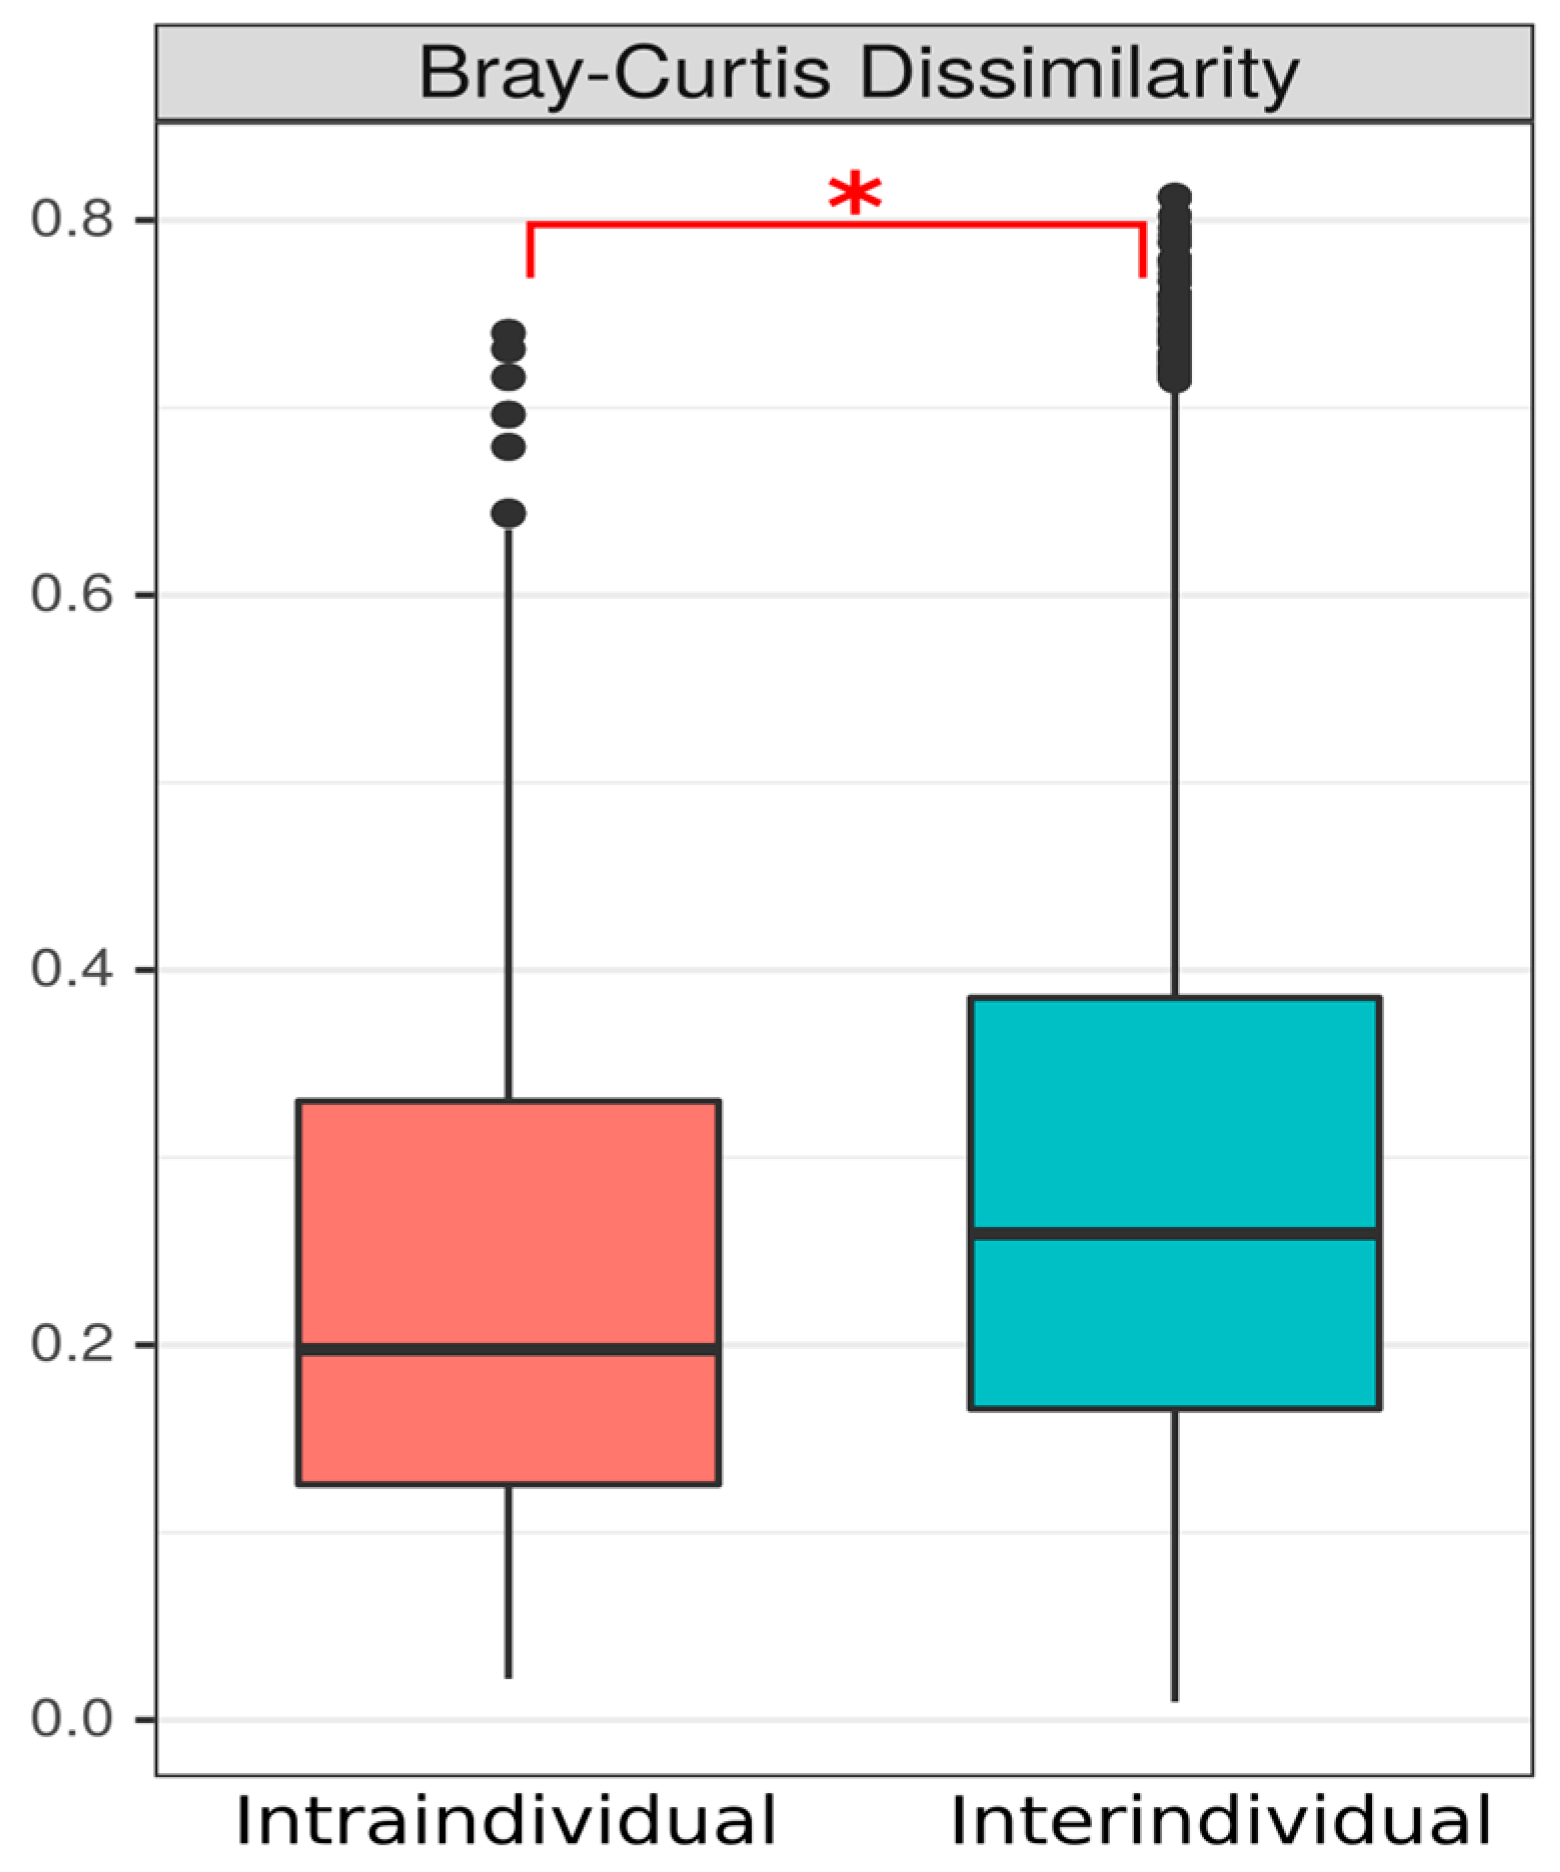
3.1.2. Beta Diversity Indices
3.1.3. Taxonomic Analysis
3.2. Short-Chain Fatty Acids
3.3. Seasonal Changes in the Bacterial Community and SCAFs of the Gut Microbiota
4. Discussion
5. Conclusions
Supplementary Materials
Author Contributions
Funding
Data Availability Statement
Conflicts of Interest
References
- Adak, A.; Khan, M.R. An Insight into Gut Microbiota and Its Functionalities. Cell. Mol. Life Sci. 2019, 76, 473–493. [Google Scholar] [CrossRef]
- Neuman, H.; Debelius, J.W.; Knight, R.; Koren, O. Microbial Endocrinology: The Interplay between the Microbiota and the Endocrine System. FEMS Microbiol. Rev. 2015, 39, 509–521. [Google Scholar] [CrossRef] [PubMed]
- Haiser, H.J.; Gootenberg, D.B.; Chatman, K.; Sirasani, G.; Balskus, E.P.; Turnbaugh, P.J. Predicting and Manipulating Cardiac Drug Inactivation by the Human Gut Bacterium Eggerthella Lenta. Science 2013, 341, 295–298. [Google Scholar] [CrossRef]
- Pant, A.; Maiti, T.K.; Mahajan, D.; Das, B. Human Gut Microbiota and Drug Metabolism. Microb. Ecol. 2023, 86, 97–111. [Google Scholar] [CrossRef] [PubMed]
- Sjögren, K.; Engdahl, C.; Henning, P.; Lerner, U.H.; Tremaroli, V.; Lagerquist, M.K.; Bäckhed, F.; Ohlsson, C. The Gut Microbiota Regulates Bone Mass in Mice. J. Bone Miner. Res. 2012, 27, 1357–1367. [Google Scholar] [CrossRef]
- Gomaa, E.Z. Human Gut Microbiota/Microbiome in Health and Diseases: A Review. Antonie Van Leeuwenhoek 2020, 113, 2019–2040. [Google Scholar] [CrossRef] [PubMed]
- Desai, M.S.; Seekatz, A.M.; Koropatkin, N.M.; Kamada, N.; Hickey, C.A.; Wolter, M.; Pudlo, N.A.; Kitamoto, S.; Terrapon, N.; Muller, A. A Dietary Fiber-Deprived Gut Microbiota Degrades the Colonic Mucus Barrier and Enhances Pathogen Susceptibility. Cell 2016, 167, 1339–1353. [Google Scholar] [CrossRef]
- Perler, B.K.; Friedman, E.S.; Wu, G.D. The Role of the Gut Microbiota in the Relationship between Diet and Human Health. Annu. Rev. Physiol. 2023, 85, 449–468. [Google Scholar] [CrossRef]
- Matenchuk, B.A.; Mandhane, P.J.; Kozyrskyj, A.L. Sleep, Circadian Rhythm, and Gut Microbiota. Sleep. Med. Rev. 2020, 53, 101340. [Google Scholar] [CrossRef]
- Schoeler, M.; Caesar, R. Dietary Lipids, Gut Microbiota and Lipid Metabolism. Rev. Endocr. Metab. Disord. 2019, 20, 461–472. [Google Scholar] [CrossRef]
- Chen, Y.; Zhou, J.; Wang, L. Role and Mechanism of Gut Microbiota in Human Disease. Front. Cell. Infect. Microbiol. 2021, 11, 625913. [Google Scholar] [CrossRef] [PubMed]
- Góralczyk-Bińkowska, A.; Szmajda-Krygier, D.; Kozłowska, E. The Microbiota–Gut–Brain Axis in Psychiatric Disorders. Int. J. Mol. Sci. 2022, 23, 11245. [Google Scholar] [CrossRef]
- Li, X.S.; Obeid, S.; Klingenberg, R.; Gencer, B.; Mach, F.; Räber, L.; Windecker, S.; Rodondi, N.; Nanchen, D.; Muller, O. Gut Microbiota-Dependent Trimethylamine N-Oxide in Acute Coronary Syndromes: A Prognostic Marker for Incident Cardiovascular Events beyond Traditional Risk Factors. Eur. Heart J. 2017, 38, 814–824. [Google Scholar] [CrossRef] [PubMed]
- Robles-Vera, I.; Toral, M.; Romero, M.; Jiménez, R.; Sánchez, M.; Pérez-Vizcaíno, F.; Duarte, J. Antihypertensive Effects of Probiotics. Curr. Hypertens. Rep. 2017, 19, 26. [Google Scholar] [CrossRef] [PubMed]
- Kho, Z.Y.; Lal, S.K. The Human Gut Microbiome–a Potential Controller of Wellness and Disease. Front. Microbiol. 2018, 9, 1835. [Google Scholar] [CrossRef] [PubMed]
- Illiano, P.; Brambilla, R.; Parolini, C. The Mutual Interplay of Gut Microbiota, Diet and Human Disease. FEBS J. 2020, 287, 833–855. [Google Scholar] [CrossRef] [PubMed]
- Fan, Y.; Pedersen, O. Gut Microbiota in Human Metabolic Health and Disease. Nat. Rev. Microbiol. 2021, 19, 55–71. [Google Scholar] [CrossRef]
- Morais, L.H.; Schreiber IV, H.L.; Mazmanian, S.K. The Gut Microbiota–Brain Axis in Behaviour and Brain Disorders. Nat. Rev. Microbiol. 2021, 19, 241–255. [Google Scholar] [CrossRef] [PubMed]
- Koh, A.; De Vadder, F.; Kovatcheva-Datchary, P.; Bäckhed, F. From Dietary Fiber to Host Physiology: Short-Chain Fatty Acids as Key Bacterial Metabolites. Cell 2016, 165, 1332–1345. [Google Scholar] [CrossRef]
- Campos-Perez, W.; Martinez-Lopez, E. Effects of Short Chain Fatty Acids on Metabolic and Inflammatory Processes in Human Health. Biochim. Et. Biophys. Acta (BBA)-Mol. Cell Biol. Lipids 2021, 1866, 158900. [Google Scholar] [CrossRef] [PubMed]
- Tsukuda, N.; Yahagi, K.; Hara, T.; Watanabe, Y.; Matsumoto, H.; Mori, H.; Higashi, K.; Tsuji, H.; Matsumoto, S.; Kurokawa, K. Key Bacterial Taxa and Metabolic Pathways Affecting Gut Short-Chain Fatty Acid Profiles in Early Life. ISME J. 2021, 15, 2574–2590. [Google Scholar] [CrossRef] [PubMed]
- Parada Venegas, D.; De la Fuente, M.K.; Landskron, G.; González, M.J.; Quera, R.; Dijkstra, G.; Harmsen, H.J.M.; Faber, K.N.; Hermoso, M.A. Short Chain Fatty Acids (SCFAs)-Mediated Gut Epithelial and Immune Regulation and Its Relevance for Inflammatory Bowel Diseases. Front. Immunol. 2019, 10, 277. [Google Scholar]
- Fernández-Navarro, T.; Díaz, I.; Gutiérrez-Díaz, I.; Rodríguez-Carrio, J.; Suárez, A.; de Los Reyes-Gavilán, C.G.; Gueimonde, M.; Salazar, N.; González, S. Exploring the Interactions between Serum Free Fatty Acids and Fecal Microbiota in Obesity through a Machine Learning Algorithm. Food Res. Int. 2019, 121, 533–541. [Google Scholar] [CrossRef]
- De Filippis, F.; Pellegrini, N.; Vannini, L.; Jeffery, I.B.; La Storia, A.; Laghi, L.; Serrazanetti, D.I.; Di Cagno, R.; Ferrocino, I.; Lazzi, C. High-Level Adherence to a Mediterranean Diet Beneficially Impacts the Gut Microbiota and Associated Metabolome. Gut 2016, 65, 1812–1821. [Google Scholar] [CrossRef] [PubMed]
- Zhang, C.; Björkman, A.; Cai, K.; Liu, G.; Wang, C.; Li, Y.; Xia, H.; Sun, L.; Kristiansen, K.; Wang, J. Impact of a 3-Months Vegetarian Diet on the Gut Microbiota and Immune Repertoire. Front. Immunol. 2018, 9, 908. [Google Scholar] [CrossRef] [PubMed]
- Zoetendal, E.G.; Akkermans, A.D.L.; De Vos, W.M. Temperature Gradient Gel Electrophoresis Analysis of 16S RRNA from Human Fecal Samples Reveals Stable and Host-Specific Communities of Active Bacteria. Appl. Environ. Microbiol. 1998, 64, 3854–3859. [Google Scholar] [CrossRef]
- Costello, E.K.; Lauber, C.L.; Hamady, M.; Fierer, N.; Gordon, J.I.; Knight, R. Bacterial Community Variation in Human Body Habitats across Space and Time. Science 2009, 326, 1694–1697. [Google Scholar] [CrossRef]
- Rajilić-Stojanović, M.; Heilig, H.G.H.J.; Tims, S.; Zoetendal, E.G.; de Vos, W.M. Long-term Monitoring of the Human Intestinal Microbiota Composition. Environ. Microbiol. 2013, 15, 1146–1159. [Google Scholar] [CrossRef]
- David, L.A.; Materna, A.C.; Friedman, J.; Campos-Baptista, M.I.; Blackburn, M.C.; Perrotta, A.; Erdman, S.E.; Alm, E.J. Host Lifestyle Affects Human Microbiota on Daily Timescales. Genome Biol. 2014, 15, R89. [Google Scholar] [CrossRef]
- Ding, T.; Schloss, P.D. Dynamics and Associations of Microbial Community Types across the Human Body. Nature 2014, 509, 357–360. [Google Scholar] [CrossRef]
- Voigt, A.Y.; Costea, P.I.; Kultima, J.R.; Li, S.S.; Zeller, G.; Sunagawa, S.; Bork, P. Temporal and Technical Variability of Human Gut Metagenomes. Genome Biol. 2015, 16, 73. [Google Scholar] [CrossRef]
- Mehta, R.S.; Abu-Ali, G.S.; Drew, D.A.; Lloyd-Price, J.; Subramanian, A.; Lochhead, P.; Joshi, A.D.; Ivey, K.L.; Khalili, H.; Brown, G.T. Stability of the Human Faecal Microbiome in a Cohort of Adult Men. Nat. Microbiol. 2018, 3, 347–355. [Google Scholar] [CrossRef]
- Flores, G.E.; Caporaso, J.G.; Henley, J.B.; Rideout, J.R.; Domogala, D.; Chase, J.; Leff, J.W.; Vázquez-Baeza, Y.; Gonzalez, A.; Knight, R. Temporal Variability Is a Personalized Feature of the Human Microbiome. Genome Biol. 2014, 15, 531. [Google Scholar] [CrossRef]
- Caporaso, J.G.; Lauber, C.L.; Costello, E.K.; Berg-Lyons, D.; Gonzalez, A.; Stombaugh, J.; Knights, D.; Gajer, P.; Ravel, J.; Fierer, N. Moving Pictures of the Human Microbiome. Genome Biol. 2011, 12, R50. [Google Scholar] [CrossRef] [PubMed]
- Lozupone, C.A.; Stombaugh, J.I.; Gordon, J.I.; Jansson, J.K.; Knight, R. Diversity, Stability and Resilience of the Human Gut Microbiota. Nature 2012, 489, 220–230. [Google Scholar] [CrossRef] [PubMed]
- Vandeputte, D.; De Commer, L.; Tito, R.Y.; Kathagen, G.; Sabino, J.; Vermeire, S.; Faust, K.; Raes, J. Temporal Variability in Quantitative Human Gut Microbiome Profiles and Implications for Clinical Research. Nat. Commun. 2021, 12, 6740. [Google Scholar] [CrossRef]
- Olsson, L.M.; Boulund, F.; Nilsson, S.; Khan, M.T.; Gummesson, A.; Fagerberg, L.; Engstrand, L.; Perkins, R.; Uhlén, M.; Bergström, G.; et al. Dynamics of the Normal Gut Microbiota: A Longitudinal One-Year Population Study in Sweden. Cell Host Microbe 2022, 30, 726–739.e3. [Google Scholar] [CrossRef] [PubMed]
- Zmora, N.; Zilberman-Schapira, G.; Suez, J.; Mor, U.; Dori-Bachash, M.; Bashiardes, S.; Kotler, E.; Zur, M.; Regev-Lehavi, D.; Brik, R.B.-Z. Personalized Gut Mucosal Colonization Resistance to Empiric Probiotics Is Associated with Unique Host and Microbiome Features. Cell 2018, 174, 1388–1405. [Google Scholar] [CrossRef]
- Maldonado-Gómez, M.X.; Martínez, I.; Bottacini, F.; O’Callaghan, A.; Ventura, M.; van Sinderen, D.; Hillmann, B.; Vangay, P.; Knights, D.; Hutkins, R.W. Stable Engraftment of Bifidobacterium Longum AH1206 in the Human Gut Depends on Individualized Features of the Resident Microbiome. Cell Host Microbe 2016, 20, 515–526. [Google Scholar] [CrossRef]
- Berry, D. Making It Stick: A Compelling Case for Precision Microbiome Reconstitution. Cell Host Microbe 2016, 20, 415–417. [Google Scholar] [CrossRef]
- Siniagina, M.N.; Laikov, A.V.; Markelova, M.I.; Boulygina, E.A.; Khusnutdinova, D.R.; Abdulkhakov, S.R.; Grigoryeva, T.V. Competitive Ability of Escherichia Coli Strains in the Intestinal Microbiota of Patients with Crohn’s Disease and Healthy Volunteers: Physiological, Biochemical and Genetic Characteristics. J. Microbiol. Epidemiol. Immunobiol. 2022, 99, 669–681. [Google Scholar] [CrossRef]
- Klinder, A.; Shen, Q.; Heppel, S.; Lovegrove, J.A.; Rowland, I.; Tuohy, K.M. Impact of Increasing Fruit and Vegetables and Flavonoid Intake on the Human Gut Microbiota. Food Funct. 2016, 7, 1788–1796. [Google Scholar] [CrossRef]
- Yadav, M.K.; Kumari, I.; Singh, B.; Sharma, K.K.; Tiwari, S.K. Probiotics, Prebiotics and Synbiotics: Safe Options for next-Generation Therapeutics. Appl. Microbiol. Biotechnol. 2022, 106, 505–521. [Google Scholar] [CrossRef] [PubMed]
- Wieërs, G.; Belkhir, L.; Enaud, R.; Leclercq, S.; Philippart de Foy, J.-M.; Dequenne, I.; de Timary, P.; Cani, P.D. How Probiotics Affect the Microbiota. Front. Cell. Infect. Microbiol. 2020, 9, 454. [Google Scholar] [CrossRef]
- Callahan, B.J.; McMurdie, P.J.; Rosen, M.J.; Han, A.W.; Johnson, A.J.A.; Dada, S.P.H. High-Resolution Sample Inference from Illumina Amplicon Data. Nat. Methods 2016, 13, 581–583. [Google Scholar] [CrossRef]
- McDonald, D.; Jiang, Y.; Balaban, M.; Cantrell, K.; Zhu, Q.; Gonzalez, A.; Morton, J.T.; Nicolaou, G.; Parks, D.H.; Karst, S. Greengenes2 Enables a Shared Data Universe for Microbiome Studies. bioRxiv 2022. [Google Scholar] [CrossRef]
- Niccolai, E.; Baldi, S.; Ricci, F.; Russo, E.; Nannini, G.; Menicatti, M.; Poli, G.; Taddei, A.; Bartolucci, G.; Calabrò, A.S. Evaluation and Comparison of Short Chain Fatty Acids Composition in Gut Diseases. World J. Gastroenterol. 2019, 25, 5543. [Google Scholar] [CrossRef]
- Zhao, X.; Jiang, Z.; Yang, F.; Wang, Y.; Gao, X.; Wang, Y.; Chai, X.; Pan, G.; Zhu, Y. Sensitive and Simplified Detection of Antibiotic Influence on the Dynamic and Versatile Changes of Fecal Short-Chain Fatty Acids. PLoS ONE 2016, 11, e0167032. [Google Scholar] [CrossRef]
- Thukral, A.K. A Review on Measurement of Alpha Diversity in Biology. Agric. Res. J. 2017, 54, 1–10. [Google Scholar] [CrossRef]
- Wagner, B.D.; Grunwald, G.K.; Zerbe, G.O.; Mikulich-Gilbertson, S.K.; Robertson, C.E.; Zemanick, E.T.; Harris, J.K. On the Use of Diversity Measures in Longitudinal Sequencing Studies of Microbial Communities. Front. Microbiol. 2018, 9, 1037. [Google Scholar] [CrossRef] [PubMed]
- Siniagina, M.N.; Markelova, M.I.; Boulygina, E.A.; Laikov, A.V.; Khusnutdinova, D.R.; Abdulkhakov, S.R.; Danilova, N.A.; Odintsova, A.H.; Abdulkhakov, R.A.; Grigoryeva, T.V. Diversity and Adaptations of Escherichia Coli Strains: Exploring the Intestinal Community in Crohn’s Disease Patients and Healthy Individuals. Microorganisms 2021, 9, 1299. [Google Scholar] [CrossRef]
- Markelova, M.; Senina, A.; Khusnutdinova, D.; Siniagina, M.; Kupriyanova, E.; Shakirova, G.; Odintsova, A.; Abdulkhakov, R.; Kolesnikova, I.; Shagaleeva, O.; et al. Association between Taxonomic Composition of Gut Microbiota and Host Single Nucleotide Polymorphisms in Crohn’s Disease Patients from Russia. Int. J. Mol. Sci. 2023, 24, 7998. [Google Scholar] [CrossRef] [PubMed]
- Sun, B.; Wang, X.; Bernstein, S.; Huffman, M.A.; Xia, D.P.; Gu, Z.; Chen, R.; Sheeran, L.K.; Wagner, R.S.; Li, J. Marked Variation between Winter and Spring Gut Microbiota in Free-Ranging Tibetan Macaques (Macaca thibetana). Sci. Rep. 2016, 6, 26035. [Google Scholar] [CrossRef]
- Davenport, E.R.; Mizrahi-Man, O.; Michelini, K.; Barreiro, L.B.; Ober, C.; Gilad, Y. Seasonal Variation in Human Gut Microbiome Composition. PLoS ONE 2014, 9, e90731. [Google Scholar] [CrossRef]
- Chen, L.; Wang, D.; Garmaeva, S.; Kurilshikov, A.; Vila, A.V.; Gacesa, R.; Sinha, T.; Segal, E.; Weersma, R.K.; Wijmenga, C. The Long-Term Genetic Stability and Individual Specificity of the Human Gut Microbiome. Cell 2021, 184, 2302–2315. [Google Scholar] [CrossRef]
- Jakobsson, H.E.; Jernberg, C.; Andersson, A.F.; Sjölund-Karlsson, M.; Jansson, J.K.; Engstrand, L. Short-Term Antibiotic Treatment Has Differing Long-Term Impacts on the Human Throat and Gut Microbiome. PLoS ONE 2010, 5, e9836. [Google Scholar] [CrossRef] [PubMed]
- Faith, J.J.; Guruge, J.L.; Charbonneau, M.; Subramanian, S.; Seedorf, H.; Goodman, A.L.; Clemente, J.C.; Knight, R.; Heath, A.C.; Leibel, R.L. The Long-Term Stability of the Human Gut Microbiota. Science 2013, 341, 1237439. [Google Scholar] [CrossRef] [PubMed]
- Gupta, V.K.; Paul, S.; Dutta, C. Geography, Ethnicity or Subsistence-Specific Variations in Human Microbiome Composition and Diversity. Front. Microbiol. 2017, 8, 1162. [Google Scholar] [CrossRef]
- Yatsunenko, T.; Rey, F.E.; Manary, M.J.; Trehan, I.; Dominguez-Bello, M.G.; Contreras, M.; Magris, M.; Hidalgo, G.; Baldassano, R.N.; Anokhin, A.P.; et al. Human Gut Microbiome Viewed across Age and Geography. Nature 2012, 486, 222–227. [Google Scholar] [CrossRef]
- Markowiak-Kopeć, P.; Śliżewska, K. The Effect of Probiotics on the Production of Short-Chain Fatty Acids by Human Intestinal Microbiome. Nutrients 2020, 12, 1107. [Google Scholar] [CrossRef]
- Rivera-Piza, A.; Lee, S.-J. Effects of Dietary Fibers and Prebiotics in Adiposity Regulation via Modulation of Gut Microbiota. Appl. Biol. Chem. 2020, 63, 2. [Google Scholar] [CrossRef]
- Clarke, S.F.; Murphy, E.F.; Nilaweera, K.; Ross, P.R.; Shanahan, F.; O’Toole, P.W.; Cotter, P.D. The Gut Microbiota and Its Relationship to Diet and Obesity: New Insights. Gut Microbes 2012, 3, 186–202. [Google Scholar] [CrossRef]
- Magne, F.; Gotteland, M.; Gauthier, L.; Zazueta, A.; Pesoa, S.; Navarrete, P.; Balamurugan, R. The Firmicutes/Bacteroidetes Ratio: A Relevant Marker of Gut Dysbiosis in Obese Patients? Nutrients 2020, 12, 1474. [Google Scholar] [CrossRef]
- Castaner, O.; Goday, A.; Park, Y.-M.; Lee, S.-H.; Magkos, F.; Shiow, S.-A.T.E.; Schröder, H. The Gut Microbiome Profile in Obesity: A Systematic Review. Int. J. Endocrinol. 2018, 2018, 4095789. [Google Scholar] [CrossRef]
- Byrd, A.L.; Liu, M.; Fujimura, K.E.; Lyalina, S.; Nagarkar, D.R.; Charbit, B.; Bergstedt, J.; Patin, E.; Harrison, O.J.; Quintana-Murci, L. Gut Microbiome Stability and Dynamics in Healthy Donors and Patients with Non-Gastrointestinal Cancers. J. Exp. Med. 2021, 218, e20200606. [Google Scholar] [CrossRef] [PubMed]
- The, H.C.; Le, S.-N.H. Dynamic of the Human Gut Microbiome under Infectious Diarrhea. Curr. Opin. Microbiol. 2022, 66, 79–85. [Google Scholar]
- Lo Sasso, G.; Khachatryan, L.; Kondylis, A.; Battey, J.N.D.; Sierro, N.; Danilova, N.A.; Grigoryeva, T.V.; Markelova, M.I.; Khusnutdinova, D.R.; Laikov, A.V.; et al. Inflammatory Bowel Disease–Associated Changes in the Gut: Focus on Kazan Patients. Inflamm. Bowel Dis. 2021, 27, 418–433. [Google Scholar] [CrossRef]
- Duncan, S.H.; Lobley, G.E.; Holtrop, G.; Ince, J.; Johnstone, A.M.; Louis, P.; Flint, H.J. Human Colonic Microbiota Associated with Diet, Obesity and Weight Loss. Int. J. Obes. 2008, 32, 1720–1724. [Google Scholar] [CrossRef]
- Sze, M.A.; Schloss, P.D. Looking for a Signal in the Noise: Revisiting Obesity and the Microbiome. mBio 2016, 7, 10–1128. [Google Scholar] [CrossRef]
- Finucane, M.M.; Sharpton, T.J.; Laurent, T.J.; Pollard, K.S. A Taxonomic Signature of Obesity in the Microbiome? Getting to the Guts of the Matter. PLoS ONE 2014, 9, e84689. [Google Scholar] [CrossRef]
- Zeng, H.; Ishaq, S.L.; Zhao, F.-Q.; Wright, A.-D.G. Colonic Inflammation Accompanies an Increase of β-Catenin Signaling and Lachnospiraceae/Streptococcaceae Bacteria in the Hind Gut of High-Fat Diet-Fed Mice. J. Nutr. Biochem. 2016, 35, 30–36. [Google Scholar] [CrossRef]
- Zhang, Y.-L.; Cai, L.-T.; Qi, J.-Y.; Lin, Y.-Z.; Dai, Y.-C.; Jiao, N.; Chen, Y.-L.; Zheng, L.; Wang, B.-B.; Zhu, L.-X. Gut Microbiota Contributes to the Distinction between Two Traditional Chinese Medicine Syndromes of Ulcerative Colitis. World J. Gastroenterol. 2019, 25, 3242. [Google Scholar] [CrossRef] [PubMed]
- Rocha, J.M.; Malcata, F.X. Microbiological Profile of Maize and Rye Flours, and Sourdough Used for the Manufacture of Traditional Portuguese Bread. Food Microbiol. 2012, 31, 72–88. [Google Scholar] [CrossRef] [PubMed]
- Van den Berghe, E.; Skourtas, G.; Tsakalidou, E.; De Vuyst, L. Streptococcus Macedonicus ACA-DC 198 Produces the Lantibiotic, Macedocin, at Temperature and PH Conditions That Prevail during Cheese Manufacture. Int. J. Food Microbiol. 2006, 107, 138–147. [Google Scholar] [CrossRef] [PubMed]
- Hric, I.; Ugrayová, S.; Penesová, A.; Rádiková, Ž.; Kubáňová, L.; Šardzíková, S.; Baranovičová, E.; Klučár, Ľ.; Beke, G.; Grendar, M. The Efficacy of Short-Term Weight Loss Programs and Consumption of Natural Probiotic Bryndza Cheese on Gut Microbiota Composition in Women. Nutrients 2021, 13, 1753. [Google Scholar] [CrossRef]
- Duranti, S.; Ruiz, L.; Lugli, G.A.; Tames, H.; Milani, C.; Mancabelli, L.; Mancino, W.; Longhi, G.; Carnevali, L.; Sgoifo, A. Bifidobacterium adolescentis as a Key Member of the Human Gut Microbiota in the Production of GABA. Sci. Rep. 2020, 10, 14112. [Google Scholar] [CrossRef]
- Lee, D.K.; Jang, S.; Kim, M.J.; Kim, J.H.; Chung, M.J.; Kim, K.J.; Ha, N.J. Anti-Proliferative Effects of Bifidobacterium adolescentis SPM0212 Extract on Human Colon Cancer Cell Lines. BMC Cancer 2008, 8, 310. [Google Scholar] [CrossRef]
- Roberts, J.L.; Liu, G.; Darby, T.M.; Fernandes, L.M.; Diaz-Hernandez, M.E.; Jones, R.M.; Drissi, H. Bifidobacterium adolescentis Supplementation Attenuates Fracture-Induced Systemic Sequelae. Biomed. Pharmacother. 2020, 132, 110831. [Google Scholar] [CrossRef]
- Blaak, E.E.; Canfora, E.E.; Theis, S.; Frost, G.; Groen, A.K.; Mithieux, G.; Nauta, A.; Scott, K.; Stahl, B.; Van Harsselaar, J. Short Chain Fatty Acids in Human Gut and Metabolic Health. Benef. Microbes 2020, 11, 411–455. [Google Scholar] [CrossRef]
- De Vos, W.M.; Tilg, H.; Van Hul, M.; Cani, P.D. Gut Microbiome and Health: Mechanistic Insights. Gut 2022, 71, 1020–1032. [Google Scholar] [CrossRef]
- Peng, L.; He, Z.; Chen, W.; Holzman, I.R.; Lin, J. Effects of Butyrate on Intestinal Barrier Function in a Caco-2 Cell Monolayer Model of Intestinal Barrier. Pediatr. Res. 2007, 61, 37–41. [Google Scholar] [CrossRef] [PubMed]
- Dobrowolska, J.; Zagrodzki, P.; Woźniakiewicz, M.; Woźniakiewicz, A.; Zwolińska, M.; Winnicka, D.; Paśko, P. Procedure Optimization for Extracting Short-Chain Fatty Acids from Human Faeces. J. Pharm. Biomed. Anal. 2016, 124, 337–340. [Google Scholar] [CrossRef] [PubMed]
- Cuervo, A.; Salazar, N.; Ruas-Madiedo, P.; Gueimonde, M.; González, S. Fiber from a Regular Diet Is Directly Associated with Fecal Short-Chain Fatty Acid Concentrations in the Elderly. Nutr. Res. 2013, 33, 811–816. [Google Scholar] [CrossRef] [PubMed]
- Tian, Z.; Zhuang, X.; Luo, M.; Yin, W.; Xiong, L. The Propionic Acid and Butyric Acid in Serum but Not in Feces Are Increased in Patients with Diarrhea-Predominant Irritable Bowel Syndrome. BMC Gastroenterol. 2020, 20, 73. [Google Scholar] [CrossRef] [PubMed]
- Fleming, S.E.; O’donnell, A.U.; Perman, J.A. Influence of Frequent and Long-Term Bean Consumption on Colonic Function and Fermentation. Am. J. Clin. Nutr. 1985, 41, 909–918. [Google Scholar] [CrossRef] [PubMed]
- Zhu, X.; Qin, J.; Tan, C.; Ning, K. The Seasonal Changes of the Gut Microbiome of the Population Living in Traditional Lifestyles Are Represented by Characteristic Species-Level and Functional-Level SNP Enrichment Patterns. BMC Genom. 2021, 22, 83. [Google Scholar] [CrossRef] [PubMed]
- Tani, M.; Shinzaki, S.; Asakura, A.; Tashiro, T.; Amano, T.; Otake-Kasamoto, Y.; Yoshihara, T.; Yoshii, S.; Tsujii, Y.; Hayashi, Y. Seasonal Variations in Gut Microbiota and Disease Course in Patients with Inflammatory Bowel Disease. PLoS ONE 2023, 18, e0283880. [Google Scholar] [CrossRef]
- Koliada, A.; Moseiko, V.; Romanenko, M.; Piven, L.; Lushchak, O.; Kryzhanovska, N.; Guryanov, V.; Vaiserman, A. Seasonal Variation in Gut Microbiota Composition: Cross-Sectional Evidence from Ukrainian Population. BMC Microbiol. 2020, 20, 100. [Google Scholar] [CrossRef] [PubMed]
- Peddada, S. Seasonal Change in the Gut. Science 2017, 357, 754–755. [Google Scholar] [CrossRef] [PubMed]


| SCFAs | Min, mg/g | Max, mg/g | Mean ± SD, mg/g |
|---|---|---|---|
| C2 (acetic) | 0.29 | 3.28 | 1.35 ± 0.61 |
| C3 (propionic) | 0.13 | 1.14 | 0.46 ± 0.24 |
| iC4 (isobutyric) | 0.02 | 0.42 | 0.08 ± 0.05 |
| C4 (butyric) | 0.05 | 1.48 | 0.41 ± 0.27 |
| iC5 (isovaleric) | 0.05 | 0.62 | 0.19 ± 0.09 |
| C5 (valeric) | 0.03 | 0.56 | 0.12 ± 0.07 |
| iC6 (isocaproic) | 0.0001 | 0.03 | 0.01 ± 0.01 |
| C6 (caproic) | 0.0001 | 0.53 | 0.06 ± 0.07 |
| Taxa | Relative Abundance (Mean ± SD, %) | Adjusted p-Values | ||||||||
|---|---|---|---|---|---|---|---|---|---|---|
| Fall (F) | Spring (Sp) | Summer (S) | Winter (W) | F. vs. Sp. | F. vs. Sum. | Sp. vs. Sum. | F. vs. W. | Sp. vs. W. | Sum. vs. W. | |
| Unclassified g. Eggerthellaceae | 0.26 ± 0.4 | 0.3 ± 0.5 | 0.27 ± 0.5 | 0.27 ± 0.5 | 0.83 | 0.01 * | 0.03 * | 0.13 | 0.24 | 0.10 |
| g. Anaerobutyricum | 1.1 ± 0.6 | 1.7 ± 0.9 | 1.7 ± 0.8 | 1.78 ± 1 | 0.03 * | 0.01 * | 1.00 | <0.001 * | 0.77 | 0.84 |
| g. Pseudomonas_F | 0 | 0.5 ± 0.8 | 0.003 ± 0.01 | 0 | <0.001 * | 0.39 | <0.001 * | 1.00 | <0.001 * | 0.33 |
| g. Klebsiella_724518 | 0.01 ± 0.03 | 0.2 ± 0.7 | 0.01 ± 0.05 | 0.003 ± 0.02 | 0.003 * | 0.87 | <0.001 * | 0.88 | <0.001 * | 0.85 |
| g. Acinetobacter | 0 | 0.01 ± 0.02 | 0.06 ± 0.3 | 0 | <0.001 * | 0.66 | <0.001 * | 1.00 | <0.001 * | 0.68 |
| f. Pseudomonadaceae | 0.001 ± 0.004 | 0.5 ± 0.84 | 0.003 ± 0.01 | 0.0005 ± 0.003 | 0.003 * | 0.86 | 0.001 * | 0.70 | <0.001 * | 0.69 |
| f. Veillonellaceae | 0.03 ± 0.04 | 0.15 ± 0.3 | 0.08 ± 0.16 | 0.04 ± 0.1 | 0.11 | 0.28 | 0.38 | 0.77 | 0.04 * | 0.10 |
| f. Moraxellaceae | 0 | 0.01 ± 0.02 | 0.06 ± 0.3 | 0 | <0.001 * | 0.66 | <0.001 * | 1.00 | <0.001 * | 0.68 |
Disclaimer/Publisher’s Note: The statements, opinions and data contained in all publications are solely those of the individual author(s) and contributor(s) and not of MDPI and/or the editor(s). MDPI and/or the editor(s) disclaim responsibility for any injury to people or property resulting from any ideas, methods, instructions or products referred to in the content. |
© 2024 by the authors. Licensee MDPI, Basel, Switzerland. This article is an open access article distributed under the terms and conditions of the Creative Commons Attribution (CC BY) license (https://creativecommons.org/licenses/by/4.0/).
Share and Cite
Senina, A.; Markelova, M.; Khusnutdinova, D.; Siniagina, M.; Kupriyanova, O.; Synbulatova, G.; Kayumov, A.; Boulygina, E.; Grigoryeva, T. Two-Year Study on the Intra-Individual Dynamics of Gut Microbiota and Short-Chain Fatty Acids Profiles in Healthy Adults. Microorganisms 2024, 12, 1712. https://doi.org/10.3390/microorganisms12081712
Senina A, Markelova M, Khusnutdinova D, Siniagina M, Kupriyanova O, Synbulatova G, Kayumov A, Boulygina E, Grigoryeva T. Two-Year Study on the Intra-Individual Dynamics of Gut Microbiota and Short-Chain Fatty Acids Profiles in Healthy Adults. Microorganisms. 2024; 12(8):1712. https://doi.org/10.3390/microorganisms12081712
Chicago/Turabian StyleSenina, Anastasia, Maria Markelova, Dilyara Khusnutdinova, Maria Siniagina, Olga Kupriyanova, Gulnaz Synbulatova, Airat Kayumov, Eugenia Boulygina, and Tatiana Grigoryeva. 2024. "Two-Year Study on the Intra-Individual Dynamics of Gut Microbiota and Short-Chain Fatty Acids Profiles in Healthy Adults" Microorganisms 12, no. 8: 1712. https://doi.org/10.3390/microorganisms12081712
APA StyleSenina, A., Markelova, M., Khusnutdinova, D., Siniagina, M., Kupriyanova, O., Synbulatova, G., Kayumov, A., Boulygina, E., & Grigoryeva, T. (2024). Two-Year Study on the Intra-Individual Dynamics of Gut Microbiota and Short-Chain Fatty Acids Profiles in Healthy Adults. Microorganisms, 12(8), 1712. https://doi.org/10.3390/microorganisms12081712