Abstract
Globally, coral reef ecosystems are undergoing significant change related to climate change and anthropogenic activities. Yet, the Cuban archipelago of Jardines de la Reina (JR) has experienced fewer stressors due to its geographical remoteness and high level of conservation. This study examines the surface and benthic reef water microbial communities associated with 32 reef sites along the JR archipelago and explores the relationship between the community composition of reef microorganisms examined using bacterial and archaeal small subunit ribosomal RNA gene (16S rRNA gene) sequencing compared to geographic, conservation/protection level, environmental, physicochemical, and reef benthic and pelagic community features. Reef nutrient concentrations were low and microbial communities dominated by picocyanobacteria and SAR11 and SAR86 clade bacteria, characteristic of an oligotrophic system. Reef water microbial community alpha and beta diversity both varied throughout the archipelago and were strongly related to geography. Three sites in the western archipelago showed unique microbial communities, which may be related to the hydrogeography and influences of the channels linking the Ana Maria gulf with the Caribbean Sea. Overall, this work provides the first extensive description of the reef microbial ecology of the Caribbean’s ‘Crown Jewel’ reef system and a framework to evaluate the influence of ongoing stressors on the reef microorganisms.
1. Introduction
Coral reefs are one of the most biodiverse and economically valuable ocean ecosystems. These complex, rich, and productive ecosystems have persisted despite their presence in oligotrophic waters, partially due to their reliance on symbiosis and coupling between macroorganisms and the abundant and diverse assemblies of microorganisms [1]. Coral reefs have undergone significant and recent changes and declines, related to eutrophication [2], overfishing [3], disease outbreaks [4], and climate change induced ocean warming and acidification [5]. Understanding reef ecosystem health has become increasingly challenging due to this shifting baseline and increasing number of stressors. Microorganisms, the most abundant, diverse, and fastest growing and evolving members of the reef ecosystem, have the potential to serve as bioindicators for examining shifting baselines on reefs [6,7].
Microorganisms, including bacteria, archaea, picoeukaryotes, and viruses, are widely associated with reef organisms, sediments, and the overlying reef seawater [8,9]. The reef seawater bacteria and archaea (or picoplankton) are the most extensively studied members of these communities, and their composition is influenced by large-scale biogeographic processes but also smaller-scale ecological processes [10,11,12,13,14]. Studies have documented how specific benthic organisms, including corals, sponges, and macroalgae, influence the composition of the surrounding picoplankton community, with benthic organisms supplying growth substrates or promoters [15,16], as well as some organisms predating on specific picoplankters. For example, the coral Porites astreoides exudates enhances the growth of the Roseobacter HIMB11 and even oligotrophic taxa such as SAR11 and OMB60 (NOR5) bacteria, and this coral also preys on Synechococcus [17,18]. Fish and motile invertebrates also likely contribute to reef water microbial community dynamics, although there are fewer targeted studies documenting specific interactions [19].
The Jardines de la Reina (JR) Cuban archipelago is an ideal environment to examine the impact of reef community composition on water picoplankton without direct human influences. JR is acknowledged as a pristine, ‘crown jewel’ coral reef ecosystem in the Caribbean. It is located offshore southeastern Cuba, and the combination of its remote nature and unique and effective protective status have contributed to its success, with this ecosystem supporting some of the highest fish biomass and coral cover in the Caribbean [20]. There is an absence of large-scale industrialized agriculture or extensive development of Cuba’s coastline, and the JR archipelago is further buffered from the land by the Gulf of Ana Maria which harbors a succession of small mangrove keys and extensive seagrass meadows with corresponding sediments responsible for trapping organic matter and nutrients. On its southern side, the archipelago is flushed by the main surface circulation in the Caribbean Sea, i.e., the Caribbean current which carries warm oligotrophic waters westward. It is the largest marine protected area (MPA) in the Caribbean region (ca. 2000 km2), and it shows evidence of enforcement such as having the highest fish biomass of the Caribbean [21]. Additionally, tourism is highly restricted on the reefs, with less than 1000 visitors allowed per year. As coral reef health declines across the Caribbean Sea, JR provides an opportunity to examine the functioning and diversity of a protected and more pristine ecosystem.
In 2015, members of our team examined picoplankton communities associated with four JR reefs [22]. We found that the JR reefs harbored unique picoplankton communities compared to reefs from Gulf of Batabanó, Cuba, and the Florida Keys, USA. Indeed, the JR reef waters showed consistently high microbial diversity with low beta diversity compared to the other regions, suggesting that the pristine and protective nature of JR reefs may be related to these unique characteristics. In 2017, we had the opportunity to return to the JR region under a USA–Cuba cooperative agreement to conduct the first large-scale survey of the microbial ecology of the JR region and examine the consistency of microbial characteristics along the archipelago and possible sources of variability.
For this study, we sampled surface and reef-depth waters across 32 reef sites in the JR archipelago to examine the microbial community composition using partial 16S rRNA gene sequencing targeting bacteria and archaea, in relation to a larger framework of environmental and reef characteristics as well as the geographic position and protective status of each site. We aimed to first investigate the diversity and community structure (i.e., abundance and composition) of microbes across the archipelago. Further, we examined how geography, environmental variables, and protection enforcement levels influence microbial diversity and community structure.
2. Materials and Methods
2.1. Study Region
We sampled 32 reefs spanning approximately 200 km along the JR archipelago in Cuba during November 2017 (Figure 1). At 16 reefs throughout the archipelago, we sampled two sites (JRa and JRb) to capture variability within each geographic area. The JRa and JRb sites were located 125–1300 m apart with a mean distance of 731 m between a and b sites. The exception is that JR1, OR1, and OR2 only had a JRa site, and JR16 was sampled 3 times (sites a, b, and c). Off-reef waters (OR) were also sampled to provide a comparison to non-reef locations (n = 2 off-reef sites). The sites were all on the forereef, either reef terrace or spur and groove, and differed in their geographic location within the archipelago as well as their MPA protection enforcement level established in 1996 (Table 1). Historic protection categories were based on descriptions by Pina-Amargós et al. [23,24] to reflect the unevenness of protection over a large territory due to limited park resources which results in the occurrence of poaching towards the boundaries of the MPA.
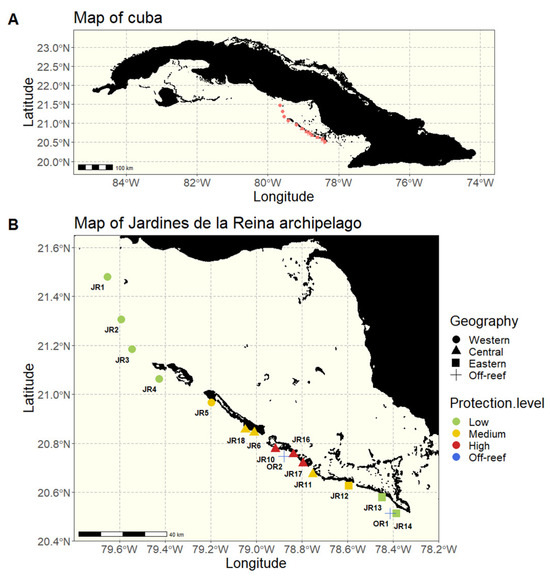
Figure 1.
Maps of Cuba and the 16 studied reefs. (A) A map of Cuba, the red dots representing the 16 studied reefs. (B) A map of the Jardines de la Reina (JR) archipelago with sampled reefs grouped according to their geographical location (western, central, eastern, and off-reef) and colored according to the protection enforcement level (low, medium, high, and off-reef).

Table 1.
Sampled sites and grouping categories (protection level established in 1996 [23,24]).
2.2. Physicochemical Properties of Seawater
A conductivity, temperature, and depth sonde (CTD; YSI Exo Sonde, Xylem Inc., Yellow Springs, OH, USA) was deployed at each site to survey the physicochemical properties (temperature, salinity, dissolved oxygen, and pH) of the water column. A component of these environmental data was previously presented by Weber et al. [25] and Navarro-Martínez et al. [26].
2.3. Benthos and Fish Population Surveys
Benthic cover of all reef sites was surveyed by SCUBA divers using the line-intercept survey method [27]. Between 10 and 20 transects (10 m in length) across the reef substrate led to the determination of percent cover of coral, algae, sponges, rocks, and sand. The data from half of the study sites presented here were previously examined by Weber et al. [25]. For the present study, coral, algae, and sponge categories were incorporated into the analyses.
Fish species richness and abundance were examined with 9–12 transects per site, each consisting of a 25 m × 5 m belt transect recorded with a diver-operated stereo-video (stereo-DOV) as described and previously presented by Navarro-Martínez et al. [26]. From this footage, researchers determined fish species richness as the average number of species per study area (the sum of the number of species in every transect divided by the number of transects per study area). Furthermore, fish abundance was determined using the average number of fish specimens per site (the sum of the number of specimens in every transect divided by the number of transects per study area).
Coral species richness and abundance were assessed using photographs at high resolution with a plastic quadrat of 25 cm × 25 cm laid on the bottom as described by Hernández-Fernández et al. [28]. For each reef, 10 replicates were made randomly distributed within a diameter of ca. 50 m from a central point. Coral species richness and abundance were calculated as previously described for fish.
Statistical comparisons of reef and environmental data were conducted using a Kruskal–Wallis rank-sum test followed by a post hoc Dunn’s test with Bonferroni corrections.
2.4. Macronutrients, Cell Count, and Pigment Analysis
Samples for inorganic nutrients, total organic carbon and nitrogen, and microbial cell abundance surveys were collected, processed, and previously described by Weber et al. [25]. Seawater was collected from both surface (<1 m depth) and reef depth (~1 m above reef), with depths ranging from 6 to 14 m. For off-reef sites, only surface water was sampled.
Surface and reef-depth seawater samples (40 mL) were collected for organic macronutrient analysis, acidified with 75 µL of concentrated phosphoric acid, capped, and stored at room temperature before analysis on a Shimadzu TOC-VCSH TOC analyzer (Shimadzu Scientific Instruments, Columbia, MD, USA) [29] with a TNM-1 module to measure concentrations of non-purgeable total organic carbon (NPOC also referred as TOC, unfiltered) and total nitrogen (TN, the combination of organic and inorganic nitrogen, unfiltered). Surface and reef-depth seawater samples (30 mL) collected for analyses of inorganic macronutrient concentrations were frozen prior to analysis. Concentrations of inorganic macronutrients including phosphate (PO43−), nitrite + nitrate (N + N), nitrite (NO2−), ammonium (NH4+), and silicate (SiO32−) were measured with a continuous segmented flow system as described by Apprill and Rappé [30]. The detection limits of the instrument varied according to the macronutrient as so: phosphate = 0.01 µM, nitrite + nitrate = 0.07 µM, nitrite = 0.01 µM, and ammonium = 0.02 µM. The concentration of nitrate was calculated by subtracting the concentration of nitrite from the sum of the two (N + N). Total organic nitrogen (TON) was acquired for this study by subtracting the sum of the inorganic nitrogen species (NH4+ + (N + N)) from TN.
Unfiltered seawater samples of 1 mL collected for enumeration of Prochlorococcus (PRO), Synechococcus (SYN), picoeukaryotic cells (PEUK), and unpigmented cells (referred to simply as heterotrophic bacteria and archaea, HBACT, but cellular metabolisms were not determined) were fixed with paraformaldehyde (1% final volume), incubated at 4 °C in the dark for 30 min, and stored at −80 °C prior to analysis. Pigmented and unpigmented cells were run separately for each sample by flow cytometry using the collinear analysis method and a UV wavelength of 488 nm on an Altra flow cytometer at the University of Hawaii. Unpigmented cells were stained with Hoechst stain. Each cell type abundance was estimated by binning populations using FlowJo (v. 6.4.7) software.
For phytoplankton pigment analysis (chlorophyll a and phaeophytin), 2–4 L of reef-depth seawater was filtered through GF/F glass microfiber filters (Whatman®, Cytiva, Marlborough, MA, USA). After pigment extraction from the filters using 90% acetone in water, the optical density (OD) values were measured by a calibrated spectrophotometer using standard optics (Lambda 18, Perkin Elmer, Waltham, MA, USA).
Statistical comparisons of reef and environmental data were conducted using a Kruskal–Wallis rank-sum test followed by post hoc Dunn’s test with Bonferroni corrections.
2.5. 16S rRNA Gene Sequencing
Surface and reef-depth water samples were collected from each location, and duplicate samples of seawater from each depth were filtered (1–2 L) using 0.2 μm pore size, 25 mm Supor® PES filters (Pall Corporation, Port Washington, NY, USA) under peristaltic pressure. Filters were stored in cryovials, flash-frozen in liquid nitrogen, and stored at −80 °C. DNA was extracted from filters using DNeasy® PowerBiofilm® (Qiagen, Hilden, Germany) using the manufacturer’s protocols. Microbial community composition was assessed by targeting the V4 region of the 16S rRNA gene using 515FY and 806RB primers, as outlined by Parada et al. [31] and Apprill et al. [32] with unique barcoded primer combinations for each sample. Each sample was processed in 50 μL PCR reactions containing 2.5 U of GoTaq Flexi DNA Polymerase (Promega Corporation, Madison, WI, USA), 10 μL 5X Colorless GoTaq Flexi Buffer, 2.5 mM MgCl2, 0.2 mM dNTP mix, 0.2 μM of each barcoded primer, and 2 μL of the sample or control. The PCR reactions were carried out on a C1000™ Thermal Cycler from Bio-Rad (Bio-Rad Laboratories, Inc., Hercules, CA, USA) and consisted of an initial denaturation step at 95 °C for 2 min, followed by 24, 26, or 28 cycles of 95 °C for 20 s, 55 °C for 15 s, and 72 °C for 5 min, concluding with an extension at 72 °C for 10 min. PCR products were screened using gel electrophoresis on 1% agarose/tris-borateEDTA gels (120 V for 30 min) stained with SYBR™ Safe gel stain (Invitrogen™, Waltham, MA, USA) and with the HyperLadder™ 50 bp DNA ladder (Bioline, London, UK) as a size reference. PCR cycles varied slightly between samples to ensure that they produced similar minimal PCR product yields across samples. DNA extraction and PCR controls (blanks and positive controls of seawater DNA known to amplify) were used to control for potential contamination from reagents. Moreover, amplification bias and sequencing errors were monitored using genomic DNA from Microbial Mock Community B (even, low concentration), v3.1, HM-782D, obtained through BEI Resources, Manassas, VA, USA; NIAID, NIH as part of the Human Microbiome Project). PCR products were purified using the MinElute® PCR Purification kit (Qiagen, Valencia, CA, USA), and quantified via the Invitrogen™ Quant-iT™ PicoGreen™ dsDNA Assay Kits and dsDNA Reagents (Thermo Fisher Scientific Inc., Waltham, MA, USA). Finally, amplicons were pooled in equimolar ratios and sequenced using the 2 × 250 bp paired-end Illumina MiSeq method (Illumina, San Diego, CA, USA), similar to Kozich et al. [33], at the University of Illinois W.M. Keck Center for Comparative and Functional Genomics.
2.6. Sequencing Data Analysis
Demultiplexed sequences were processed using the R package dada2 (v 1.24.0) [34] according to the DADA2 Pipeline Tutorial (v 1.16, https://benjjneb.github.io/dada2/faq.html, accessed on 30 March 2023). The filtering parameter truncLen was set to truncate forward reads at 240 bp and reverse reads at 150 bp, where observed quality scores (QSs) on quality profiles began to drop below 30. All other parameters were kept at default values. Paired reads were merged before sequences were clustered into amplicon sequence variants (ASVs); then, chimeras were removed. By the end of the dada2 processing, between 70.9 and 90.8% of input reads passed quality control in seawater samples, and 80.8–82.1% of input reads passed quality control in the mock community samples (positive control). Taxonomy was assigned using the SILVA SSU rRNA database (v.138.1) down to the species level when possible [35].
Contaminant ASVs were identified and removed from all samples using the prevalence method with a threshold of 0.2 from the decontam (v.1.13.0) R package [36]. This method identified 12 ASV contaminants, with enriched frequency in DNA extraction negative controls. Those 12 ASVs were removed as well as positive and negative control samples, leaving 7698 ASVs for comparison in this study.
Before alpha diversity analysis, a random subsampling was performed to reach 33,781 reads for each sample. This threshold was chosen to preserve the total diversity of the highest number of samples. This rarefaction process aims at normalizing sample sizes to minimize the impacts of uneven sequence coverage across samples. Alpha diversity metrics were then determined using the “estimate_richness()” function from the R package “phyloseq” (v.1.40.0) [37]. To visualize the taxonomic composition of each site, ASV counts were transformed into relative abundances and only ASVs with an average relative abundance across samples greater than 0.01 were plotted.
The R package “corncob” (v.0.3.1) [38] was used to identify ASVs significantly differentially abundant between geographic locations. Corncob was run using the parametric Wald test with an FDR cut-off of 0.05. Two hypotheses were tested: (1) The relative abundance of some ASVs are significantly different according to the reef location across the JR archipelago due to hydrogeography as well as other reef-specific biological and physical properties and (2) sites with atypical alpha and beta diversity features (‘abnormal’ reefs) harboring ASVs that are significantly different in relative abundance from other reefs. The first hypothesis was tested by comparing ASV counts found in the western reefs with the ones found in both the central and eastern reefs, after excluding abnormal reefs (JR11, JR12, and JR14) as well as off-reef sites from the dataset. Such an opposition accounts for the fact that the western reefs are likely more impacted by Ana Maria gulf waters due to the absence of islands acting as physical barriers. The second hypothesis was tested only for reef-depth samples, and therefore, off-reef sites were excluded from the test because only surface water was collected.
A Bray–Curtis dissimilarity matrix was calculated using the “vegdist()” function from R package “vegan” (v.2.6.4) [39]. The beta diversity of communities was assessed as mean distance to the centroid of the group for each geographic locations and protection levels using the “betadisp()” function from “vegan” R package [39]). Note that the number of sequences per sample ranges from 18,409 to 460,146, with a mean (std. dev.) of 75,893 (61,177) sequences. Reef and environmental data were log-transformed to ensure normality. To visualize the microbial community structure, we used nonmetric multidimensional scaling (nMDS) with overlaid environmental variables fit onto the ordination using the “envfit()” function (“vegan” R package [39]). Furthermore, a permutational multivariate ANOVA (PERMANOVA), function “adonis2()” from the “vegan” R Package [39]) was conducted to determine the environmental variables that have a significant (p ≤ 0.05) influence on microbial community structure.
3. Results
3.1. Reef Biogeochemistry
The physicochemical properties of the sites were generally homogeneous across the JR reef system. Seawater temperature ranged between 28.2 and 28.8 °C, dissolved oxygen ranged between 6.02 and 6.67 mg L−1, salinity ranged between 36.9 and 37.1, and pH ranged between 8.26 and 8.33. Reef benthic communities were previously presented [25], with coral cover ranging from 11 to 35%, algal cover ranging from 24 to 41%, and around 4% of sponge cover. Benthic cover was generally similar between sites, with few exceptions [25]. Fish community data were also previously presented for these sites and for the same cruise and showed variability in communities along the archipelago [26]. The distance from the center of the MPA was related to some of the variability in the abundance, functional richness, and structure of fish communities [26].
Macronutrients were generally low at the reef sites, with total nitrogen (TN, the combination of organic and inorganic nitrogen) displaying the widest range, due to elevated values at site JR12 (Table 2). Concentrations of Synechococcus and picoeukaryotes were more variable between sites compared to Prochlorococcus and unpigmented picoplankton abundances (Table 2). Macronutrients and microbial abundances were examined and compared separately for surface and benthic depths of the reefs (Figure 2 and Figure 3). Off-reef surface waters were significantly lower in TON and TN as well as abundances of Synechococcus and picoeukaryotes compared to the reef surface waters. Surface waters of the western reefs showed significantly elevated nutrients (TON, TN, and silicate) as well as Synechococcus, picoeukaryote, and heterotrophic cells compared to the other geographic regions (Figure 2). For reef-depth water, nutrient and cell abundances were more similar between geographic locations. The western reefs were associated with lower ammonium and higher abundance of Synechococcus and heterotrophic bacteria compared to the other locations (Figure 3).
Table 2.
Overview of nutrient concentrations and cell abundances for JR coral reef, with surface and benthic water values combined (d.l. = detection limit, SD = standard deviation).
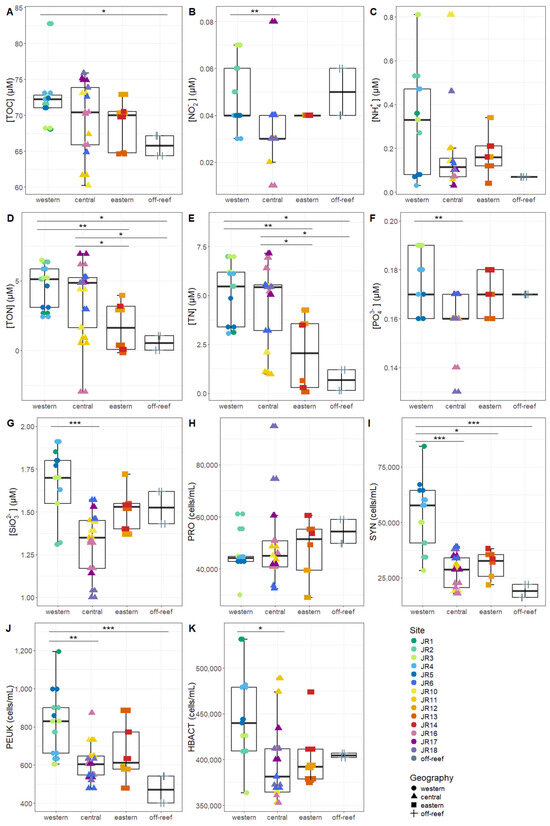
Figure 2.
The environmental signatures of surface seawater microbial communities, including (A) total organic carbon (TOC), (B) nitrite (NO2−), (C) ammonium (NH4+), (D) total organic nitrogen (TON), (E) total nitrogen (TN), (F) phosphate (PO42−), (G) silicate (SiO32−), (H) Prochlorococcus (PRO), (I) Synechococcus (SYN), (J) picoeukaryotes (PEUK), and (K) heterotrophic bacteria (HBACT). The colors designate each reef, the horizontal thick black bar across the boxplot represents the median value, and the whiskers extend to values at 1.5 times the interquartile range (delimited by the box). The horizontal black bars at the top and their associated asterisks indicate significantly different groups as identified via the Kruskal–Wallis rank-sum test and Dunn’s test with Bonferroni corrections (*: p < 0.05, **: p < 0.01, ***: p < 0.001).
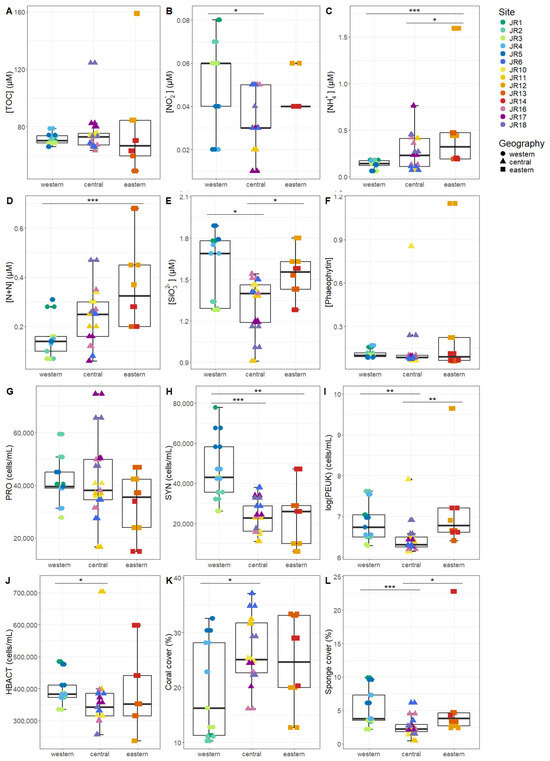
Figure 3.
The environmental signatures of reef-depth seawater microbial communities, including (A) total organic carbon (TOC), (B) nitrite (NO2−), (C) ammonium (NH4+), (D) nitrite + nitrate (N + N), (E) silicate (SiO32−), (F) phaeophytin, (G) Prochlorococcus (PRO), (H) Synechococcus (SYN), (I) picoeukaryotes (PEUK), (J) heterotrophic bacteria (HBACT), (K) coral cover, and (L) sponge cover. The colors designate each reef, the horizontal thick black bar across the boxplot represents the median value, and the whiskers extend to values at 1.5 times the interquartile range (delimited by the box). The horizontal black bars at the top and their associated asterisks indicate significantly different groups as identified via the Kruskal–Wallis rank-sum test and Dunn’s test with Bonferroni corrections (*: p < 0.05, **: p < 0.01, ***: p < 0.001).
3.2. Microbial Community: Alpha Diversity
Our analyses detected variability in reef water microbial alpha diversity between the reef sites. For microbial species richness, values ranged from 243 to 1225 ASVs (Mean ± SD 444 ± 169 ASVs). For the Shannon index, values ranged from 4.11 to 5.28 (Mean ± SD 4.55 ± 0.24). No significant difference in alpha diversity was found between the surface (<1 m) and reef depths (6–14 m), and therefore, the data were combined for the remaining alpha diversity analyses (Figure S1).
Alpha diversity differed according to geographic location, with the highest alpha diversity in the west, followed by the central and then eastern reefs, with significant differences in the Shannon index between all reef regions (Figure 4A). The off-reef site Shannon index site was significantly lower than the western reefs (Figure 4A). Alpha diversity also differed by the level of reef protection, with the highest microbial richness in most protected reefs, but this trend was not confirmed by the Shannon Index (Figure 4B).
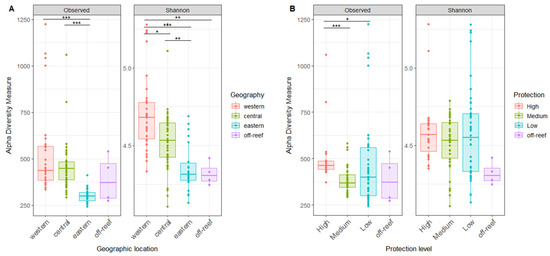
Figure 4.
The microbial alpha diversity of reef waters differs by geography and reef protection levels. (A) The richness and Shannon index of reef water compared by geographic locations. (B) The richness and Shannon index of reef water compared by protection levels. The horizontal thick bar across the boxplot represents the median value, and the whiskers extend to values at 1.5 times the interquartile range (delimited by the box). The horizontal black bars at the top and their associated asterisks indicate significantly different groups as identified via the Kruskal–Wallis rank-sum test and Dunn’s test with Bonferroni corrections (*: p ≤ 0.05, **: p ≤ 0.01, ***: p ≤ 0.001).
3.3. Microbial Community: Beta Diversity
Bray–Curtis-based beta diversity showed differential geographic patterns for surface and reef-depth microbial communities. For surface waters, the western and central reefs both show more variability compared to off-reef sites (Figure 5A). In contrast, for reef-depth sites, the eastern reefs had higher beta diversity (Figure 5B). A comparison of beta diversity by protection levels showed the lowest dispersion in the most-protected reefs, but this was only significant between the medium- and high-protection sites (Figure 5C,D).
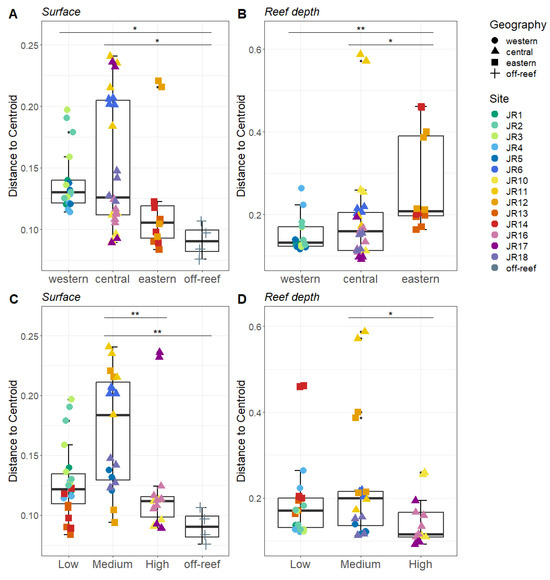
Figure 5.
Beta diversity measured as the average distance of reefs to the group centroid. The reefs are divided between surface ((A,C) depth < 1 m) and reef depths ((B,D) depth = 6–14 m). The reefs are grouped by geographical locations (A,B) and by protection levels (C,D). The colors designate each reef, the horizontal thick black bar across the boxplot represents the median, and the whiskers extend to 1.5 times the interquartile range (delimited by the box). The horizontal black bars at the top and their associated asterisks indicate significantly different groups as identified via the Kruskal–Wallis rank-sum test and Dunn’s test with Bonferroni corrections (*: p ≤ 0.05, **: p ≤ 0.01).
3.4. Microbial Community Composition
Bacterial and archaeal composition of reef seawater included Synechococcales (~25% relative abundance), SAR11 clade (~25%) and Pseudomonadales (~10%). Moreover, Actinomarinales, Flavobacteriales, Marine Group III archaea, Puniceispirillales, Rhodobacterales, Rhodospirillales, and Rickettsiales were consistently represented in all the samples (Figure 6). The western reefs showed elevated Nitrosopumilales, Marine Group II archaea, and SAR202 clade bacteria compared to all other geographic locations, in both surface and reef-depth communities.
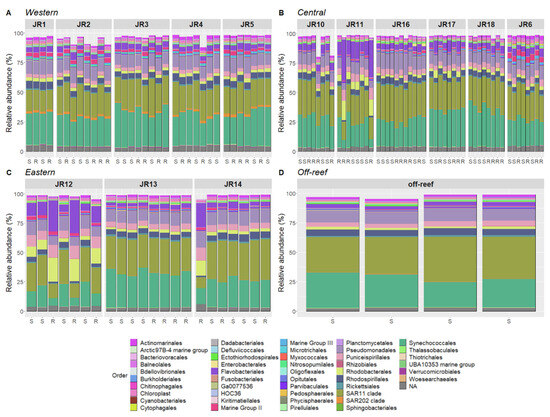
Figure 6.
The relative abundances of the most prevalent taxonomic groups of bacteria and archaea, representing 80–95% of sequences per sample for Western (A), Central (B), Eastern (C) and off-reef (D) sites. The samples are organized according to site and geographic location. The taxa are identified to Order. The samples’ depths are indicated on the x-axis where S is surface (<1 m) and R is reef depth (6–14 m).
Several reefs showed strong variation in taxonomic composition (Figure 6). Indeed, reefs JR11, JR12, and JR14 were characterized by higher proportions of Flavobacteriales, Rhodobacterales, and Puniceispirillales and were associated with lower proportions of Synechococcales, the SAR11 clade, and Rhodospirillales at reef depth.
The R package “corncob” was used to identify ASVs that were significantly differentially abundant between geographic locations. This analysis identified 104 ASVs that were significantly differentially abundant when the western reefs were compared to both the central and eastern reefs (Supplementary Figure S3). The most significantly enriched ASVs (coefficient from 3.75 to 5) include the taxa Nitrosococcales, Polyangiales, Rhodospirillales, Nitrosopumilales, the SAR11 clade, and Planctomycetales. The most significantly depleted ASVs (coefficient from −3.75 to −2.5) include the taxa Enterobacterales, Desulfovibrionales, Cyanobacteriales, and Flavobacteriales. Note that some taxa were both positively and negatively enriched such as Flavobacteriales (three ASV-enriched and five ASV-depleted), Rhodobacterales (two ASV-enriched, one ASV-depleted) or SAR11 clade (two ASV-enriched, three ASV-depleted). Also, Nitrosopumillales, SAR202, and Marine Group II ASVs were enriched in the western reefs (Figure 6).
Furthermore, this corncob analysis identified 93 differentially abundant ASVs in abnormal reefs (JR11, JR12, and JR14) in comparison to all the other reefs (Supplementary Figure S4). The most significantly enriched ASVs (coefficient from 1.5 to 3) on abnormal reefs included the taxa Cytophagales, Pseudomonadales, Rhodobacterales, Deinococcales, Flavobacteriales, Caenarcaniphilales, and Sphingobacteriales. The most significantly depleted ASVs (coefficient from −6 to −3) included the taxa Planctomycetales, Parvibaculales, HOC36, the Arctic97B-4 marine group, Rhodospirillales, and Opitutales.
3.5. Relationship between Reef Properties and Microbial Communities
An nMDS ordination of the microbial community structure for combined surface and reef-depth microbial communities indicated that the western reefs were more closely grouped and distinct from the central and eastern reefs and that reefs JR11 and JR12 were distinct compared to the other reefs (Figure 7). Off-reef sites also appear closely grouped on Figure 7A but closer to the central and eastern reefs. A PERMANOVA examined the influence of environmental properties on the microbial community composition (Table 3). At both depths, the microbial community composition was significantly influenced by the sites’ geographic location (R2 = 42% and Pr ≤ 0.001 at surface level, R2 = 29% and Pr ≤ 0.001 at reef depth) as well as by their protection level (R2 = 26% and Pr ≤ 0.001 at surface level, R2 = 18% and Pr ≤ 0.001 at reef depth). Chlorophyll a, algal cover, as well as fish abundance, species richness, and biomass did not significantly influence microbial communities’ structure across JR reefs (Pr > 0.05). Surface seawater microbial communities were impacted by the following (in order of significance): ammonium concentrations, abundances of Synechococcus, picoeukaryotes and unpigmented picoplankton, silicate concentrations, TON and total nitrogen concentrations (R2 range 8–68%, Pr ≤ 0.001), followed by TOC concentrations, abundances of Prochlorococcus, and nitrite and phosphate concentrations (R2 range of 5.5–6.6%, Pr ≤ 0.01). All these parameters influenced western-reef microbial composition except for Prochlorococcus which had a major influence on the central (especially JR6) and eastern reefs (especially JR13) as well as on off-reef sites (Figure 7A). For the reef-depth samples (Figure 7B), the western reefs’ microbial communities were mostly correlated with Synechococcus, Prochlorococcus, and unpigmented picoplankton abundances (R2 range of 11–24%, Pr ≤ 0.001) followed by silicate concentrations (R2 = 7.7%, Pr ≤ 0.01), and then by sponge cover and nitrite concentrations (R2 range 4.7–7.7%, Pr ≤ 0.05). The central and eastern reefs’ microbial communities were correlated with Prochlorococcus abundances and ammonium concentrations (R2 range 14–23%, Pr ≤ 0.001), phaeophytin concentrations (R2 = 8.1%, Pr ≤ 0.01), followed by concentrations of nitrate + nitrite and TOC, coral cover, and finally picoeukaryote abundances (R2 range 5–5.6%, Pr ≤ 0.05). Microbial communities from the abnormal reefs JR11, JR12, and JR14 were particularly influenced by ammonium (R2 = 14%, Pr ≤ 0.001) and TOC concentrations (R2 = 5.4%, Pr ≤ 0.05).
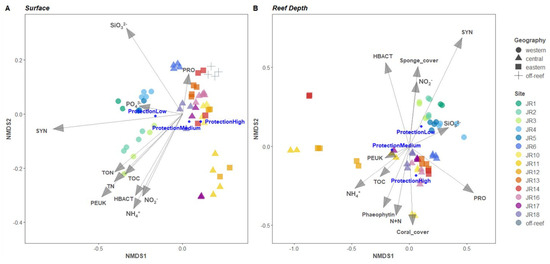
Figure 7.
Nonmetric multidimensional scaling (nMDS) analysis of seawater bacterial and archaeal communities. The vector overlays represent multiple correlations between the ordination axes, environmental variables, and category of reef protection level (displayed as dark blue circles). Clustering was conducted using group average linkages on Bray–Curtis dissimilarity indices computed from relative abundances of 16S rRNA gene amplicons grouped into an amplicon sequence variant (ASV) from surface (A) and reef depth (B) samples.
Table 3.
PERMANOVA results of the effect of environmental properties on the microbial community structure in JR seawater. The parameters in bold have a major influence on community structure (0.047 < R2 < 0.773 and Pr ≤ 0.05). (Df = degree of freedom, Pr = probability).
4. Discussion
This study presents the most comprehensive survey of the microbial communities as well as nutrient conditions associated with Jardines de la Reina coral reefs. We show that the reefs had generally low nutrient concentrations and are dominated by oligotrophic-type microbes. Alpha and beta diversity of the microbial communities showed variability between the reef’s sites, with relationships tied to reef geography and protection levels, as well as environmental and reef benthic features. We identify several abnormal reefs whose microbial and nutrient patterns differed considerably from the other reefs. These data provide a timestamp of microbiology in a relatively pristine coral reef system that is useful for understanding a remote, well-protected Caribbean reef ecosystem as well as for comparisons during expected future reef changes.
4.1. Oligotrophic-Type Nutrients and Microbial Communities
Across all reef sites, we observed generally low and consistent concentrations of macronutrients and oligotrophic microbial taxa. The only previous study of JR reef nutrients was of two forereefs sampled in 2015, and here, we report similar mean TOC and TON concentrations but higher yet still low concentrations of phosphate and inorganic nitrogen [22]. Prochlorococcus was on average about half that of 2015 measurements (4.4 × 10⁴ cells mL−1 in 2017, 10 × 104 cells mL−1 in 2015) and with a somewhat higher concentration of Synechococcus (3.5 × 10⁴ cells mL−1 in 2017, 2 × 10⁴ cells mL−1 in 2015) [22]. Heterotrophic bacteria decreased about 4-fold (1.8 × 10⁶ cells mL−1 in 2015; 0.39 × 10⁶ cells mL−1 in 2017) between the 2015 study and this study [22]. This decrease in Prochlorococcus and heterotrophic bacteria abundances is notable and could be related to the seasonal differences (winter in 2015, fall in 2017) or the higher sampling coverage of reefs in 2017.
Microbial communities were dominated by oligotrophic taxa including SAR11, SAR86, and Prochlorococcus which made up 30–60% of the reef water microbial communities, except for three samples belonging to the JR11, JR12, and JR14 sites where these taxa made up to 15–23% of the community (Figure S2). These types of bacteria are common members of oligotrophic reef environments [11,40] and generally require low levels of nutrients and dissolved organic matter and have small genomes which are streamlined for success in low-nutrient environments [41,42].
Despite the dominance of reef water communities by these oligotrophic cells, alpha and beta diversity of the communities were overall much higher in the present study compared to the two forereef sites examined in 2015. The former study [22] reported 300–350 microbial taxa at the reefs, while the present study reports a range of 250 to over 500 taxa, and here, we show elevated beta diversity in the microbial communities between sites. The 2015 study covered a limited geographic area in the most-protected MPA zone, while here, we explored more sites throughout the MPA and outside. The data analysis methods were comparable but could also play a role in these differences.
While JR reefs are highly oligotrophic, this study also demonstrated relationships between benthic reef cover and microbial communities. Coral and sponge cover significantly influenced microbial composition at reef depth. Connections between microbial and benthic communities were experimentally demonstrated by Nelson et al. [15] and Weber et al. [17]. Prior work has shown that benthic organisms can recruit specific microorganisms [15,17], and field-based investigations on JR reefs were one of the first field studies to document this trend [12]. Further, metabolomics investigations from these same reefs also showed evidence of benthic signatures in the reef metabolome [17], which has direct interactions with the reef microbial community.
Connections between the 2015 and 2017 studies demonstrate consistency in reef water microbial dynamics. However, it is important to note that the two studies represent point sampling events in time; and seasons, storms, and recent marine heat waves, among other factors, can significantly influence microbial communities and their dynamics (e.g., [43]). Thus, further sampling and investigation of these reef sites are necessary to form a more robust understanding of connections between the reef water microorganisms and influencing factors for the Jardines de la Reina reefs.
4.2. Geographical and Reef Protection Trends
The microbial communities varied according to geography and historic protection categories. The results pertaining to reef protection should be interpreted cautiously, as they were based on historic protection levels with no updated knowledge of recent enforcement. Microbial community alpha diversity was highest in the most-protected reefs, and these same reefs had the lowest beta diversity compared to the less-protected reef sites. Microbial community richness is often related to ecosystem and organismal health in a variety of systems [44]. A study of Micronesian coral reefs identified high alpha diversity in seawater microbial communities that were collected from reefs with high coral cover [11]. Given the high coral cover and fish species richness in the protected areas of JR, it is not surprising that these microbial communities exhibit hallmark traits associated with healthy ecosystems. Indeed, evidence of the impact of protection on reef microbial communities can be observed at a larger scale as seen in the Weber et al. [22] study which compared preserved Cuban reefs to anthropized reefs of the Florida Keys. The authors discovered distinct microbial signatures between reef systems. While the Florida Keys showed signs of microbialization, as evidenced by a shift from oligotrophic and highly diverse ecosystems towards more eutrophic and less-diverse ecosystems [45], JR reefs showed signs of an oligotrophic system with a preserved dependence of the reef community on primary production by picocyanobacteria.
Synechococcus abundances were consistently the lowest in the central reefs as well as reefs with the highest level of protection. Synechococcus are typically associated with coastal reef environments and tend to thrive in environments with higher nutrient concentrations compared to the more oligotrophic environments favoring Prochlorococcus. A classic example is the high Synechococcus distribution in Kaneohe Bay, Hawaii, which diminishes in concentration near the edge of the bay, with oceanic water containing lower organic nitrogen concentrations and higher light levels being dominated by Prochlorococcus [46,47]. In this study, the highest Synechococcus abundances were associated with the eastern reefs and could be related to the slightly higher ammonium concentrations in the benthic waters within this region. Despite all reefs being sampled on the JR sites near the offshore environment, the microbial community exhibited geographic trends that suggest influence from the hydrodynamic regime. The western reefs show distinct microbial taxonomic composition. They host more heterotrophic bacteria, and are enriched in Nitrosopumilales, SAR202 clade, and Nitrosococcaless. Additionally, JR6 and JR12 showed higher abundance of Marine Group II archaea, and JR17 and JR12 both show higher TON concentrations than other reefs of the same geographic category, a characteristic shared by the western reefs. The common feature of reefs JR6, JR12, and JR17 is that they all are located on the western side of a channel linking the Caribbean Sea with the Ana Maria gulf (spanning the inner sea between the island of Cuba and the JR archipelago). Moreover, unlike the eastern and central reefs, the western reefs are not separated from the Ana Maria gulf by islands, thus allowing gulf waters to run freely. The southern Cuban coast is flushed from east to west with oligotrophic water carried by the Caribbean current [48]. Thus, the similarities between the eastern reefs and off-reef sites, as well as the singularities of some specific reefs and the western reefs, are likely due to the impact of the Caribbean current and the presence of channels communicating with the Ana Maria gulf. Indeed, this current brings oligotrophic waters to the eastern end of the JR archipelago before carrying more eutrophic waters flowing out of the Ana Maria gulf towards the western end of the archipelago. Such results demonstrate the influence of hydrography and topography on microbial community structure. This important influence of hydrodynamic regime on the JR archipelago’s ecosystem was previously inferred by Hernandez-Fernandez et al. [28] and Marzo-Pérez et al. [49] following their work on JR’s coralline and cryptofaunal nematode communities, respectively.
Differences in beta diversity between protection levels might be partly, if not totally, due to geographical differences. Indeed, reefs with medium-protection level show high beta diversity. Yet, the eastern reefs are more influenced by Caribbean oligotrophic waters while the western reefs show evidence of the more eutrophic Ana Maria gulf waters. Furthermore, reefs with high protection show lower beta diversity, but this category gathers only three reefs (against five and six for medium- and low-protection categories) all at less than 40 km apart in the central area of the JR archipelago.
4.3. Abnormal Reefs: Distinguished by Microbial Community
Several reefs harbored significantly different microbial communities compared to the other reefs in the dataset. These ‘abnormal’ sites included JR11, JR12, and JR14 and were all located in the eastern side of the archipelago. Further, abnormalities in microbial community composition were primarily in benthic waters. Trends included enrichment in copiotrophic taxa including Rhodobacterales and Flavobacteriales, with specifically enriched taxa varying by reef site, associated with a depletion in oligotrophs in the SAR11 and SAR86 (ASV14) clades. These sites may be especially ideal for continued monitoring of the microbial community, for early signs of reef disruption. Further, analyses of microbial functions, such as through analyses of microbial functional genes or gene transcripts, could provide additional insights into the contribution of these unique microbial communities to the reef’s biogeochemistry and health.
5. Conclusions
This study demonstrated that the JR reefs are consistently oligotrophic in nutrient concentrations and are generally dominated by oligotrophic-type microorganisms. Indeed, JR reefs showed overall homogeneity in physicochemical properties, low nutrient concentrations, and consistent microbial taxonomic composition, primarily dominated by cyanobacteria and SAR11. The establishment of a MPA in 1996 seems to have succeeded in preserving the oligotrophic paradigm of the JR reef ecosystem. Several sites showed distinct microbial communities, potentially indicating disturbance and requiring further research. Reef geography was strongly linked to the microbial community, likely related to the complex hydrodynamic regimes of the archipelago. As coral reefs continue to undergo unprecedented changes worldwide, continued monitoring and research on this Caribbean ‘Crown Jewel’ reef system is important for understanding connections involving microorganisms within biodiverse reef ecosystems.
Supplementary Materials
The following supporting information can be downloaded at: https://www.mdpi.com/article/10.3390/microorganisms12091822/s1, Figure S1: Microbial alpha diversity indices of samples organized by depth type (Surface: <1 m, Reef depth: 6–14 m); Figure S2: Relative abundances of the dominant oligotrophic taxa of bacteria and archaea present within surface and reef depth waters; Figure S3: Differentially abundant ASVs identified in western reefs when compared to both eastern and central reefs using the R package ‘corncob’ (v 0.3.1); Figure S4: Differentially abundant ASVs identified in abnormal reefs JR11, JR12 and JR14 using the R package ‘corncob’ (v 0.3.1).
Author Contributions
M.D. performed laboratory processing, analyzed the data, and wrote the manuscript; L.W., A.A. and M.A. conducted field work and contributed to the manuscript; K.S. analyzed the data and contributed to the manuscript; C.A.M. contributed to laboratory processing and data analysis. All authors have read and agreed to the published version of the manuscript.
Funding
Funding was provided by the Dalio Foundation (now “OceanX”) and a National Science Foundation (OCE-1736288) award to A. Apprill.
Data Availability Statement
Raw sequences are available in the NCBI Short Read Archive (SRA) under project number PRJNA1010761.
Acknowledgments
We thank the captain and crew of the M/V Alucia for field support. This research was conducted under the requirements of the Republic of Cuba, in accordance with permits NV2370 and NV2568 issued by the Ministerio de Relaciones Exteriores (MINREX). This research was conducted under a memorandum of understanding between the National Center of Protected Areas (CNAP) of the Ministry of Science, Technology and Environment (CITMA) in Cuba and the Woods Hole Oceanographic Institution in the United States. Thanks to Amanda Ramos, Fredy Hernandez Delgado, and Victor Manuel Ferrer Rodriguez for the benthic cover surveys and cruise data integration; Zenaida M. Navarro-Martínez, Leonardo Espinosa, and Juan José Lake for fish data collection and analysis; Joe Jennings for nutrient analysis; Karen Selph for flow cytometric analysis; and Mallory Katsner, Jeanne Bloomberg, Cynthia Becker, and Austin Greene for lab and data analysis support.
Conflicts of Interest
The authors declare no conflict of interest.
References
- Nelson, C.E.; Wegley Kelly, L.; Haas, A.F. Microbial Interactions with Dissolved Organic Matter Are Central to Coral Reef Ecosystem Function and Resilience. Annu. Rev. Mar. Sci. 2023, 15, 431–460. [Google Scholar] [CrossRef]
- Lapointe, B.E. Nutrient thresholds for bottom-up control of macroalgal blooms on coral reefs in Jamaica and southeast Florida. Limnol. Oceanogr. 1997, 42 Pt 2, 1119–1131. [Google Scholar] [CrossRef]
- Jackson, J.B.C.; Kirby, M.X.; Berger, W.H.; Bjorndal, K.A.; Botsford, L.W.; Bourque, B.J.; Bradbury, R.H.; Cooke, R.; Erlandson, J.; Estes, J.A.; et al. Historical Overfishing and the Recent Collapse of Coastal Ecosystems. Science 2001, 293, 629–637. [Google Scholar] [CrossRef] [PubMed]
- Precht, W.F.; Gintert, B.E.; Robbart, M.L.; Fura, R.; van Woesik, R. Unprecedented Disease-Related Coral Mortality in Southeastern Florida. Sci. Rep. 2016, 6, 31374. [Google Scholar] [CrossRef] [PubMed]
- Hoegh-Guldberg, O. The Impact of Climate Change on Coral Reef Ecosystems. In Coral Reefs: An Ecosystem in Transition; Dubinsky, Z., Stambler, N., Eds.; Springer: Dordrecht, The Netherlands, 2011; pp. 391–403. [Google Scholar] [CrossRef]
- Glasl, B.; Bourne, D.G.; Frade, P.R.; Thomas, T.; Schaffelke, B.; Webster, N.S. Microbial indicators of environmental perturbations in coral reef ecosystems. Microbiome 2019, 7, 94. [Google Scholar] [CrossRef]
- Becker, C.C.; Weber, L.; Zgliczynski, B.; Sullivan, C.; Sandin, S.; Muller, E.; Clark, A.S.; Soule, M.C.K.; Longnecker, K.; Kujawinski, E.B.; et al. Microorganisms and dissolved metabolites distinguish Florida’s Coral Reef habitats. PNAS Nexus 2023, 2, pgad287. [Google Scholar] [CrossRef] [PubMed]
- Mouchka, M.E.; Hewson, I.; Harvell, C.D. Coral-Associated Bacterial Assemblages: Current Knowledge and the Potential for Climate-Driven Impacts. Integr. Comp. Biol. 2010, 50, 662–674. [Google Scholar] [CrossRef]
- Tout, J.; Jeffries, T.C.; Webster, N.S.; Stocker, R.; Ralph, P.J.; Seymour, J.R. Variability in Microbial Community Composition and Function Between Different Niches Within a Coral Reef. Microb. Ecol. 2014, 67, 540–552. [Google Scholar] [CrossRef]
- Salerno, J.L.; Bowen, B.W.; Rappé, M.S. Biogeography of planktonic and coral-associated microorganisms across the Hawaiian Archipelago. FEMS Microbiol. Ecol. 2016, 92, fiw109. [Google Scholar] [CrossRef]
- Apprill, A.; Holm, H.; Santoro, A.; Becker, C.; Neave, M.; Hughen, K.; Donà, A.R.; Aeby, G.; Work, T.; Weber, L.; et al. Microbial ecology of coral-dominated reefs in the Federated States of Micronesia. Aquat. Microb. Ecol. 2021, 86, 115–136. [Google Scholar] [CrossRef]
- Weber, L.; Gonzalez-Díaz, P.; Armenteros, M.; Apprill, A. The coral ecosphere: A unique coral reef habitat that fosters coral–microbial interactions. Limnol. Oceanogr. 2019, 64, 2373–2388. [Google Scholar] [CrossRef]
- Ma, L.; Becker, C.; Weber, L.; Sullivan, C.; Zgliczynski, B.; Sandin, S.; Brandt, M.; Smith, T.; Apprill, A. Biogeography of reef water microbes from within-reef to global scales. Aquat. Microb. Ecol. 2022, 88, 81–94. [Google Scholar] [CrossRef]
- Galand, P.E.; Ruscheweyh, H.-J.; Salazar, G.; Hochart, C.; Henry, N.; Hume, B.C.C.; Oliveira, P.H.; Perdereau, A.; Labadie, K.; Belser, C.; et al. Diversity of the Pacific Ocean coral reef microbiome. Nat. Commun. 2023, 14, 3039. [Google Scholar] [CrossRef]
- Nelson, E.C.; Goldberg, S.J.; Kelly, L.W.; Haas, A.F.; Smith, E.J.; Rohwer, F.; Carlson, A.C. Coral and macroalgal exudates vary in neutral sugar composition and differentially enrich reef bacterioplankton lineages. ISME J. 2013, 7, 962–979. [Google Scholar] [CrossRef]
- Haas, A.F.; Nelson, C.E.; Rohwer, F.; Wegley-Kelly, L.; Quistad, S.D.; Carlson, C.A.; Leichter, J.J.; Hatay, M.; Smith, J.E. Influence of coral and algal exudates on microbially mediated reef metabolism. PeerJ 2013, 1, e108. [Google Scholar] [CrossRef] [PubMed]
- Weber, L.; Soule, M.K.; Longnecker, K.; Becker, C.C.; Huntley, N.; Kujawinski, E.B.; Apprill, A. Benthic exometabolites and their ecological significance on threatened Caribbean coral reefs. ISME Commun. 2022, 2, 101. [Google Scholar] [CrossRef]
- McNally, S.P.; Parsons, R.J.; Santoro, A.E.; Apprill, A. Multifaceted impacts of the stony coral Porites astreoides on picoplankton abundance and community composition. Limnol. Oceanogr. 2017, 62, 217–234. [Google Scholar] [CrossRef]
- Grupstra, C.G.B.; Rabbitt, K.M.; Howe-Kerr, L.I.; Correa, A.M.S. Fish predation on corals promotes the dispersal of coral symbionts. Anim. Microbiome 2021, 3, 25. [Google Scholar] [CrossRef]
- González-Díaz, P.; González-Sansón, G.; Aguilar Betancourt, C.; Álvarez Fernández, S.; Perera Pérez, O.; Hernández Fernández, L.; Manuel Ferrer Rodríguez, V.; Cabrales Caballero, Y.; Armenteros, M.; de la Guardia Llanso, E. Status of Cuban coral reefs. Bull. Mar. Sci. 2018, 94, 229–247. [Google Scholar] [CrossRef]
- Valderrama, S.P.; Ávila, A.H.; Méndez, J.G.; Martínez, O.M.; Rojas, D.C.; Azcona, H.F.; Hernández, E.M.; Aragón, H.C.; Alcolado, P.M.; Amargós, F.P.; et al. Marine protected areas in Cuba. Bull. Mar. Sci. 2018, 94, 423–442. [Google Scholar] [CrossRef]
- Weber, L.; González-Díaz, P.; Armenteros, M.; Ferrer, V.M.; Bretos, F.; Bartels, E.; Santoro, A.E.; Apprill, A. Microbial signatures of protected and impacted Northern Caribbean reefs: Changes from Cuba to the Florida Keys. Environ. Microbiol. 2020, 22, 499–519. [Google Scholar] [CrossRef]
- Pina-Amargós, F.P.; Sansón, G.G.; Páez, Y.C.; Gómez, P.E.C. Effects of Fishing Activity Reduction in Jardines de la Reina Marine Reserve, Cuba. In Proceedings of the 61st Gulf and Caribbean Fisheries Institute, French West Indies, France, 10–14 November 2008; pp. 51–357. [Google Scholar]
- Pina-Amargós, F.; González-Sansón, G.; Martín-Blanco, F.; Valdivia, A. Evidence for protection of targeted reef fish on the largest marine reserve in the Caribbean. PeerJ 2014, 2, e274. [Google Scholar] [CrossRef]
- Weber, L.; Armenteros, M.; Soule, M.K.; Longnecker, K.; Kujawinski, E.B.; Apprill, A. Extracellular Reef Metabolites Across the Protected Jardines de la Reina, Cuba Reef System. Front. Mar. Sci. 2020, 7, 582161. [Google Scholar] [CrossRef]
- Navarro-Martínez, Z.; Armenteros, M.; Espinosa, L.; Lake, J.; Apprill, A. Taxonomic and functional assemblage structure of coral reef fishes, from Jardines de la Reina (Caribbean Sea, Cuba). Mar. Ecol. Prog. Ser. 2022, 690, 113–132. [Google Scholar] [CrossRef]
- Obura, D. Coral Reef Monitoring Manual South-West Indian Ocean Islands; Indian Ocean Commission: Port Louis, Mauritius, 2014; Volume 68. [Google Scholar]
- Hernández-Fernández, L.; de Zayas, R.G.; Weber, L.; Apprill, A.; Armenteros, M. Small-Scale Variability Dominates Benthic Coverage and Diversity Across the Jardines de La Reina, Cuba Coral Reef System. Front. Mar. Sci. 2019, 6, 747. [Google Scholar] [CrossRef]
- Hansell, D.A.; Carlson, C.A. Biogeochemistry of total organic carbon and nitrogen in the Sargasso Sea: Control by convective overturn. Deep Sea Res. Part II Top. Stud. Oceanogr. 2001, 48, 1649–1667. [Google Scholar] [CrossRef]
- Apprill, A.; Rappé, M.S. Response of the microbial community to coral spawning in lagoon and reef flat environments of Hawaii, USA. Aquat. Microb. Ecol. 2011, 62, 251–266. [Google Scholar] [CrossRef][Green Version]
- Parada, A.E.; Needham, D.M.; Fuhrman, J.A. Every base matters: Assessing small subunit rRNA primers for marine microbiomes with mock communities, time series and global field samples. Environ. Microbiol. 2016, 18, 1403–1414. [Google Scholar] [CrossRef] [PubMed]
- Apprill, A.; McNally, S.; Parsons, R.; Weber, L. Minor revision to V4 region SSU rRNA 806R gene primer greatly increases detection of SAR11 bacterioplankton. Aquat. Microb. Ecol. 2015, 75, 129–137. [Google Scholar] [CrossRef]
- Kozich, J.J.; Westcott, S.L.; Baxter, N.T.; Highlander, S.K.; Schloss, P.D. Development of a Dual-Index Sequencing Strategy and Curation Pipeline for Analyzing Amplicon Sequence Data on the MiSeq Illumina Sequencing Platform. Appl. Environ. Microbiol. 2013, 79, 5112–5120. [Google Scholar] [CrossRef]
- Callahan, B.J.; Mcmurdie, P.J.; Rosen, M.J.; Han, A.W.; Johnson, A.J.A.; Holmes, S.P. DADA2: High-resolution sample inference from Illumina amplicon data. Nat. Methods 2016, 13, 581–583. [Google Scholar] [CrossRef]
- Quast, C.; Pruesse, E.; Yilmaz, P.; Gerken, J.; Schweer, T.; Yarza, P.; Peplies, J.; Glöckner, F.O. The SILVA ribosomal RNA gene database project: Improved data processing and web-based tools. Nucleic Acids Res. 2013, 41, D590–D596. [Google Scholar] [CrossRef] [PubMed]
- Davis, N.M.; Proctor, D.M.; Holmes, S.P.; Relman, D.A.; Callahan, B.J. Simple statistical identification and removal of contaminant sequences in marker-gene and metagenomics data. Microbiome 2018, 6, 226. [Google Scholar] [CrossRef]
- McMurdie, P.J.; Holmes, S. phyloseq: An R Package for Reproducible Interactive Analysis and Graphics of Microbiome Census Data. PLoS ONE 2013, 8, e61217. [Google Scholar] [CrossRef]
- Martin, B.D.; Witten, D.; Willis, A.D. Modeling microbial abundances and dysbiosis with beta-binomial regression. Ann. Appl. Stat. 2020, 14, 94–115. [Google Scholar] [CrossRef]
- Oksanen, J.; Simpson, G.; Blanchet, F.; Kindt, R.; Legendre, P.; Minchin, P.R.; O’Hara, R.B.; Solymos, P.; Stevens, M.H.H.; Szoecs, E.; et al. Vegan: Community Ecology Package, R Package Version 2.6-5. 2023. Available online: https://github.com/vegandevs/vegan (accessed on 2 April 2023).
- Nelson, C.E.; Alldredge, A.L.; McCliment, E.A.; Amaral-Zettler, L.A.; Carlson, C.A. Depleted dissolved organic carbon and distinct bacterial communities in the water column of a rapid-flushing coral reef ecosystem. ISME J. 2011, 5, 1374–1387. [Google Scholar] [CrossRef] [PubMed]
- Grote, J.; Thrash, J.C.; Huggett, M.J.; Landry, Z.C.; Carini, P.; Giovannoni, S.J.; Rappé, M.S. Streamlining and Core Genome Conservation among Highly Divergent Members of the SAR11 Clade. mBio 2012, 3, 10–1128. [Google Scholar] [CrossRef]
- Dupont, C.L.; Rusch, D.B.; Yooseph, S.; Lombardo, M.-J.; Richter, R.A.; Valas, R.; Novotny, M.; Yee-Greenbaum, J.; Selengut, J.D.; Haft, D.H.; et al. Genomic insights to SAR86, an abundant and uncultivated marine bacterial lineage. ISME J. 2012, 6, 1186–1199. [Google Scholar] [CrossRef] [PubMed]
- Becker, C.C.; Weber, L.; Llopiz, J.K.; Mooney, T.A.; Apprill, A. Microorganisms uniquely capture and predict stony coral tissue loss disease and hurricane disturbance impacts on US Virgin Island reefs. Environ. Microbiol. 2024, 26, e16610. [Google Scholar] [CrossRef]
- Delgado-Baquerizo, M.; Giaramida, L.; Reich, P.B.; Khachane, A.N.; Hamonts, K.; Edwards, C.; Lawton, L.A.; Singh, B.K. Lack of functional redundancy in the relationship between microbial diversity and ecosystem functioning. J. Ecol. 2016, 104, 936–946. [Google Scholar] [CrossRef]
- Haas, A.F.; Fairoz, M.F.M.; Kelly, L.W.; Nelson, C.E.; Dinsdale, E.A.; Edwards, R.A.; Giles, S.; Hatay, M.; Hisakawa, N.; Knowles, B.; et al. Global microbialization of coral reefs. Nat. Microbiol. 2016, 1, 16042. [Google Scholar] [CrossRef] [PubMed]
- Cox, E.F.; Ribes, M.; Iii, R.A.K. Temporal and spatial scaling of planktonic responses to nutrient inputs into a subtropical embayment. Mar. Ecol. Prog. Ser. 2006, 324, 19–35. [Google Scholar] [CrossRef]
- Yeo, S.K.; Huggett, M.J.; Eiler, A.; Rappé, M.S. Coastal Bacterioplankton Community Dynamics in Response to a Natural Disturbance. PLoS ONE 2013, 8, e56207. [Google Scholar] [CrossRef] [PubMed]
- Arriaza, L.; Simanca, J.; Rodas, L.; Rodas, L.; Lorenzo, S.; Hernández, M.; Linares, E.O.; Milian, D.; Romero, P. Corrientes Marinas Estimadas en la Plataforma Suroriental Cubana. Marine Current Estimations in Southeast Cuban Shelf. 2008. Available online: https://aquadocs.org/handle/1834/3396 (accessed on 5 June 2023).
- Marzo-Pérez, D.; Pérez-García, J.A.; Apprill, A.; Armenteros, M. Diversity of Cryptofaunal Nematode Assemblages along the Jardines de La Reina Coral Reef, Southern Cuba. Diversity 2024, 16, 264. [Google Scholar] [CrossRef]


Disclaimer/Publisher’s Note: The statements, opinions and data contained in all publications are solely those of the individual author(s) and contributor(s) and not of MDPI and/or the editor(s). MDPI and/or the editor(s) disclaim responsibility for any injury to people or property resulting from any ideas, methods, instructions or products referred to in the content. |
© 2024 by the authors. Licensee MDPI, Basel, Switzerland. This article is an open access article distributed under the terms and conditions of the Creative Commons Attribution (CC BY) license (https://creativecommons.org/licenses/by/4.0/).