Article

Treatment of Anaerobic Digester Liquids via Membrane Biofilm Reactors: Simultaneous Aerobic Methanotrophy and Nitrogen Removal

by
Egidio F. Tentori
1,2,*,
Nan Wang
1,
Caroline J. Devin
1 and
Ruth E. Richardson
1
1
School of Civil and Environmental Engineering, Cornell University, Ithaca, NY 14853, USA
2
Gradient, One Beacon St., Boston, MA 02108, USA
*
Author to whom correspondence should be addressed.
Microorganisms 2024, 12(9), 1841; https://doi.org/10.3390/microorganisms12091841
Submission received: 30 July 2024 / Revised: 27 August 2024 / Accepted: 2 September 2024 / Published: 5 September 2024
(This article belongs to the Section Biofilm)

Abstract

:
Anaerobic digestion (AD) produces useful biogas and waste streams with high levels of dissolved methane (CH4) and ammonium (NH4+), among other nutrients. Membrane biofilm reactors (MBfRs), which support dissolved methane oxidation in the same reactor as simultaneous nitrification and denitrification (ME-SND), are a potential bubble-less treatment method. Here, we demonstrate ME-SND taking place in single-stage, AD digestate liquid-fed MBfRs, where oxygen (O2) and supplemental CH4 were delivered via pressurized membranes. The effects of two O2 pressures, leading to different O2 fluxes, on CH4 and N removal were examined. MBfRs achieved up to 98% and 67% CH4 and N removal efficiencies, respectively. The maximum N removal rates ranged from 57 to 94 mg N L−1 d−1, with higher overall rates observed in reactors with lower O2 pressures. The higher-O2-flux condition showed NO2 as a partial nitrification endpoint, with a lower total N removal rate due to low N2 gas production compared to lower-O2-pressure reactors, which favored complete nitrification and denitrification. Membrane biofilm 16S rRNA amplicon sequencing showed an abundance of aerobic methanotrophs (especially Methylobacter, Methylomonas, and Methylotenera) and enrichment of nitrifiers (especially Nitrosomonas and Nitrospira) and anammox bacteria (especially Ca. Annamoxoglobus and Ca. Brocadia) in high-O2 and low-O2 reactors, respectively. Supplementation of the influent with nitrite supported evidence that anammox bacteria in the low-O2 condition were nitrite-limited. This work highlights coupling of aerobic methanotrophy and nitrogen removal in AD digestate-fed reactors, demonstrating the potential application of ME-SND in MBfRs for the treatment of AD’s residual liquids and wastewater. Sensor-based tuning of membrane O2 pressure holds promise for the optimization of bubble-less treatment of excess CH4 and NH4+ in wastewater.

1. Introduction

Anaerobic digestion (AD) is used in wastewater treatment to reduce solid waste from sludge and recover CH4-rich biogas. AD effluent streams contain high levels of ammonium (NH4+) and Chemical Oxygen Demand (COD), including dissolved CH4 [1,2,3]. Inputs of NH4+ to water bodies represent an important factor leading to eutrophication, and nitrous oxide (N2O)—produced as a byproduct during conventional wastewater treatment—and CH4 are potent greenhouse gases (GHGs) [4,5]. CH4 and N2O emissions from wastewater treatment represent a major source of global anthropogenic GHG emissions [4,6]. In conventional wastewater treatment, biogas recovered from AD is used for energy or flared to minimize atmospheric GHG emissions. Even with biogas capture practices, fugitive CH4 emissions from wastewater treatment still represent a source of GHG emissions [1,6,7].
The AD process’s residual liquids (AD digestate) must be dealt with prior to release into receiving waters (refer to Table S1 in the Supplementary Materials for a list of abbreviations and terminology used in this study). Various biochemical treatment strategies have been developed that couple the removal of organic carbon, including dissolved CH4, and fixed nitrogen compounds. Several configurations can achieve simultaneous removal of CH4 and ammonia; however, either temporal or spatial niche partitioning is critical for aerobic and anaerobic processes to occur simultaneously.
In conventional wastewater treatment, nitrogen removal processes generally occur under physical or temporal separation, as nitrification is a largely aerobic process and denitrification requires anaerobic or anoxic conditions [8]. Biological N removal via anammox (i.e., oxidation of NH4+ to N2 using NO2 as the electron acceptor [9]) is also a viable treatment option for the removal of nitrogen from wastewater [2,8,10]. Methanotrophs, which rely on CH4 as a carbon and energy source, have garnered attention as a treatment option for the simultaneous removal of CH4 and nitrogen from wastewaters, due to their ability to link C and N cycles by using NO2 and NO3 as electron acceptors and/or nitrogen sources for biomass growth [1,11,12,13]. For high-NH4+ wastewaters with low initial NO2 levels under appropriate O2 conditions, nitrogen removal treatment options that combine partial nitritation and anammox are possible. Optimal dissolved O2 conditions (typically <2 mg L−1) are required in this process to minimize complete nitrification and prevent inhibition of anammox activity [14]. To fully treat CH4- and NH4+-rich wastewaters, such as AD effluents, methanotrophs and N-cycling bacteria would need to grow in concert to simultaneously treat the nutrient streams.
Membrane biofilm reactors (MBfRs) provide the spatial stratification required for aerobic and anaerobic processes, while retaining slow-growing organisms more effectively compared to suspended growth systems [15,16]. Compared to open aeration processes in conventional wastewater treatment, membrane-based technologies have lower GHG emissions by avoiding the stripping of dissolved CH4, as well as lower N2O emissions, aeration costs, and biosolids production [2,7,8,15]. In addition, membrane-based technologies are better suited for the treatment of high-nitrogen anaerobic effluents, including AD liquids [2]. Simultaneous nitrification and denitrification (SND) has been demonstrated experimentally in aerobic MBfRs [17,18,19,20], aerobic rotating biological contactors [21], and sequencing batch reactors [22]. Due to the varied requirements and growth rates, organism out-selection is a potential concern, and previous single-stage reactor studies have generally relied on synthetic wastewater with optimal NH4+/NO2 ratios in the influent feed over using actual wastewater. However, coexistence of NH4+- and NO2-oxidizing bacteria, denitrifiers, and anammox bacteria is possible with appropriate operational strategies, such as fine tuning of reactor O2 [16,18,23,24].
Methanotrophs include aerobic and anaerobic classes from both bacterial and archaeal lineages, with anaerobes using electron acceptors including sulfate, nitrate, nitrite, humic acids, and metals [25]. Methane oxidation with simultaneous nitrification and denitrification (ME-SND) has been previously demonstrated in attached-growth methanotroph reactors, achieving CH4 and nitrogen removal rates of 21 and 8 mg L−1 d−1, respectively [26,27,28]. ME-SND is appealing, as it reportedly improves the denitrification process, potentially due to methanotrophs’ production of organic intermediates. CH4 is readily available in wastewater treatment facilities as a product from the AD process and dissolved in AD wastewaters, and it yields N2 and CO2 as final products [7,16,29,30,31,32,33,34,35,36]. Under optimal conditions, ME-SND could take place in single-stage reactors for wastewater with high NH4+/CH4 contents and low NO2 concentrations; however, this would require the appropriate, narrow range of ecological niches for the reactions catalyzed by these distinct microbial groups to be active [16,37].
The aim of this study was to investigate ME-SND in single-stage aerobic MBfRs for the treatment of CH4- and NH4+-rich AD digestate from a full-scale wastewater treatment facility. The effects of inoculating reactors with methanotrophs, hydraulic retention time (HRT), and membrane O2 and CH4 pressures on reactor performance were explored, as were the effects of adding NO2 during both batch and continuous operations. Additionally, the effects of these variables on shaping the biofilm microbial communities were determined using bulk biofilm thickness characterization and 16S rRNA gene sequencing.

2. Materials and Methods
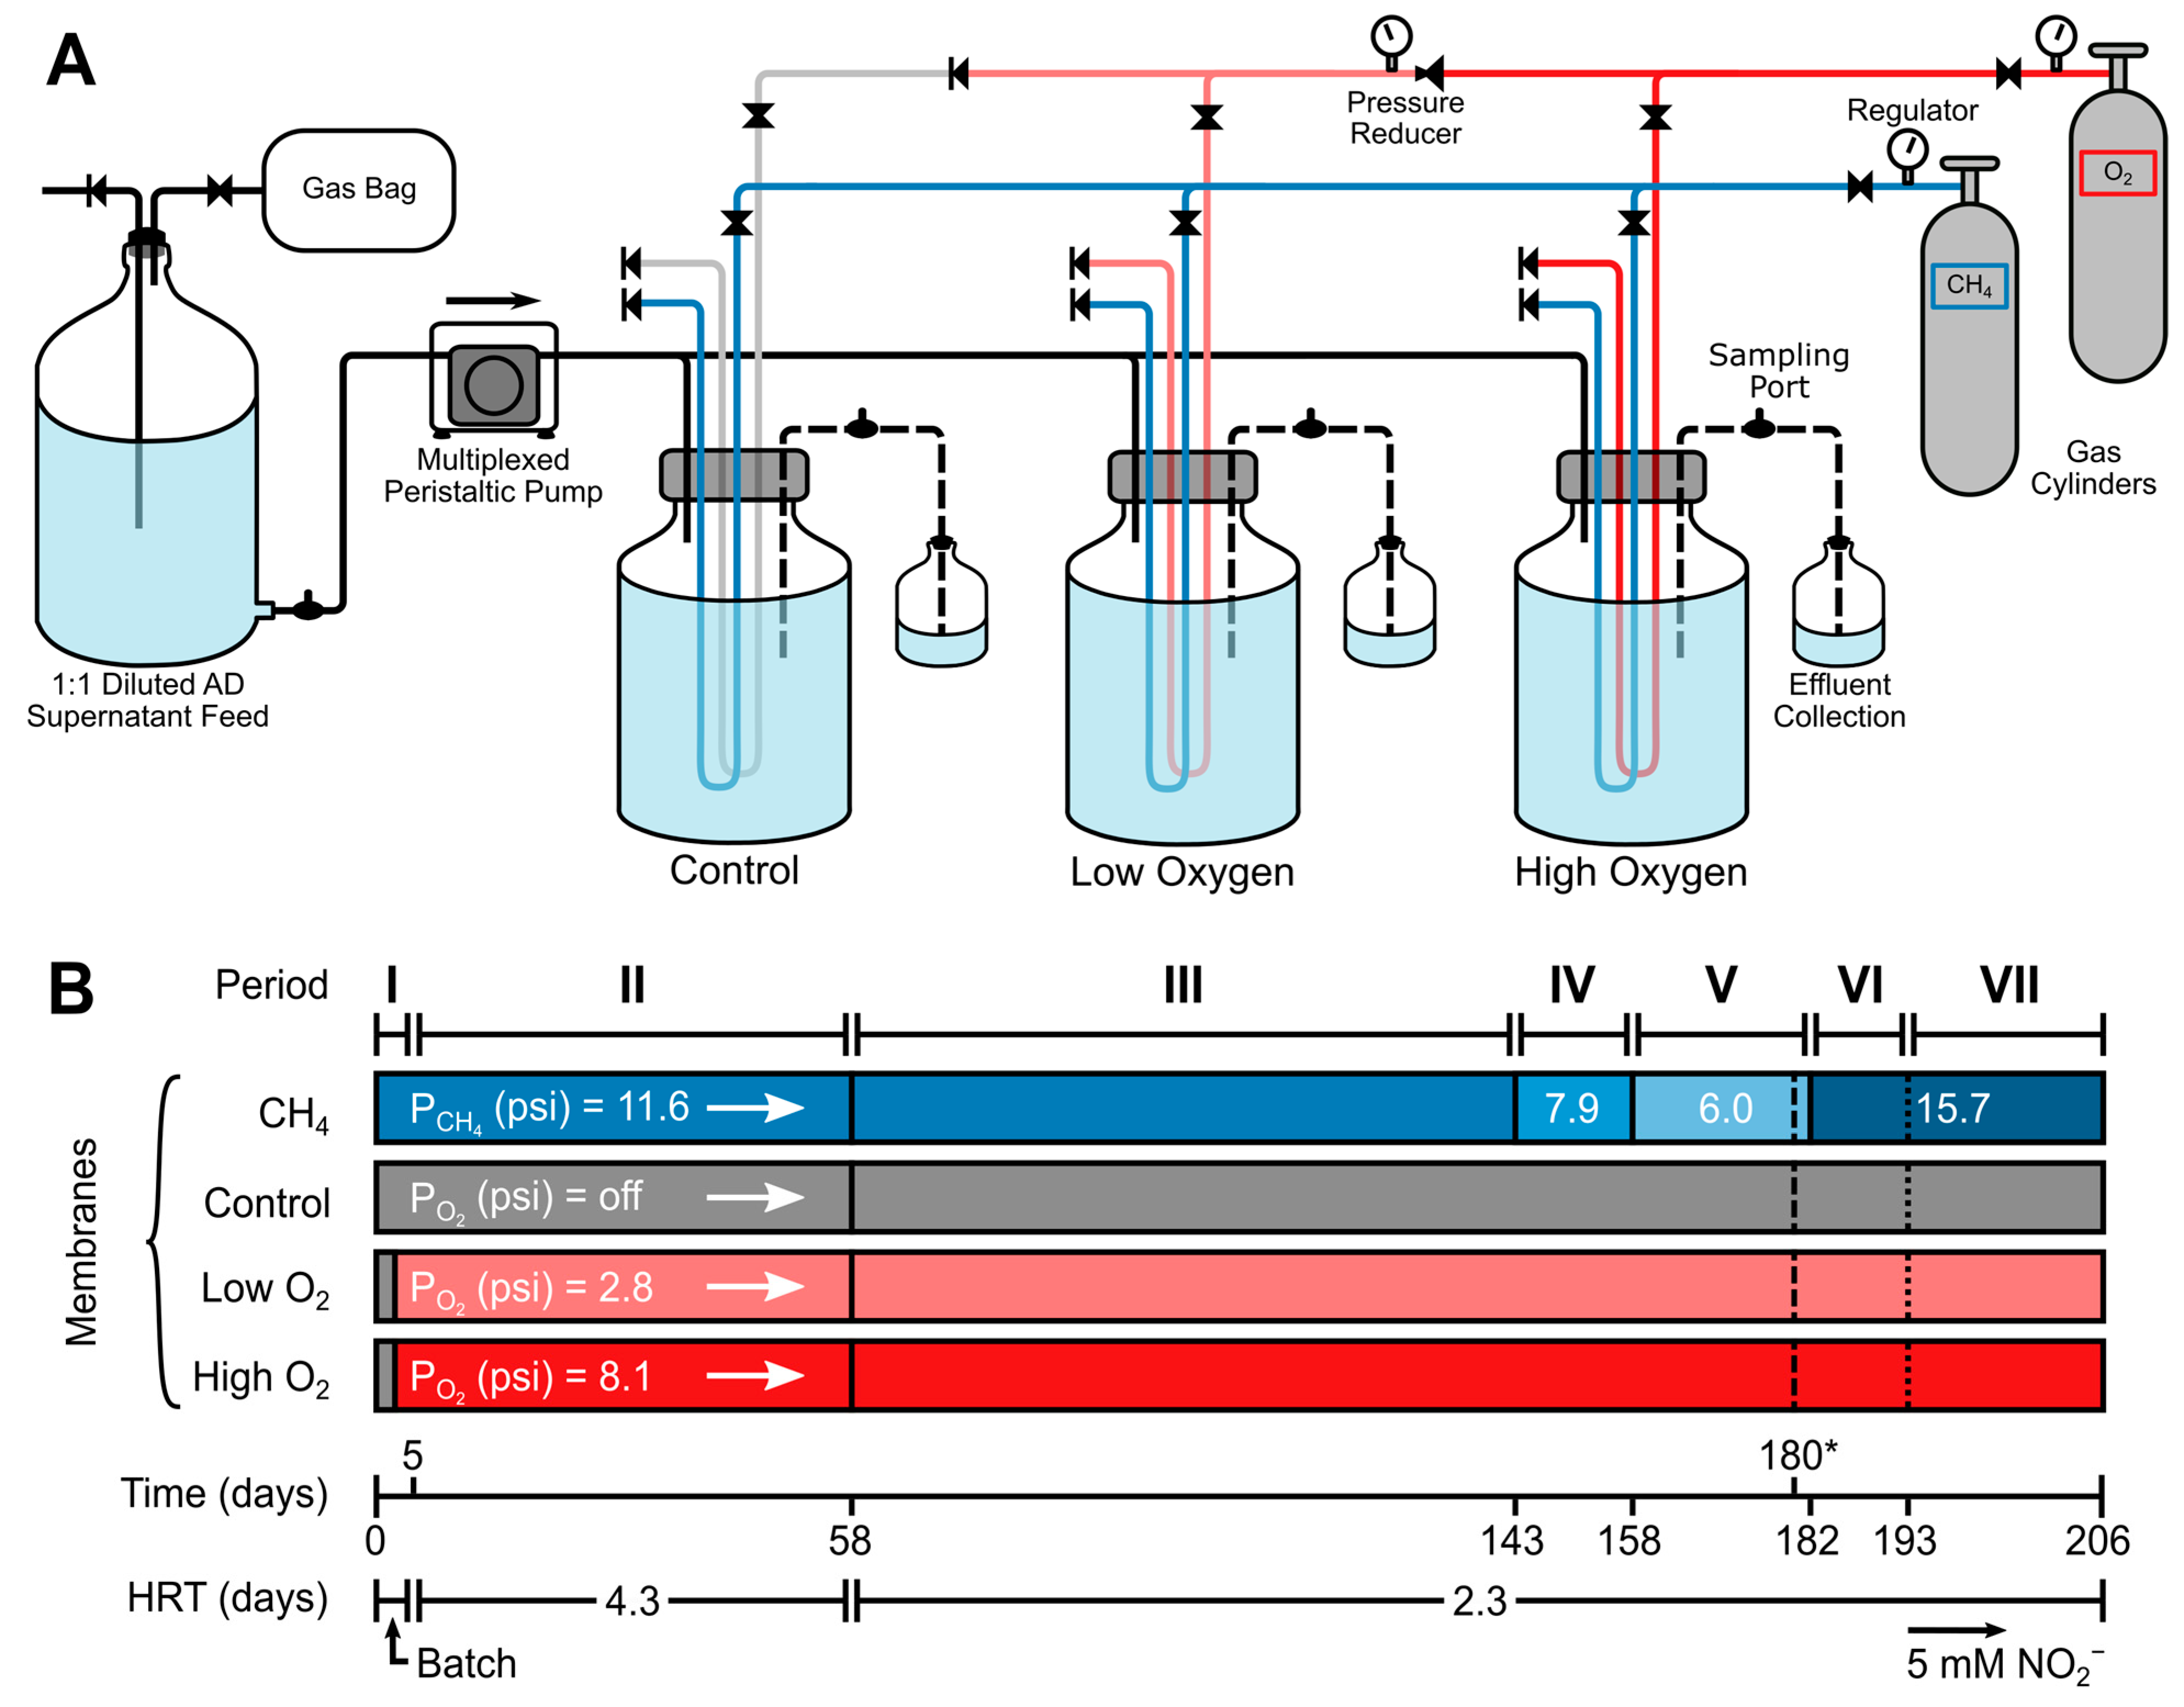
2.1. Reactor Setup

Previously described hollow-fiber membrane bioreactors [38] with membranes for the delivery of gases and biofilm growth were used (Figure 1A); see Table S2 in the Supplementary Materials for membrane properties.
The reactors were operated as chemostats at room temperature (22 ± 3 °C), continuously stirred, with a 0.80 L liquid volume and 0.27 L headspace volume. The membranes were connected to either a CH4 (≥99.5% purity, Airgas, Radnor, PA, USA) or O2 (≥99.99% purity, Airgas) compressed gas cylinder. Pressures were set using regulators, verified regularly, and adjusted using an Omega PCL425 Pressure Calibrator as needed (Omega Engineering Inc., Norwalk, CT, USA). HRTs were controlled by a multiplexed peristaltic pump (Ismatec, Wertheim, Germany). The reactors were fed secondary anaerobic digester (AD) digestate (see Table S3 for the AD digestate’s chemical composition) from the Ithaca Area Wastewater Treatment Facility in Ithaca, NY, USA. AD digestate was collected every 4–7 days, stored in a gas-tight carboy at 4 °C, and used within a week. Prior to use, the AD digestate was diluted 1:1 with Milli-Q water to avoid peristaltic pump clogging. The AD feed tank was a gas-tight 20 L Pyrex glass carboy (Corning, Corning, NY, USA) connected to a CH4-filled 10 L gas bag (Zefon International, Inc., Ocala, FL, USA) to keep the dissolved CH4 levels elevated and minimize O2 infiltration.

2.2. Reactor Startup and Operating Conditions

The reactor startup conditions are summarized in Table 1. The experimental conditions tested included the addition of initial mixed methanotroph inoculation (see Supplementary Materials) and membrane O2 pressure.
The initial membrane pressures were chosen based on the CH4 and O2 molar ratios and expected gas permeation for the given membrane dimensions [28]. All reactors had an initial 5-day batch period (Period I) for membrane biofilm growth before continuous operation and with no additional O2 for 2.5 days (Figure 1B), in order to avoid O2 stress prior to setting the pressures of the high-O2 and low-O2 reactors to 8.1 and 2.8 psig, respectively. An in-line pressure regulator decreased the pressure for low-O2 reactors (Figure 1A). The reactors’ operational periods and additional operational changes are shown in Figure 1B and Table S5.
The reactors were operated continuously for 206 days, with average HRTs of 4.34 ± 0.11 (Period II) and 2.29 ± 0.05 days (Periods III–VI). In Periods IV, V, and VI, the membrane CH4 pressures were changed, leading to different CH4/O2 membrane loading ratios (Table S4). To explore the effects on total N removal, the AD feed was amended with 5 mM NO2 in Period VII. On day 170 (Period V), the control reactor (R0) was knocked from its stir plate, causing significant membrane biofilm sloughing. Biomass samples were collected from the control reactor, and operations resumed.

2.3. Analytical Methods

Dissolved CH4, O2, and N2 concentrations were determined from headspace measurements using GC-TCD [38]; N2 was measured from day 83 (Period III) onwards. Due to atmospheric O2 and N2 interference, the minimum measurable dissolved concentrations corresponded to ~0.6 mg L−1. Nitrous oxide (N2O) reactor concentrations were determined from headspace samples on select days in Period III according to published GC methods [40]. Reactor liquid samples were collected every ~4.5 days and filtered using 0.22 μm syringe filters (Merck, Darmstadt, Germany) to determine dissolved PO43−, NH4+, NO2, and NO3; PO43− was measured until day 152. Reactor pH and COD, using CHEMetrics COD Vials Kit K-7365 (CHEMetrics, Inc., Midland, VA, USA), were measured in unfiltered samples. NH4+ and PO43− were determined using previously published colorimetric methods [41,42], and NO2 and NO3 were determined using ion chromatography [40]. COD and NH4+ readings were performed on a Tecan Infinite M200 Pro microplate reader (Tecan US, Inc. Raleigh, NC, USA). On select days, suspended biomass was determined as total suspended solids (TSS) using standard methods [43]. The AD supernatants’ organic nitrogen and total alkalinity were determined using the Nitrogen s-TKN™ Vial Test Kit TNT880 (HACH Company, Loveland, CO, USA) and the titration method, respectively [44]. Reactor performance was evaluated by CH4 and NH4+, NO2, and NO3 (total inorganic nitrogen, NTot) removal rates compared to the AD feed loading rate. CH4 and O2 consumption rates were determined using membrane pressures, measured dissolved gas levels, and a previously published permeation model [38].

2.4. Batch NO2 Tests

Short-term NO2 spike tests on day 180 (Period V, Figure 1B) were performed to observe reactor nitrogen cycling under batch conditions. During this time, the influent was stopped for ~24 h, and the CH4 and O2 pressures were kept constant. At time zero, NO2 was added to all reactors to increase the dissolved concentrations in the reactors by 2 mM. Gas and liquid samples were collected every few hours as described above. Continuous operation resumed at the conclusion of the tests.

2.5. Biomass and Biofilm Sampling

Suspended biomass samples from the control reactor (day 170) and AD feed influent (days 40 and 140) were pelleted, frozen, and processed as previously described [38]. On day 206, the membrane assemblies were removed, and biofilm samples were collected from membrane segments using sterilized razor blades (Figure S6) to determine biofilm thickness, biomass, and average reactor solid retention times (SRTs), as well as for nucleic acid extraction and microbial community analysis (see Supplementary Materials).

2.6. Nucleic Acid Extraction, Sequencing, Assembly, and Microbial Community Analyses

Nucleic acid extraction and DNA quality checking followed previous methods [38], DNA was PCR-amplified with primer set 515F-806R, targeting the V4 region of the 16S rRNA gene [45], on a T100 Thermal Cycler (Bio-Rad, Hercules, CA, USA) using Q5® Hot Start High-Fidelity 2X Master Mix (New England Biolabs, Ipswich, MA, USA). Gene amplicons were submitted to the Cornell Biotechnology Resource Center (BRC) Genomics Facility for quality control, library preparation, and sequencing. Sequencing was performed using the Illumina MiSeq platform with 2 × 250 paired-end read lengths. Raw sequences were demultiplexed and analyzed using the QIIME 2 (https://qiime2.org/ (accessed on 17 April 2021)) pipeline [46]. Reads were denoised and clustered into amplicon sequence variants (ASVs) using DADA2 v1.20 [47], with a max EE value of 6, and ASVs were annotated for taxonomy against the SILVA 138 99% database (https://arb-silva.de (accessed on 17 April 2021)) [48]. Data analysis and visualization were performed with the R package Phyloseq v1.38.0 [49], while Bray–Curtis dissimilarities for Principal Coordinate Analysis (PCoA) and diversity indices were determined using the R package vegan v2.5-7. Sequencing data were submitted to the NCBI database under submission: SUB12631397; BioProject ID: PRJNA928688.

3. Results

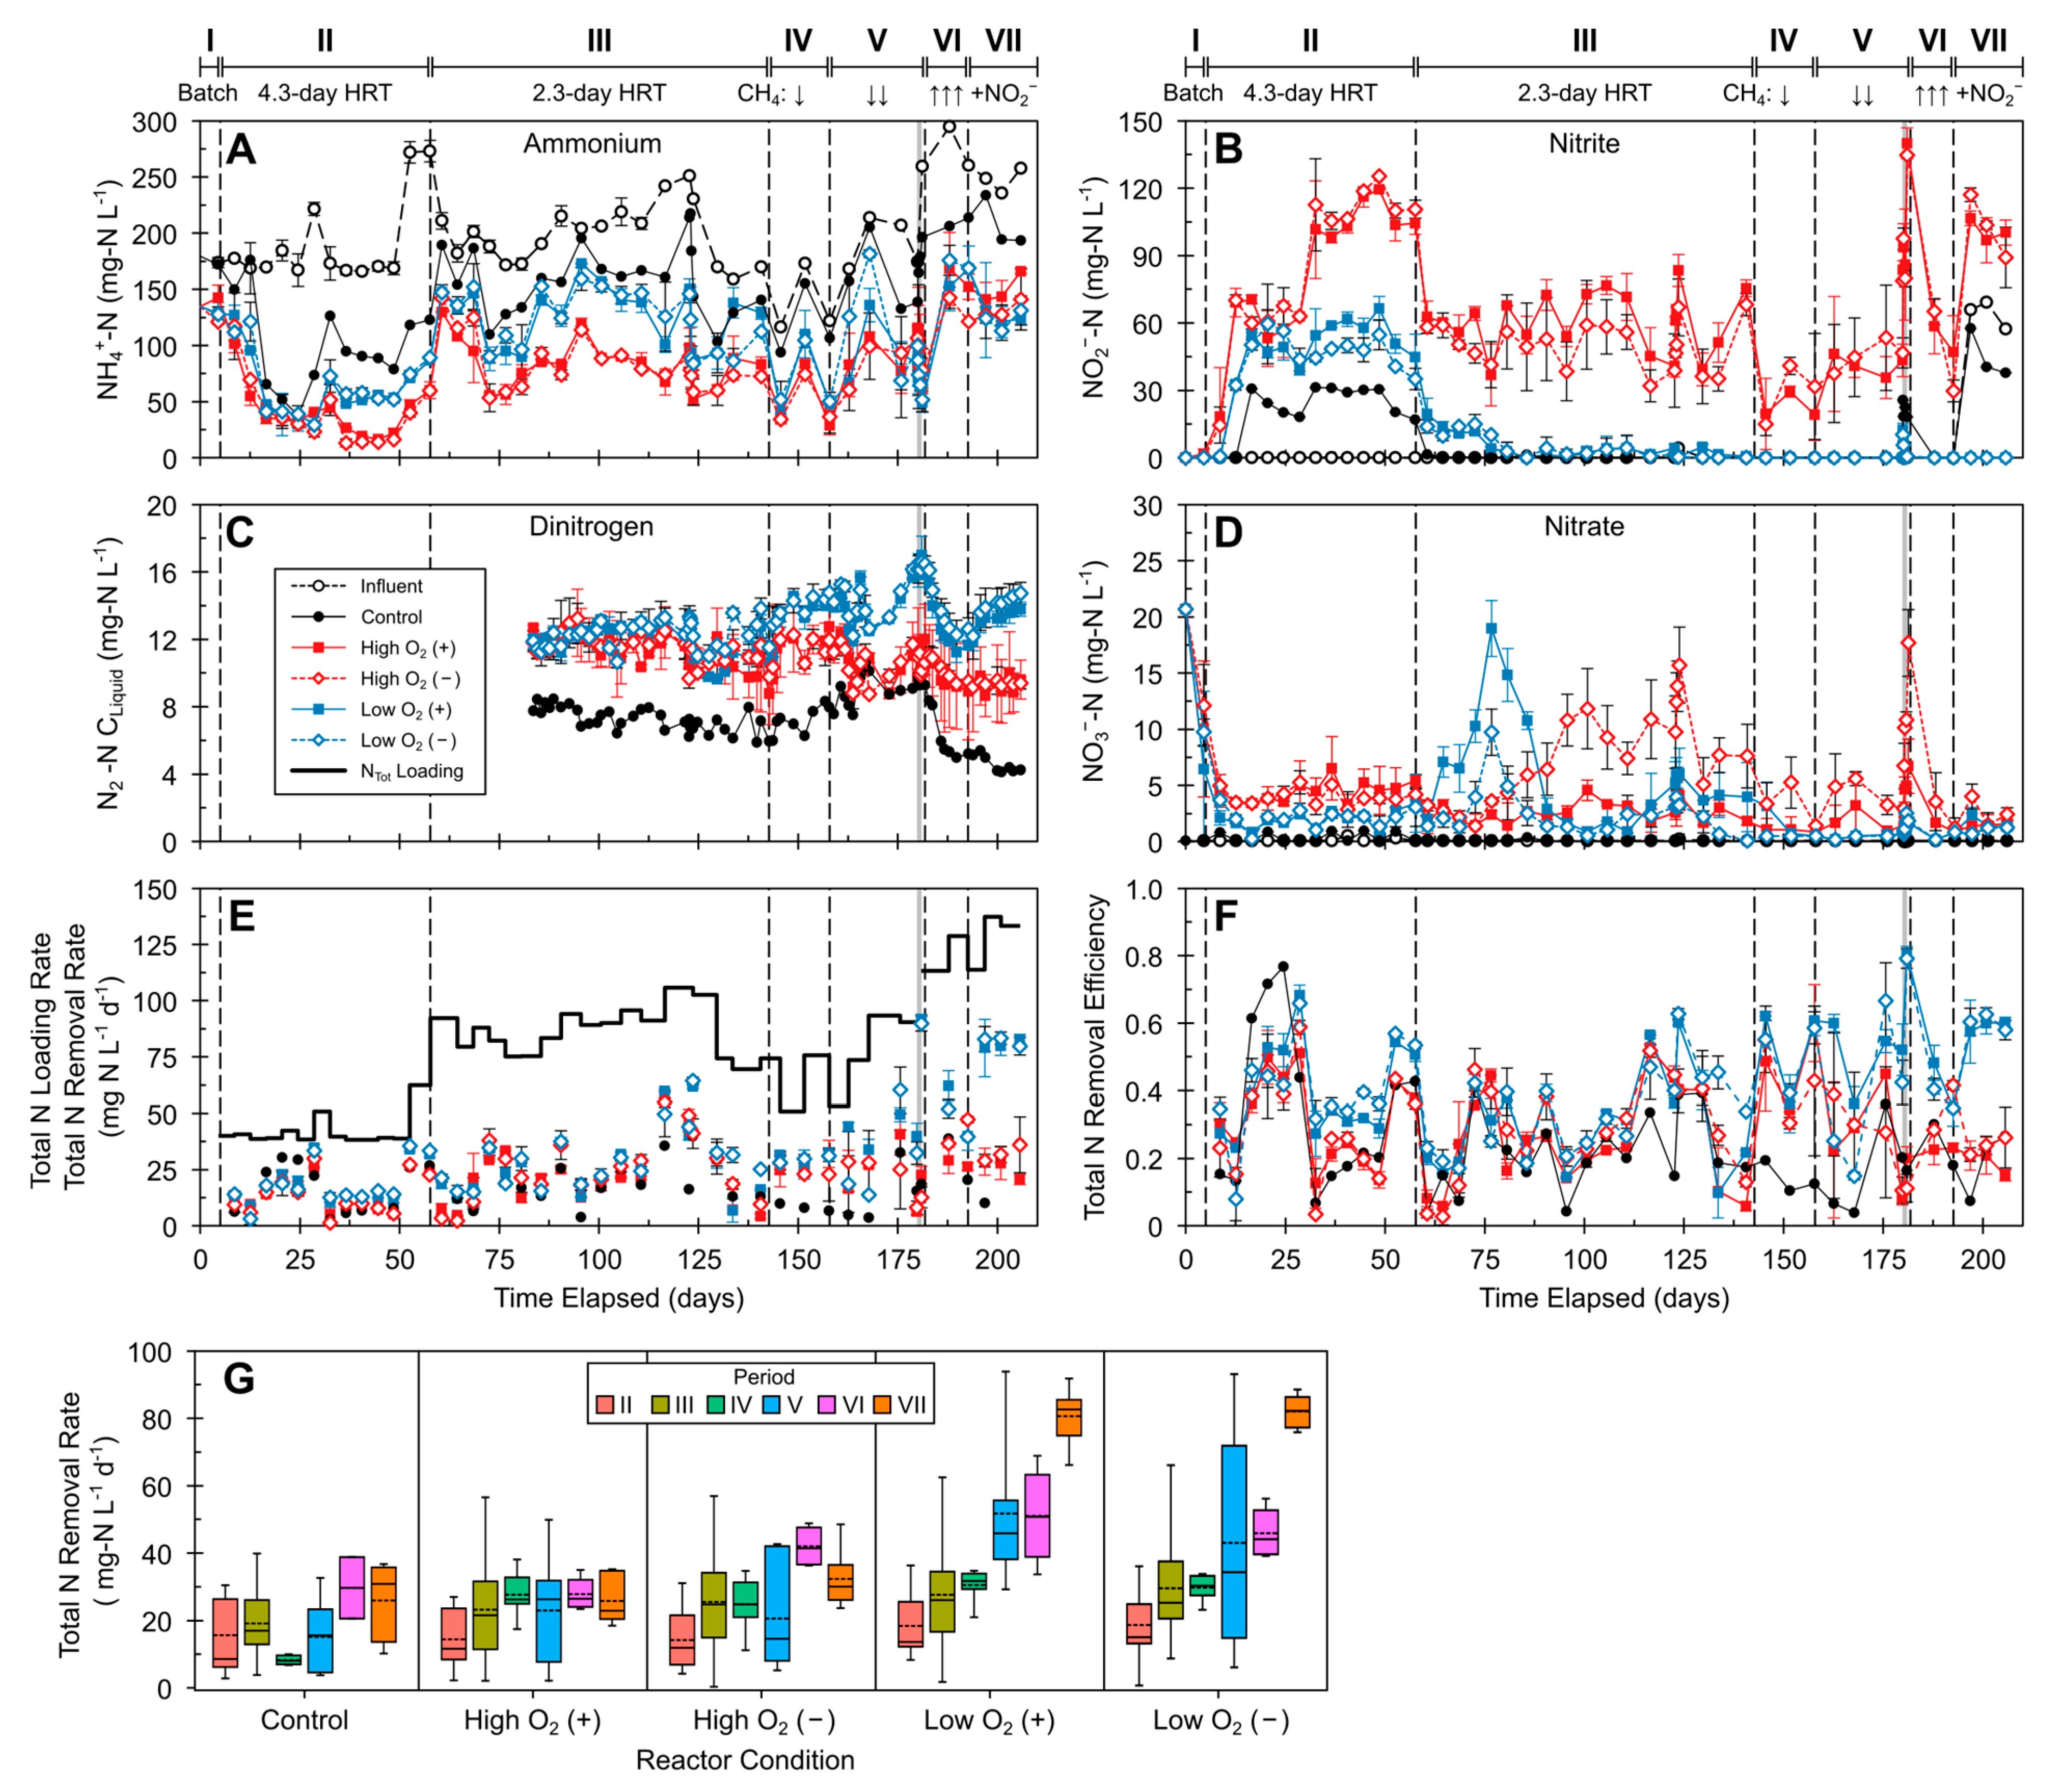
3.1. General Reactor Performance

The MBfRs were operated for a total of 206 days at two different HRTs and four CH4 pressures, for total of seven distinct operational periods (Figure 1). The effects of HRTs, O2, CH4/O2 loading ratios, and the addition of NO2 to the influent feed on CH4 and fixed N removals were explored (Figure 2).
The dissolved CH4 and O2 concentrations in the reactors depended on the CH4 and O2 membrane pressures and microbial transformation. Periods I–III (CH4 pressures ~11.6 psig) had generally consistent dissolved CH4 concentrations throughout operation, with the averages stabilizing during Period III (2-day HRT) at 13.3, 1.0, and 3.8 mg L−1 for the control (R0), high-O2 (R1–R4), and low-O2 (R5–R8) reactors, respectively. Changes in CH4 pressure in Periods IV–VII affected the dissolved CH4 concentrations in all reactors. Halving the CH4 pressure to 5.9 psig in Period V decreased the average dissolved CH4 concentrations to 9.2, 0.1, and 1.9 mg L−1 for the control, high-O2, and low-O2 reactors, respectively. Increasing the CH4 pressure to 16 psig (Periods VI and VII) was accompanied by an increase in average dissolved CH4 concentrations for all conditions above the averages for Periods I–III. Lower dissolved CH4 concentrations were observed in the high-O2 reactors throughout operation. Overall, the experimental reactors were effective in transforming incoming CH4—both dissolved in the influent and from membrane permeation. Average O2 pressures of 8.0 ± 0.2 psig and 2.9 + 0.1 psig were maintained for the high-O2 and low-O2 reactors, respectively (Figure 2B), and the O2 levels stabilized by about day 40 for the remainder of Period II (4-day HRT) in all reactors, with values of 0.8, 1.2, and 3.7 mg/L for the control, low-O2, and high-O2 reactors, respectively. In Period III (2-day HRT), the average dissolved O2 concentrations were 0.9, 1.0, and 2.5 mg L−1 for the control, low-O2, and high-O2 reactors, respectively. Inoculation only affected the O2 levels in the early part of Period II. Inoculated high-O2 reactors had higher dissolved O2 concentrations compared to uninoculated high-O2 reactors, and similar concentrations were observed starting on day 50 (Figure 2B). Minimal transformation of CH4 was observed in the AD influent feed (Figure S2). Inoculation did not influence CH4 removal (open versus closed symbols in Figure 2A).
The reactors’ COD levels ranged between 100 and 200 mg COD L−1 across all conditions and varied with influent COD (Figure 2C). During Period II, the reactors had COD removal rates > 318 mg COD L−1 d−1 and efficiencies > 0.86 (Figure S3). In Period III, with decreased HRT and increased COD loading rate, the removal efficiencies decreased (average efficiencies ranging from 0.70 to 0.77); however, the COD removal rates were comparable to those in Period II (294 mg COD L−1 d−1; Figure S3). COD removal was impacted by influent feed COD and supplemental CH4 membrane permeation, as observed during Periods VI and V (low CH4 pressure) and Periods VI and VII (high CH4 pressure) (Figure 2C).
The reactors’ TSS did not differ significantly across reactor conditions (Figure 2D); the drastic increase in the control reactor’s TSS in Period V was due to sloughing on day 170. The average SRT (Table S6) of all reactors was 71.1 days (reactor averages of 62.4–78.0 days) during Period II and 40.5 days (reactor averages of 12.1–56.8 days) for Periods III–VII. The reactor pH levels were generally between 6 and 8 for all reactors, with a short-period pH below 6 in high-O2 reactors (Figure S1B). The control reactor’s pH was most similar to the influent pH, and slightly lower pH was observed in the experimental reactors (Figure S1B). In the experimental reactors, longer HRTs (Period II) resulted in lower reactor pH compared to shorter HRTs (Periods III–VII).

3.2. Fixed Nitrogen Transformations and Removal

Key nitrogen species data are shown in Figure 3. The influent nitrogen consisted almost entirely of NH4+, with concentrations between ~125 and 275 mg NH4+-N L−1 due to variations in the AD supernatant, while the influent NO2 and NO3 levels were below the 0.07 mg N L−1 detection limit (Figure 3A,B). Organic-bound nitrogen was also present in the AD influent and was typically about half the N concentration of NH4+-N (Table S3).
Initial inoculation did not affect the overall reactor nitrogen removal, and O2 pressure had the biggest effect on nitrogen transformation.
The reactors achieved their lowest effluent NH4+ concentration in Period II, accompanied by an increase in NO2 concentration, reaching maxima of about 30, 120, and 60 mg NO2-N L−1 for control, high-O2, and low-O2 reactors, respectively. Lowering the HRT in Period III to 2.3 days led to lower NO2 levels in all reactors compared to Period II, with average concentrations of 55.3 and 4.4 NO2-N L−1 for high-O2 and low-O2 reactors, respectively. In Periods IV and V, the decreased CH4 pressure was accompanied by a decrease in NO2 concentrations in high-O2 reactors, while CH4 pressure changes did not affect the NO2 levels in low-O2 reactors, which had levels consistently < 0.1 NO2-N L−1.
In Periods III–V (2.3-day HRT), the reactors’ NH4+ concentrations were largely dependent on influent NH4+, with reactor concentrations around 75 and 125 mg NH4+-N L−1 for high-O2 and low-O2 reactors, respectively, while the control reactor NH4+ levels were similar to the influent levels. The decrease in CH4 pressure in Period V caused low-O2 reactors’ NH4+ levels to increase, while those of high-O2 reactors remained unchanged. Following the addition of 70 mg NO2-N L−1 (5 mM NO2) to the influent in Period VII, low-O2 reactors consistently achieved lower NH4+ concentrations compared to high-O2 reactors. Influent NO2 in Period VII was not transformed in high-O2 and control reactors, while the low-O2 reactors’ NO2 levels remained <0.1 NO2-N L−1, indicating rapid transformation of both exogenous and nitrifier-produced NO2.
Other than temporary increases in NO3 levels in low-O2 reactors (days 70–90) and uninoculated high-O2 reactors (days 95–122), the NO3 concentrations were ≤5 mg NO3-N L−1 for the experimental reactors and below the detection limit in the control reactor (Figure 3D). High ratios of NO2 to NO3 levels in high-O2 reactors indicated a preference for partial nitrification over complete nitrification. The N2 concentrations were higher in experimental reactors compared to both the control reactor and the AD influent (Figure 3C and Figure S2). In Periods IV–VII, the low-O2 reactors’ N2 concentrations were consistently ~2 mg N2-N L−1 higher compared to high-O2 reactors, reaching a maximum difference in Period VII of 4.3 mg N2-N L−1, coinciding with the addition of NO2 to the influent.

3.3. Total Inorganic Nitrogen (NTot) Removal

The total inorganic nitrogen influent loading and removal rates of the membrane bioreactors are shown in Figure 3E. During Periods I–VI, the NTot influent loading consisted almost entirely of NH4+; additional NO2 was added to influent in Period VII. In Period II, with comparable NH4+ removal in all reactors, the low-O2 and control reactors had better NTot removal rates, as less NO2 and NO3 were produced compared to high-O2 reactors. The maximum NTot removal rate by low-O2 reactors during Period II was 36.2 mg N L−1 d−1, with removal efficiencies ranging between 0.6 and 0.8 (Figure 3E,F). After decreasing the HRT in Period III, the NTot loading rate increased, and the experimental reactors’ removal rates generally remained between 25 and 75 mg N L−1 d−1 (removal efficiencies of 0.2–0.6) until the end of Period IV. The control reactor’s removal rate and efficiency steadily decreased with continued operation. Greater NH4+ conversion and NO2 and NO3 accumulation, and therefore lower NTot removal rates, in high-O2 compared to low-O2 reactors continued throughout the reactors’ operation. The addition of NO2 (Period VII) led to the biggest difference in nitrogen removal rates and efficiencies between the reactor O2 conditions. High-O2 reactors’ performance was not affected, while low-O2 reactors had a maximum NTot removal rate of 91.7 mg N L−1 d−1, among the highest during this study. NTot loading and CH4 pressure did not strongly affect the control and high-O2 reactors’ NTot removal rates, while the low-O2 reactors’ performance steadily increased throughout operation (Figure 3G). The addition of NO2 to the influent had the biggest impact on nitrogen removal in low-O2 reactors. The N removal rates for the reactors are summarized by period in Table S7.
N2O emissions from nitrification and denitrification treatment of wastewater can be significant [50] and are strongly associated with influent O2 levels and NH4+-N loading [51]. Reactor N2O amounts were measured on three selected sampling dates in Period III (Figure S4); N2O production was only observed in experimental reactors where O2 was provided. Inoculation showed no effect on N2O levels in high-O2 reactors, with N2O levels ranging between 1.10 and 1.45 mM. The N2O levels in low-O2 reactors varied considerably; inoculated and uninoculated low-O2 reactors had N2O concentrations of 1.72–2.33 and 0.001–0.624 mM N2O, respectively.

3.4. Short-Term NO2 Addition Tests

The 24-hour NO2 spike tests (batch tests with 2 mM NO2 added) were conducted on day 180 to observe reactor nitrogen transformation and determine potential NO2 limitation and anammox potential (Period V; Figure S5). No significant changes were observed in dissolved gases (O2, CH4, and N2), while high-O2 reactors had higher NO2 and NO3 production compared to low-O2 reactors. NO2 disappearance and NO3 production in low-O2 reactors were potential indicators of denitrification and anammox.

3.5. Membrane Biofilm Characteristics

Biofilm growth was visible on all reactor membranes after Period I. The biofilms were uniform in color but varied in thickness, likely influenced by the reactor mixing conditions (Figures S6–S9; further discussion in the Supplementary Materials). O2 membranes (60 cm) accounted for a higher fraction of overall biomass compared with CH4 membranes (20 cm). The fraction of biofilm biomass in the CH4 membrane was higher in high-O2 reactors compared to low-O2 reactors (Figure S6A). Total biofilm biomass > 1250 mg was observed in all experimental reactors (Figure S6B). While the CH4 membrane biofilms in high-O2 reactors were generally thicker compared to low-O2 reactors, the O2 membrane biofilm thicknesses were similar across all reactors (Figure S6C,D).

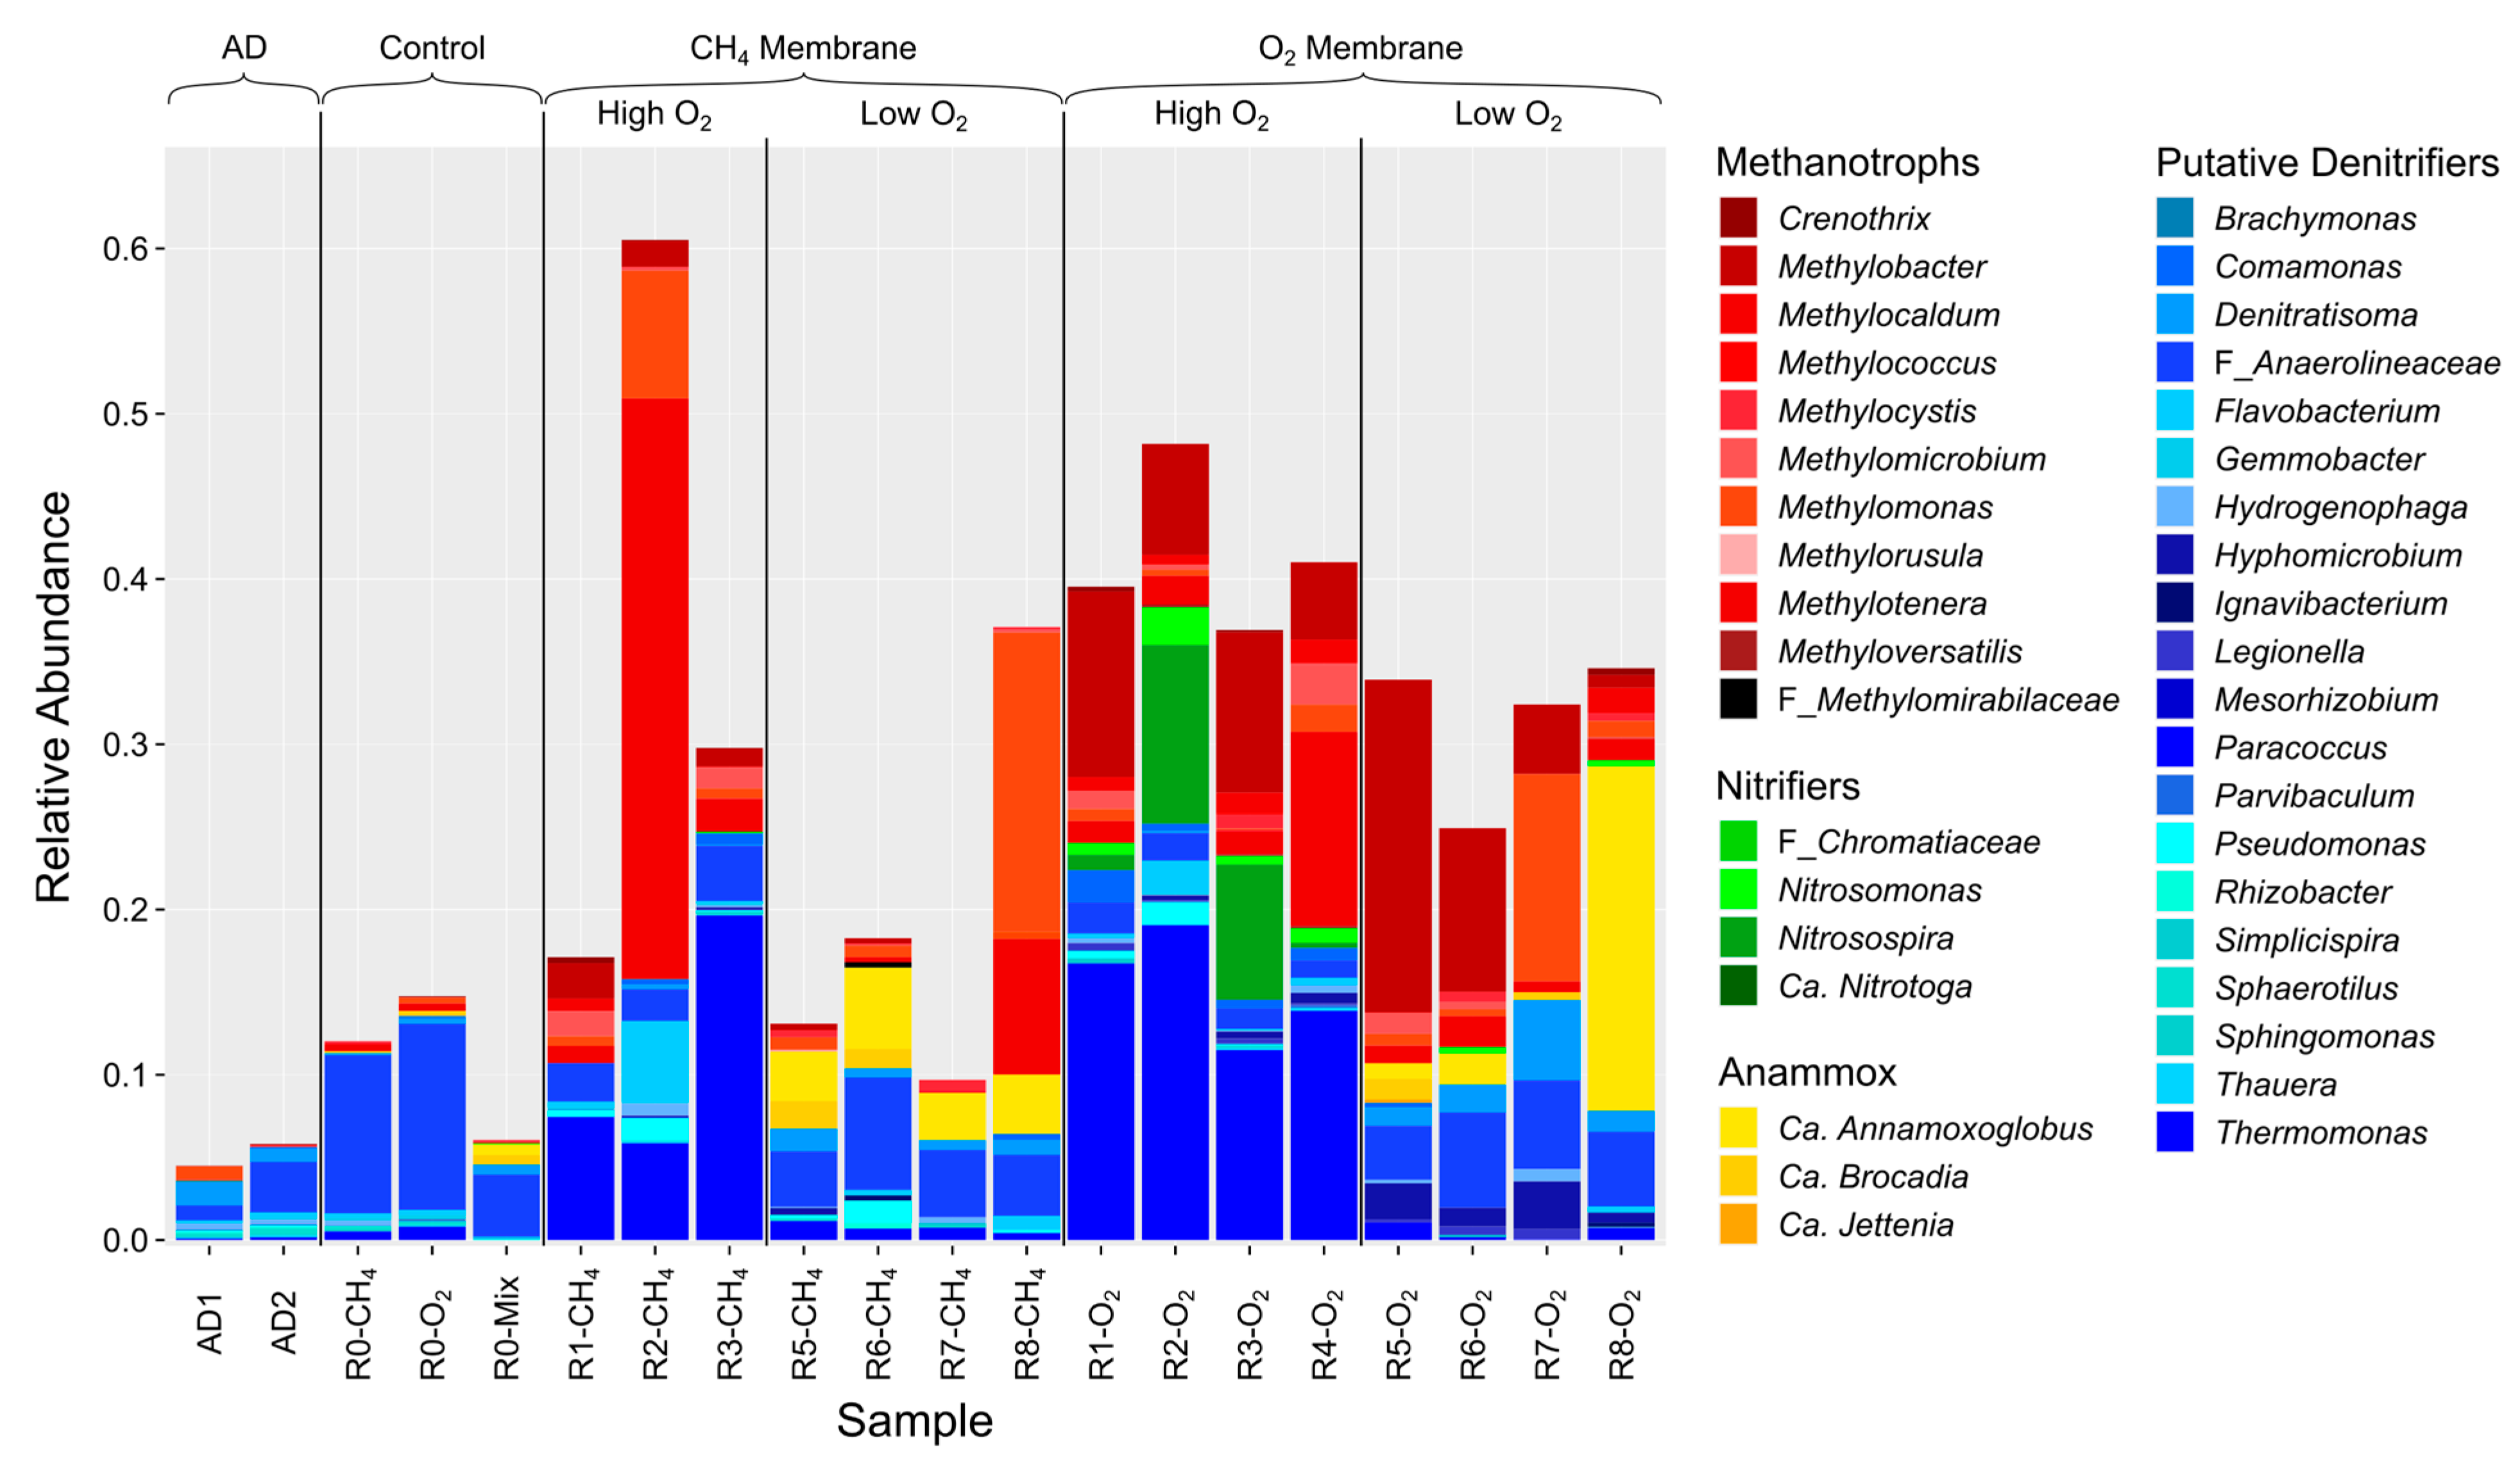
3.6. Biofilm Microbial Community Structure and Diversity
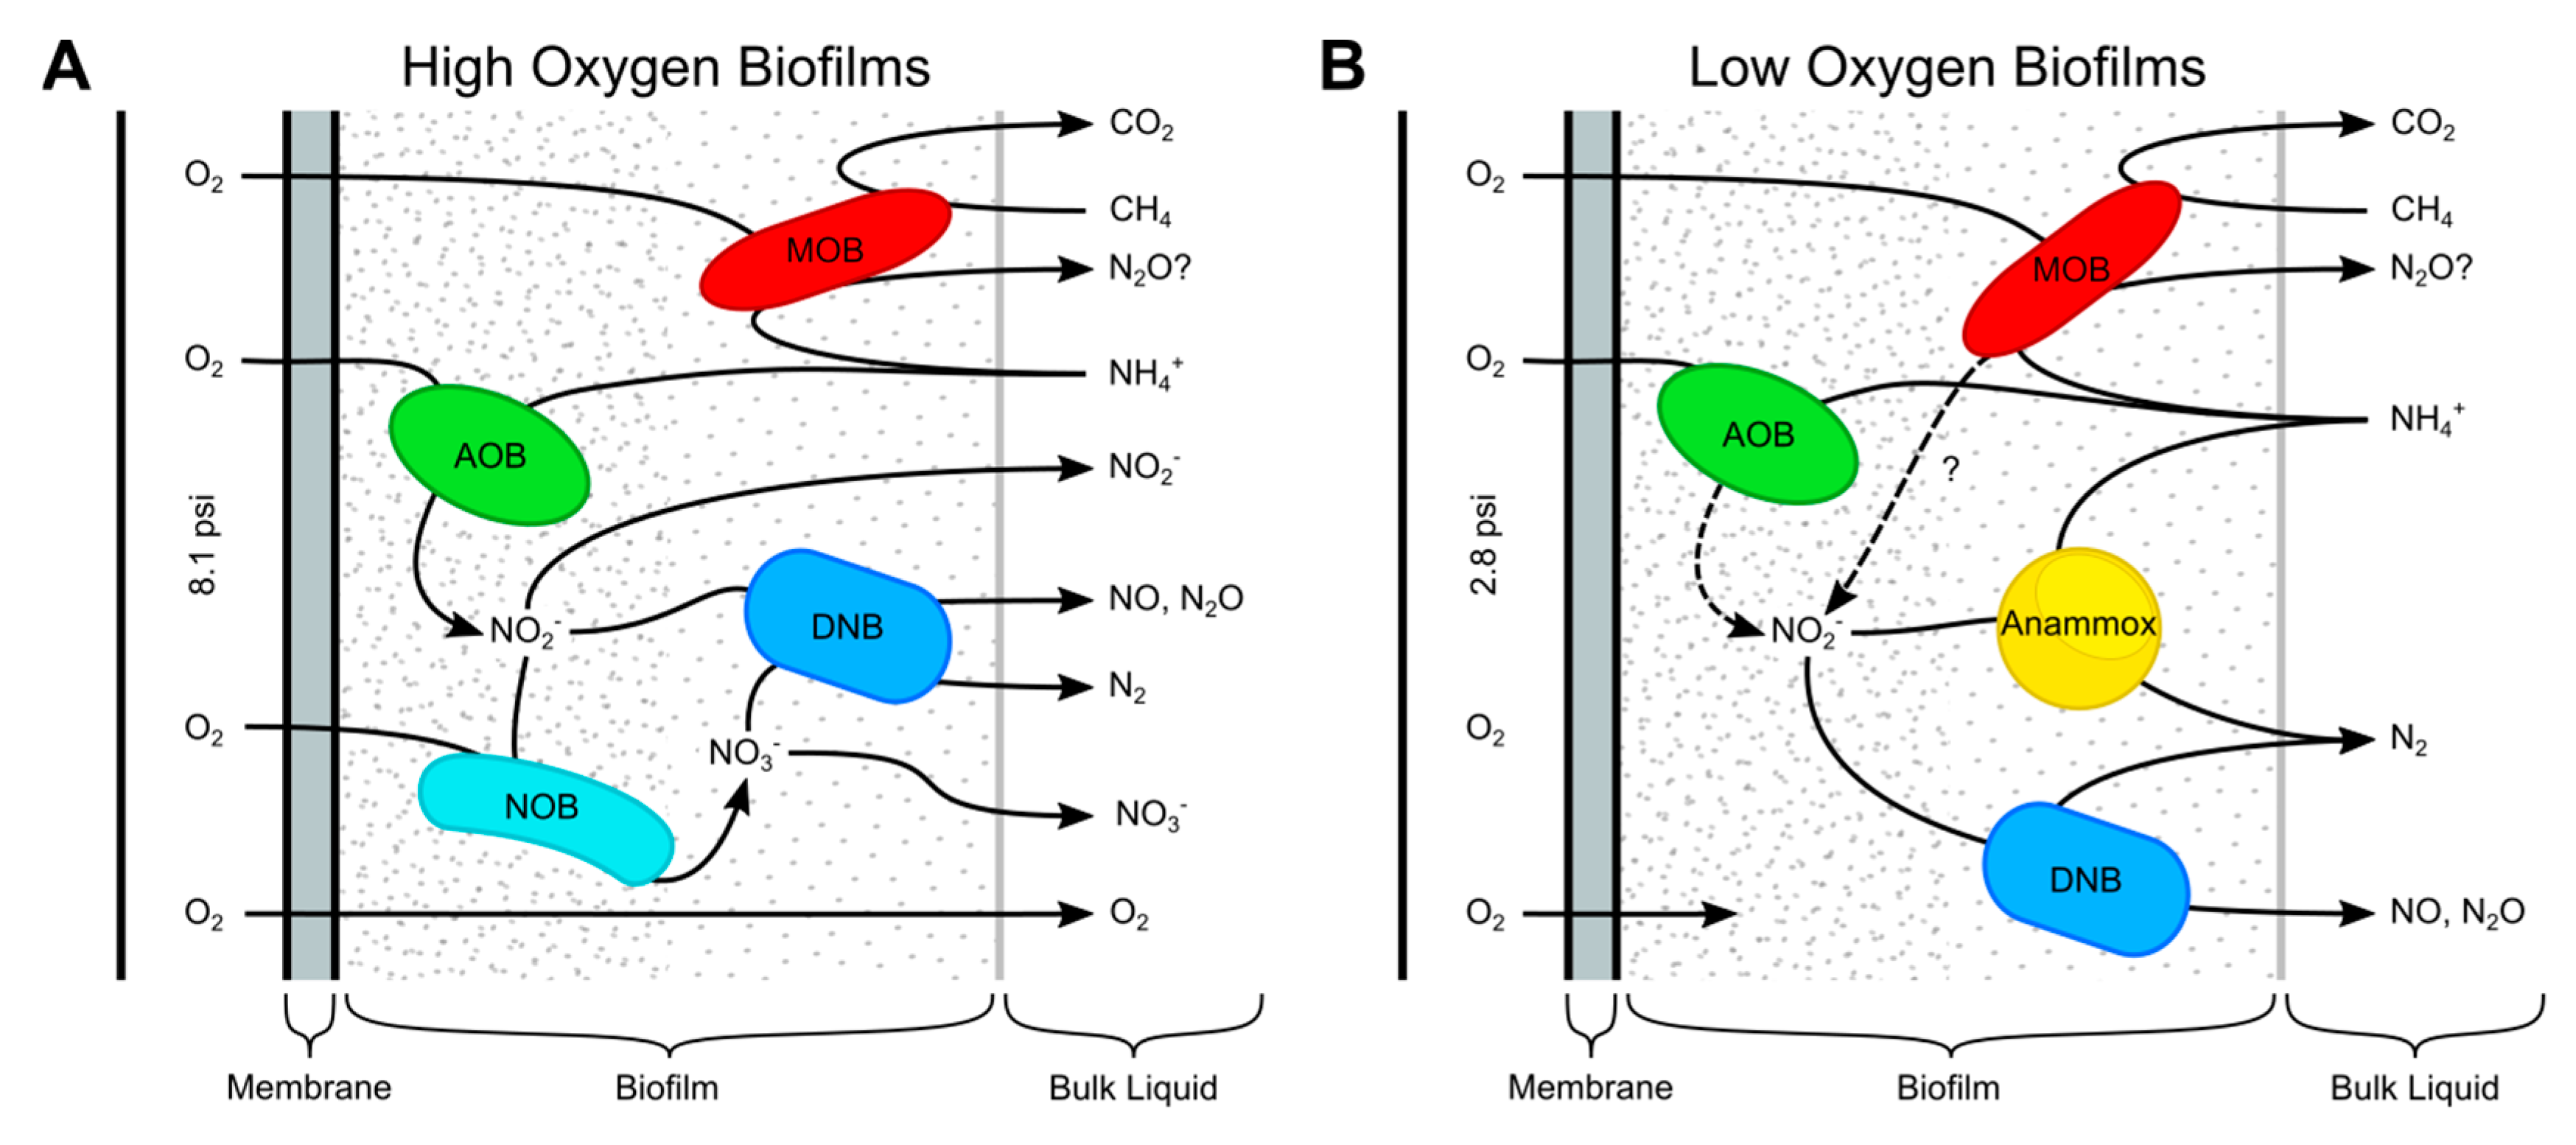
Clustering by reactor O2 condition (Figure 4), consisting of AD influent and control, low-O2, and high-O2 reactors, was observed in the PCoA, and high-O2 and low-O2 samples were distinguished along Axis 1 and Axis 2, respectively. The community in the control reactor was most similar to that of the AD feed samples, whereas inoculation showed no impact on the experimental reactors’ microbial diversity by day 206.
Additional clustering by membrane was observed for high-O2 and low-O2 reactors, where the O2 membrane microbial communities were most distinct from both the AD feed and the control reactor. The AD feed and control reactor exhibited the highest Fisher diversity, followed by high-O2 reactors and low-O2 reactors with the lowest Fisher diversity (Figure S10). Differences in the Fisher diversity of the reactor biofilm microbial communities compared with the AD supernatant and due to O2 conditions for the experimental reactors were statistically significant (Kruskal–Wallis test, p < 0.005, Figure S10). Genus-level taxonomic classifications of ASVs from 16S rRNA membrane biofilm sequencing samples of genera involved in CH4 and fixed nitrogen metabolism are summarized in Figure 5.
Relevant microbial groups highlighted in Figure 5 include methane-oxidizing bacteria (MOB), nitrifiers (including ammonium-oxidizing bacteria (AOB) and nitrite-oxidizing bacteria (NOB)), putative denitrifying bacteria (DNB), and anammox bacteria. The control reactor samples most resembled the AD samples in both overall community composition and abundance of CH4- and N-cycling microorganisms. The R0-Mix sample (day-170 sloughed biofilm) had >1% anammox organisms (Ca. Anammoxoglobus and Ca. Brocadia), higher than the day-206 membrane biofilms; these organisms were likely reestablishing on the R0-O2 membrane (<1% of the population).
Enrichment of CH4- and N-cycling microbes was observed in the experimental reactors compared to the AD feed and control samples (summed relative abundances of 4.5–14.8% and 9.7–60.6% for the experimental reactors and AD feed/control reactor, respectively). For both reactor conditions, aerobic MOB (Methylobacter, Methylomonas, and Methylotenera) were present at high relative abundances in both membranes in high-O2 reactors, while O2 membranes were preferred in low-O2 reactors. Methanotroph inoculum organisms were present at significantly lower abundances compared to other MOB, and long-term effects on microbial community due to inoculation were not observed. NC10 phylum anaerobic MOB (family Methylomirabilaceae) were measured in R6-CH4 samples, with relative abundance < 0.5%.
Nitrifiers (genera Nitrosomonas, Nitrosospira, and Ca. Nitrotoga) preferred O2 over CH4 membranes in high-O2 reactors, with lower abundances in low-O2 reactors. Putative denitrifiers (genera Comamonas, Flavobacterium, Denitratisoma, and Thermomonas) were found at similar relative abundances across all reactor samples; the genus Hyphomicrobium was observed in O2 membranes in low-O2 reactors and was absent in high-O2 reactors. Organisms from the Anaerolineaceae family, mainly consisting of anaerobic fermenters commonly found in wastewater [52,53], were found in all reactors, with higher relative abundances in low-O2 and control reactors compared to high-O2 reactors. The family Anaerolineaceae includes potential denitrifiers [54] often found alongside anammox organisms [55] and previously reported in both anammox and nitrite-dependent denitrifying anaerobic methane oxidizer (DAMO) reactors [24,56]. Anammox bacteria (family Brocadiacea) were absent in high-O2 reactors, while they represented a significant portion of reads in CH4 and O2 membrane biofilms (from ~1% up to 20.9% of reads) in low-O2 reactors. The majority of anammox bacteria were from the genus Ca. Anammoxoglobus, followed by the genus Ca. Brocadia.

4. Discussion

MBfRs performed simultaneous removal of CH4 and N from CH4- and NH4+-rich anaerobic digester effluent. Low-O2 conditions yielded better total fixed N removal compared to high-O2 conditions, as lower O2 levels allowed for partial nitritation coupled with anammox. High-O2 conditions yielded higher oxidation of NH4+ to NO2 but decreased transformation to NO3. Low-O2 reactors achieved nitrogen and CH4 removal efficiencies of up to 67% and >97%, respectively. High COD removal efficiencies (generally 80–90%) were observed for both sets of experimental reactors throughout operation. The CH4 and N removal efficiencies in this study were comparable to those of a two-stage anoxic–oxic membrane bioreactor system for the treatment of upflow anaerobic sludge blanket (UASB) reactor effluent (60% N removal and 95% CH4 removal) [57]. The methanotroph populations observed by Sánchez et al. consisted of phylum NC10 anaerobic methanotrophs and aerobic methanotrophs [57], while the methanotroph population in this study consisted almost entirely of proteobacterial aerobic methanotrophs. Similar to this study, high abundances of proteobacterial methanotrophs (genera Methylococcus and Methylocystis) and heterotrophic denitrifiers were observed in MBfRs capable of nitrite reduction [35].
The reactors in this study (maximum removal rates of 57–94 mg N L−1 d−1) achieved higher nitrogen removal rates compared to nitrite-dependent DAMO membrane bioreactors (20–40 mg N L−1 d−1) [17,58,59]. Despite having a lower membrane surface area/working volume ratio, the maximum N removal rates in this study were comparable to those of membrane nitrite-dependent DAMO and anammox bioreactors, with rates ranging from 67.8 to 190 mg N L−1 d−1 [60,61,62]. Cao et al. demonstrated ME-SND in MBfRs capable of NH4+ removal rates of 38.09 mg N L−1 d−1, where the addition of CH4 promoted NH4+ removal and N2O production following denitrification [13]. ME-SND in MBfRs provided synthetic wastewater and O2/CH4 ratios of 1.47 and 2.1, comparable to the ratios in this study (Table S4), achieving NH4+ removal rates of 77.5 and 95 mg L−1, respectively [63]. Maximum N removal rates as high as ~1000 mg N L−1 d−1 have been reported for membrane biofilm nitrite-dependent DAMO/anammox systems [56,64]. However, these were for reactors inoculated with anammox/nitrite-dependent DAMO enrichment cultures, with >400-day operational periods, and provided with a synthetic influent containing both NH4+ and NO2. Additionally, they had approximately 8-fold higher membrane surface-area-to-volume ratios compared to this study, and increasing the membrane surface areas for biofilm growth has been shown to achieve better N removal rates and efficiencies [61]. Higher membrane surface-to-volume ratios could improve the N removal rates observed in this study.
Elevated NO2 and NH4+ concentrations can be inhibitory to relevant microbial groups, including AOBs, methanotrophs, and anammox bacteria. NO2 levels in the 5 mM (70 mg N L−1) range have been shown to cause a ~50% decrease in activity in obligate NH4+ oxidizers [65]. NO2 effects on NH4+-oxidizing activity seem to be organism-specific, with some organisms (Nitrosomonas europaea and Nitrosospira multiformis) tolerant of up to 20 mM (280 mg N L−1) with no effect on activity [66]. The NO2 levels observed in this study were generally <5 mM (70 mg N L−1) throughout operation, while levels above 8 mM NO2 were observed for high-O2 reactors in Periods II and VI (Figure 2). For anammox bacteria, reported inhibitory NO2 concentrations range from 100 to 280 mg NO2-N L−1 (7.1–20 mM NO2) [67,68], depending on growth conditions, and inhibition effects are mostly reversible [69]. Anammox-inhibitory NO2 levels are higher than the levels observed in this study, except for high-O2 reactors during Period II, batch tests, and Period VII (Figure 2D and Figure S5). The combination of high NO2 and O2 levels and low pH observed before day 45 in high-O2 reactors could have affected the initial growth of anammox bacteria, leading to other organisms colonizing the membranes (e.g., nitrifiers). NH4+ levels up to 1000 mg NH4+-N L−1 are not inhibitory for anammox bacteria [67], and the NH4+ levels in this study were below this threshold. O2 levels can also reversibly inhibit anammox activity. Reported dissolved O2 levels for anammox inhibition vary by organism, ranging from microaerobic levels (<0.04–0.12 mg O2 L−1) to ~2 mg O2 L−1 [70,71,72,73]. No significant anammox growth was observed for high-O2 reactors, likely due to the O2 permeation rates resulting in higher dissolved O2 concentrations in the bulk liquid (≥2 mg O2 L−1). In low-O2 reactors, the bulk liquid O2 levels were near the method detection limit of 0.6 mg O2 L−1, and anammox bacteria were well represented in the O2 membrane biofilms despite their sensitivity to O2. This could be due to the anammox bacteria in low-O2 reactors being NO2-limited, as shown by the fast NO2 transformation during batch tests (Figure S5D). Localized higher NO2 production at the O2 membrane interface likely favored anammox growth within the O2 membrane biofilm. Growth and activity of microbial groups under otherwise-inhibitory O2 levels have been observed for attached-growth denitrifier, nitrite-dependent DAMO, and anammox reactor systems [18,21,74]. Therefore, the growth mode (e.g., suspended vs. attached) can lead to microbial activity even under bulk liquid substrate levels that can cause inhibition.
The CH4 removal efficiencies observed in this work were comparable to those of anammox/DAMO reactors, which typically have efficiencies ranging from 85 to 96% [64,75]. Modeling efforts have also demonstrated the feasibility of O2-permeation MBfRs for the simultaneous removal of NH4+ and CH4 in single-stage reactors. Chen et al. found high potential removal efficiencies of both CH4 and nitrogen via stratified microbial biofilms containing AOB, methane-oxidizing bacteria (MOB), anammox bacteria, and DAMO organisms [37,76]. Key challenges for the removal of nitrogen and dissolved CH4 in these reactors were HRT and O2 surface loading rate. As mentioned previously, control of O2 in these reactors is critical, as O2 is necessary for the oxidation of CH4 and partial oxidation of NH4+ to NO2 but can inhibit the activity of DAMO and anammox microbes [67].
Methanotrophs have diverse nitrogen metabolisms, capable of using NH4+ and NO3 as N sources for growth [77]. Alternatively, both NH4+ and NO2 can inhibit methanotrophic activity, with effects highly dependent on their relative amounts, e.g., high NH4+ concentrations are more inhibitory at low CH4 concentrations compared to high CH4 concentrations, which is consistent with competitive inhibition at the enzyme’s active site [77,78]. NH4+ and NO2 inhibition effects on methanotrophs generally vary by organism [78]. Given the activity and relative aerobic abundances of aerobic methanotrophs in the MBfRs, inhibition due to NH4+ and NO2 was assumed to be insignificant.
Due to the similarity of methane monooxygenase (MMO) and ammonia monooxygenase (AMO) enzymes, methanotrophs are capable of NH4+ oxidation, potentially producing NO2 [79]. However, the maximum specific NO2 production rate of methanotrophs is more than 20 times lower than the lowest NH4+ oxidizers’ production rates. Conversely, NH4+ oxidizers can also oxidize CH4, with the highest specific CH4 oxidation rates being more than five times lower than the lowest rates observed for aerobic methanotrophs. Furthermore, under hypoxic conditions, some Gammaproteobacterial methanotrophs can display reduction of NO2 and NO3 [80,81]. The nitrogen conversion capabilities of methanotrophs have been associated with N2O production [82], with N2O production increasing with increasing amounts of NO2 and NO3 under hypoxic conditions [81,82]. With the high relative abundances of methanotrophs, it is likely that some conversion of NH4+ to NO2 and, subsequently, N2O via methanotroph MMOs occurred (further discussion in the Supplementary Materials).
In low-O2 reactors, CH4- and N-cycling organisms were represented on both membrane biofilms (Figure 4). Slightly higher O2 permeation rates could lead to better N removal by encouraging more partial nitritation and shifting more NH4+ to NO2, likely the limiting substrate for anammox organisms in low-O2 reactors. Methanotroph–denitrifier synergy, i.e., methanotrophs’ production of intermediates (methanol, formaldehyde, and/or formate) and their use by denitrifiers, is associated with higher denitrification rates [83] and has been suggested to increase denitrification in wastewater-fed MBfRs [16,35,36,84]. Microbial community analyses in MBfRs capable of ME-SND indicate enrichment of aerobic methanotrophs of the genera Methylomonas and Methylobacter, which play key roles in CH4 conversion and the subsequent use of the resulting intermediates by denitrifiers [13,85]. Methylomonas and Methylobacter were among the most abundant methanotrophs identified in the high- and low-O2 reactors in this study.
Anammox bacteria on O2 membrane biofilms suggest potential tolerance of higher O2 levels, which could be tested using O2 pressures between the 2.8 and 8.1 O2 psig pressures tested herein. In similar MBfR systems, the highest denitrification was observed at an O2 partial pressure of 5.5 psig, with optimal conditions for O2 depletion and sufficient methanotroph production of intermediates for denitrification activity [16]. Real-time measurement of bulk O2 or NH4+ to NO2 levels and adjustment of membrane O2 pressures accordingly could optimize carbon and nitrogen removal [85]. Figure 6 shows a schematic of the CH4- and N-cycling microbial groups observed in the O2 membrane biofilms, along with potential CH4 and N species transformation.

5. Conclusions

This study investigated the removal of CH4 and N from NH4+- and CH4-rich AD effluent in single-stage continuous-flow aerobic MBfRs at two different O2 fluxes. Reactor performance and high-throughput 16S rRNA gene sequencing data showed that the O2 delivery rate affected N removal rates and shaped the biofilm microbial community. Low-O2 reactors had an enrichment of CH4- and N-cycling organisms on both membrane biofilms, and they had better N removal compared to high-O2 and control reactors. Complete nitrification and denitrification (e.g., SND) were observed in the low-O2 reactors, while partial nitrification, as shown by higher ratios of NO2 to NO3 levels, was observed high-O2 reactors. Slightly higher O2 permeation rates could lead to better N removal by encouraging more partial nitritation and shifting more NH4+ to NO2, likely the limiting substrate for anammox organisms. The CH4 removal efficiencies were not dependent on initial methanotroph inoculation, and simultaneous removal of CH4 and nitrogen (ME-SND) from AD digestate liquids was demonstrated. Previous studies have typically relied on the use of synthetic wastewater as feed; here, we demonstrate an application of MBfRs using real wastewater capable of nitrogen removal, which shows promise for the application of membrane-based technologies. The use of MBfRs has been successfully applied at pilot scale for the effective removal of nitrogen from wastewater; however, further optimization is required to determine the ideal O2 operating conditions for partial nitritation–anammox to improve N removal efficiencies, minimize potential N2O emissions, and get closer to full-scale applications. Furthermore, for potential future implementation of MBfR treatment of nitrogen-rich wastewaters, there may be no need for the additional CH4 provided via the CH4 membrane, and pure O2 could be replaced by air for economic reasons.

Supplementary Materials

The following supporting information can be downloaded at https://www.mdpi.com/article/10.3390/microorganisms12091841/s1: Supporting text, figures, and tables; Figure S1: Membrane bioreactor (A) COD, (B) HRT, (C) total suspended solids, (D) pH, and (E) PO43− throughout reactor operation; Figure S2: Concentrations of dissolved CH4, O2, and N2 in the AD feed tank; Figure S3: COD loading and removal rates of AD supernatant-fed membrane bioreactors; Figure S4: Reactor N2O production during Period III; Figure S5: Short-term NO2 spike test conducted on day 180 (Period V); Figure S6: Membrane biofilm biomass (A and B) and thickness (C and D), day 206; Figure S7: Representative membrane biofilm cross-section images, control reactor; Figure S8: Representative membrane biofilm cross-section images, inoculated reactors; Figure S9: Representative membrane biofilm cross-section images, uninoculated reactors; Figure S10: Fisher diversity of microbial communities from AD supernatant and membrane bioreactors; Table S1: List of abbreviations and terms; Table S2: Membrane dimensions and characteristics; Table S3: Characteristics of secondary AD supernatant from IAWWTF; Table S4: Initial reactor conditions; Table S5: Reactor periods and operational changes; Table S6: Average solid retention time (SRT) of membrane bioreactors; Table S7: Nitrogen removal rates of membrane bioreactors for each operational period. References [20,38,39,86,87,88,89,90,91,92] are cited in the supplementary materials.

Author Contributions

Conceptualization, E.F.T. and R.E.R.; methodology, E.F.T., N.W. and C.J.D.; software, E.F.T. and N.W.; validation, E.F.T. and N.W.; formal analysis, E.F.T.; investigation, E.F.T.; resources, E.F.T. and R.E.R.; data curation, E.F.T. and N.W.; writing—original draft preparation, E.F.T.; writing—review and editing, E.F.T., N.W. and R.E.R.; visualization, E.F.T.; supervision, E.F.T. and R.E.R.; project administration, E.F.T.; funding acquisition, R.E.R. All authors have read and agreed to the published version of the manuscript.

Funding

This work was supported by a Cornell Sloan Fellowship and a Provost Diversity Fellowship to E.F.T. We also thank the Cornell Atkinson Center Academic Venture Fund and the EPA People, Prosperity, and the Planet (EPA-P3) Program for their financial support for this project.

Data Availability Statement

The original data presented in this study are openly available in the National Center for Biotechnology Information (NCBI) database under submission: SUB12631397; BioProject ID: PRJNA928688.

Acknowledgments

The authors would like to thank José Lozano and Ed Gottlieb from the Ithaca Area Wastewater Treatment Facility for all of their help throughout this project.

Conflicts of Interest

The authors declare no conflict of interest, all research conducted at Cornell University in the absence of any commercial or financial relationships that could be construed as a potential conflict of interest. Author Egidio F. Tentori was employed by Gradient at the time of publication.

References

  1. Daelman, M.R.J.; van Voorthuizen, E.M.; van Dongen, U.G.J.M.; Volcke, E.I.P.; van Loosdrecht, M.C.M. Methane emission during municipal wastewater treatment. Water Res. 2012, 46, 3657–3670. [Google Scholar] [CrossRef] [PubMed]
  2. Delgado Vela, J.; Stadler, L.B.; Martin, K.J.; Raskin, L.; Bott, C.B.; Love, N.G. Prospects for biological nitrogen removal from anaerobic effluents during mainstream wastewater treatment. Environ. Sci. Technol. Lett. 2015, 2, 234–244. [Google Scholar] [CrossRef]
  3. Souza, C.L.; Chernicharo, C.A.L.; Aquino, S.F. Quantification of dissolved methane in UASB reactors treating domestic wastewater under different operating conditions. Water Sci. Technol. 2011, 64, 2259–2264. [Google Scholar] [CrossRef] [PubMed]
  4. IPCC. Climate Change 2021: The Physical Science Basis. Contribution of Working Group I to the Sixth Assessment Report (AR6) of the Intergovernmental Panel on Climate Change; Masson-Delmotte, V., Zhai, P., Pirani, A., Connors, S.L., Péan, C., Berger, S., Caud, N., Chen, Y., Goldfarb, L., Gomis, M.I., et al., Eds.; Cambridge University Press: Cambridge, UK; New York, NY, USA, 2021; p. 2391. [Google Scholar] [CrossRef]
  5. Li, J.; Feng, M.; Zheng, S.; Zhao, W.; Xu, X.; Yu, X. The membrane aerated biofilm reactor for nitrogen removal of wastewater treatment: Principles, performances, and nitrous oxide emissions. Chem. Eng. J. 2023, 460, 141693. [Google Scholar] [CrossRef]
  6. Song, C.; Zhu, J.; Willis, J.L.; Moore, D.P.; Zondlo, M.A.; Ren, Z.J. Methane Emissions from Municipal Wastewater Collection and Treatment Systems. Environ. Sci. Technol. 2023, 57, 2248–2261. [Google Scholar] [CrossRef]
  7. Masuda, S.; Suzuki, S.; Sano, I.; Li, Y.Y.; Nishimura, O. The seasonal variation of emission of greenhouse gases from a full-scale sewage treatment plant. Chemosphere 2015, 140, 167–173. [Google Scholar] [CrossRef]
  8. McCarty, P.L. What is the Best Biological Process for Nitrogen Removal: When and Why? Environ. Sci. Technol. 2018, 52, 3835–3841. [Google Scholar] [CrossRef]
  9. Kartal, B.; Kuenen, J.G.; Van Loosdrecht, M.C.M. Sewage treatment with anammox. Science 2010, 328, 702–703. [Google Scholar] [CrossRef]
  10. Lackner, S.; Gilbert, E.M.; Vlaeminck, S.E.; Joss, A.; Horn, H.; van Loosdrecht, M.C.M. Full-scale partial nitritation/anammox experiences—An application survey. Water Res. 2014, 55, 292–303. [Google Scholar] [CrossRef]
  11. Lee, H.J.; Bae, J.H.; Cho, K.M. Simultaneous nitrification and denitrification in a mixed methanotrophic culture. Biotechnol. Lett. 2001, 23, 935–941. [Google Scholar] [CrossRef]
  12. van Kessel, M.A.H.J.; Stultiens, K.; Pol, A.; Jetten, M.S.M.; Kartal, B.; den Camp, H.J.M.O. Simultaneous Anaerobic and Aerobic Ammonia and Methane Oxidation under Oxygen Limitation Conditions. Appl. Environ. Microbiol. 2021, 87, 1–11. [Google Scholar] [CrossRef]
  13. Cao, Q.; Li, X.; Jiang, H.; Wu, H.; Xie, Z.; Zhang, X.; Li, N.; Huang, X.; Li, Z.; Liu, X.; et al. Ammonia removal through combined methane oxidation and nitrification-denitrification and the interactions among functional microorganisms. Water Res. 2021, 188, 116555. [Google Scholar] [CrossRef]
  14. Vlaeminck, S.E.; Cloetens, L.F.F.; Carballa, M.; Boon, N.; Verstraete, W. Granular biomass capable of partial nitritation and anammox. Water Sci. Technol. 2008, 58, 1113–1120. [Google Scholar] [CrossRef] [PubMed]
  15. Martin, K.J.; Nerenberg, R. The membrane biofilm reactor (MBfR) for water and wastewater treatment: Principles, applications, and recent developments. Bioresour. Technol. 2012, 122, 83–94. [Google Scholar] [CrossRef]
  16. Lu, J.J.; Zhang, H.; Li, W.; Yi, J.B.; Sun, F.Y.; Zhao, Y.W.; Feng, L.; Li, Z.; Dong, W.Y. Biofilm stratification in counter-diffused membrane biofilm bioreactors (MBfRs) for aerobic methane oxidation coupled to aerobic/anoxic denitrification: Effect of oxygen pressure. Water Res. 2022, 226, 119243. [Google Scholar] [CrossRef] [PubMed]
  17. Silva-Teira, A.; Sánchez, A.; Buntner, D.; Rodríguez-Hernández, L.; Garrido, J.M. Removal of dissolved methane and nitrogen from anaerobically treated effluents at low temperature by MBR post-treatment. Chem. Eng. J. 2017, 326, 970–979. [Google Scholar] [CrossRef]
  18. Gilmore, K.R.; Terada, A.; Smets, B.F.; Love, N.G.; Garland, J.L. Autotrophic nitrogen removal in a membrane-aerated biofilm reactor under continuous aeration: A demonstration. Environ. Eng. Sci. 2013, 30, 38–45. [Google Scholar] [CrossRef]
  19. Pellicer-Nàcher, C.; Sun, S.; Lackner, S.; Terada, A.; Schreiber, F.; Zhou, Q.; Smets, B.F. Sequential aeration of membrane-aerated biofilm reactors for high-rate autotrophic nitrogen removal: Experimental demonstration. Environ. Sci. Technol. 2010, 44, 7628–7634. [Google Scholar] [CrossRef] [PubMed]
  20. Terada, A.; Hibiya, K.; Nagai, J.; Tsuneda, S.; Hirata, A. Nitrogen removal characteristics and biofilm analysis of a membrane-aerated biofilm reactor applicable to high-strength nitrogenous wastewater treatment. J. Biosci. Bioeng. 2003, 95, 170–178. [Google Scholar] [CrossRef]
  21. Helmer, C.; Kunst, S. Simultaneous nitrification/denitrification in an aerobic biofilm system. Water Sci. Technol. 1998, 37, 183–187. [Google Scholar] [CrossRef]
  22. Zeng, R.J.; Lemaire, R.; Yuan, Z.; Keller, J. Simultaneous nitrification, denitrification, and phosphorus removal in a lab-scale sequencing batch reactor. Biotechnol. Bioeng. 2003, 84, 170–178. [Google Scholar] [CrossRef]
  23. Winkler, M.K.H.; Kleerebezem, R.; Van Loosdrecht, M.C.M. Integration of anammox into the aerobic granular sludge process for main stream wastewater treatment at ambient temperatures. Water Res. 2012, 46, 136–144. [Google Scholar] [CrossRef]
  24. Gilbert, E.M.; Agrawal, S.; Karst, S.M.; Horn, H.; Nielsen, P.H.; Lackner, S. Low temperature partial nitritation/anammox in a moving bed biofilm reactor treating low strength wastewater. Environ. Sci. Technol. 2014, 48, 8784–8792. [Google Scholar] [CrossRef] [PubMed]
  25. Zhao, Y.; Liu, Y.; Cao, S.; Hao, Q.; Liu, C.; Li, Y. Anaerobic oxidation of methane driven by different electron acceptors: A review. Sci. Total Environ. 2024, 946, 174287. [Google Scholar] [CrossRef] [PubMed]
  26. Rajapakse, J.P.; Scutt, J.E. Denitrification with natural gas and various new growth media. Water Res. 1999, 33, 3723–3734. [Google Scholar] [CrossRef]
  27. Modin, O.; Fukushi, K.; Nakajima, F.; Yamamoto, K. A membrane biofilm reactor achieves aerobic methane oxidation coupled to denitrification (AME-D) with high efficiency. Water Sci. Technol. 2008, 58, 83–87. [Google Scholar] [CrossRef]
  28. Modin, O.; Fukushi, K.; Nakajima, F.; Yamamoto, K. Performance of a membrane biofilm reactor for denitrification with methane. Bioresour. Technol. 2008, 99, 8054–8060. [Google Scholar] [CrossRef]
  29. Kampman, C.; Hendrickx, T.L.G.; Luesken, F.A.; van Alen, T.A.; Op den Camp, H.J.M.; Jetten, M.S.M.; Zeeman, G.; Buisman, C.J.N.; Temmink, H. Enrichment of denitrifying methanotrophic bacteria for application after direct low-temperature anaerobic sewage treatment. J. Hazard. Mater. 2012, 227–228, 164–171. [Google Scholar] [CrossRef]
  30. Castro-Barros, C.M.; Ho, L.T.; Winkler, M.K.H.; Volcke, E.I.P. Integration of methane removal in aerobic anammox-based granular sludge reactors. Environ. Technol. 2017, 39, 1615–1625. [Google Scholar] [CrossRef]
  31. Cai, C.; Hu, S.; Guo, J.; Shi, Y.; Xie, G.J.; Yuan, Z. Nitrate reduction by denitrifying anaerobic methane oxidizing microorganisms can reach a practically useful rate. Water Res. 2015, 87, 211–217. [Google Scholar] [CrossRef]
  32. Shi, Y.; Hu, S.; Lou, J.; Lu, P.; Keller, J.; Yuan, Z. Nitrogen Removal from Wastewater by Coupling Anammox and Methane-Dependent Denitrification in a Membrane Biofilm Reactor. Environ. Sci. Technol. 2013, 47, 11577–11583. [Google Scholar] [CrossRef]
  33. Fan, S.Q.; Xie, G.-J.; Lu, Y.; Liu, B.-F.; Xing, D.F.; Han, H.J.; Yuan, Z.; Ren, N.Q. Granular Sludge Coupling Nitrate/Nitrite Dependent Anaerobic Methane Oxidation with Anammox: From Proof-of-Concept to High Rate Nitrogen Removal. Environ. Sci. Technol. 2020, 54, 297–305. [Google Scholar] [CrossRef]
  34. Zhu, J.; Wang, Q.; Yuan, M.; Tan, G.Y.A.; Sun, F.; Wang, C.; Wu, W.; Lee, P.H. Microbiology and potential applications of aerobic methane oxidation coupled to denitrification (AME-D) process: A review. Water Res. 2016, 90, 203–215. [Google Scholar] [CrossRef] [PubMed]
  35. Alrashed, W.; Chandra, R.; Abbott, T.; Lee, H.S. Nitrite reduction using a membrane biofilm reactor (MBfR) in a hypoxic environment with dilute methane under low pressures. Sci. Total Environ. 2022, 841, 156757. [Google Scholar] [CrossRef]
  36. Xu, X.; Qin, Y.; Li, X.; Ma, Z.; Wu, W. Heterogeneity of CH4-derived carbon induced by O2:CH4 mediates the bacterial community assembly processes. Sci. Total Environ. 2022, 829, 154442. [Google Scholar] [CrossRef] [PubMed]
  37. Chen, X.; Liu, Y.; Peng, L.; Yuan, Z.; Ni, B.J. Model-Based Feasibility Assessment of Membrane Biofilm Reactor to Achieve Simultaneous Ammonium, Dissolved Methane, and Sulfide Removal from Anaerobic Digestion Liquor. Sci. Rep. 2016, 6, 25114. [Google Scholar] [CrossRef] [PubMed]
  38. Tentori, E.F.; Richardson, R.E. Methane Monooxygenase Gene Transcripts as Quantitative Biomarkers of Methanotrophic Activity in Methylosinus trichosporium OB3b. Appl. Environ. Microbiol. 2020, 86, e01048-20. [Google Scholar] [CrossRef] [PubMed]
  39. Whittenbury, R.; Phillips, K.; Wilkinson, J. Enrichment, Isolation and Some Properties of Methane-utilizing Bacteria. J. Gen. Microbiol. 1970, 61, 205–218. [Google Scholar] [CrossRef]
  40. McGuire, P.M.; Reid, M.C. Nitrous Oxide and Methane Dynamics in Woochip Bioreactors: Effects of Water Level Fluctuations on Partitioning into Trapped Gas Phases. Environ. Sci. Technol. 2019, 53, 14348–14356. [Google Scholar] [CrossRef]
  41. Bower, C.E.; Holm-Hansen, T. A Salicylate–Hypochlorite Method for Determining Ammonia in Seawater. Can. J. Fish. Aquat. Sci. 1980, 37, 794–798. [Google Scholar] [CrossRef]
  42. Fernández-Baca, C.P.; Omar, A.E.H.; Pollard, J.T.; Richardson, R.E. Microbial communities controlling methane and nutrient cycling in leach field soils. Water Res. 2019, 151, 456–467. [Google Scholar] [CrossRef]
  43. APHA; AWWA; WEF. Standard Methods for the Examination of Water and Wastewater, 21st ed.; American Public Health Association: Washington, DC, USA, 2005. [Google Scholar]
  44. HACH. Phenolphthalein and Total Alkalinity. Method 8221. Buret Titration. DOC316.53.01151, 9th ed.; HACH Company: Loveland, CO, USA, 2017. [Google Scholar]
  45. Wasimuddin; Schlaeppi, K.; Ronchi, F.; Leib, S.L.; Erb, M.; Ramette, A. Evaluation of primer pairs for microbiome profiling from soils to humans within the One Health framework. Mol. Ecol. Resour. 2020, 20, 1558–1571. [Google Scholar] [CrossRef]
  46. Bolyen, E.; Rideout, J.R.; Dillon, M.R.; Bokulich, N.A.; Abnet, C.C.; Al-Ghalith, G.A.; Alexander, H.; Alm, E.J.; Arumugam, M.; Asnicar, F.; et al. Reproducible, interactive, scalable and extensible microbiome data science using QIIME 2. Nat. Biotechnol. 2019, 37, 852–857. [Google Scholar] [CrossRef]
  47. Callahan, B.J.; McMurdie, P.J.; Rosen, M.J.; Han, A.W.; Johnson, A.J.A.; Holmes, S.P. DADA2: High-resolution sample inference from Illumina amplicon data. Nat. Methods 2016, 13, 581–583. [Google Scholar] [CrossRef] [PubMed]
  48. Quast, C.; Pruesse, E.; Yilmaz, P.; Gerken, J.; Schweer, T.; Yarza, P.; Peplies, J.; Glöckner, F.O. The SILVA ribosomal RNA gene database project: Improved data processing and web-based tools. Nucleic Acids Res. 2013, 41, D590–D596. [Google Scholar] [CrossRef] [PubMed]
  49. McMurdie, P.J.; Holmes, S. Phyloseq: An R Package for Reproducible Interactive Analysis and Graphics of Microbiome Census Data. PLoS ONE 2013, 8, e61217. [Google Scholar] [CrossRef]
  50. Law, Y.; Ye, L.; Pan, Y.; Yuan, Z. Nitrous oxide emissions from wastewater treatment processes. Philos. Trans. R. Soc. B Biol. Sci. 2012, 367, 1265–1277. [Google Scholar] [CrossRef] [PubMed]
  51. Kosonen, H.; Heinonen, M.; Mikola, A.; Haimi, H.; Mulas, M.; Corona, F.; Vahala, R. Nitrous Oxide Production at a Fully Covered Wastewater Treatment Plant: Results of a Long-Term Online Monitoring Campaign. Environ. Sci. Technol. 2016, 50, 5547–5554. [Google Scholar] [CrossRef]
  52. Yamada, T.; Sekiguchi, Y.; Imachi, H.; Kamagata, Y.; Ohashi, A.; Harada, H. Diversity, localization, and physiological properties of filamentous microbes belonging to Chloroflexi subphylum I in mesophilic and thermophilic methanogenic sludge granules. Appl. Environ. Microbiol. 2005, 71, 7493–7503. [Google Scholar] [CrossRef]
  53. Yamada, T.; Sekiguchi, Y.; Hanada, S.; Imachi, H.; Ohashi, A.; Harada, H.; Kamagata, Y. Anaerolinea thermolimosa sp. nov., Levilinea saccharolytica gen. nov., sp. nov. and Leptolinea tardivitalis gen. nov., sp. nov., novel filamentous anaerobes, and description of the new classes Anaerolineae classis nov. and Caldilineae classis nov. in the bacterial phylum Chloroflexi. Int. J. Syst. Evol. Microbiol. 2006, 56, 1331–1340. [Google Scholar] [CrossRef]
  54. McIlroy, S.J.; Karst, S.M.; Nierychlo, M.; Dueholm, M.S.; Albertsen, M.; Kirkegaard, R.H.; Seviour, R.J.; Nielsen, P.H. Genomic and in situ investigations of the novel uncultured Chloroflexi associated with 0092 morphotype filamentous bulking in activated sludge. ISME J. 2016, 10, 2223–2234. [Google Scholar] [CrossRef]
  55. Shu, D.; He, Y.; Yue, H.; Yang, S. Effects of Fe(II) on microbial communities, nitrogen transformation pathways and iron cycling in the anammox process: Kinetics, quantitative molecular mechanism and metagenomic analysis. RSC Adv. 2016, 6, 68005–68016. [Google Scholar] [CrossRef]
  56. Xie, G.J.; Liu, T.; Cai, C.; Hu, S.; Yuan, Z. Achieving high-level nitrogen removal in mainstream by coupling anammox with denitrifying anaerobic methane oxidation in a membrane biofilm reactor. Water Res. 2018, 131, 196–204. [Google Scholar] [CrossRef]
  57. Sánchez, A.; Rodríguez-Hernández, L.; Buntner, D.; Esteban-García, A.L.; Tejero, I.; Garrido, J.M. Denitrification coupled with methane oxidation in a membrane bioreactor after methanogenic pre-treatment of wastewater. J. Chem. Technol. Biotechnol. 2016, 91, 2950–2958. [Google Scholar] [CrossRef]
  58. Martínez-Quintela, M.; Arias, A.; Alvarino, T.; Suarez, S.; Garrido, J.M.; Omil, F. Cometabolic removal of organic micropollutants by enriched nitrite-dependent anaerobic methane oxidizing cultures. J. Hazard. Mater. 2021, 402, 123450. [Google Scholar] [CrossRef] [PubMed]
  59. Kampman, C.; Temmink, H.; Hendrickx, T.L.G.; Zeeman, G.; Buisman, C.J.N. Enrichment of denitrifying methanotrophic bacteria from municipal wastewater sludge in a membrane bioreactor at 20 °C. J. Hazard Mater. 2014, 274, 428–435. [Google Scholar] [CrossRef]
  60. Ding, Z.W.; Ding, J.; Fu, L.; Zhang, F.; Zeng, R.J. Simultaneous enrichment of denitrifying methanotrophs and anammox bacteria. Appl. Microbiol. Biotechnol. 2014, 98, 10211–10221. [Google Scholar] [CrossRef]
  61. Ding, Z.W.; Lu, Y.Z.; Fu, L.; Ding, J.; Zeng, R.J. Simultaneous enrichment of denitrifying anaerobic methane-oxidizing microorganisms and anammox bacteria in a hollow-fiber membrane biofilm reactor. Appl. Microbiol. Biotechnol. 2017, 101, 437–446. [Google Scholar] [CrossRef]
  62. Hu, S.; Zeng, R.J.; Burow, L.C.; Lant, P.; Keller, J.; Yuan, Z. Enrichment of denitrifying anaerobic methane oxidizing microorganisms. Environ. Microbiol. Rep. 2009, 1, 377–384. [Google Scholar] [CrossRef]
  63. Cao, Q.; Li, X.; Xie, Z.; Li, C.; Huang, S.; Zhu, B.; Li, D.; Liu, X. Compartmentation of microbial communities in structure and function for methane oxidation coupled to nitrification–denitrification. Bioresour. Technol. 2021, 341, 125761. [Google Scholar] [CrossRef]
  64. Liu, T.; Li, J.; Khai Lim, Z.; Chen, H.; Hu, S.; Yuan, Z.; Guo, J. Simultaneous Removal of Dissolved Methane and Nitrogen from Synthetic Mainstream Anaerobic Effluent. Environ. Sci. Technol. 2020, 54, 7629–7638. [Google Scholar] [CrossRef]
  65. Stein, L.Y.; Arp, D.J. Loss of ammonia monooxygenase activity in Nitrosomonas europaea upon exposure to nitrite. Appl. Environ. Microbiol. 1998, 64, 4098–4102. [Google Scholar] [CrossRef]
  66. Cua, L.S.; Stein, L.Y. Effects of nitrite on ammonia-oxidizing activity and gene regulation in three ammonia-oxidizing bacteria. FEMS Microbiol. Lett. 2011, 319, 169–175. [Google Scholar] [CrossRef] [PubMed]
  67. Jin, R.C.; Yang, G.F.; Yu, J.J.; Zheng, P. The inhibition of the Anammox process: A review. Chem. Eng. J. 2012, 197, 67–79. [Google Scholar] [CrossRef]
  68. Strous, M.; Kuenen, J.G.; Jetten, M.S.M. Key physiology of anaerobic ammonium oxidation. Appl. Environ. Microbiol. 1999, 65, 3248–3250. [Google Scholar] [CrossRef] [PubMed]
  69. Lotti, T.; van der Star, W.R.L.; Kleerebezem, R.; Lubello, C.; van Loosdrecht, M.C.M. The effect of nitrite inhibition on the anammox process. Water Res. 2012, 46, 2559–2569. [Google Scholar] [CrossRef]
  70. Strous, M.; Van Gerven, E.; Kuenen, J.G.; Jetten, M. Effects of aerobic and microaerobic conditions on anaerobic ammonium-oxidizing (anammox) sludge. Appl. Environ. Microbiol. 1997, 63, 2446–2448. [Google Scholar] [CrossRef]
  71. Oshiki, M.; Satoh, H.; Okabe, S. Ecology and physiology of anaerobic ammonium oxidizing bacteria. Environ. Microbiol. 2016, 18, 2784–2796. [Google Scholar] [CrossRef] [PubMed]
  72. Carvajal-Arroyo, J.M.; Sun, W.; Sierra-Alvarez, R.; Field, J.A. Inhibition of anaerobic ammonium oxidizing (anammox) enrichment cultures by substrates, metabolites and common wastewater constituents. Chemosphere 2013, 91, 22–27. [Google Scholar] [CrossRef]
  73. Egli, K.; Fanger, U.; Alvarez, P.J.J.; Siegrist, H.; Van der Meer, J.R.; Zehnder, A.J.B. Enrichment and characterization of an anammox bacterium from a rotating biological contactor treating ammonium-rich leachate. Arch. Microbiol. 2001, 175, 198–207. [Google Scholar] [CrossRef]
  74. Li, Y.; Wang, J.; Hua, M.; Yao, X.; Zhao, Y.; Hu, J.; Xi, C.; Hu, B. Strategy for denitrifying anaerobic methane-oxidizing bacteria growing under the oxygen-present condition. Sci. Total Environ. 2020, 742, 140476. [Google Scholar] [CrossRef] [PubMed]
  75. Cai, C.; Hu, S.; Chen, X.; Ni, B.J.; Pu, J.; Yuan, Z. Effect of methane partial pressure on the performance of a membrane biofilm reactor coupling methane-dependent denitrification and anammox. Sci. Total Environ. 2018, 639, 278–285. [Google Scholar] [CrossRef] [PubMed]
  76. Chen, X.; Guo, J.; Xie, G.J.; Liu, Y.; Yuan, Z.; Ni, B.J. A new approach to simultaneous ammonium and dissolved methane removal from anaerobic digestion liquor: A model-based investigation of feasibility. Water Res. 2015, 85, 295–303. [Google Scholar] [CrossRef] [PubMed]
  77. Hanson, R.; Hanson, T. Methanotrophic bacteria. Microbiol. Rev. 1996, 60, 439–471. [Google Scholar] [CrossRef] [PubMed]
  78. King, G.M.; Schnell, S. Ammonium and nitrite inhibition of methane oxidation by Methylobacter albus BG8 and Methylosinus trichosporium OB3b at low methane concentrations. Appl. Environ. Microbiol. 1994, 60, 3508–3513. [Google Scholar] [CrossRef]
  79. Bédard, C.; Knowles, R. Physiology, biochemistry, and specific inhibitors of CH4, NH4+, and CO oxidation by methanotrophs and nitrifiers. Microbiol. Rev. 1989, 53, 68–84. [Google Scholar] [CrossRef]
  80. Kits, K.D.; Klotz, M.G.; Stein, L.Y. Methane oxidation coupled to nitrate reduction under hypoxia by the Gammaproteobacterium Methylomonas denitrificans, sp. nov. type strain FJG1. Environ. Microbiol. 2015, 17, 3219–3232. [Google Scholar] [CrossRef]
  81. Kits, K.D.; Campbell, D.J.; Rosana, A.R.; Stein, L.Y. Diverse electron sources support denitrification under hypoxia in the obligate methanotroph Methylomicrobium album strain BG8. Front. Microbiol. 2015, 6, 1072. [Google Scholar] [CrossRef]
  82. Nyerges, G.; Han, S.K.; Stein, L.Y. Effects of ammonium and nitrite on growth and competitive fitness of cultivated methanotrophic bacteria. Appl. Environ. Microbiol. 2010, 76, 5648–5651. [Google Scholar] [CrossRef]
  83. Modin, O.; Fukushi, K.; Nakajima, F.; Yamamoto., K. Aerobic methane oxidation coupled to denitrification: Kinetics and effect of oxygen supply. J. Environ. Eng. 2010, 136, 211–219. [Google Scholar] [CrossRef]
  84. Xu, X.; Zhu, J.; Thies, J.E.; Wu, W. Methanol-linked synergy between aerobic methanotrophs and denitrifiers enhanced nitrate removal efficiency in a membrane biofilm reactor under a low O2:CH4 ratio. Water Res. 2020, 174, 115595. [Google Scholar] [CrossRef] [PubMed]
  85. Xu, X.; Wu, W.; Li, X.; Zhao, C.; Qin, Y. Metagenomics coupled with thermodynamic analysis revealed a potential way to improve the nitrogen removal efficiency of the aerobic methane oxidation coupled to denitrification process under the hypoxic condition. Sci. Total Environ. 2024, 912, 168953. [Google Scholar] [CrossRef] [PubMed]
  86. Rueden, C.T.; Schindelin, J.; Hiner, M.C.; DeZonia, B.E.; Walter, A.E.; Arena, E.T.; Eliceiri, K.W. ImageJ2: ImageJ for the next generation of scientific image data. BMC Bioinform. 2017, 18, 529. [Google Scholar] [CrossRef] [PubMed]
  87. Wunderlin, P.; Mohn, J.; Joss, A.; Emmenegger, L.; Siegrist, H. Mechanisms of N2O production in biological wastewater treatment under nitrifying and denitrifying conditions. Water Res. 2012, 46, 1027–1037. [Google Scholar] [CrossRef] [PubMed]
  88. Zumft, W.G. Cell biology and molecular basis of denitrification. Microbiol. Mol. Biol. Rev. MMBR 1997, 61, 533–616. [Google Scholar] [CrossRef]
  89. Lourenço, K.S.; Cassman, N.A.; Pijl, A.S.; van Veen, J.A.; Cantarella, H.; Kuramae, E.E. Nitrosospira sp. govern nitrous oxide emissions in a tropical soil amended with residues of bioenergy crop. Front. Microbiol. 2018, 9, 674. [Google Scholar] [CrossRef]
  90. Pereira, M.O.; Kuehn, M.; Wuertz, S.; Neu, T.; Melo, L.F. Effect of flow regime on the architecture of a Pseudomonas fluorescens biofilm. Biotechnol. Bioeng. 2002, 78, 164–171. [Google Scholar] [CrossRef]
  91. dos Santos, L.M.F.; Livingston, A.G. Membrane-attached biofilms for VOC wastewater treatment I: Novel in situ biofilm thickness measurement technique. Biotechnol. Bioeng. 1995, 47, 82–89. [Google Scholar] [CrossRef]
  92. Rishell, S.; Casey, E.; Glennon, B.; Hamer, G. Characteristics of a methanotrophic culture in a membrane-aerated biofilm reactor. Biotechnol. Prog. 2004, 20, 1082–1090. [Google Scholar] [CrossRef]
Figure 1. (A) Membrane biofilm reactor setup; (B) operational periods and membrane conditions. Operational periods are denoted in roman numerals (I–VII). Short-term NO2 spike test date, day 180 (dashed line), indicated with an asterisk (*). On day 58, the flow rate increased, decreasing the HRT from 4.3 to 2.3 days. On day 193 (dotted line), the reactor feed tank was amended with 5 mM NO2. O2 membrane pressures were turned on 2.5 days after startup, and the control reactor received no membrane O2. Pressures are denoted in psi (gauge).
Microorganisms 12 01841 g001
Figure 2. MBfRs’ dissolved CH4, O2, COD, and TSS: (A) dissolved CH4 and membrane pressure; (B) dissolved O2 and membrane pressure; (C) COD; (D) TSS. Operational periods are denoted in roman numerals (I–VII). Upward (↑) and downward (↓) arrows indicate an increase or decrease in CH4 pressure, respectively. Vertical dashed black lines: operational periods; gray lines: batch period with NO2 addition. Error bars represent standard deviations from duplicate reactor measurements for each condition. See Figure 1 and Table 1 and Table S3 for details on operational periods.
Microorganisms 12 01841 g002
Figure 3. Dissolved nitrogen species and nitrogen removal performance of AD supernatant-fed MBfRs: (A) NH4+-N; (B) NO2-N; (C) dissolved N2-N; (D) NO3-N; (E) total inorganic nitrogen (NTot = NH4+-N + NO2-N + NO3-N) influent loading and removal rates; (F) NTot removal efficiency; (G) NTot removal rates by period. Operational periods are denoted in roman numerals (I–VII). Upward (↑) and downward (↓) arrows indicate an increase or decrease in CH4 pressure, respectively. For (A,B), vertical dashed black lines = operational periods; gray lines = batch activity periods; error bars = standard deviations from duplicate reactor measurements. For (G), error bars = 95% confidence intervals; medians = solid lines; means = dashed lines. See Figure 1 and Table 1 and Table S3 for details on operational periods.
Microorganisms 12 01841 g003
Figure 4. PCoA showing membrane biofilm microbial community samples. Bray–Curtis dissimilarity measurements. Circles denote sample clustering. R4-CH4 not included due to low number of reads.
Microorganisms 12 01841 g004
Figure 5. Genus-level taxonomic composition of AD and membrane biofilm samples of genera involved in CH4 and N cycling. R4-CH4 not included due to low number of reads.
Microorganisms 12 01841 g005
Figure 6. Simplified schematic of CH4- and N-cycling microbial groups in O2 membrane biofilms: (A) high-O2 biofilms and (B) low-O2 biofilms. Observed and potential N-cycle products shown. Membrane pressures are denoted in psi (gauge). Methane-oxidizing bacteria (MOB); ammonium-oxidizing bacteria (AOB); nitrite-oxidizing bacteria (NOB); putative denitrifying bacteria (DNB).
Microorganisms 12 01841 g006
Table 1. Reactor and membrane conditions at startup.
Reactor NumberReactor ConditionMethanotroph-Inoculated 1O2 Membrane Pressure (psig) 2
R0ControlN/A
R1, R2High O2 (+)+8.1
R3, R4High O2 (−)
R5, R6Low O2 (+)+2.8
R7, R8Low O2 (−)
1 All experimental conditions had duplicate reactors except for the control, with one reactor. Inoculated reactors indicated with a plus (+), while uninoculated reactors indicated with a minus (−). Reactor starting volumes consisted of 0.8 L of 1:1 diluted AD supernatant, diluted with DI water for the control, diluted with sterile NMS medium [39] and DI water for uninoculated experimental reactors, and diluted with methanotroph inoculate in fresh NMS medium and DI water (see Supplementary Materials and Table S4). 2 Pressures at startup shown; O2 pressures were constant throughout reactor operation. Initial CH4 membrane pressure was 11.6 psig and was changed starting in Period IV.
Disclaimer/Publisher’s Note: The statements, opinions and data contained in all publications are solely those of the individual author(s) and contributor(s) and not of MDPI and/or the editor(s). MDPI and/or the editor(s) disclaim responsibility for any injury to people or property resulting from any ideas, methods, instructions or products referred to in the content.

