

Antimicrobial Resistance in the Terrestrial Environment of Agricultural Landscapes in Norway


 , ,
, ,  , , and
Abstract
1. Introduction
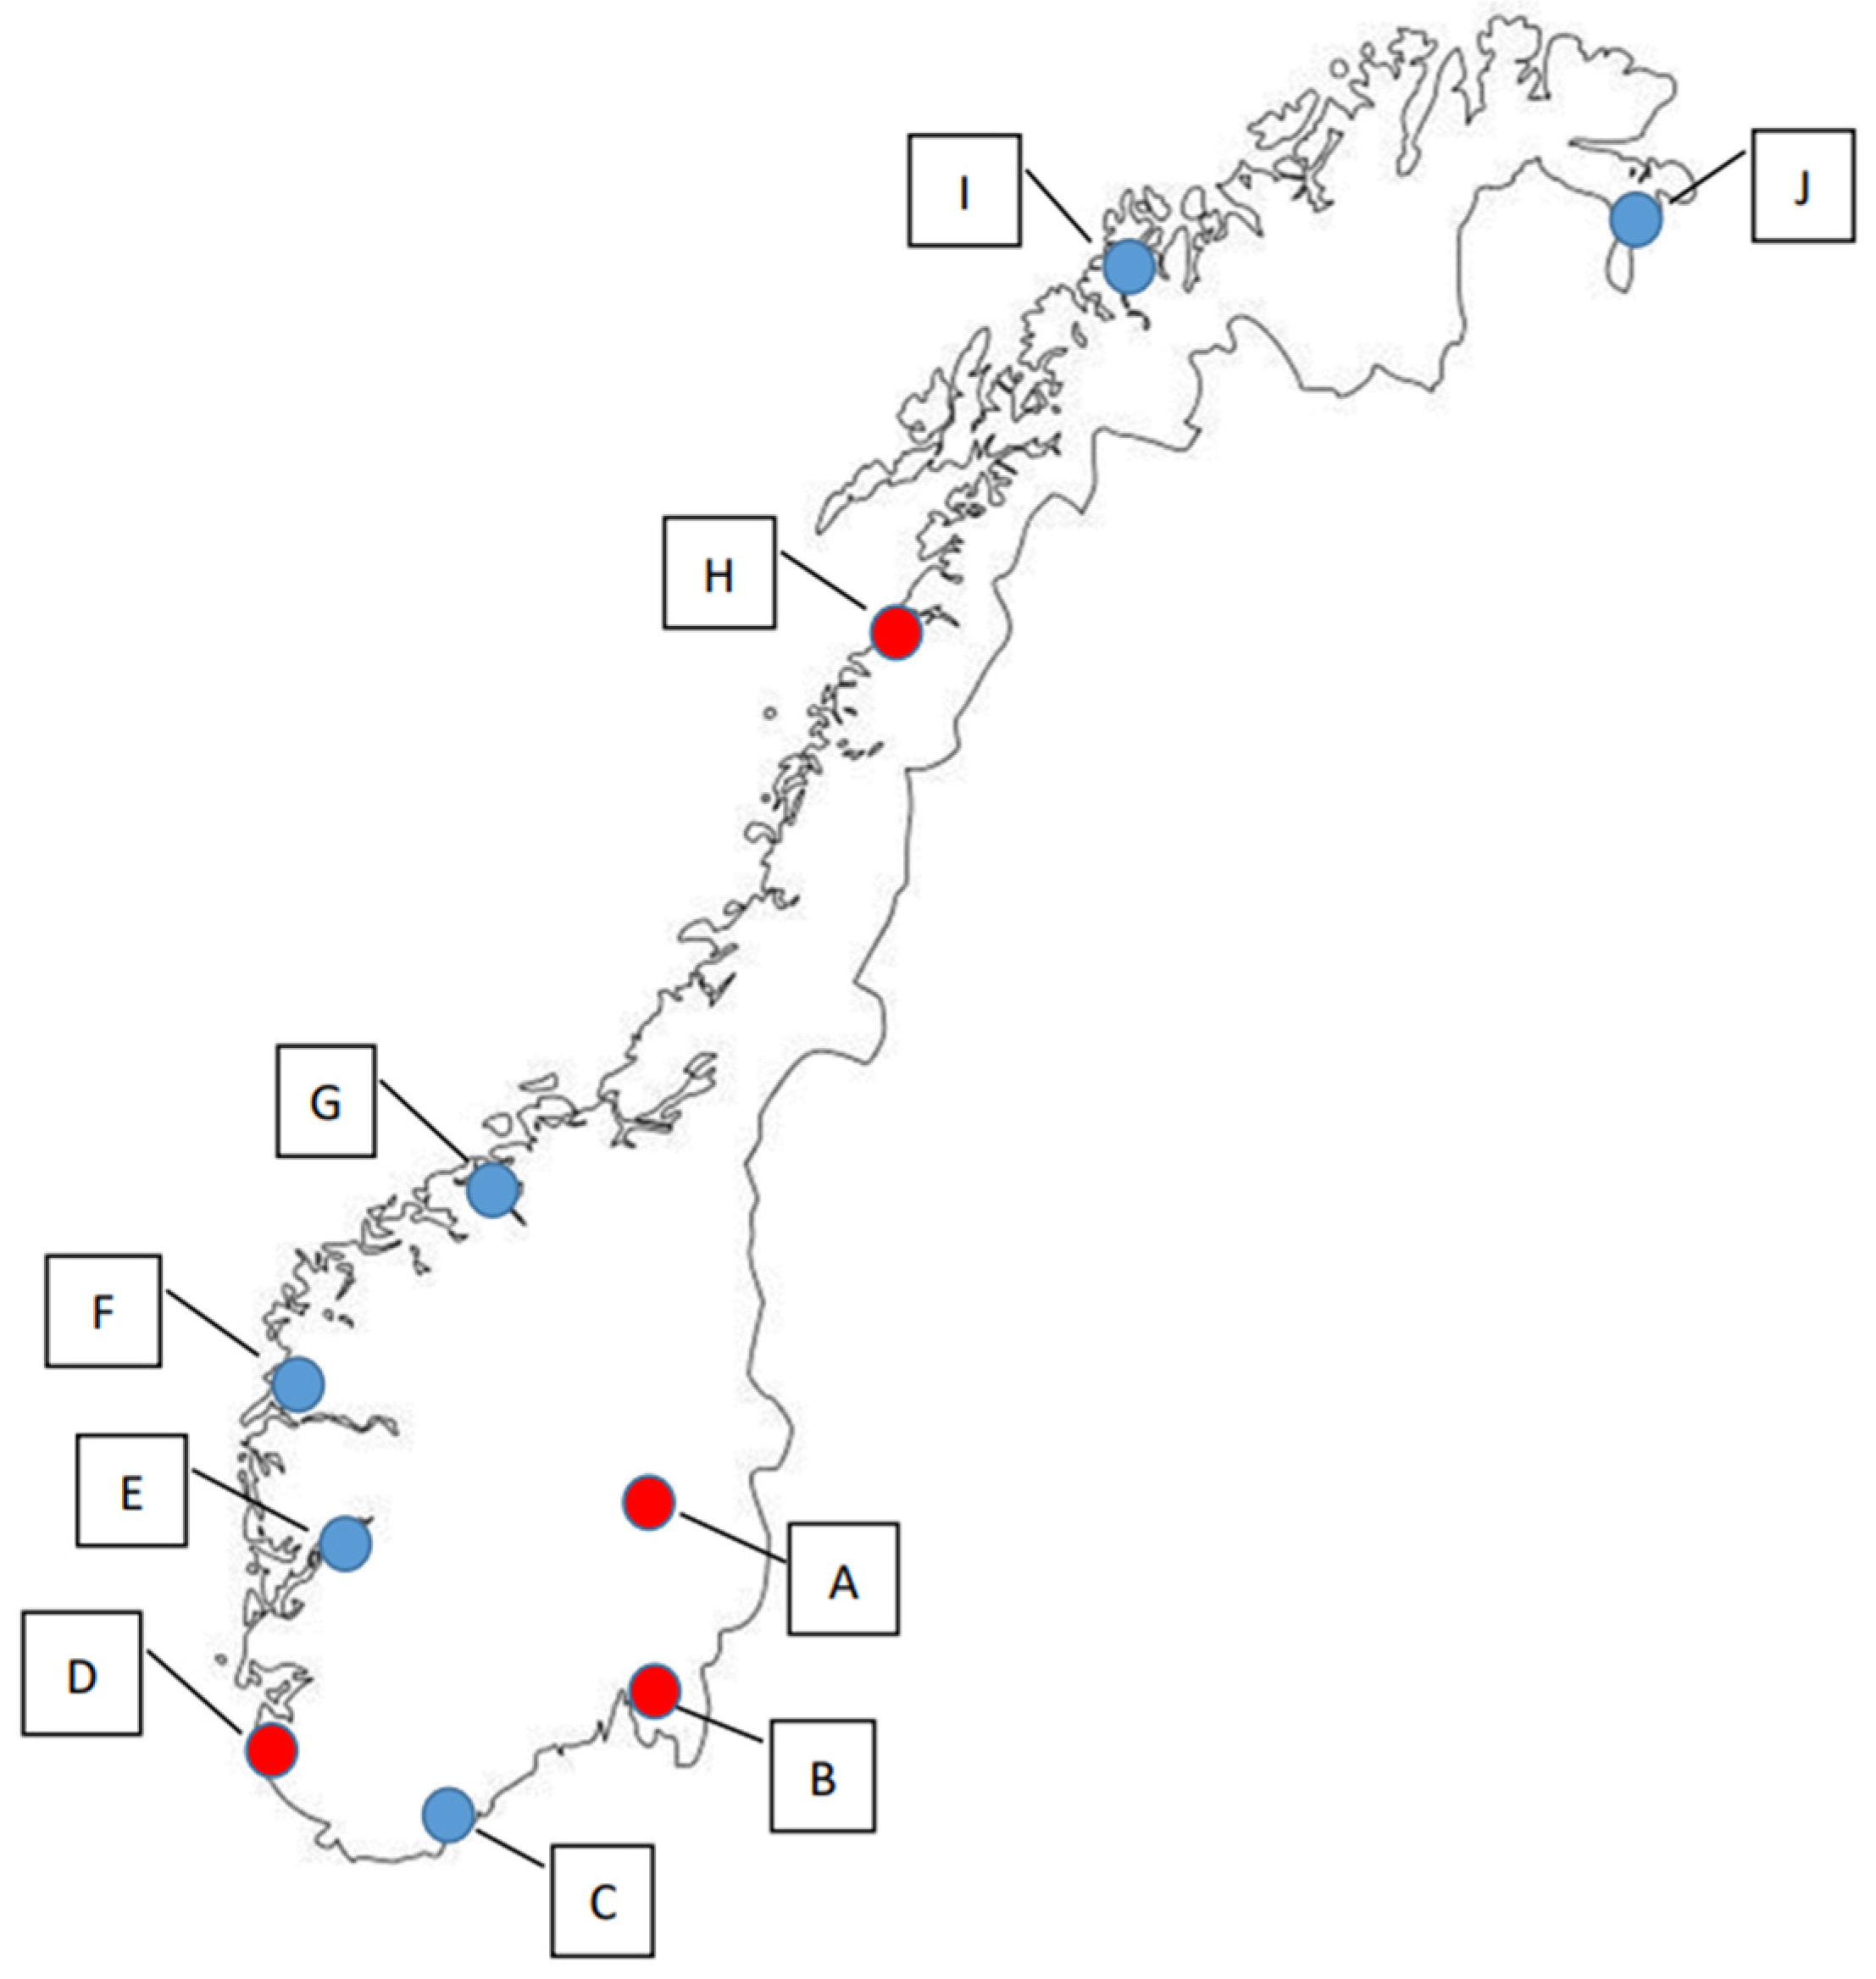
2. Study Design
- Conventional, i.e., within or at the edge of a conventional agriculture field;
- Organic, i.e., within or at the edge of an organic agriculture field;
- Control, i.e., in an area without agriculture or settlement, but with natural vegetation (forest, grass, bushes, etc.).
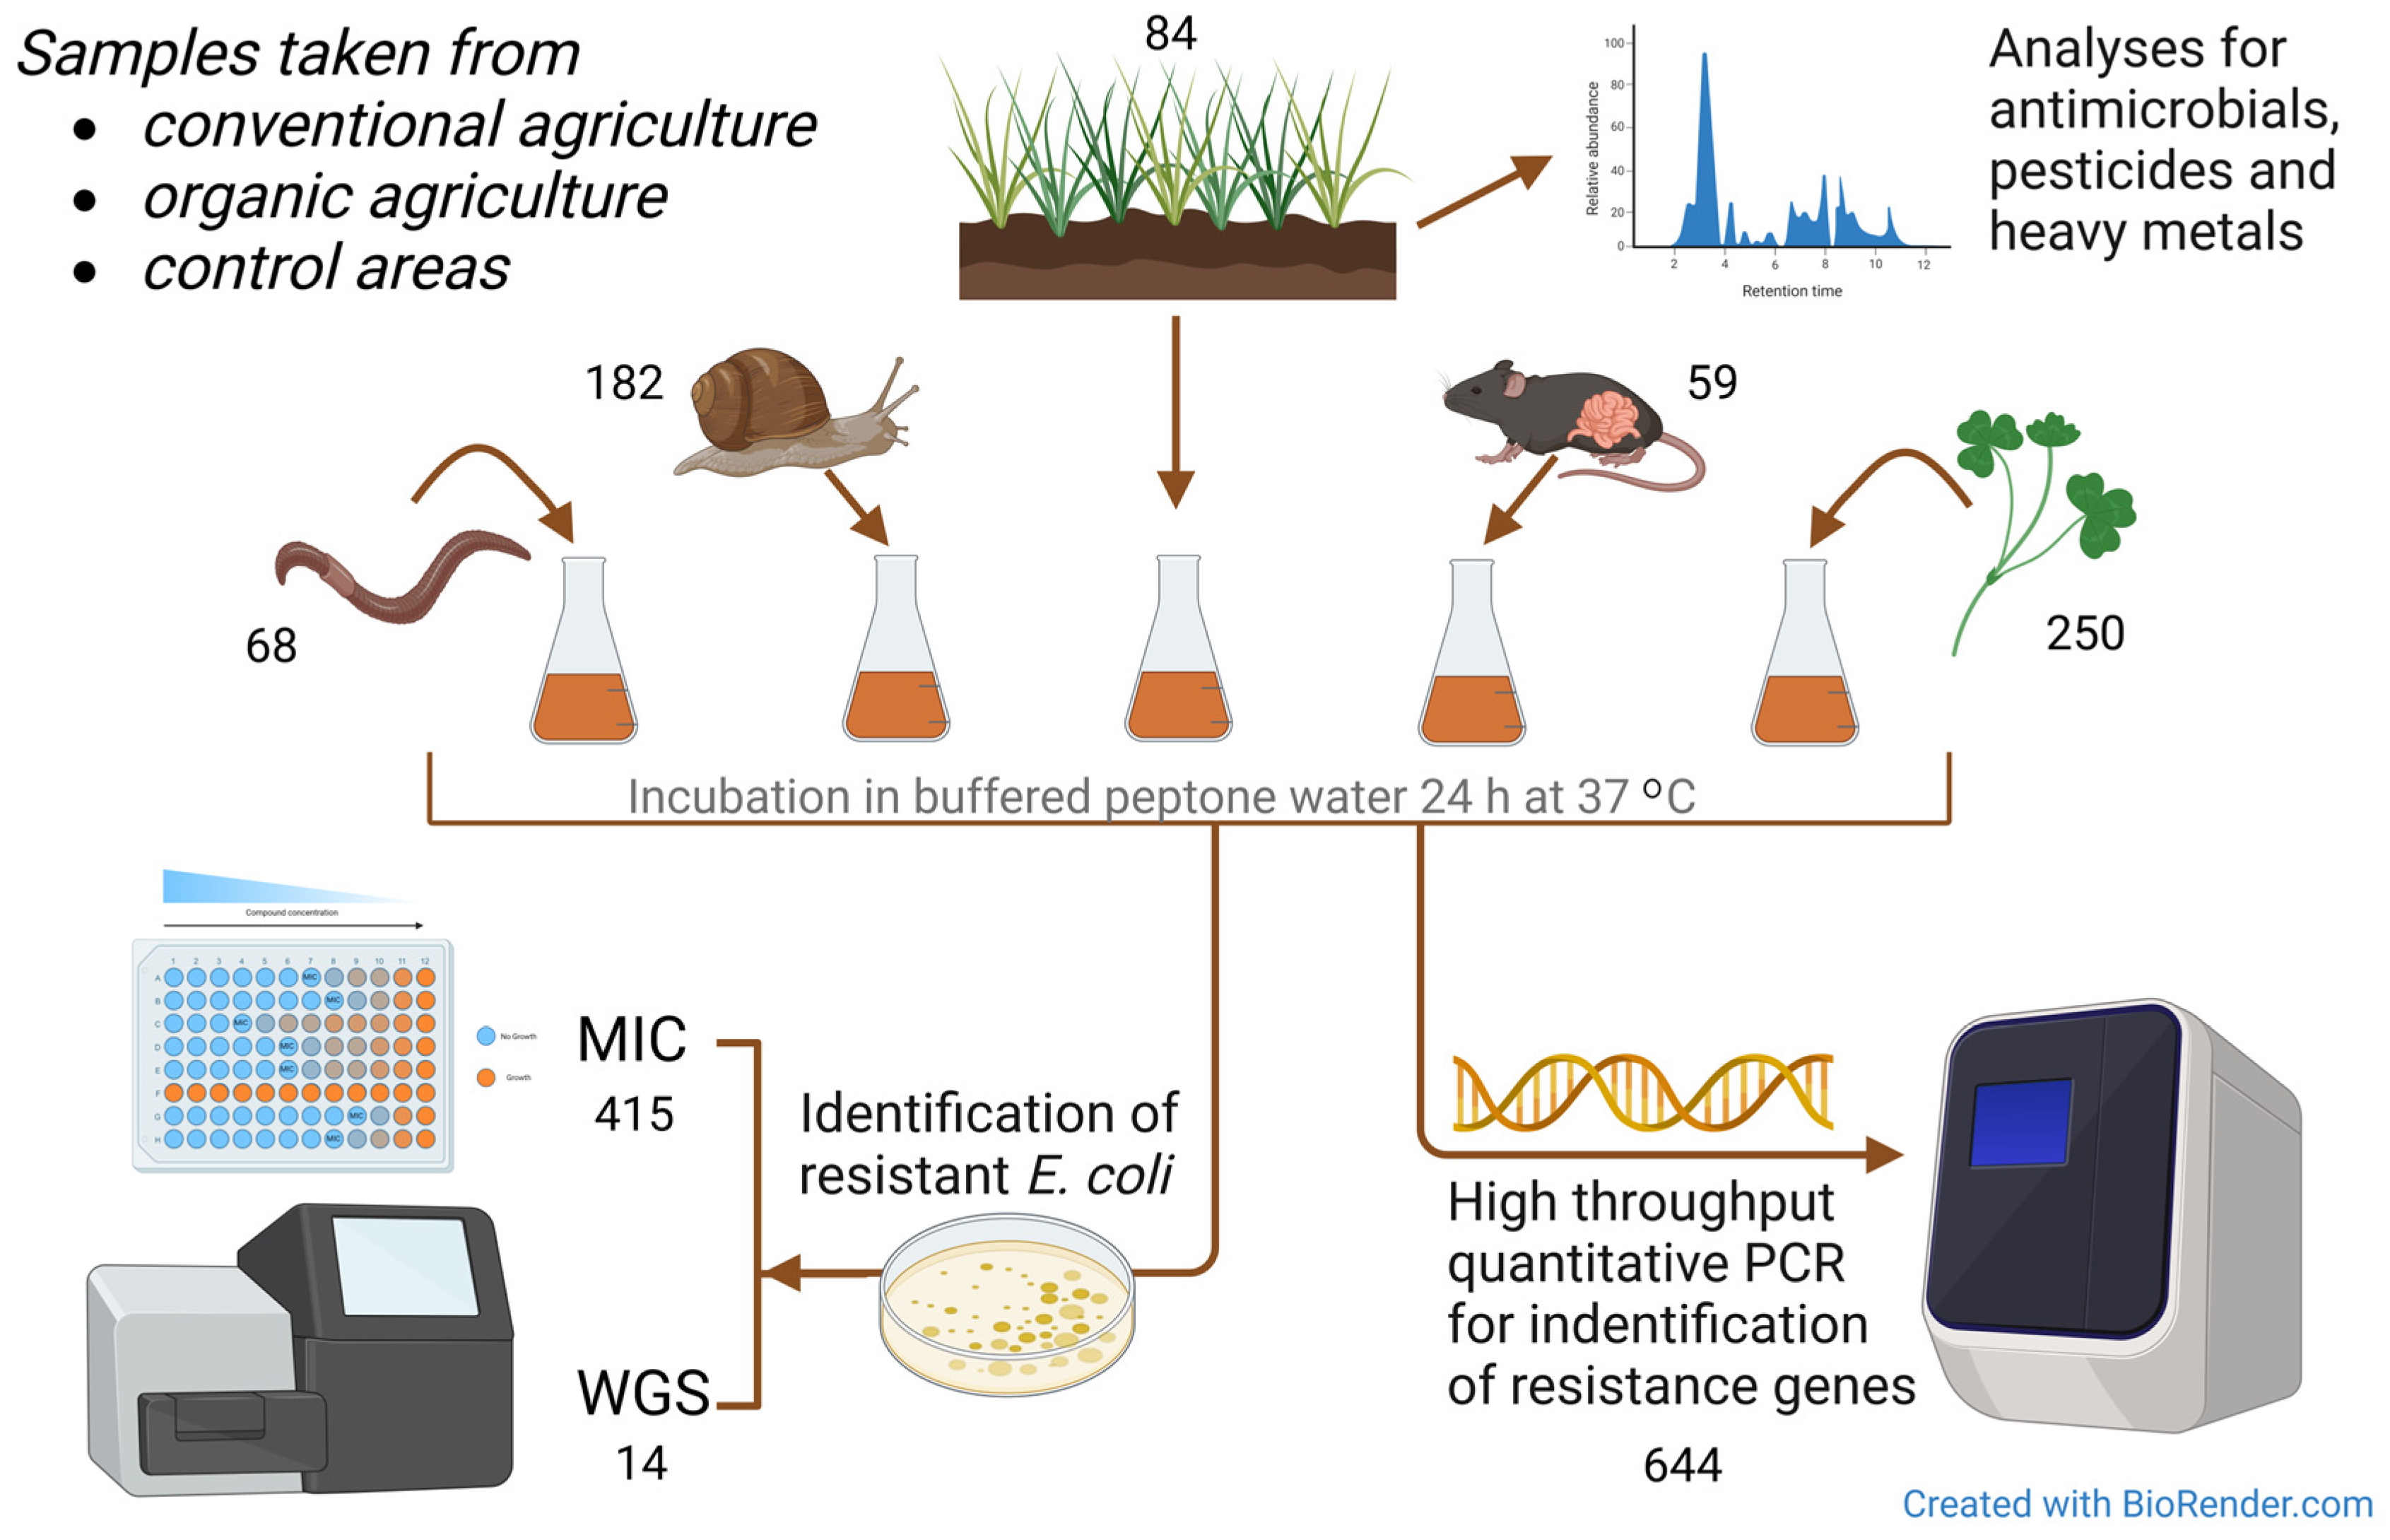
- Soil—2019 and 2020;
- Plants (red clover)—2019 and 2020;
- Gastropods (slugs and snails)—2019 and 2020;
- Small mammals (mice and shrews)—2019;
- Earthworms—2019 (only spring).
3. Materials and Methods
3.1. Collection and Preparation of Samples
3.2. Isolation and Identification of E. coli
3.3. Susceptibility Testing of E. coli
3.4. Whole-Genome Sequencing of Antimicrobial-Resistant E. coli (AREC)
3.5. High-Throughput Quantitative PCR (HT-qPCR)
3.6. Testing for Antimicrobial Agents and Pesticides in Soil
3.7. Testing for Metals in Soil
3.8. Statistical Analyses
4. Results
4.1. Isolation of E. coli
4.2. Antimicrobial-Resistant E. coli (AREC)
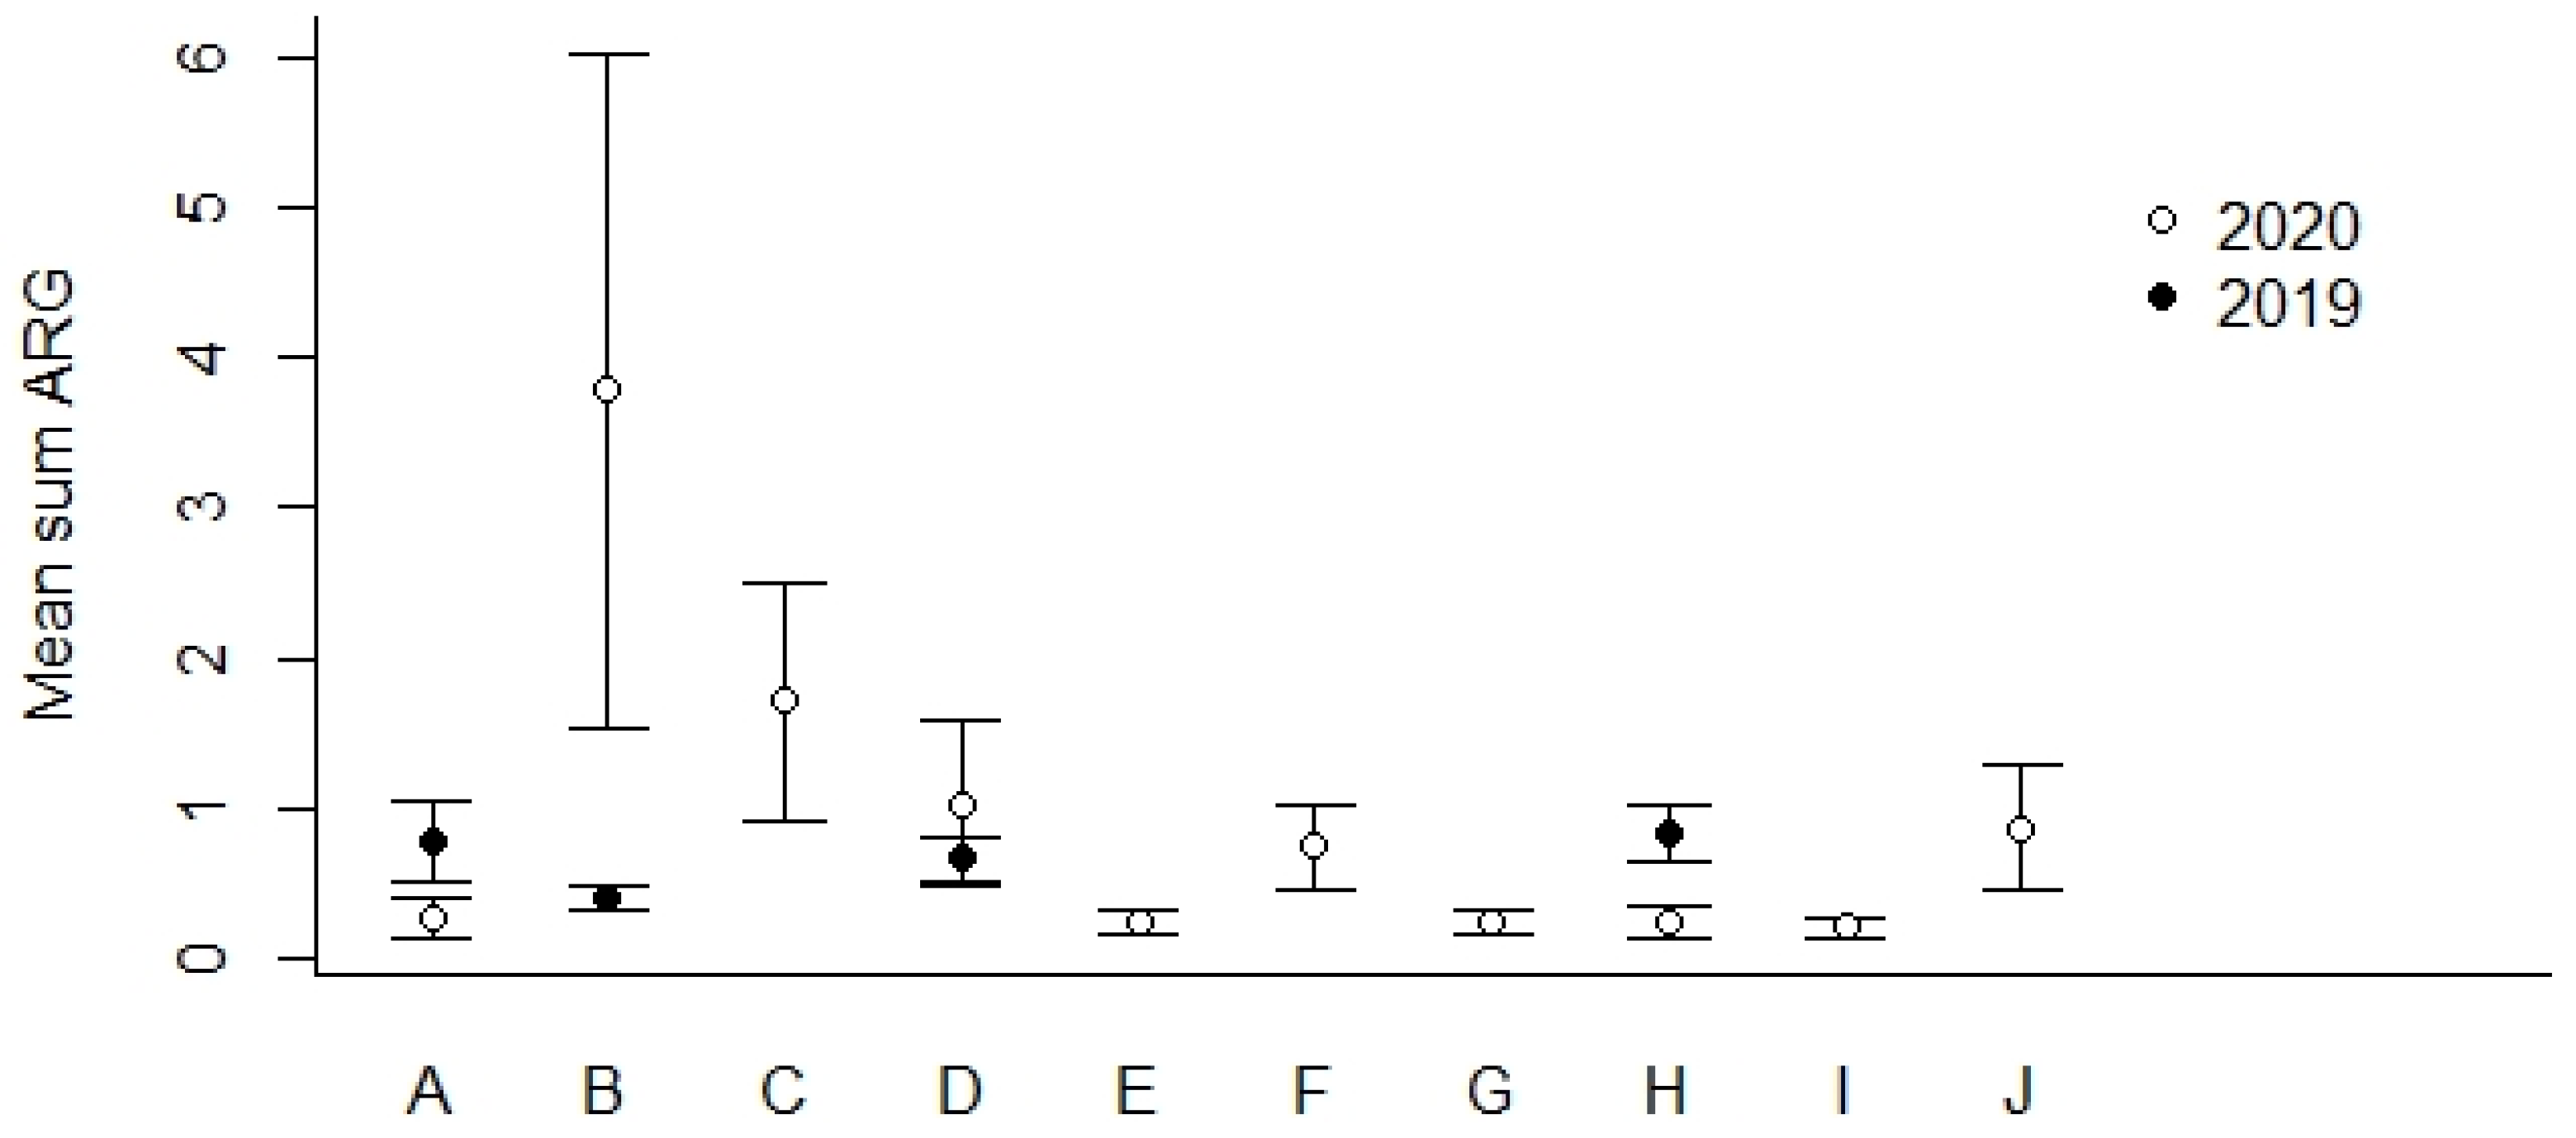
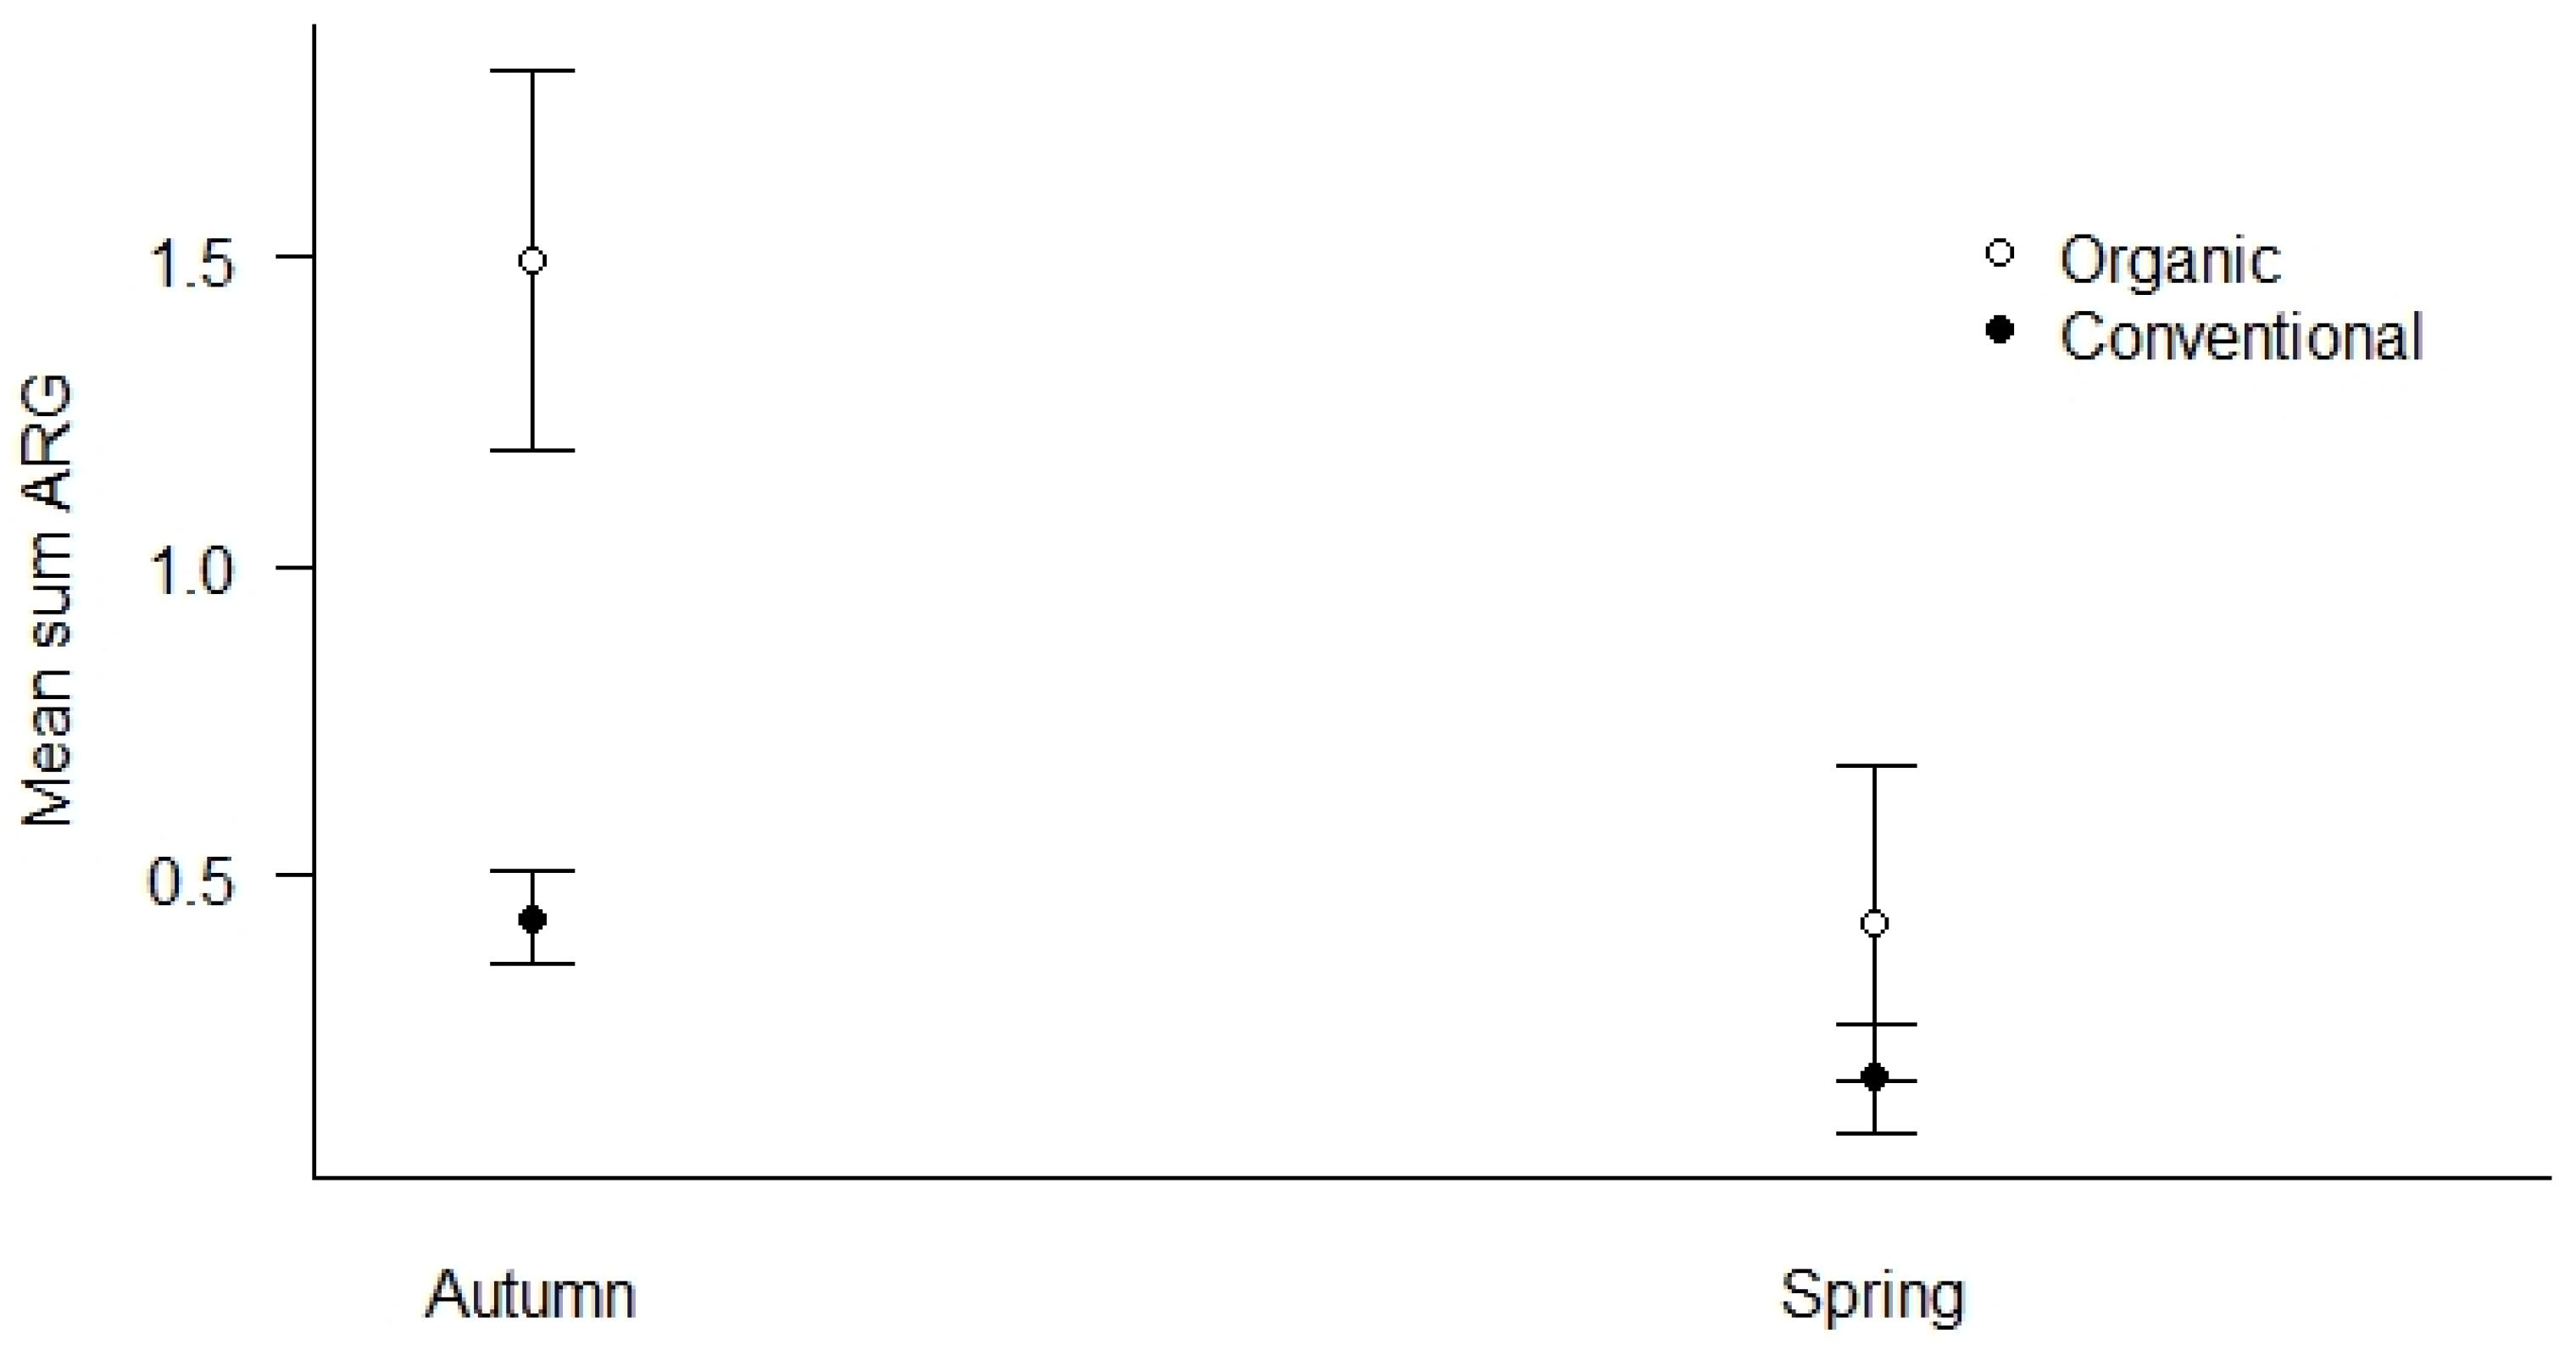
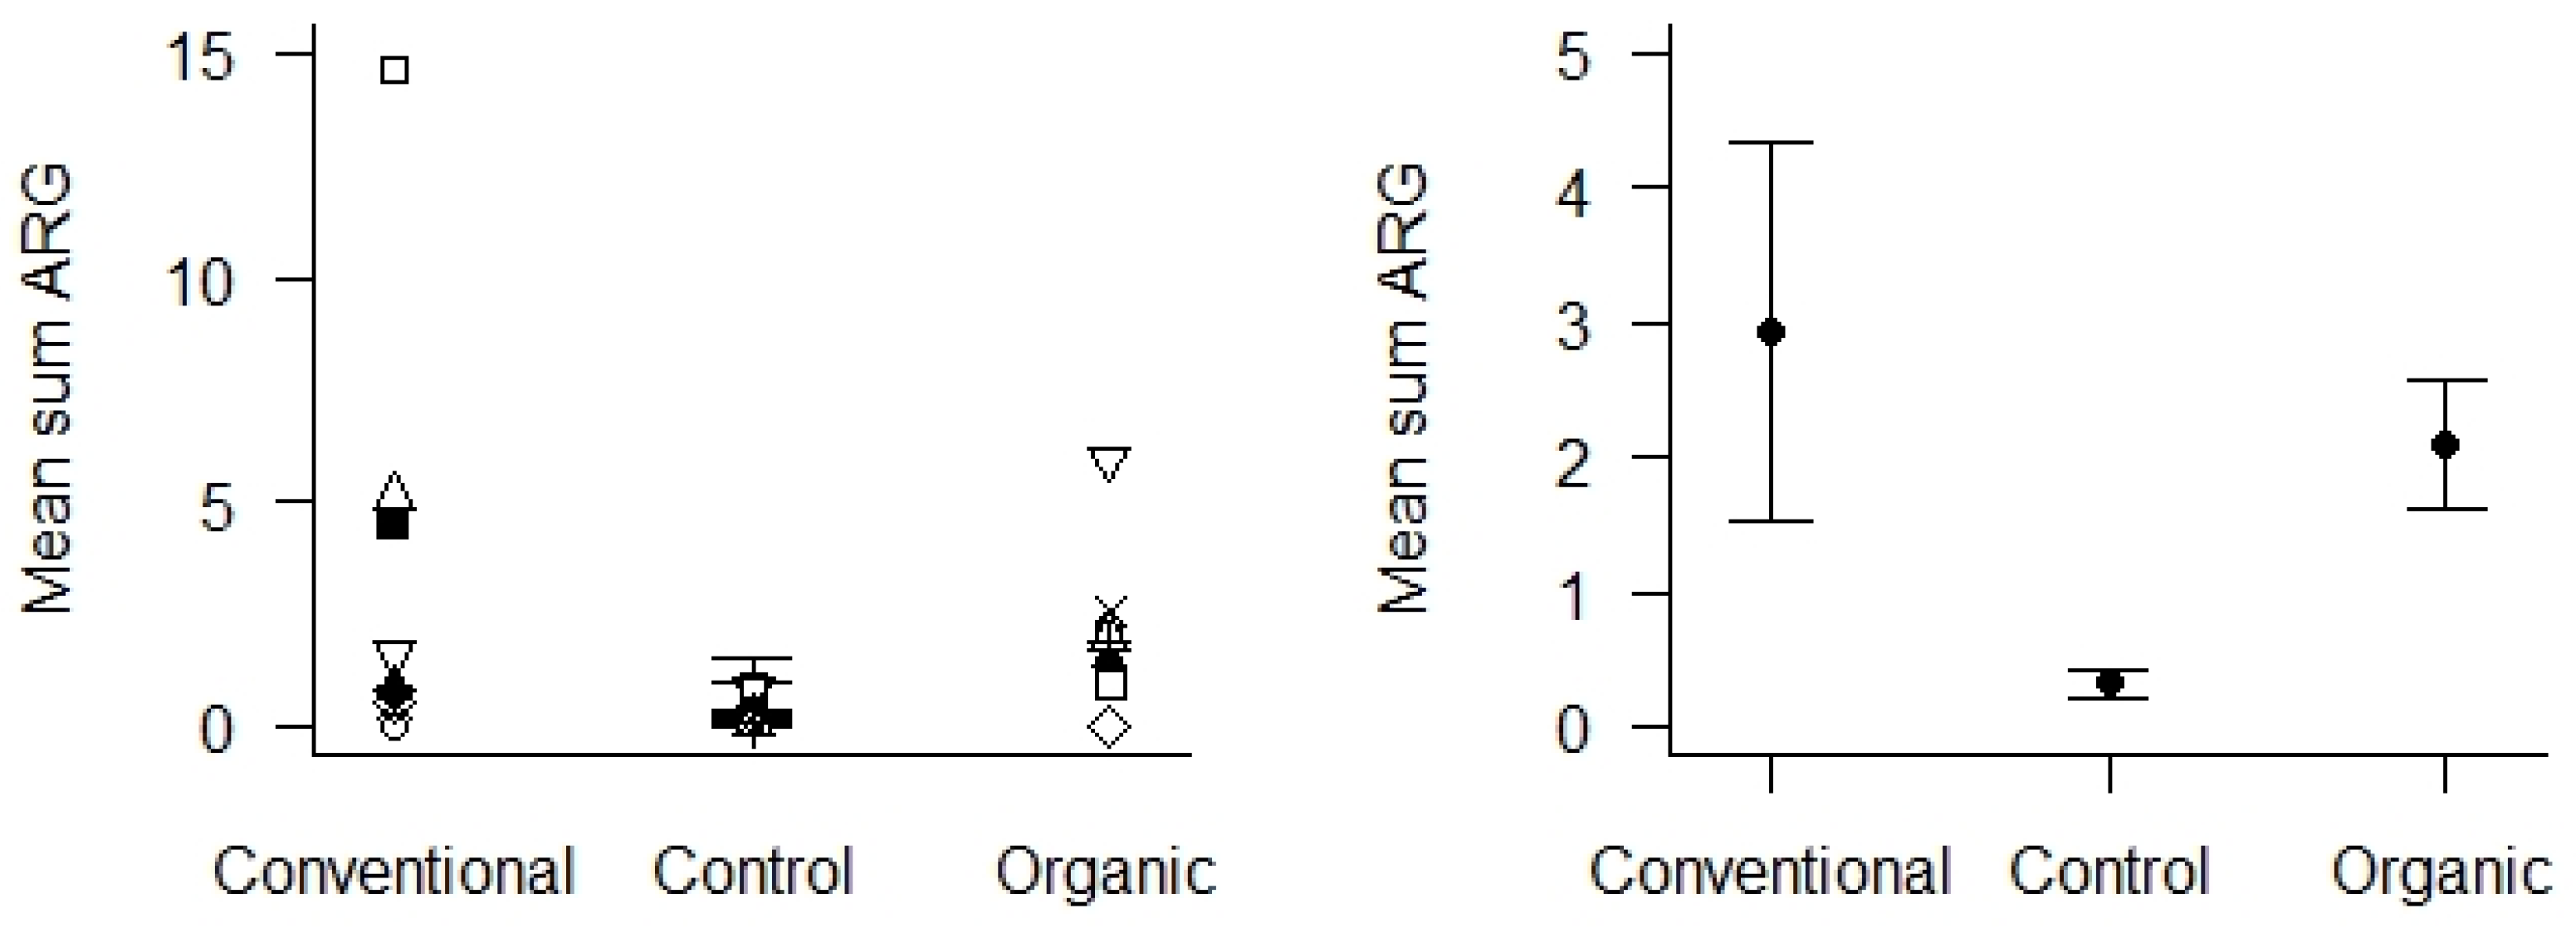
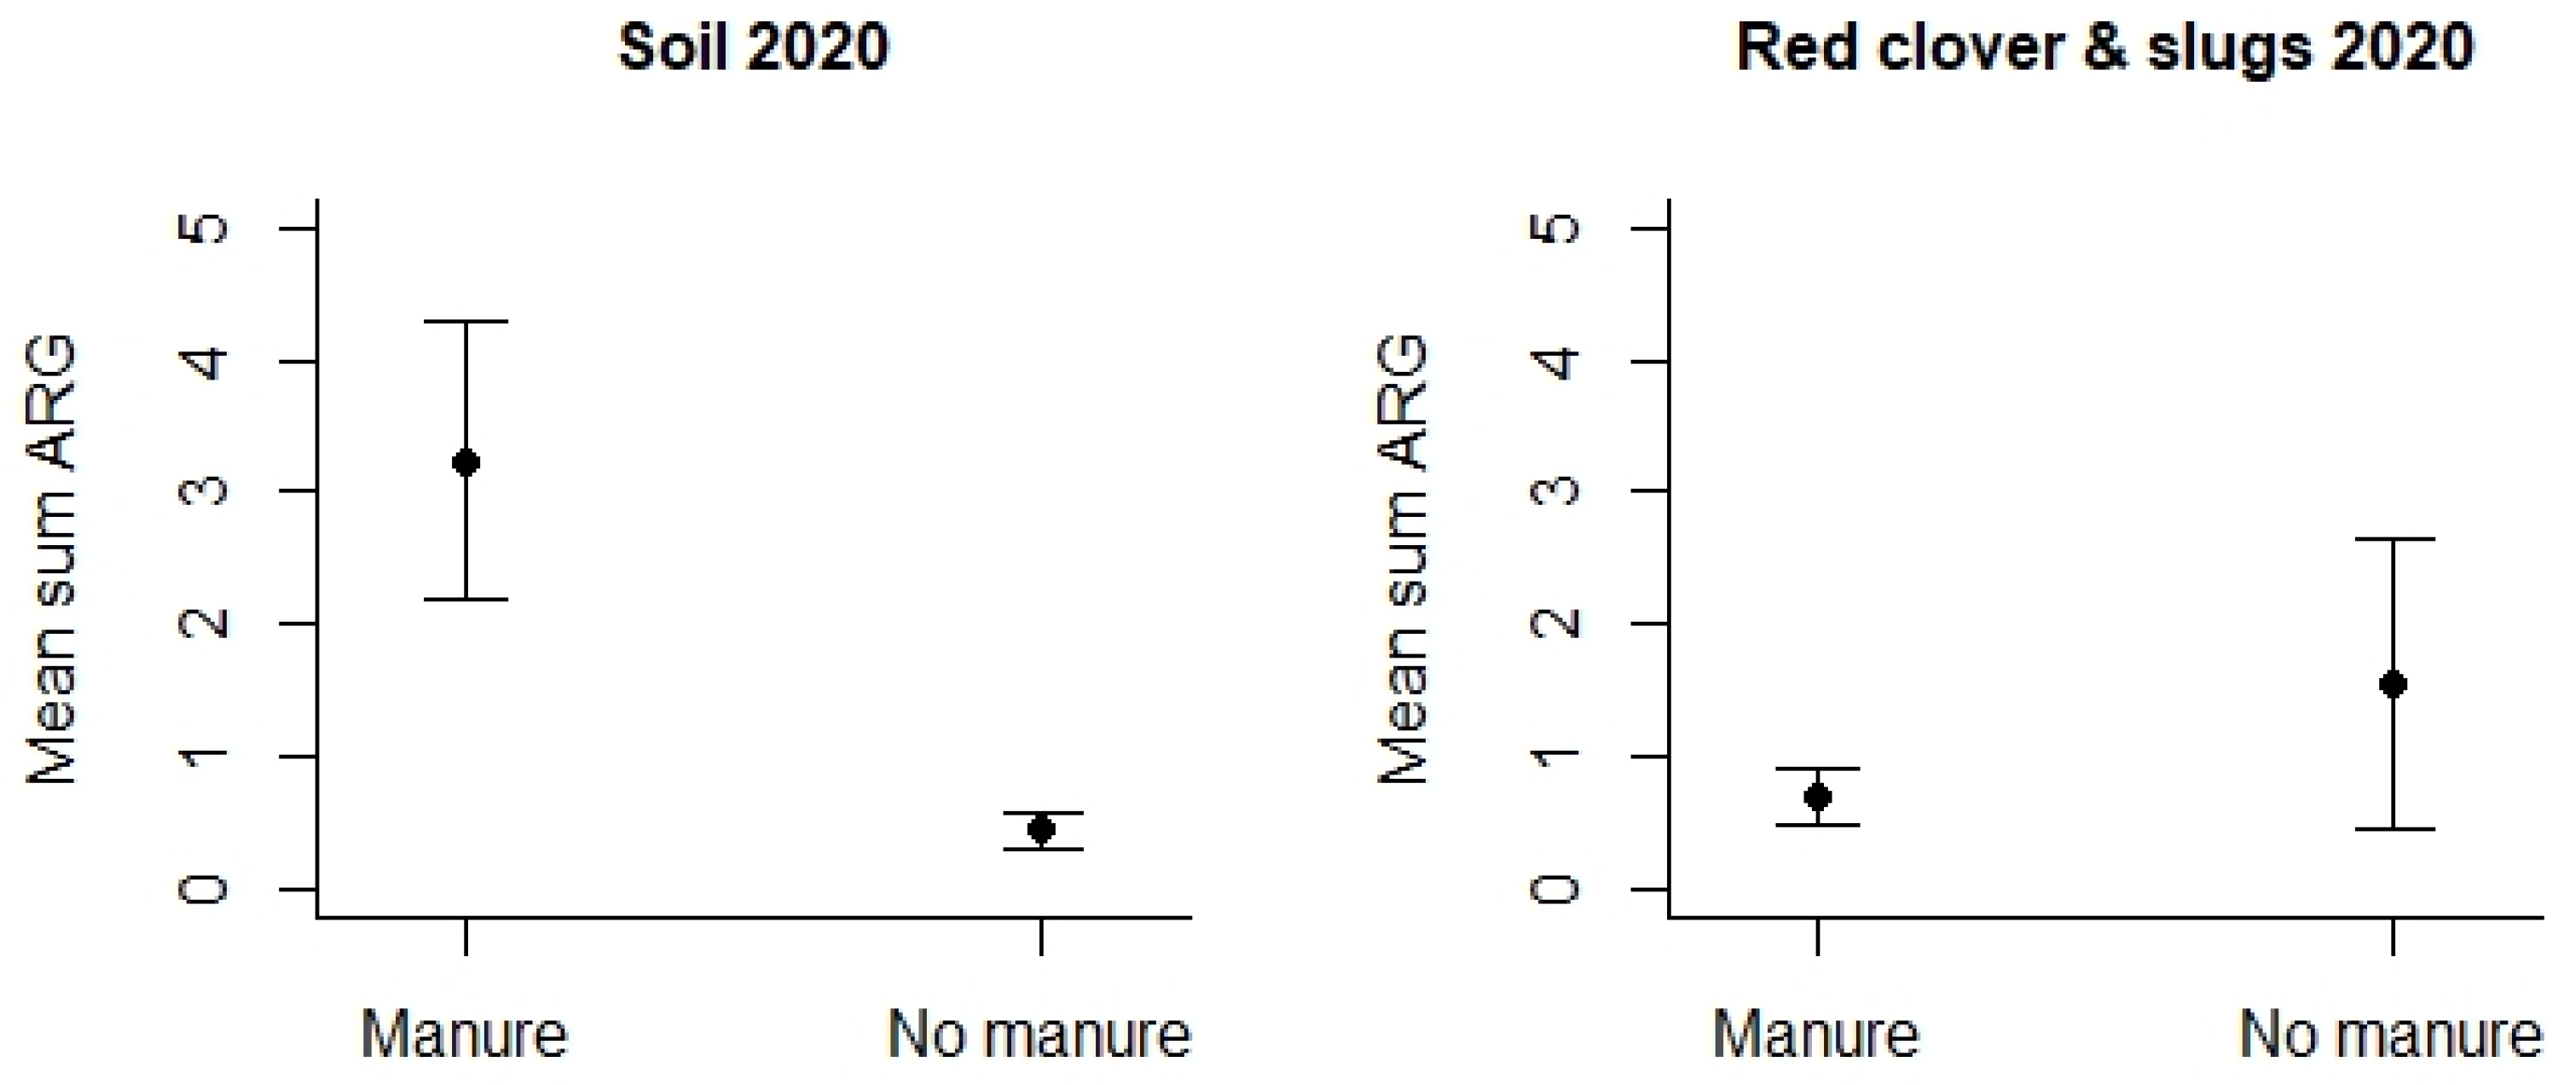
4.3. Antimicrobial Resistance Genes (ARGs) in Agricultural and Control Landscapes in Norway
4.4. Comparison of E. coli WGS and ARG Identification Using HT-qPCR
4.5. Antimicrobials, Heavy Metals, and Pesticides in Soil
5. Discussion
Supplementary Materials
Author Contributions
Funding
Data Availability Statement
Acknowledgments
Conflicts of Interest
References
- WHO. Antibiotic Resistance. 2023. Available online: https://www.who.int/news-room/fact-sheets/detail/antibiotic-resistance (accessed on 17 March 2024).
- Dadgostar, P. Antimicrobial Resistance: Implications and Costs. Infect. Drug Resist. 2019, 12, 3903–3910. [Google Scholar] [CrossRef] [PubMed]
- Karkman, A.; Parnanen, K.; Larsson, D.G.J. Fecal pollution can explain antibiotic resistance gene abundances in anthropogenically impacted environments. Nat. Commun. 2019, 10, 80. [Google Scholar] [CrossRef] [PubMed]
- Van, T.T.H.; Yidana, Z.; Smooker, P.M.; Coloe, P.J. Antibiotic use in food animals worldwide, with a focus on Africa: Pluses and minuses. J. Glob. Antimicrob. Resist. 2020, 20, 170–177. [Google Scholar] [CrossRef] [PubMed]
- Van Boeckel, T.P.; Glennon, E.E.; Chen, D.; Gilbert, M.; Robinson, T.P.; Grenfell, B.T.; Levin, S.A.; Bonhoeffer, S.; Laxminarayan, R. Reducing antimicrobial use in food animals. Science 2017, 357, 1350–1352. [Google Scholar] [CrossRef]
- Marutescu, L.G.; Jaga, M.; Postolache, C.; Barbuceanu, F.; Milita, N.M.; Romascu, L.M.; Schmitt, H.; de Roda Husman, A.M.; Sefeedpari, P.; Glaeser, S.; et al. Insights into the impact of manure on the environmental antibiotic residues and resistance pool. Front. Microbiol. 2022, 13, 965132. [Google Scholar] [CrossRef]
- Gou, M.; Hu, H.W.; Zhang, Y.J.; Wang, J.T.; Hayden, H.; Tang, Y.Q.; He, J.Z. Aerobic composting reduces antibiotic resistance genes in cattle manure and the resistome dissemination in agricultural soils. Sci. Total Environ. 2018, 612, 1300–1310. [Google Scholar] [CrossRef]
- Han, X.M.; Hu, H.W.; Chen, Q.L.; Yang, L.Y.; Li, H.L.; Zhu, Y.G.; Li, X.Z.; Ma, Y.B. Antibiotic resistance genes and associated bacterial communities in agricultural soils amended with different sources of animal manures. Soil. Biol. Biochem. 2018, 126, 91–102. [Google Scholar] [CrossRef]
- Lima, T.; Domingues, S.; Da Silva, G.J. Manure as a Potential Hotspot for Antibiotic Resistance Dissemination by Horizontal Gene Transfer Events. Vet. Sci. 2020, 7, 110. [Google Scholar] [CrossRef]
- Carballo, M.; Aguayo, S.; González, M.; Esperon, F.; de la Torre, A. Environmental Assessment of Tetracycline’s Residues Detected in Pig Slurry and Poultry Manure.Journal of Environmental Protection. J. Environ. Prot. 2016, 7, 82–92. [Google Scholar] [CrossRef]
- Samreen; Ahmad, I.; Malak, H.A.; Abulreesh, H.H. Environmental antimicrobial resistance and its drivers: A potential threat to public health. J. Glob. Antimicrob. Resist. 2021, 27, 101–111. [Google Scholar] [CrossRef]
- Di Cesare, A.; Eckert, E.M.; D’Urso, S.; Bertoni, R.; Gillan, D.C.; Wattiez, R.; Corno, G. Co-occurrence of integrase 1, antibiotic and heavy metal resistance genes in municipal wastewater treatment plants. Water Res. 2016, 94, 208–214. [Google Scholar] [CrossRef] [PubMed]
- Ramakrishnan, B.; Venkateswarlu, K.; Sethunathan, N.; Megharaj, M. Local applications but global implications: Can pesticides drive microorganisms to develop antimicrobial resistance? Sci. Total Environ. 2019, 654, 177–189. [Google Scholar] [CrossRef]
- Qiu, D.; Ke, M.; Zhang, Q.; Zhang, F.; Lu, T.; Sun, L.; Qian, H. Response of microbial antibiotic resistance to pesticides: An emerging health threat. Sci. Total Environ. 2022, 850, 158057. [Google Scholar] [CrossRef] [PubMed]
- Fang, H.; Han, L.; Zhang, H.; Deng, Y.; Ge, Q.; Mei, J.; Long, Z.; Yu, Y. Repeated treatments of ciprofloxacin and kresoxim-methyl alter their dissipation rates, biological function and increase antibiotic resistance in manured soil. Sci. Total Environ. 2018, 628–629, 661–671. [Google Scholar] [CrossRef]
- Berendonk, T.U.; Manaia, C.M.; Merlin, C.; Fatta-Kassinos, D.; Cytryn, E.; Walsh, F.; Burgmann, H.; Sorum, H.; Norstrom, M.; Pons, M.N.; et al. Tackling antibiotic resistance: The environmental framework. Nat. Rev. Microbiol. 2015, 13, 310–317. [Google Scholar] [CrossRef] [PubMed]
- D’Costa, V.M.; King, C.E.; Kalan, L.; Morar, M.; Sung, W.W.; Schwarz, C.; Froese, D.; Zazula, G.; Calmels, F.; Debruyne, R.; et al. Antibiotic resistance is ancient. Nature 2011, 477, 457–461. [Google Scholar] [CrossRef]
- McCann, C.M.; Christgen, B.; Roberts, J.A.; Su, J.Q.; Arnold, K.E.; Gray, N.D.; Zhu, Y.G.; Graham, D.W. Understanding drivers of antibiotic resistance genes in High Arctic soil ecosystems. Environ. Int. 2019, 125, 497–504. [Google Scholar] [CrossRef]
- Holmes, A.H.; Moore, L.S.; Sundsfjord, A.; Steinbakk, M.; Regmi, S.; Karkey, A.; Guerin, P.J.; Piddock, L.J. Understanding the mechanisms and drivers of antimicrobial resistance. Lancet 2016, 387, 176–187. [Google Scholar] [CrossRef]
- Xie, W.Y.; Shen, Q.; Zhao, F.J. Antibiotics and antibiotic resistance from animal manures to soil: A review. Eur. J. Soil. Sci. 2018, 69, 181–195. [Google Scholar] [CrossRef]
- Zhu, Y.G.; Zhao, Y.; Li, B.; Huang, C.L.; Zhang, S.Y.; Yu, S.; Chen, Y.S.; Zhang, T.; Gillings, M.R.; Su, J.Q. Continental-scale pollution of estuaries with antibiotic resistance genes. Nat. Microbiol. 2017, 2, 16270. [Google Scholar] [CrossRef]
- Waseem, H.; Jameel, S.; Ali, J.; Saleem Ur Rehman, H.; Tauseef, I.; Farooq, U.; Jamal, A.; Ali, M.I. Contributions and Challenges of High Throughput qPCR for Determining Antimicrobial Resistance in the Environment: A Critical Review. Molecules 2019, 24, 163. [Google Scholar] [CrossRef]
- Michelet, L.; Delannoy, S.; Devillers, E.; Umhang, G.; Aspan, A.; Juremalm, M.; Chirico, J.; van der Wal, F.J.; Sprong, H.; Boye Pihl, T.P.; et al. High-throughput screening of tick-borne pathogens in Europe. Front. Cell Infect. Microbiol. 2014, 4, 103. [Google Scholar] [CrossRef] [PubMed]
- Ahmed, W.; Zhang, Q.; Lobos, A.; Senkbeil, J.; Sadowsky, M.J.; Harwood, V.J.; Saeidi, N.; Marinoni, O.; Ishii, S. Precipitation influences pathogenic bacteria and antibiotic resistance gene abundance in storm drain outfalls in coastal sub-tropical waters. Environ. Int. 2018, 116, 308–318. [Google Scholar] [CrossRef] [PubMed]
- Zhang, Q.; Ishii, S. Improved simultaneous quantification of multiple waterborne pathogens and fecal indicator bacteria with the use of a sample process control. Water Res. 2018, 137, 193–200. [Google Scholar] [CrossRef]
- Roken, M.; Forfang, K.; Wasteson, Y.; Haaland, A.H.; Eiken, H.G.; Hagen, S.B.; Bjelland, A.M. Antimicrobial resistance-Do we share more than companionship with our dogs? J. Appl. Microbiol. 2022, 133, 1027–1039. [Google Scholar] [CrossRef]
- Mulchandani, R.; Wang, Y.; Gilbert, M.; Van Boeckel, T.P. Global trends in antimicrobial use in food-producing animals: 2020 to 2030. PLoS Glob. Public Health 2023, 3, e0001305. [Google Scholar] [CrossRef]
- Simonsen, G.S. NORM/NORM-VET 2019. Usage of Antimicrobial Agents and Occurrence of Antimicrobial Resistance in Norway; Norwegian Vewterinary Institute: Tromsø/Oslo, Norway, 2020; p. 153. [Google Scholar]
- Ewels, P.; Magnusson, M.; Lundin, S.; Kaller, M. MultiQC: Summarize analysis results for multiple tools and samples in a single report. Bioinformatics 2016, 32, 3047–3048. [Google Scholar] [CrossRef] [PubMed]
- Bolger, A.M.; Lohse, M.; Usadel, B. Trimmomatic: A flexible trimmer for Illumina sequence data. Bioinformatics 2014, 30, 2114–2120. [Google Scholar] [CrossRef] [PubMed]
- Bankevich, A.; Nurk, S.; Antipov, D.; Gurevich, A.A.; Dvorkin, M.; Kulikov, A.S.; Lesin, V.M.; Nikolenko, S.I.; Pham, S.; Prjibelski, A.D.; et al. SPAdes: A new genome assembly algorithm and its applications to single-cell sequencing. J. Comput. Biol. 2012, 19, 455–477. [Google Scholar] [CrossRef]
- Walker, B.J.; Abeel, T.; Shea, T.; Priest, M.; Abouelliel, A.; Sakthikumar, S.; Cuomo, C.A.; Zeng, Q.; Wortman, J.; Young, S.K.; et al. Pilon: An integrated tool for comprehensive microbial variant detection and genome assembly improvement. PLoS ONE 2014, 9, e112963. [Google Scholar] [CrossRef]
- Seemann, T. Prokka: Rapid prokaryotic genome annotation. Bioinformatics 2014, 30, 2068–2069. [Google Scholar] [CrossRef] [PubMed]
- Gurevich, A.; Saveliev, V.; Vyahhi, N.; Tesler, G. QUAST: Quality assessment tool for genome assemblies. Bioinformatics 2013, 29, 1072–1075. [Google Scholar] [CrossRef] [PubMed]
- Hunt, M.; Mather, A.E.; Sanchez-Buso, L.; Page, A.J.; Parkhill, J.; Keane, J.A.; Harris, S.R. ARIBA: Rapid antimicrobial resistance genotyping directly from sequencing reads. Microb. Genom. 2017, 3, e000131. [Google Scholar] [CrossRef] [PubMed]
- Wirth, T.; Falush, D.; Lan, R.; Colles, F.; Mensa, P.; Wieler, L.H.; Karch, H.; Reeves, P.R.; Maiden, M.C.; Ochman, H.; et al. Sex and virulence in Escherichia coli: An evolutionary perspective. Mol. Microbiol. 2006, 60, 1136–1151. [Google Scholar] [CrossRef]
- Bortolaia, V.; Kaas, R.S.; Ruppe, E.; Roberts, M.C.; Schwarz, S.; Cattoir, V.; Philippon, A.; Allesoe, R.L.; Rebelo, A.R.; Florensa, A.F.; et al. ResFinder 4.0 for predictions of phenotypes from genotypes. J. Antimicrob. Chemother. 2020, 75, 3491–3500. [Google Scholar] [CrossRef]
- Clausen, P.; Aarestrup, F.M.; Lund, O. Rapid and precise alignment of raw reads against redundant databases with KMA. BMC Bioinform. 2018, 19, 307. [Google Scholar] [CrossRef]
- Camacho, C.; Coulouris, G.; Avagyan, V.; Ma, N.; Papadopoulos, J.; Bealer, K.; Madden, T.L. BLAST+: Architecture and applications. BMC Bioinform. 2009, 10, 421. [Google Scholar] [CrossRef]
- Kaspersen, H.; Fiskebeck, E.Z. ALPPACA—A tooL for Prokaryotic Phylogeny And Clustering Analysis. J. Open Source Softw. 2022, 7, 4677. [Google Scholar] [CrossRef]
- Letunic, I.; Bork, P. Interactive Tree of Life (iTOL) v5: An online tool for phylogenetic tree display and annotation. Nucleic Acids Res. 2021, 49, W293–W296. [Google Scholar] [CrossRef]
- R Core Team. R: A Language and Environment for Statistical Computing; R Foundation for Statistical Computing: Vienna, Austria, 2021; Available online: https://www.R-project.org/ (accessed on 29 February 2024).
- Osbiston, K.; Oxbrough, A.; Fernandez-Martinez, L.T. Antibiotic resistance levels in soils from urban and rural land uses in Great Britain. Access Microbiol. 2021, 3, 000181. [Google Scholar] [CrossRef]
- Wang, M.; Zhao, J.; Liu, Y.; Huang, S.; Zhao, C.; Jiang, Z.; Gu, Y.; Xiao, J.; Wu, Y.; Ying, R.; et al. Deciphering soil resistance and virulence gene risks in conventional and organic farming systems. J. Hazard. Mater. 2024, 468, 133788. [Google Scholar] [CrossRef]
- Xie, W.Y.; Yang, X.P.; Li, Q.; Wu, L.H.; Shen, Q.R.; Zhao, F.J. Changes in antibiotic concentrations and antibiotic resistome during commercial composting of animal manures. Environ. Pollut. 2016, 219, 182–190. [Google Scholar] [CrossRef] [PubMed]
- Mo, S.S.; Urdahl, A.M.; Madslien, K.; Sunde, M.; Nesse, L.L.; Slettemeas, J.S.; Norstrom, M. What does the fox say? Monitoring antimicrobial resistance in the environment using wild red foxes as an indicator. PLoS ONE 2018, 13, e0198019. [Google Scholar] [CrossRef] [PubMed]
- Torres, R.T.; Virgós, E.; Panzacchi, M.; Linnell, J.D.; Fonseca, C. Life at the edge: Roe deer occurrence at the opposite ends of their geographical distribution, Norway and Portugal. Mamalian Biol. 2019, 77, 140–146. [Google Scholar] [CrossRef]
- Anjum, M.F.; Schmitt, H.; Börjesson, S.; Berendonk, T.U.; Donner, E.; Stehling, E.G.; Boerlin, P.; Topp, E.; Jardine, C.; Li, X.; et al. The potential of using E. coli as an indicator for the surveillance of antimicrobial resistance (AMR) in the environment. Curr. Opin. Microbiol. 2021, 64, 152–158. [Google Scholar] [CrossRef] [PubMed]
- Roschanski, N.; Fischer, J.; Guerra, B.; Roesler, U. Development of a multiplex real-time PCR for the rapid detection of the predominant beta-lactamase genes CTX-M, SHV, TEM and CIT-type AmpCs in Enterobacteriaceae. PLoS ONE 2014, 9, e100956. [Google Scholar] [CrossRef]
- Kembel, S.W.; Wu, M.; Eisen, J.A.; Green, J.L. Incorporating 16S gene copy number information improves estimates of microbial diversity and abundance. PLoS Comput. Biol. 2012, 8, e1002743. [Google Scholar] [CrossRef]


| Sample Type | Total No of Samples | E. coli-Positive Samples | ||
|---|---|---|---|---|
| No | % | 95% CI | ||
| Soil | 24 | 17 | 70.8 | 48.9–87.4 |
| Red clover | 150 | 26 | 17.3 | 11.6–24.4 |
| Slug/snail | 114 | 20 | 17.5 | 11.1–25.8 |
| Mouse/shrew | 59 | 47 | 79.7 | 67.2–89.0 |
| Earthworm * | 68 | 1 | 1.5 | 0.04–7.9 |
| Sum | 415 | 111 | 26.7 | 22.5–31.3 |
| Location Area Season | Sample | Isolate No | Antimicrobials to Which Each Isolate Displays Phenotypic Resistance | ST | ARGs Identified by WGS | |||||||
|---|---|---|---|---|---|---|---|---|---|---|---|---|
| Type | ID | blaTEM | cat | flo | sul | tet | aph(3″) | aph(6) | ||||
| D Organic spring | Slug | 1860-20 | 1 | None | - | |||||||
| 2 | Ampicillin, sulfamethoxazole, tetracycline, streptomycin | 69 | 1C | 2 | A | Ib | Id * | |||||
| 3 | None | - | ||||||||||
| A Organic Autumn | Red clover | 3544-3 | 1 | Ampicillin, chloramphenicol | 362 | 1B | A1 * | |||||
| 2 | Ampicillin, chloramphenicol | 362 | 1B | A1 * | ||||||||
| 3 | Ampicillin, chloramphenicol | - | ||||||||||
| Red clover | 3544-5 | 1 | Ampicillin, chloramphenicol | 362 | 1B | A1 * | ||||||
| 2 | Ampicillin, chloramphenicol | 362 | 1B | A1 * | ||||||||
| 3 | Ampicillin, chloramphenicol | - | ||||||||||
| Red clover | 3544-9 | 1 | Ampicillin, chloramphenicol | 362 | 1B | A1 * | ||||||
| 2 | Ampicillin, chloramphenicol | 362 | 1B | A1 * | ||||||||
| 3 | Ampicillin, chloramphenicol | - | ||||||||||
| Slug | 3544-20 | 1 | Ampicillin, chloramphenicol | 362 | 1B | A1 * | ||||||
| 2 | Ampicillin, chloramphenicol | 362 | 1B | A1 * | ||||||||
| 3 | Ampicillin, chloramphenicol | - | ||||||||||
| B Conventional autumn | Mouse | 3942-4 | 1 | None | - | |||||||
| 2 | None | - | ||||||||||
| 3 | Ampicillin | 1157 | 1D | |||||||||
| D Organic autumn | Soil | 3820-1 | 1 | Chloramphenicol | 2522 | R ** | 2 | Ib * | Id | |||
| 2 | Chloramphenicol | 2522 | R ** | 2 | Ib * | Id | ||||||
| 3 | None | - | ||||||||||
| Red clover | 3820-11 | 1 | Streptomycin | 549 | Ib * | Id | ||||||
| 2 | None | - | ||||||||||
| 3 | Ampicillin | 1170 | ||||||||||
| Sample Type | No. of Samples | % ARG Positive | ||
|---|---|---|---|---|
| Total No | 16S Positive | ARG Positive | ||
| Soil | 84 | 80 | 58 | 69.0 |
| Earthworm | 68 | 66 | 30 | 44.1 |
| Mouse/shrew | 59 | 59 | 36 | 61.0 |
| Red clover | 250 | 250 | 147 | 58.8 |
| Slug/snail | 183 | 183 | 111 | 60.7 |
| All | 644 | 638 | 383 | 59.5 |
| Gene | ARG Score | Gene | ARG Score | Gene | ARG Score | |||
|---|---|---|---|---|---|---|---|---|
| 2019 | 2020 | 2019 | 2020 | 2019 | 2020 | |||
| aac3 | 0.190 | 2.647 | catA | 21.064 | 0.000 | qnrA1 | 0.023 | 0.012 |
| aac6 | 9.516 | 1.318 | cmlA | 0.000 | 0.000 | qnrB1 | 1.013 | 1.212 |
| ant3 | 6.075 | 4.404 | dfrA | 11.873 | 3.356 | qnrS | 0.000 | 0.000 |
| aph3 | 4.902 | 1.460 | ermB | 0.398 | 0.067 | strA | 20.257 | 23.150 |
| blaACT | 4.955 | 2.093 | ermF | 0.029 | 0.025 | strB | 24.312 | 27.916 |
| blaCTX | 1.712 | 0.443 | floR | 0.160 | 0.038 | sul1 | 3.752 | 0.310 |
| blaDHA | 27.260 | 3.069 | intl1 | 8.956 | 40.562 | sul2 | 15.770 | 26.838 |
| blaKPC | 0.014 | 0.000 | mcr1 | 0.000 | 0.000 | sul3 | 0.847 | 0.103 |
| blaNDM | 0.003 | 0.000 | mecA | 0.000 | 0.000 | tetA | 2.548 | 0.102 |
| blaSHV | 5.911 | 0.678 | oqxA | 10.975 | 10.701 | tetB | 3.619 | 6.323 |
| blaTEM | 28.909 | 38.144 | oqxB | 18.739 | 9.369 | tetM | 33.737 | 22.520 |
| blaVIM | 0.003 | 0.000 | vanA | 0.000 | 0.000 | |||
| Location | No. of Samples | % | ||
|---|---|---|---|---|
| Total | 16S-Positive | ARG-Positive | ARG-Positive | |
| A | 106 | 105 | 59 | 55.7 |
| B | 125 | 125 | 88 | 70.4 |
| C | 26 | 26 | 21 | 80.8 |
| D | 152 | 151 | 102 | 67.1 |
| E | 22 | 22 | 14 | 63.6 |
| F | 26 | 26 | 14 | 53.8 |
| G | 26 | 26 | 13 | 50.0 |
| H | 126 | 122 | 56 | 44.4 |
| I | 19 | 19 | 10 | 52.6 |
| J | 16 | 16 | 6 | 37.5 |
| Total sum | 644 | 638 | 383 | 59.5 |
Disclaimer/Publisher’s Note: The statements, opinions and data contained in all publications are solely those of the individual author(s) and contributor(s) and not of MDPI and/or the editor(s). MDPI and/or the editor(s) disclaim responsibility for any injury to people or property resulting from any ideas, methods, instructions or products referred to in the content. |
© 2024 by the authors. Licensee MDPI, Basel, Switzerland. This article is an open access article distributed under the terms and conditions of the Creative Commons Attribution (CC BY) license (https://creativecommons.org/licenses/by/4.0/).
Share and Cite
Nesse, L.L.; Forfang, K.; Slettemeås, J.S.; Hagen, S.; Sunde, M.; Elameen, A.; Johannessen, G.; Stenrød, M.; Tessema, G.T.; Almvik, M.; et al. Antimicrobial Resistance in the Terrestrial Environment of Agricultural Landscapes in Norway. Microorganisms 2024, 12, 1854. https://doi.org/10.3390/microorganisms12091854
Nesse LL, Forfang K, Slettemeås JS, Hagen S, Sunde M, Elameen A, Johannessen G, Stenrød M, Tessema GT, Almvik M, et al. Antimicrobial Resistance in the Terrestrial Environment of Agricultural Landscapes in Norway. Microorganisms. 2024; 12(9):1854. https://doi.org/10.3390/microorganisms12091854
Chicago/Turabian StyleNesse, Live L., Kristin Forfang, Jannice Schau Slettemeås, Snorre Hagen, Marianne Sunde, Abdelhameed Elameen, Gro Johannessen, Marianne Stenrød, Girum Tadesse Tessema, Marit Almvik, and et al. 2024. "Antimicrobial Resistance in the Terrestrial Environment of Agricultural Landscapes in Norway" Microorganisms 12, no. 9: 1854. https://doi.org/10.3390/microorganisms12091854
APA StyleNesse, L. L., Forfang, K., Slettemeås, J. S., Hagen, S., Sunde, M., Elameen, A., Johannessen, G., Stenrød, M., Tessema, G. T., Almvik, M., & Eiken, H. G. (2024). Antimicrobial Resistance in the Terrestrial Environment of Agricultural Landscapes in Norway. Microorganisms, 12(9), 1854. https://doi.org/10.3390/microorganisms12091854