Article

Sequence Types and Antimicrobial Resistance Profiles of Salmonella Typhimurium in the Food Chain in Singapore

1
National Centre for Food Science, Singapore Food Agency, 7 International Business Park, Singapore 609919, Singapore
2
Infectious Diseases Translational Research Programme, Department of Medicine, Division of Infectious Diseases, Yong Loo Lin School of Medicine, National University of Singapore, 1E Kent Ridge Road, NUHS Tower Block, Singapore 119228, Singapore
3
Laboratory of Bacterial Genomics, Genome Institute of Singapore, 60 Biopolis Street, Singapore 138672, Singapore
4
Centre for Animal & Veterinary Service, National Parks Board, Singapore 718827, Singapore
5
Department of Pathology and Laboratory Medicine, KK Women’s and Children’s Hospital, Singapore 229899, Singapore
6
Department of Microbiology and Immunology, Yong Loo Lin School of Medicine, National University of Singapore, Singapore 117545, Singapore
7
Duke-NUS Medical School, National University of Singapore, Singapore 169857, Singapore
8
Department of Laboratory Medicine, Tan Tock Seng Hospital, Singapore 308433, Singapore
9
Department of Microbiology, Singapore General Hospital, Singapore 169856, Singapore
10
Department of Food Science & Technology, National University of Singapore, Science Drive 2, Singapore 117542, Singapore
11
School of Biological Sciences, Nanyang Technological University, 60 Nanyang Dr, Singapore 637551, Singapore
*
Author to whom correspondence should be addressed.
Microorganisms 2024, 12(9), 1912; https://doi.org/10.3390/microorganisms12091912
Submission received: 2 September 2024 / Revised: 9 September 2024 / Accepted: 14 September 2024 / Published: 19 September 2024

Abstract

:
Salmonella remains a significant foodborne pathogen globally with S. Typhimurium presenting as a frequently occurring serovar. This study aimed to characterize 67 S. Typhimurium isolates from humans, food, farms, and slaughterhouses collected in Singapore from 2016 to 2017. Using whole-genome sequencing analysis, the isolates were found to belong to either ST19 (n = 33) or ST36 (n = 34). ST36 predominated in human intestinal and chicken isolates, while human extra-intestinal and non-chicken food isolates belonged to ST19. Plasmids were predicted in 88.1% (n = 59) of the isolates with the most common incompatibility group profiles being IncFIB(S), IncFII(S) and IncQ1. IncFIB(S) (adjusted p-value < 0.05) and IncFII(S) (adjusted p-value < 0.05) were significantly more prevalent in ST19 isolates, while Col156 (adjusted p-value < 0.05) was more significantly found in ST36 isolates. ST36 isolates exhibited higher resistance to multiple antibiotic classes such as penicillins, phenicols, folate pathway inhibitors, aminoglycosides, β-lactam/β-lactamase inhibitor combinations, tetracyclines, and fluoroquinolones. Phylogenetics analysis suggested potential shared routes of transmission among human, chicken, farm and slaughterhouse environments. Taken together, this study offers a cross-sectional epidemiological insight into the genomic epidemiology and antimicrobial landscape of S. Typhimurium isolates in Singapore, informing strategies for future public health and food safety surveillance.

1. Introduction

Salmonella ranks prominently among the frequently occurring foodborne pathogens [1] and is one of the major causes of foodborne diseases in both developing and developed countries [2]. Each year, Salmonella is estimated to be associated with 93.8 million incidents of foodborne illness and 155,000 fatalities globally [1,3], highlighting the significance of human salmonellosis as a global public health challenge.
Salmonella occurs naturally within environmental ecosystems and is prevalent among both domestic and wild animal populations [3]. Salmonella primarily inhabits the intestinal tracts of humans and agricultural animals but can also be found in wild avian species, reptiles, and occasionally, insects [4]. Additionally, feedstuff, soil, and fecal matter have also been frequently recognized as origins of Salmonella contamination in agricultural settings [5,6,7]. Being a zoonotic etiological agent, the transmission of Salmonella commonly emanates from food products of animal origin [8]. The occurrence of human salmonellosis is frequently associated with the consumption of food contaminated with Salmonella. Poultry, pork, and egg products are frequently identified as primary sources of Salmonella [9]. The risk for contamination and consequent infections can be further exacerbated by other factors such as ingestion of raw food, poor personal hygiene practices, inappropriate food storage, and improper heat treatment [10,11]. Furthermore, the socioeconomic impact resulting from human salmonellosis extends beyond health-related expenses, which includes additional costs shouldered by business operators for disposing of contaminated food and facing trade limitations [12].
S. Typhimurium is one of the most frequently reported Salmonella serovars worldwide [13,14]. Similar to other non-typhoidal serovars, the clinical manifestations of S. Typhimurium cover a spectrum of symptoms, including nausea, vomiting, diarrhea and abdominal cramps [2]. Although S. Typhimurium infections typically cause self-limiting gastroenteritis [15], it can also lead to bacteremia and focal extra-intestinal infections, including conditions such as meningitis and osteomyelitis, particularly among children [16,17]. In addition, the escalating prevalence and spread of antimicrobial resistance within Salmonella [10], accompanied by the lack of new antimicrobial agents, presents a global concern. One of the primary causes of antimicrobial resistance is linked to the release of non-metabolized antibiotics or their residues into the environment through feces, along with the misuse or overuse of antibiotics in agricultural or farming practices [18]. Consequently, this engenders genetic selection pressure, fostering the emergence of multidrug-resistant bacterial infections within the community [19]. Resistance to therapeutically relevant antimicrobials will pose significant public health concerns due to its association with higher rates of mortality and morbidity [20,21,22]. Thus, this warrants the need for continuous surveillance for the tracking of trends in the development of antimicrobial resistance and molecular subtypes of the strains to develop tailored treatment and control strategies [17,23].
Several studies, focusing on antimicrobial resistance profiles and molecular subtypes, have been undertaken to characterize S. Typhimurium [17,24,25]. Nonetheless, to our knowledge, a study to capture the serovar and antimicrobial profiles of S. Typhimurium in Singapore is currently limited. To address the knowledge gap, we performed antimicrobial susceptibility testing and whole genome sequencing on 67 S. Typhimurium isolates which are all isolates available from human, food, farm and slaughterhouse environmental samples in 2016 and 2017. Through this study, we identified the prevalent sequence types, plasmid, and antimicrobial resistance patterns of S. Typhimurium isolates in Singapore. These findings would be useful to inform strategies for foodborne zoonosis disease surveillance and targeted risk management measures for food safety and public health.

2. Materials and Methods

2.1. S. Typhimurium Isolates Collection

The study included a total of 67 S. Typhimurium isolates, which were available from different sources including farm and slaughterhouse environments (n = 10), food (n = 38), and humans (n = 19) between 2016 and 2017. Human isolates were lab-confirmed cases obtained from KK Women’s and Children’s Hospital, Singapore General Hospital, and Tan Tock Seng Hospital. Food isolates were obtained from routine surveillance and monitoring programs, while farm and slaughterhouse environmental isolates were obtained from the archived bacterial biobanks of the national environmental health laboratories. The collected S. Typhimurium isolates were streaked on Tryptic–Soy (Oxoid, Hampshire, UK) or non-selective nutrient agar for further characterization.

2.2. Phenotypic Antimicrobial Susceptibility Testing

The minimum inhibitory concentration of various antimicrobials was determined with the MicroScan Neg MIC Panel Type 44 (manufactured by Beckman Coulter, Inc., Brea, CA, USA), which was performed in accordance with the manufacturer’s instructions. The antimicrobial susceptibility profiles of each isolate were interpreted based on the latest versions of the Clinical and Laboratory Standards Institute (CLSI) or EUCAST at the time of analysis. To prevent the overestimation of resistance, isolates with minimum inhibitory concentrations (MICs) falling within the intermediate range were classified as susceptible.
All isolates were subjected to antimicrobial susceptibility testing against 28 antimicrobials belonging to 13 antimicrobial classes: Amikacin; Amoxicillin/K Clavulanate; Ampicillin/Sulbactam; Ampicillin; Aztreonam; Cefepime; Cefotaxime; Cefoxitin; Ceftazidime; Cefuroxime; Chloramphenicol; Ciprofloxacin; Colistin; Doripenem; Ertapenem; Fosfomycin; Gentamicin; Imipenem; Levofloxacin; Meropenem; Minocycline; Nitrofurantoin; Norfloxacin; Piperacillin/Tazobactam; Piperacillin; Tetracycline; Tobramycin; Trimethoprim/Sulfamethoxazole.

2.3. Whole-Genome Sequencing (WGS) and Analysis

All 67 S. Typhimurium were subjected to whole-genome sequencing (WGS), following previously described protocols [26]. Briefly, 1 mL of each S. Typhimurium overnight culture in Universal Pre-Enrichment Broth (Acumedia, San Bernardino, CA, USA) was centrifuged. The bacterial cells were then lysed using enzymatic lysis buffer at 37 °C for 45 min, which was followed by extraction using the DNeasy Blood and Tissue Kit (QIAGEN, Valencia, CA, USA) according to the manufacturer’s instructions. Genomic DNA was sheared using an M220 Focused Ultrasonicator (Covaris, Woburn, MA, USA), and library preparation was carried out using an NEBNext® Ultra™ DNA Library Prep Kit (NEB, Ipswich, MA, USA). Samples were then sequenced on a HiSeq 4000 sequencer (Illumina, San Diego, CA, USA) with 151 bp paired-end reads.
All primary sequence analysis was performed by the Genome Institute of Singapore on the Efficient Rapid Microbial Sequencing Platform (GERMS). The serovar of the isolates was predicted with the SeqSero programme [27], while MLST was called with SRST2 version 0.1.8 [28] by using reference sequences obtained from the PubMLST database for Salmonella (http://pubmlst.org/salmonella (accessed on 1 January 2021)). The antimicrobial resistance genes and virulence were also predicted by SRST2 [28], which makes use of the ARGannot resistance gene database (accessed on 1 January 2021)) [29] and the Virulence Factors database (accessed on 1 January 2021) [30] as references, respectively.
Sequencing reads were assembled with Velvet [31] using the VelvetOptimizer helper script (version 2.2.4), which were then passed into the Centre for Genomic Epidemiology (CGE)’s SPIFinder 1.0 (https://cge.food.dtu.dk/services/SPIFinder/ (accessed on 1 January 2021)) and PlasmidFinder 2.1 (https://cge.food.dtu.dk/services/PlasmidFinder/ (accessed on 1 January 2021)) for the identification of Salmonella Pathogenicity Islands (SPIs) and plasmids respectively.
Draft de novo genomes were used to build the MLST-specific core genome phylogeny trees using Parsnp version 1.5.3 and HarvestTools version 1.2 with default parameters and auto-assignment of genome as reference sequence [32]. Pairwise SNPs difference between isolates were obtained using mummer [33].

2.4. Data Analysis

Statistical significance was calculated using R version 4.2.0. p-values below 0.05 were considered significant, and where appropriate, Benjamini–Hochberg correction [34] will be applied. Clustering analysis and heatmaps were generated by the “ComplexHeatmap” version 2.12.1 package [35], while the “Goplot” version 4.2.3 [36] and “ComplexUpset” version 4.2.3 [37] packages in R were used to create the chord diagram for plasmid profiling and Upset plot for SPI profiling, respectively.
Co-occurrence analysis of antimicrobial resistance phenotypes in ST36 isolates was performed by calculating pairwise correlations using the antimicrobial resistance status (presence or absence) of each isolate. The resulting correlation matrix was then visualized with the “Corrplot” version 0.94 package. Correlation analysis was also conducted for antimicrobial resistance genotypes in ST36 by considering the presence or absence of the resistance gene. The correlation was then visualized with the “Ggraph” version 2.2.1 package from R, where only nodes with significant correlation above 0.7 or below −0.7 were displayed.
Non-metric multidimensional scaling analysis (NMDS) for antimicrobial resistance genes was performed using the metaMDS function in the “vegan” version 2.6-8 package using the Jaccard distance metric, wherein the isolates were grouped by their sequence types. Permutational analysis of variance (PERMANOVA) was performed using 10,000 permutations and a Jaccard distance metric.

2.5. Ethical Considerations

No ethics approval was required for this study, as the clinical isolates collected from the lab-confirmed cases were anonymized in the study.

3. Results

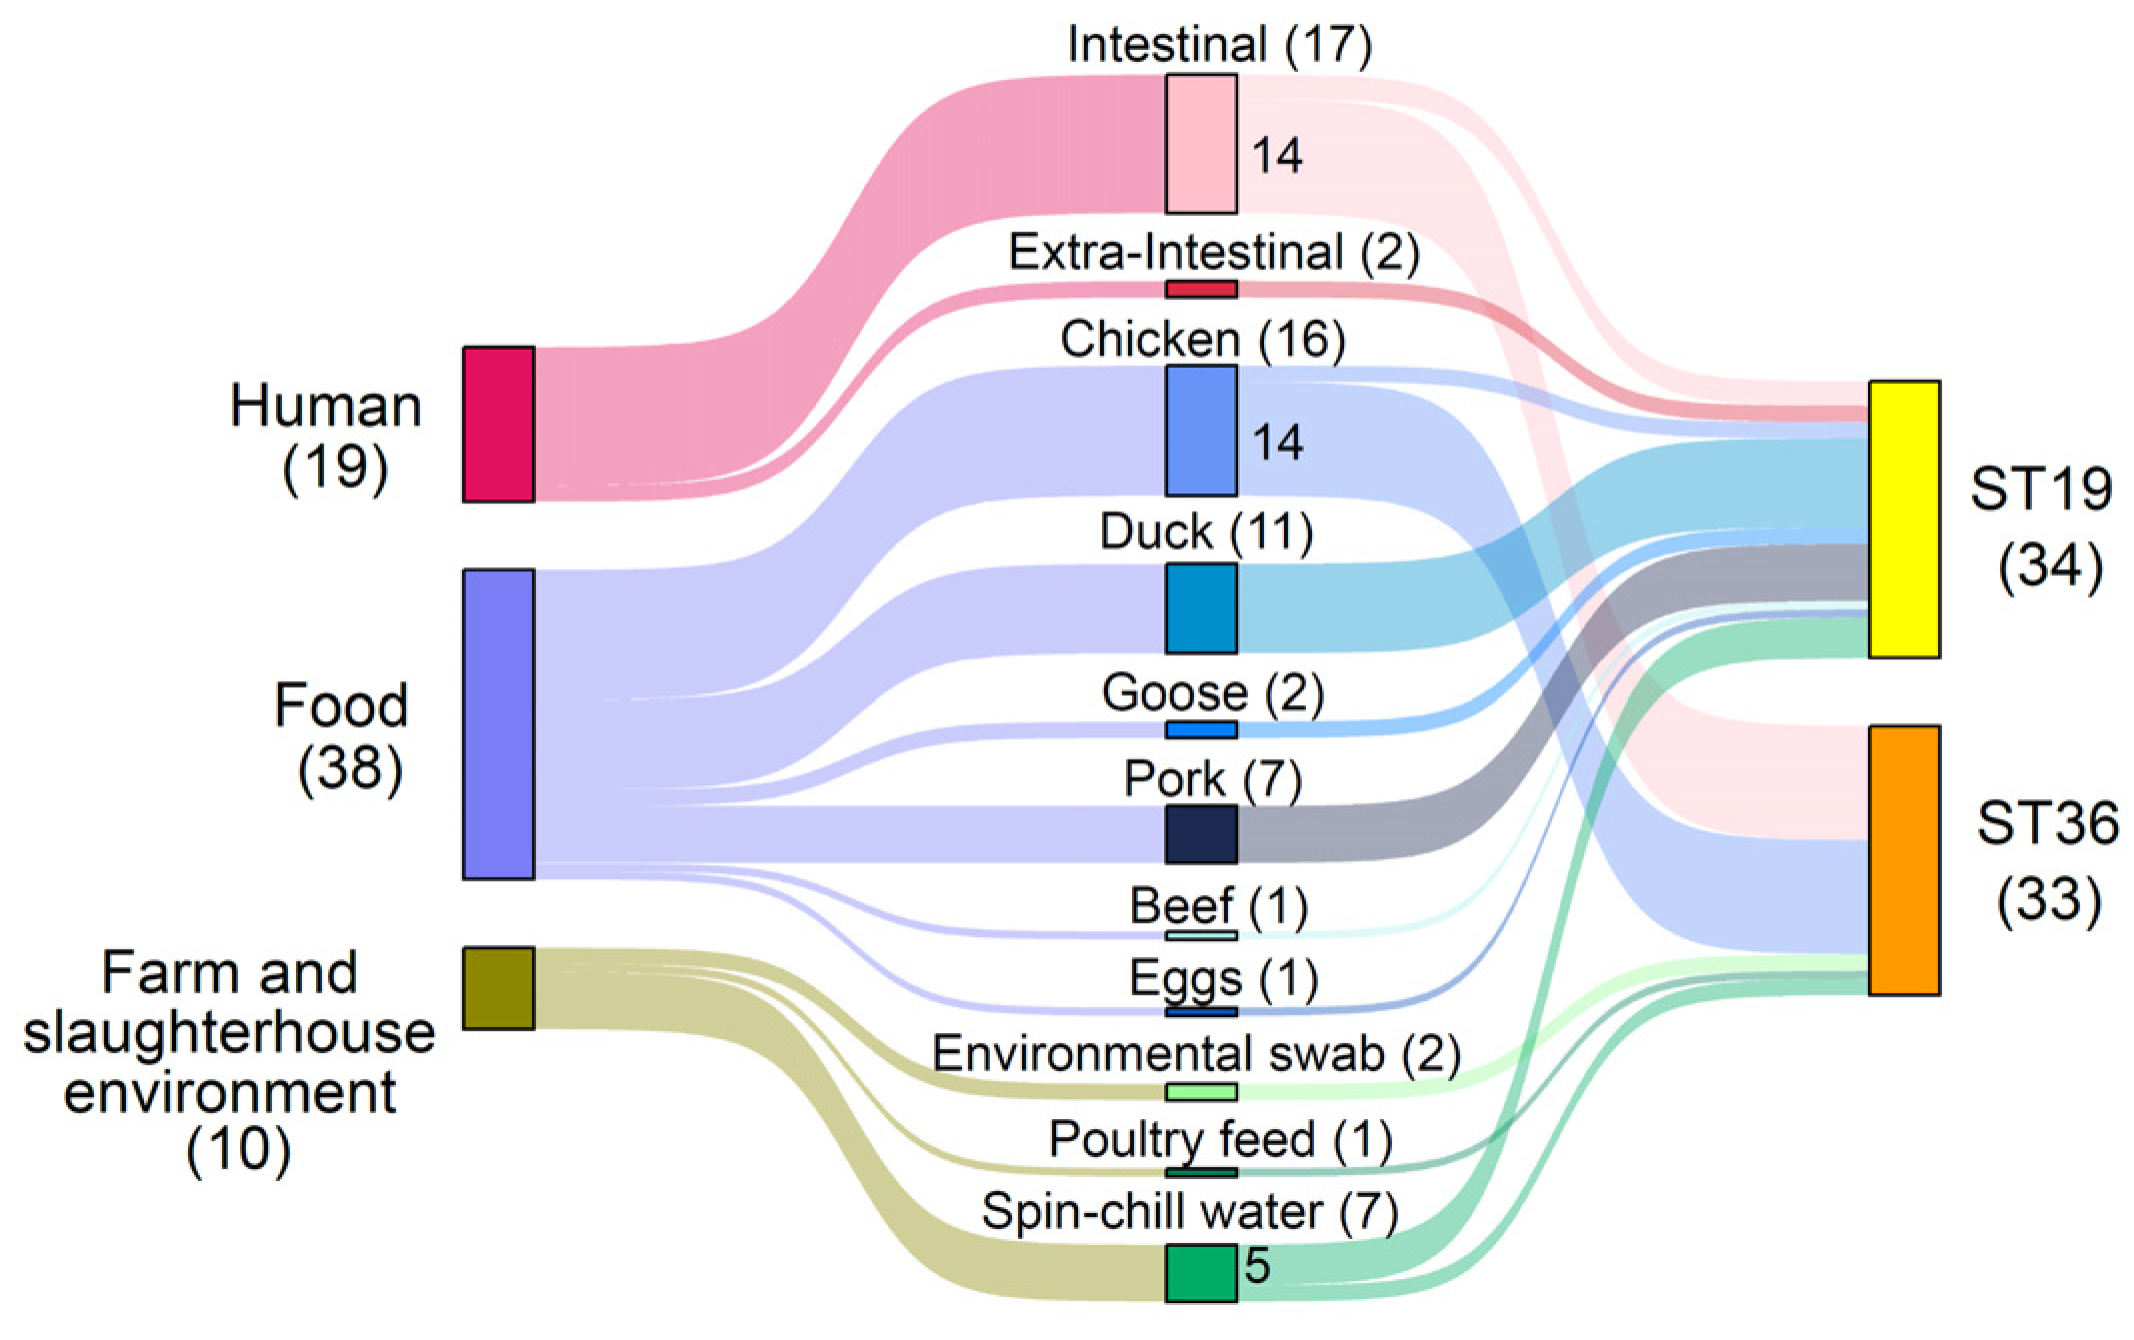
3.1. Prevalence of ST19 and ST36 S. Typhimurium Isolates in Singapore

All S. Typhimurium isolates belonged to two sequence types, ST19 (n = 34, 50.75%) and ST36 (n = 33, 49.25%) (Figure 1). Most of the human intestinal isolates (14/17, 82.35%) and chicken isolates (14/16, 87.5%) were found to belong to ST36, while all the human extra-intestinal isolates (n = 2) and non-chicken food isolates, including duck (n = 11), goose (n = 2), pork (n = 7), beef (n = 1) and eggs (n = 1), belonged to ST19.

3.2. Characterization of Mobile Genetic Factors by Sequence Types

All the S. Typhimurium isolates contained Salmonella pathogenicity islands (SPI) SPI-1 to SP-2, SP-3, SP-5, SP-9, SP-13, SP-14, and CS54 (centisome 54 pathogenicity island) (Figure 2A). Only two isolates from human intestinal and beef samples carried SP-12, which were both belonging to ST19. Although C63PI was only found in 34.4% (23/67) of the isolates, this pathogenicity island was found on all human extra-intestinal (n = 2) and pork isolates (n = 7).
Of the 67 S. Typhimurium isolates, 59 were found to harbor at least one plasmid, and the highest detection was found for IncFIB(S) (28/67, 41.8%), IncFII(S) (28/67, 41.8%) and IncQ1 (19/67, 28.4%) (Figure 2B). Comparison of the ST19 and ST36 isolates revealed a significant higher occurrence of IncFIB(S) (Chi-square test, adjusted p-value < 0.05) and IncFII(S) (Chi-square test, adjusted p-value < 0.05) in ST19 isolates, while Col156 (Chi-square test, adjusted p-value < 0.05) was significantly more prevalent in ST36 isolates (Figure 2B and Figure S1). Clustering analysis based on the plasmid profiles exhibited a distinctive sequence type-specific pattern (Figure 2C). The most common plasmid profiles, IncFIB(S)-IncFII(S) (12/67, 17.9%) and IncQ1-IncFIB(S)-IncFII(S) (10/67, 14.9%), were found uniquely in the ST19 isolates (Figure 2C).

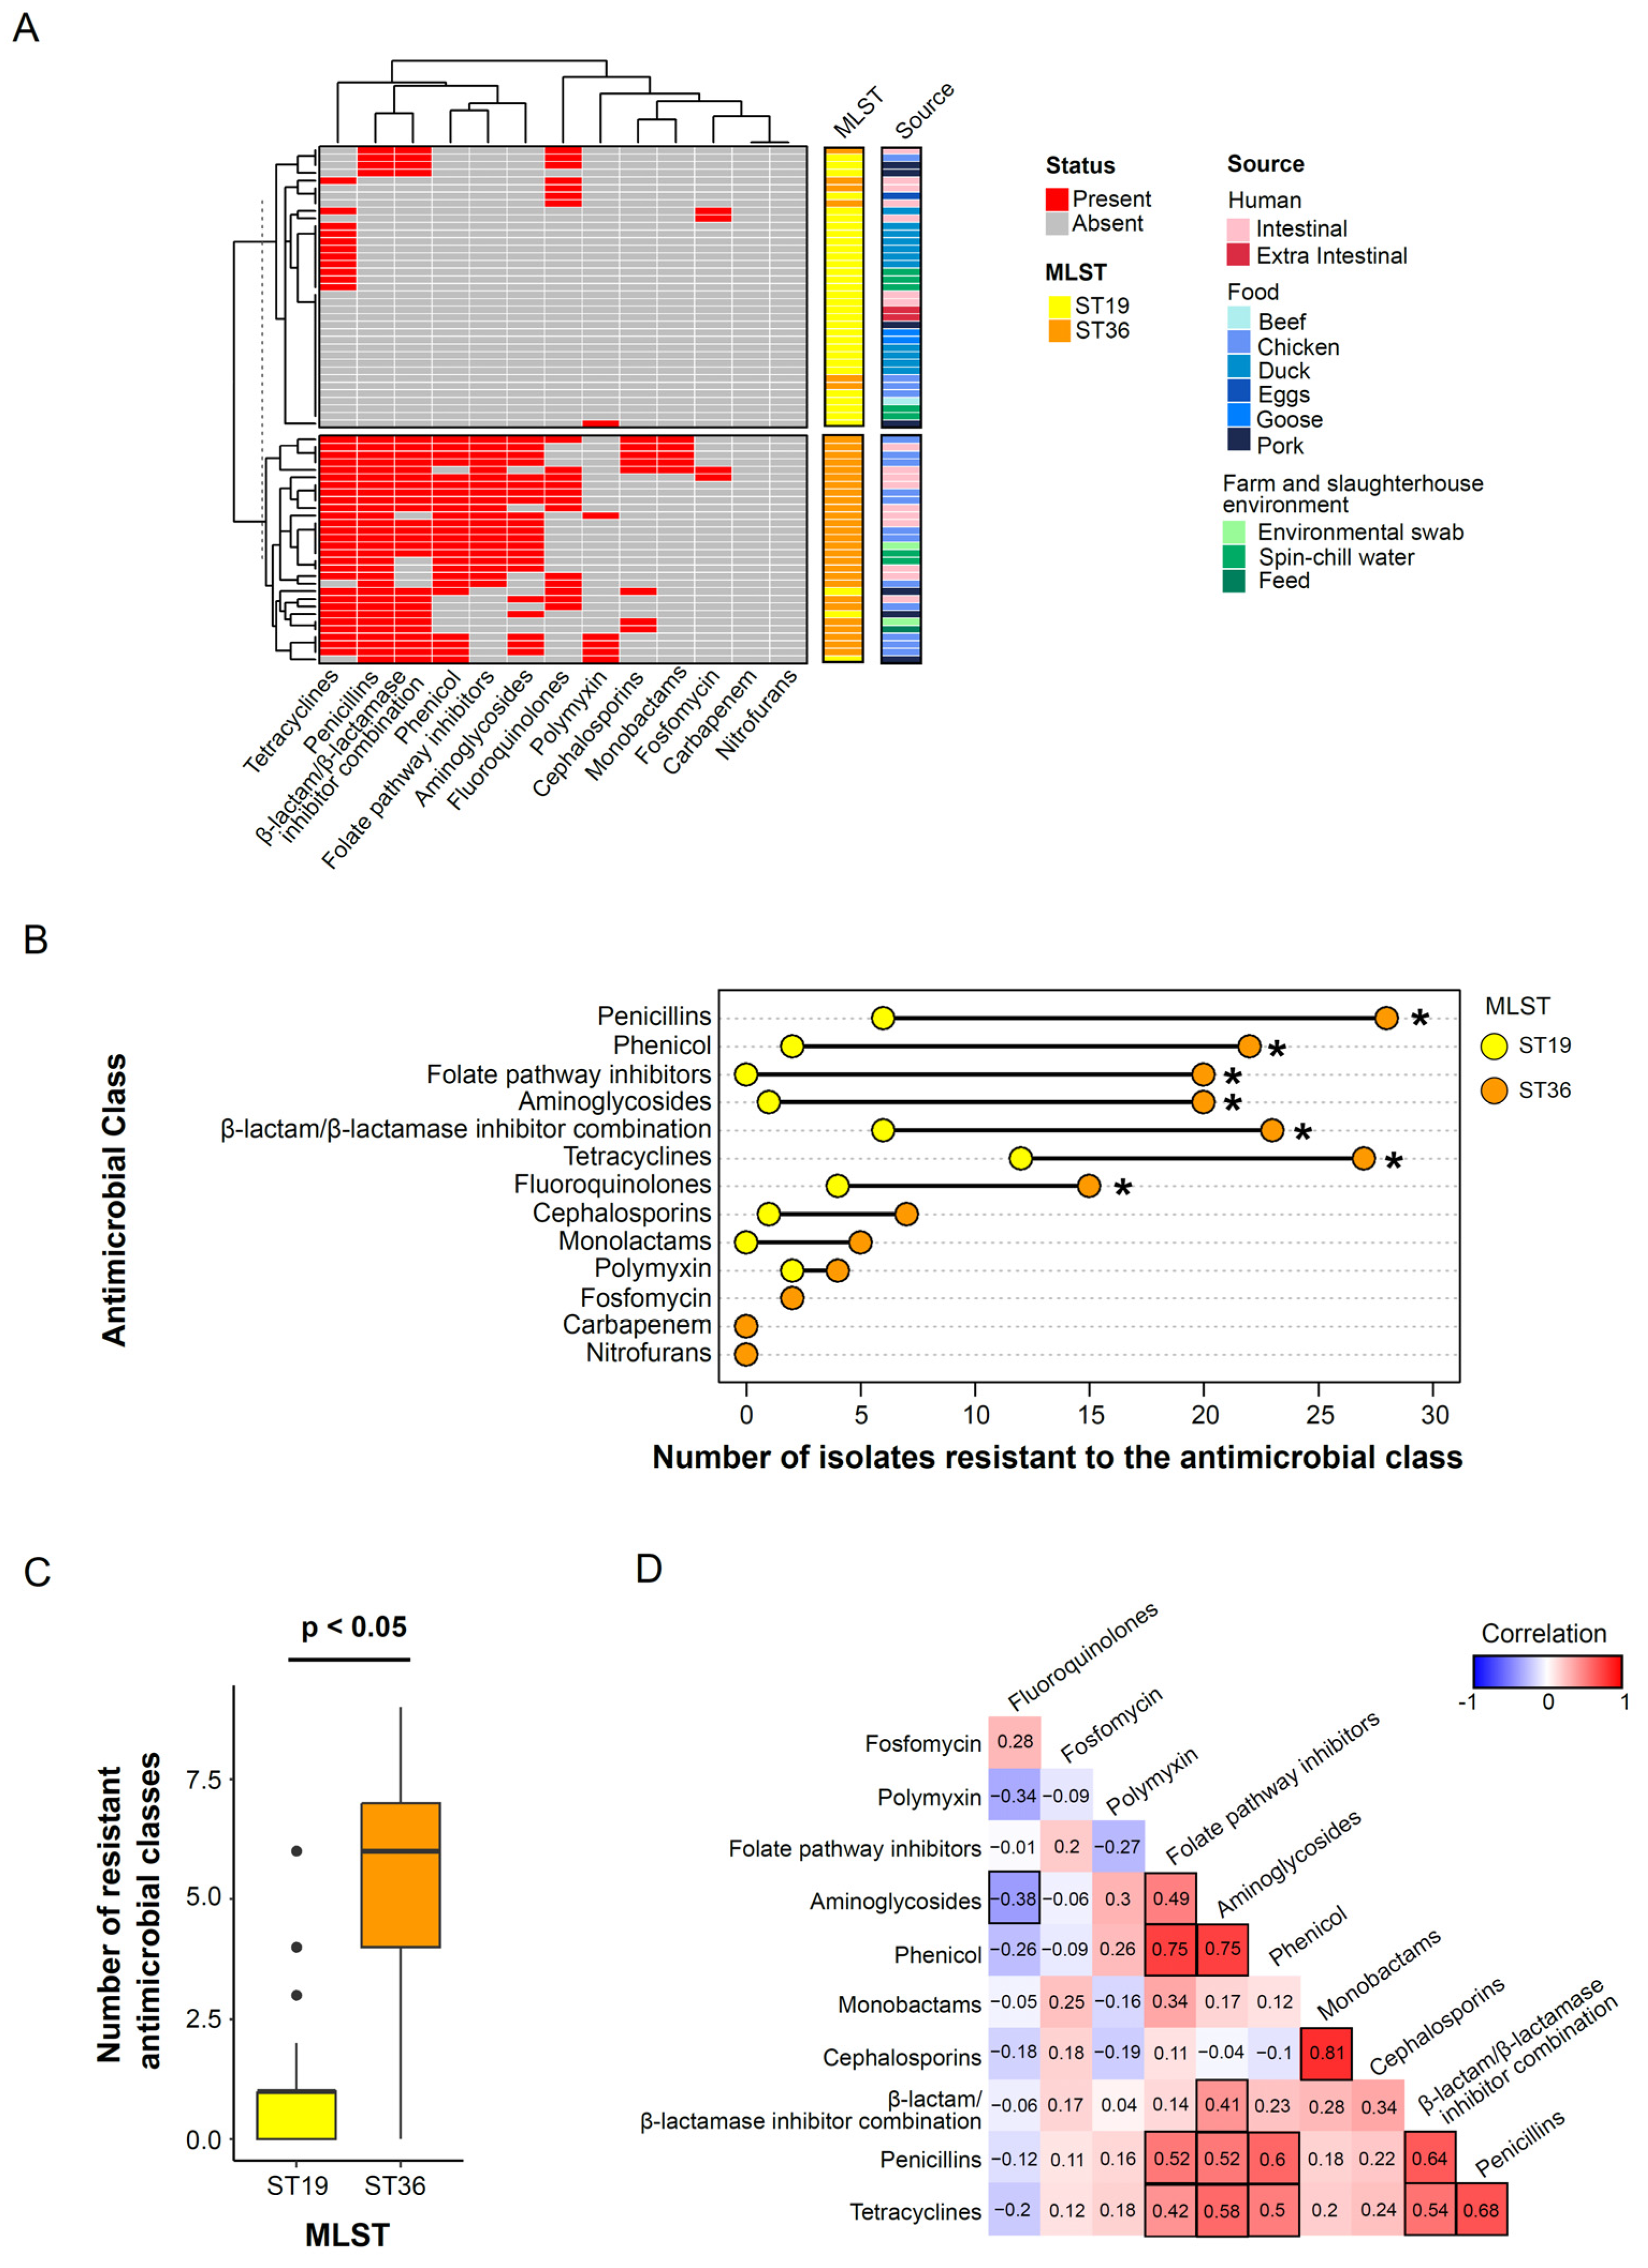
3.3. Sequence Type Associated Patterns in Phenotypic Antimicrobial Resistance Profile

Phenotypic antimicrobial resistance to at least one tested antimicrobial class was observed in 74.6% (50/67) of the S. Typhimurium isolates. All the isolates were susceptible to antimicrobial classes nitrofurans and carbapenem (Figure 3A). Six isolates (6/67, 14.9%), comprising two ST19 pork isolates, three ST36 chicken isolates and one ST36 human intestinal isolate, were phenotypically resistant to polymyxin (colistin) (Figure 3A). Notably, the only two human extraintestinal ST19 isolates included in the study were susceptible to all tested antimicrobial classes. The isolates were most predominantly resistant to β-lactam/β-lactamase inhibitor combination (ampicillin/sulbactam 43.3%), penicillin (ampicillin 50.7%, piperacillin 49.3%), tetracyclines (minocycline 35.8%, tetracycline 53.7%), phenicol (chloramphenicol 35.8%) and aminoglycosides (tobramycin 31.3%, gentamicin 29.9%). It is noteworthy that a substantial proportion of the observed antimicrobial resistance was attributed to ST36 isolates, which exhibited significantly higher resistance than ST19 isolates across a spectrum of antimicrobial classes, including penicillin (Chi-square test, adjusted p-value < 0.05,), phenicol (Chi-square test, adjusted p-value < 0.05), folate pathway inhibitors (Chi-square test, adjusted p-value < 0.05), aminoglycosides (Chi-square test, adjusted p-value < 0.05), β-lactam/β-lactamase inhibitor combination (Chi-square test, adjusted p-value < 0.05), tetracyclines (Chi-square test, adjusted p-value < 0.05) and fluoroquinolones (Chi-square test, adjusted p-value < 0.05) (Figure 3B). The number of multidrug-resistant (resistant to ≥three antibiotic classes) ST36 isolates was also significantly higher than those of ST19 isolates (Mann–Whitney U-test, p-value < 0.05) (Figure 3C).
To elucidate the correlation patterns of the antimicrobial classes, we constructed a pairwise correlation coefficient matrix for the analyzed antimicrobial classes within the ST36 S. Typhimurium isolates (Figure 3D). Corresponding analysis of antimicrobial resistance correlations was not performed for ST19 isolates due to the low antimicrobial resistance observed in this group. A high correlation coefficient exceeding 0.7 was obtained between phenicol and aminoglycosides (R = 0.75, p-value < 0.05), phenicol and folate pathway inhibitors (R = 0.75, p-value < 0.05), as well as cephalosporins and monobactams (R = 0.81, p-value < 0.05), implying a high probability of co-occurrence. Because of the relatively strong correlation between penicillin and tetracyclines (R = 0.68, p-value < 0.05), both displayed a similar notable correlation with antimicrobial classes including folate pathway inhibitors, aminoglycosides, phenicol and β-lactam/β-lactamase inhibitor combination. In fact, as many as 39.4% (13/33) of the ST36 isolates were phenotypically resistant in all the six antimicrobial classes (penicillin, tetracyclines, folate pathway inhibitors, aminoglycosides, phenicol and β-lactam/β-lactamase inhibitor combination) (Figure 3A). Among all pairwise comparisons, only aminoglycosides and fluoroquinolones were significantly negatively correlated (R = −0.38, p-value = 0.03).

3.4. Characterization of Antimicrobial Resistance Genes and Their Concordance with Phenotypic Antimicrobial Resistance Profiles

Consistent to phenotypic antimicrobial resistance profile, the number of detected antimicrobial resistance genes was significantly higher in ST36 than ST19 (Mann–Whitney U-test, p-value < 0.05) isolates (Figure 4A). Further analysis of the antimicrobial resistance gene profiles revealed significant differences between the ST19 and ST36 isolates (test, p-value < 0.05) (Figure 4B).
All 67 analyzed isolates were found to carry at least one antimicrobial resistance gene. The aac6-laa gene was present in all isolates, while other frequently encountered genes included those from aminoglycosides (aadA, strA, strB), β-lactam (TEM-1D), trimethoprim/sulfamethoxazole (sulI, sulII, sulIII and dfrA). Notably, a colistin resistance gene, mcr1, was identified in three ST36 chicken isolates, which was also phenotypically resistant to colistin. In alignment with phenotypic findings, significantly higher rates of antimicrobial resistance gene detection were found in the ST36 isolates (compared to ST19 isolates), including aac3-Iva (Chi-square test, adjusted p-value < 0.05), aph4-Ia (Chi-square test, adjusted p-value < 0.05), TEM-1D (Chi-square test, adjusted p-value < 0.05, adjusted), cmlA (Chi-square test, adjusted p-value < 0.05), floR (Chi-square test, adjusted p-value = 1.31 × 10⁻²,), dfrA (Chi-square test, adjusted p-value < 0.05), sulIII (Chi-square test, adjusted p-value < 0.05) and sulI (Chi-square test, adjusted p-value < 0.05). Importantly, the significantly higher levels of antimicrobial resistance gene detection in ST36 isolates were consistent with the antimicrobial susceptibility testing results of the corresponding antimicrobial class obtained previously (Figure 3A).
Given the significantly higher detection of antimicrobial resistance genes in ST36 isolates, we set out to understand the correlation of antimicrobial resistance genes and identify multidrug resistance patterns by constructing a co-occurrence network using ST36 isolates. This network was built based on pairs of antimicrobial resistance genes exhibiting a significant correlation (p-value < 0.05) and having correlation coefficients greater than 0.7 or less than −0.7. A total of 37 gene pairs belonging to different antimicrobial classes were identified in our analysis (Figure 4D). Notably, antimicrobial resistance genes aacAad, qnr-A, catBx, arr, sulIII, tetD and OXA-1 stood out with the highest count of significant correlations within this list. Positive correlations dominate among all gene pairs, except for the qnr-S gene, which exhibited negative correlations with aac3-Iva (R = −0.7) and Aph4-Ia (R = −0.7). This negative correlation was consistent with the findings of the phenotypic co-occurrence antimicrobial resistance analysis (Figure 3C).

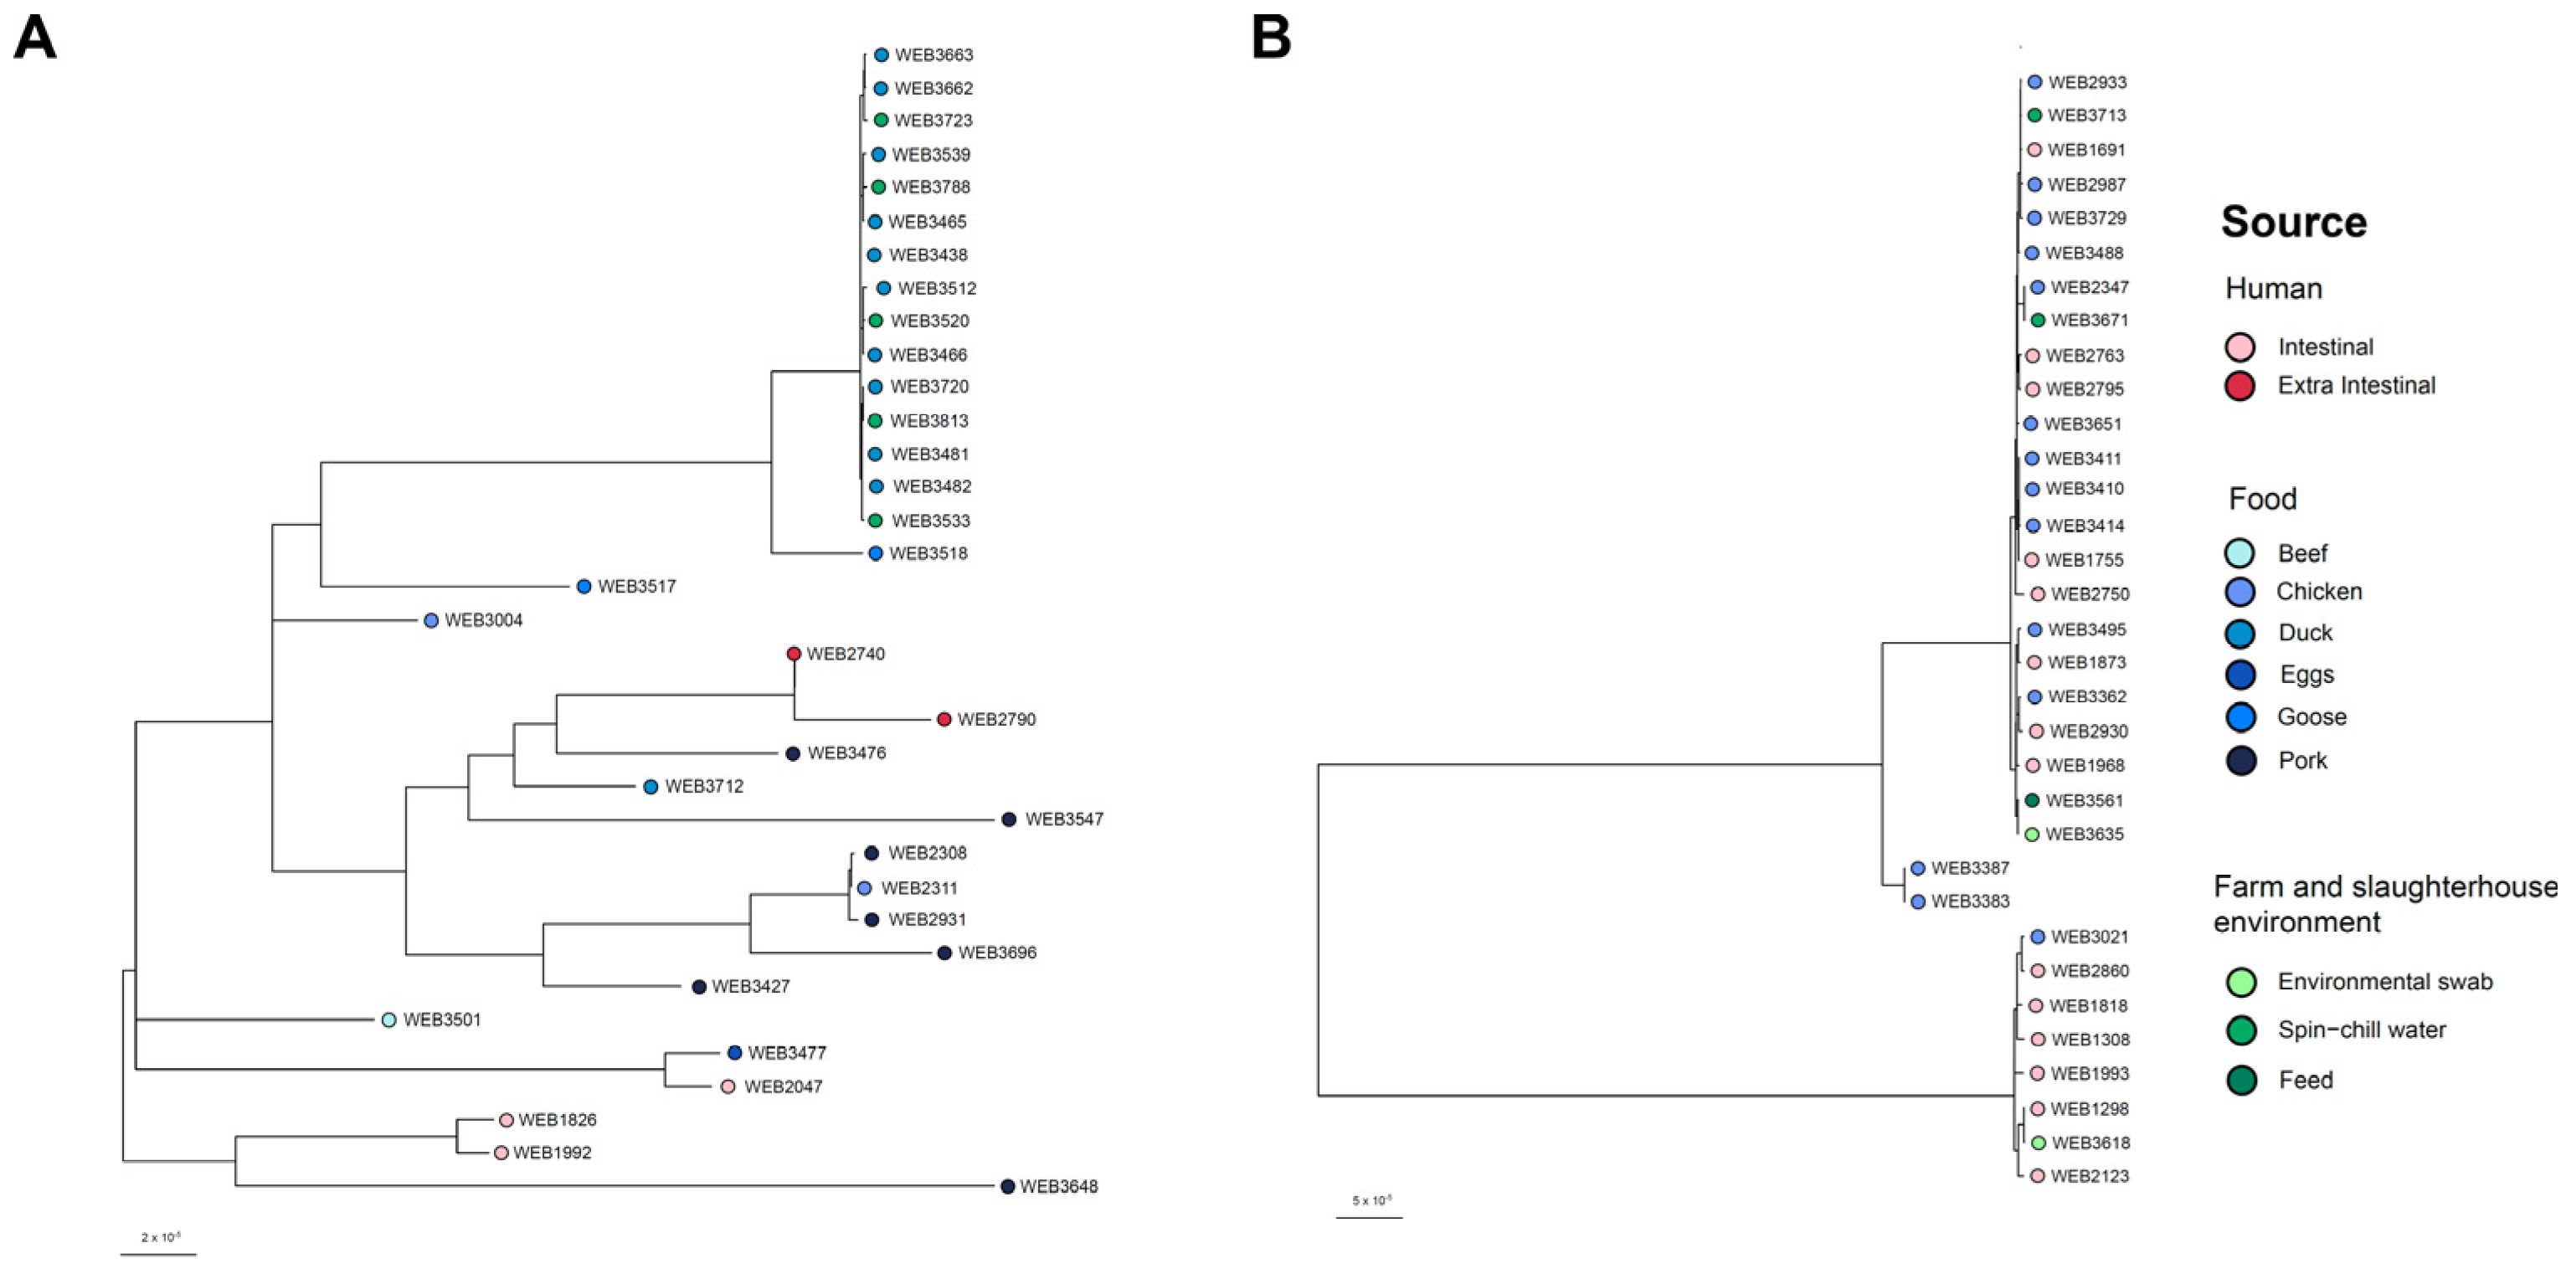
3.5. Phylogeny of the S. Typhimurium Isolates

Phylogenetic analysis using core-genome SNPs revealed two well-defined clades, which was distinctively separated isolates of the same sequence type (Figure S2). The ST19 duck isolates formed a cluster with the spin-chill water isolates (0 to 244 SNPs difference), which were in a separate cluster with the human isolates (Figure 5A). In this cluster, 57% (68/120) of the pairwise analysis were within 10 SNPs difference. The ST36 isolates were grouped into two clusters (Figure 5B). One cluster was predominantly composed of human intestinal isolates along with one chicken isolate and one slaughterhouse environment isolate (4 to 351 SNPs difference). The other cluster comprised eight human isolates showing close genetic relatedness with 13 of the chicken isolates and four isolates from the farm and slaughterhouse environment (2 to 495 SNPs difference). Here, only eight out of 224 pairwise analysis were within a 10 SNPs difference with three of them belonging to the human–chicken comparison.

4. Discussion

In this study, we characterized 67 locally collected S. Typhimurium isolates, which belonged to either ST19 or ST36 (Figure 1). Despite limited sequence type diversity within each food type, the sequence types tended to be associated with food categories. All isolates sourced from ducks, geese, pork, beef, and eggs belonged to ST36, whereas most of the chicken isolates (87.5% (14/16)) were from ST19. Interestingly, most of the human intestinal isolates (14/17) also belonged to ST19, mirroring the predominant sequence type found in chicken isolates. The findings emphasize the need for the enhanced surveillance of chicken meat and their products along the food chain. Furthermore, the results also highlight the importance of implementing appropriate food handling and preparation methods for the prevention of potential Salmonella contamination to safeguard public health.
ST19 has been widely recognized as the predominant sequence type within S. Typhimurium worldwide [38]. According to the data obtained from the EntroBase database (http://enterobase.warwick.ac.uk, accessed on 13 August 2023), ST19 and ST36 constitute 66.4% and 3.8%, respectively, of the S. Typhimurium entries [39]. Although this dataset might not mirror the real-time distribution of sequence types due to its reliance on available SRA data at time of access and the user voluntary upload of data, it provides a useful estimate of the relative prevalence among sequence types. In contrast, our study demonstrates an approximately equal proportion of ST19 and ST36 among S. Typhimurium isolates, which deviates from the proportions reported in the EntroBase database. In addition to the limited sample size in our study, which may not be fully representative of the S. Typhimurium landscape, the observed phenomenon could be linked to the food consumption profile in Singapore. We observed a high prevalence of ST36 in chicken, which is the most consumed meat in Singapore [11]. In fact, our results showed that most of the human isolates in this study predominantly (14/19) belonged to ST36. The risk of Salmonella contamination in food and subsequent infections might also be exacerbated by certain food preparation methods in local cuisine, which tend to involve undercooking chicken for a desired meat texture. Notably, other studies have indicated a convergence or replacement of prevalence between ST19 and other sequence types. For instance, in China, ST34 has gained prominence as one of the most frequent genotypes in clinical samples from patients with diarrhea, making it one of the two sequence types with the highest prevalence alongside ST19 [40]. Similarly, in Mexico, ST213 is replacing ST19 as the most frequently encountered sequence type in both clinical and animal food samples [41]. Changes in the sequence type distribution in different geographical regions may change the local and global epidemiology of sequence type prevalence, and potentially even the emergence of new types that hold considerable epidemiological and public health significance, as they could lead to variations in characteristics, including disease severity, transmission dynamics and treatment strategies.
Adding onto the aforementioned areas of changes in sequence type prevalence trends and the possible emergence of new sequence types with more virulent characteristics, the presence and spread of these multidrug-resistant strains could further limit the available therapeutic options [25]. A study was conducted recently to understand the global burden of antimicrobial resistance by examining 23 pathogens and 88 pathogen–drug combinations across 204 countries and territories. This study estimated that globally in 2019, a median of 1.27 million deaths (with a 95% uncertainty interval of 0.911–1.71 million) was directly attributed to resistance, and 4.95 million deaths (3.62–6.57 million) were associated with bacterial antimicrobial resistance [42]. Additionally, the loss of capital stemming from antimicrobial resistance is projected to range from USD 300 billion to USD 1 trillion worldwide by the year 2050 [43].
Six of the isolates exhibited phenotypic antimicrobial resistance to colistin, including three ST36 chicken isolates harboring the mcr1 gene (Figure 4C). Additionally, these three isolates also carried the plasmid lncX4 (Figure 2C), which is associated with the dissemination of mcr1 gene in Enterobacterales [44]. The presence of the mcr1 gene has also been reported in other S. Typhimurium studies involving clinical samples [45], pork offal [46], and an ST19 isolate recovered from a healthy pig in South Korea [47]. As colistin is considered as one of the last-resort drugs, the emergence of resistance to this antibiotic raises concerns for public health.
A high rate of tetracyclines resistance was observed among the ST36 isolates (Figure 3A). Additionally, 35.3% (12/34) of the ST19 isolates carried phenotypic resistance to tetracyclines, which is a rate significantly higher when compared to isolates of the same sequence type. Consistent with our observations, high resistance against tetracyclines has also been reported in other studies [20,26]. These findings warrant attention due to the widespread use of tetracyclines in both human healthcare and animal husbandry. This is attributed to their extensive antibacterial effectiveness, economical production, and absence of severe adverse effects [48,49]. Taken together, this emphasizes the critical importance of close surveillance of the usage and antimicrobial resistance trend for these antibiotics.
Through whole-genome sequencing, we were able to perform SNP-based phylogenetic analysis to achieve higher resolution, providing greater granularity in differentiating isolates of the same sequence type into groups of by their genetic relatedness. The close phylogeny of the clinical, chicken and farm and slaughterhouse environment ST36 isolates (Figure 5B) suggest the possibilities of common chains of transmission and zoonotic transmission. The phylogenetic analysis revealed genetically similar isolates across different sources, suggesting ongoing local transmission events, although the direction of transmission remains to be elucidated. Additionally, the genomic findings presented suggest that chicken meat may play a significant role in the epidemiology of S. Typhimurium in Singapore. Taken together, these findings highlight the importance of adopting a One Health approach in developing effective control strategies to reduce S. Typhimurium transmission.
Our study is, however, limited by the number of isolates analyzed. A more comprehensive analysis could be achieved by incorporating more isolates over an extended research period. Additionally, including human isolates and data from sporadic cases and outbreaks would contribute to a more robust understanding of the epidemiology of salmonellosis.

5. Conclusions

S. Typhimurium is one of the most widespread Salmonella serovars reported globally. This study characterized 67 isolates from human, food, and farm and slaughterhouse environments in Singapore, identifying two predominant sequence types, ST19 and ST36. The isolates of each sequence type exhibited distinct plasmid and antimicrobial resistance profiles. Furthermore, phylogenetic analysis revealed a close genetic relationship between the isolates from human and chicken and farm and slaughterhouse environments, implying possible transmission routes. These findings underscore the importance of integrated surveillance efforts across One Health sectors for gaining comprehensive epidemiological insights to inform food safety and public health measures.

Supplementary Materials

The following supporting information can be downloaded at https://www.mdpi.com/article/10.3390/microorganisms12091912/s1, Figure S1: Proportion of ST19 and ST36 isolates with detection of each plasmid; Figure S2: Phylogenetic relationship of S. Typhimurium isolates.

Author Contributions

Conceptualization, K.T.A.; methodology, K.T.A., Y.C.L., J.Q.L. and S.L.C.; formal analysis, K.T.A., Y.C.L., J.Q.L. and S.L.C.; investigation, K.T.A., Y.C.L. and S.L.C.; resources, L.K.T., W.K.W., M.M., T.B. and T.H.K.; data curation, K.T.A., Y.C.L., W.C.K., K.H.O. and S.L.C.; writing—original draft preparation, K.T.A. and Y.C.L.; writing—review and editing, K.T.A., Y.C.L., F.Y.X.C., J.Q.L., L.K.T., S.L.C., W.K.W., M.M., T.B., T.H.K., J.K. and J.S.H.C.; visualization, Y.C.L. and J.Q.L.; supervision, K.T.A.; funding acquisition, K.T.A. All authors have read and agreed to the published version of the manuscript.

Funding

This study was supported by the Singapore Food Agency, and the National Environment Agency, Singapore.

Data Availability Statement

The original data presented in the study are openly available in SRA database under Bioproject accession number PRJNA1160349.

Conflicts of Interest

The authors declare no conflicts of interest.

References

  1. Eng, S.-K.; Pusparajah, P.; Ab Mutalib, N.-S.; Ser, H.-L.; Chan, K.-G.; Lee, L.-H. Salmonella: A review on pathogenesis, epidemiology and antibiotic resistance. Front. Life Sci. 2015, 8, 284–293. [Google Scholar] [CrossRef]
  2. Abebe, E.; Gugsa, G.; Ahmed, M. Review on Major Food-Borne Zoonotic Bacterial Pathogens. J. Trop. Med. 2020, 2020, 4674235. [Google Scholar] [CrossRef] [PubMed]
  3. Heredia, N.; García, S. Animals as sources of food-borne pathogens: A review. Anim. Nutr. 2018, 4, 250–255. [Google Scholar] [CrossRef] [PubMed]
  4. Andino, A.; Hanning, I. Salmonella enterica: Survival, colonization, and virulence differences among serovars. Sci. World J. 2015, 2015, 520179. [Google Scholar] [CrossRef] [PubMed]
  5. Hoelzer, K.; Moreno Switt, A.I.; Wiedmann, M. Animal contact as a source of human non-typhoidal salmonellosis. Vet. Res. 2011, 42, 34. [Google Scholar] [CrossRef]
  6. Rodriguez, A.; Pangloli, P.; Richards, H.A.; Mount, J.R.; Draughon, F.A. Prevalence of Salmonella in diverse environmental farm samples. J. Food Prot. 2006, 69, 2576–2580. [Google Scholar] [CrossRef]
  7. Sanchez, S.; Hofacre, C.L.; Lee, M.D.; Maurer, J.J.; Doyle, M.P. Animal sources of salmonellosis in humans. J. Am. Vet. Med. Assoc. 2002, 221, 492–497. [Google Scholar] [CrossRef]
  8. Thai, T.H.; Hirai, T.; Lan, N.T.; Shimada, A.; Ngoc, P.T.; Yamaguchi, R. Antimicrobial Resistance of Salmonella Serovars Isolated from Beef at Retail Markets in the North Vietnam. J. Vet. Med. Sci. 2012, 74, 1163–1169. [Google Scholar] [CrossRef]
  9. Ehuwa, O.; Jaiswal, A.K.; Jaiswal, S. Salmonella, Food Safety and Food Handling Practices. Foods 2021, 10, 907. [Google Scholar] [CrossRef]
  10. Ejo, M.; Garedew, L.; Alebachew, Z.; Worku, W. Prevalence and Antimicrobial Resistance of Salmonella Isolated from Animal-Origin Food Items in Gondar, Ethiopia. Biomed. Res. Int. 2016, 2016, 4290506. [Google Scholar] [CrossRef]
  11. Aung, K.T.; Khor, W.C.; Octavia, S.; Ye, A.; Leo, J.; Chan, P.P.; Lim, G.; Wong, W.K.; Tan, B.Z.Y.; Schlundt, J.; et al. Distribution of Salmonella Serovars in Humans, Foods, Farm Animals and Environment, Companion and Wildlife Animals in Singapore. Int. J. Environ. Res. Public Health 2020, 17, 5774. [Google Scholar] [CrossRef] [PubMed]
  12. Tadesse, G.; Tessema, T.S. A meta-analysis of the prevalence of Salmonella in food animals in Ethiopia. BMC Microbiol. 2014, 14, 270. [Google Scholar] [CrossRef] [PubMed]
  13. Xiang, Y.; Zhu, K.; Min, K.; Zhang, Y.; Liu, J.; Liu, K.; Han, Y.; Li, X.; Du, X.; Wang, X.; et al. Characterization of a Salmonella enterica serovar Typhimurium lineage with rough colony morphology and multidrug resistance. Nat. Commun. 2024, 15, 6123. [Google Scholar] [CrossRef] [PubMed]
  14. Won, G.; Lee, J.H. Salmonella Typhimurium, the major causative agent of foodborne illness inactivated by a phage lysis system provides effective protection against lethal challenge by induction of robust cell-mediated immune responses and activation of dendritic cells. Vet. Res. 2017, 48, 66. [Google Scholar] [CrossRef] [PubMed]
  15. Chaudhuri, D.; Roy Chowdhury, A.; Biswas, B.; Chakravortty, D. Salmonella Typhimurium Infection Leads to Colonization of the Mouse Brain and Is Not Completely Cured with Antibiotics. Front. Microbiol. 2018, 9, 1632. [Google Scholar] [CrossRef] [PubMed]
  16. Kariuki, S.; Revathi, G.; Kariuki, N.; Kiiru, J.; Mwituria, J.; Muyodi, J.; Githinji, J.W.; Kagendo, D.; Munyalo, A.; Hart, C.A. Invasive multidrug-resistant non-typhoidal Salmonella infections in Africa: Zoonotic or anthroponotic transmission? J. Med. Microbiol. 2006, 55, 585–591. [Google Scholar] [CrossRef]
  17. Jain, P.; Sudhanthirakodi, S.; Chowdhury, G.; Joshi, S.; Anandan, S.; Ray, U.; Mukhopadhyay, A.; Dutta, S. Antimicrobial resistance, plasmid, virulence, multilocus sequence typing and pulsed-field gel electrophoresis profiles of Salmonella enterica serovar Typhimurium clinical and environmental isolates from India. PLoS ONE 2018, 13, e0207954. [Google Scholar] [CrossRef]
  18. Samreen; Ahmad, I.; Malak, H.A.; Abulreesh, H.H. Environmental antimicrobial resistance and its drivers: A potential threat to public health. J. Glob. Antimicrob. Resist. 2021, 27, 101–111. [Google Scholar] [CrossRef]
  19. Holmes, A.H.; Moore, L.S.; Sundsfjord, A.; Steinbakk, M.; Regmi, S.; Karkey, A.; Guerin, P.J.; Piddock, L.J. Understanding the mechanisms and drivers of antimicrobial resistance. Lancet 2016, 387, 176–187. [Google Scholar] [CrossRef]
  20. Mellor, K.C.; Petrovska, L.; Thomson, N.R.; Harris, K.; Reid, S.W.J.; Mather, A.E. Antimicrobial Resistance Diversity Suggestive of Distinct Salmonella Typhimurium Sources or Selective Pressures in Food-Production Animals. Front. Microbiol. 2019, 10, 708. [Google Scholar] [CrossRef]
  21. Helms, M.; Vastrup, P.; Gerner-Smidt, P.; Mølbak, K. Excess mortality associated with antimicrobial drug-resistant Salmonella typhimurium. Emerg. Infect. Dis. 2002, 8, 490–495. [Google Scholar] [CrossRef] [PubMed]
  22. Depuydt, P.O.; Vandijck, D.M.; Bekaert, M.A.; Decruyenaere, J.M.; Blot, S.I.; Vogelaers, D.P.; Benoit, D.D. Determinants and impact of multidrug antibiotic resistance in pathogens causing ventilator-associated-pneumonia. Crit. Care 2008, 12, R142. [Google Scholar] [CrossRef] [PubMed]
  23. Yang, X.; Huang, J.; Zhang, Y.; Liu, S.; Chen, L.; Xiao, C.; Zeng, H.; Wei, X.; Gu, Q.; Li, Y.; et al. Prevalence, abundance, serovars and antimicrobial resistance of Salmonella isolated from retail raw poultry meat in China. Sci. Total Environ. 2020, 713, 136385. [Google Scholar] [CrossRef] [PubMed]
  24. Prendergast, D.M.; O’Grady, D.; Fanning, S.; Cormican, M.; Delappe, N.; Egan, J.; Mannion, C.; Fanning, J.; Gutierrez, M. Application of multiple locus variable number of tandem repeat analysis (MLVA), phage typing and antimicrobial susceptibility testing to subtype Salmonella enterica serovar Typhimurium isolated from pig farms, pork slaughterhouses and meat producing plants in Ireland. Food Microbiol. 2011, 28, 1087–1094. [Google Scholar] [CrossRef] [PubMed]
  25. Ngoi, S.T.; Lindstedt, B.A.; Watanabe, H.; Thong, K.L. Molecular Characterization of Salmonella enterica Serovar Typhimurium Isolated from Human, Food, and Animal Sources in Malaysia. Jpn. J. Infect. Dis. 2013, 66, 180–188. [Google Scholar] [CrossRef]
  26. Aung, K.T.; Khor, W.C.; Ong, K.H.; Tan, W.L.; Wong, Z.N.; Oh, J.Q.; Wong, W.K.; Tan, B.Z.Y.; Maiwald, M.; Tee, N.W.S.; et al. Characterisation of Salmonella Enteritidis ST11 and ST1925 Associated with Human Intestinal and Extra-Intestinal Infections in Singapore. Int. J. Environ. Res. Public Health 2022, 19, 5671. [Google Scholar] [CrossRef]
  27. Zhang, S.; Yin, Y.; Jones, M.B.; Zhang, Z.; Deatherage Kaiser, B.L.; Dinsmore, B.A.; Fitzgerald, C.; Fields, P.I.; Deng, X. Salmonella serotype determination utilizing high-throughput genome sequencing data. J. Clin. Microbiol. 2015, 53, 1685–1692. [Google Scholar] [CrossRef]
  28. Inouye, M.; Dashnow, H.; Raven, L.A.; Schultz, M.B.; Pope, B.J.; Tomita, T.; Zobel, J.; Holt, K.E. SRST2: Rapid genomic surveillance for public health and hospital microbiology labs. Genome Med. 2014, 6, 90. [Google Scholar] [CrossRef]
  29. Gupta, S.K.; Padmanabhan, B.R.; Diene, S.M.; Lopez-Rojas, R.; Kempf, M.; Landraud, L.; Rolain, J.M. ARG-ANNOT, a new bioinformatic tool to discover antibiotic resistance genes in bacterial genomes. Antimicrob. Agents Chemother. 2014, 58, 212–220. [Google Scholar] [CrossRef]
  30. Liu, B.; Zheng, D.; Jin, Q.; Chen, L.; Yang, J. VFDB 2019: A comparative pathogenomic platform with an interactive web interface. Nucleic Acids Res. 2019, 47, D687–D692. [Google Scholar] [CrossRef]
  31. Zerbino, D.R.; Birney, E. Velvet: Algorithms for de novo short read assembly using de Bruijn graphs. Genome Res. 2008, 18, 821–829. [Google Scholar] [CrossRef] [PubMed]
  32. Treangen, T.J.; Ondov, B.D.; Koren, S.; Phillippy, A.M. The Harvest suite for rapid core-genome alignment and visualization of thousands of intraspecific microbial genomes. Genome Biol. 2014, 15, 524. [Google Scholar] [CrossRef] [PubMed]
  33. Kurtz, S.; Phillippy, A.; Delcher, A.L.; Smoot, M.; Shumway, M.; Antonescu, C.; Salzberg, S.L. Versatile and open software for comparing large genomes. Genome Biol. 2004, 5, R12. [Google Scholar] [CrossRef] [PubMed]
  34. Dalmasso, C.; Broët, P.; Moreau, T. A simple procedure for estimating the false discovery rate. Bioinformatics 2005, 21, 660–668. [Google Scholar] [CrossRef] [PubMed]
  35. Gu, Z.; Eils, R.; Schlesner, M. Complex heatmaps reveal patterns and correlations in multidimensional genomic data. Bioinformatics 2016, 32, 2847–2849. [Google Scholar] [CrossRef]
  36. Walter, W.; Sánchez-Cabo, F.; Ricote, M. GOplot: An R package for visually combining expression data with functional analysis. Bioinformatics 2015, 31, 2912–2914. [Google Scholar] [CrossRef]
  37. Lex, A.; Gehlenborg, N.; Strobelt, H.; Vuillemot, R.; Pfister, H. UpSet: Visualization of Intersecting Sets. IEEE Trans. Vis. Comput. Graph. 2014, 20, 1983–1992. [Google Scholar] [CrossRef]
  38. Gómez-Baltazar, A.; Vázquez-Marrufo, G.; Astiazaran-Garcia, H.; Ochoa-Zarzosa, A.; Canett-Romero, R.; García-Galaz, A.; Torres-Vega, C.; Vázquez-Garcidueñas, M.S. Comparative virulence of the worldwide ST19 and emergent ST213 genotypes of Salmonella enterica serotype Typhimurium strains isolated from food. Microbes Infect. 2023, 25, 105019. [Google Scholar] [CrossRef]
  39. Zhou, Z.; Alikhan, N.F.; Mohamed, K.; Fan, Y.; Achtman, M. The EnteroBase user’s guide, with case studies on Salmonella transmissions, Yersinia pestis phylogeny, and Escherichia core genomic diversity. Genome Res. 2020, 30, 138–152. [Google Scholar] [CrossRef]
  40. Sun, J.; Ke, B.; Huang, Y.; He, D.; Li, X.; Liang, Z.; Ke, C. The molecular epidemiological characteristics and genetic diversity of Salmonella typhimurium in Guangdong, China, 2007–2011. PLoS ONE 2014, 9, e113145. [Google Scholar] [CrossRef]
  41. Wiesner, M.; Zaidi, M.B.; Calva, E.; Fernández-Mora, M.; Calva, J.J.; Silva, C. Association of virulence plasmid and antibiotic resistance determinants with chromosomal multilocus genotypes in Mexican Salmonella enterica serovar Typhimurium strains. BMC Microbiol. 2009, 9, 131. [Google Scholar] [CrossRef] [PubMed]
  42. Global burden of bacterial antimicrobial resistance in 2019: A systematic analysis. Lancet 2022, 399, 629–655. [CrossRef] [PubMed]
  43. Pulingam, T.; Parumasivam, T.; Gazzali, A.M.; Sulaiman, A.M.; Chee, J.Y.; Lakshmanan, M.; Chin, C.F.; Sudesh, K. Antimicrobial resistance: Prevalence, economic burden, mechanisms of resistance and strategies to overcome. Eur. J. Pharm. Sci. 2022, 170, 106103. [Google Scholar] [CrossRef]
  44. Sun, J.; Fang, L.X.; Wu, Z.; Deng, H.; Yang, R.S.; Li, X.P.; Li, S.M.; Liao, X.P.; Feng, Y.; Liu, Y.H. Genetic Analysis of the IncX4 Plasmids: Implications for a Unique Pattern in the mcr-1 Acquisition. Sci. Rep. 2017, 7, 424. [Google Scholar] [CrossRef] [PubMed]
  45. Lu, J.; Quan, J.; Zhao, D.; Wang, Y.; Yu, Y.; Zhu, J. Prevalence and molecular characteristics of mcr-1 gene in Salmonella typhimurium in a tertiary hospital of Zhejiang Province. Infect. Drug Resist. 2019, 12, 105–110. [Google Scholar] [CrossRef] [PubMed]
  46. Zhang, H.; Xiang, Y.; Huang, Y.; Liang, B.; Xu, X.; Xie, J.; Du, X.; Yang, C.; Liu, H.; Liu, H.; et al. Genetic Characterization of mcr-1-Positive Multidrug-Resistant Salmonella enterica Serotype Typhimurium Isolated from Intestinal Infection in Children and Pork Offal in China. Front. Microbiol. 2021, 12, 774797. [Google Scholar] [CrossRef]
  47. Moon, D.C.; Kim, S.J.; Mechesso, A.F.; Kang, H.Y.; Song, H.J.; Choi, J.H.; Yoon, S.S.; Lim, S.K. Mobile Colistin Resistance Gene mcr-1 Detected on an IncI2 Plasmid in Salmonella Typhimurium Sequence Type 19 from a Healthy Pig in South Korea. Microorganisms 2021, 9, 398. [Google Scholar] [CrossRef]
  48. Granados-Chinchilla, F.; Rodríguez, C. Tetracyclines in Food and Feedingstuffs: From Regulation to Analytical Methods, Bacterial Resistance, and Environmental and Health Implications. J. Anal. Methods Chem. 2017, 2017, 1315497. [Google Scholar] [CrossRef]
  49. Ma, Q.; Pei, Z.; Fang, Z.; Wang, H.; Zhu, J.; Lee, Y.K.; Zhang, H.; Zhao, J.; Lu, W.; Chen, W. Evaluation of Tetracycline Resistance and Determination of the Tentative Microbiological Cutoff Values in Lactic Acid Bacterial Species. Microorganisms 2021, 9, 2128. [Google Scholar] [CrossRef]
Figure 1. Distribution of S. Typhimurium isolates included in the study by their sources and respective sequence types.
Microorganisms 12 01912 g001
Figure 2. SPI and plasmid profiling. (A) UpSet plot of the isolates with detect SPI. The stacked bar (top) shows the number of isolates with combinations of detected SPI represented by the matrix (bottom). The bar plots on the left indicate the number of isolates with the detection of specific SPI. (B) Chord diagram depicting the detection of the specific plasmid (right) for each isolate (left). (C) Plasmids profile of the S. Typhimurium isolates.
Microorganisms 12 01912 g002
Figure 3. Phenotypic antimicrobial resistance profiling. (A) Clustering profile of phenotypic antimicrobial resistance in S. Typhimurium isolates. (B) Phenotypic antimicrobial resistance in ST19 and ST36 isolates. * Denotes adjusted p-value < 0.05, Chi-square test. (C) Distribution of the number of resistant antimicrobial classes in ST19 and ST36 isolates. Mann–Whitney U-test p-value < 0.05. (D) Correlations of phenotypic antimicrobial resistance classes in ST36 isolates. Correlations with p-value < 0.05 have been bordered in black.
Microorganisms 12 01912 g003
Figure 4. Phenotypic antimicrobial resistance profiling. (A) Distribution of the number of detected antimicrobial genes in ST19 and ST36 isolates. * Denotes adjusted p-value < 0.05, Mann–Whitney U-test. (B) Non-metric multidimensional scaling (NMDS) was performed with the presence and absence status of the antimicrobial genes from all 67 S. Typhimurium isolates. Each isolate is represented by a point and colored according to its sequence type. (C) Clustering profile of genotypic antimicrobial resistance in S. Typhimurium isolates. (D) Correlation networks of the antimicrobial genes were constructed using the presence and absence status of the antimicrobial genes from all 67 S. Typhimurium isolates. Each node represents a gene and is colored according to its corresponding antimicrobial class. The edges represent the correlation coefficient and are colored based on the strength of the correlation. * Denotes a negative correlation coefficient.
Microorganisms 12 01912 g004
Figure 5. Phylogenetic relationship of S. Typhimurium isolates for (A) ST19 and (B) ST36. Each isolate is represented by a node and colored by the source of origin.
Microorganisms 12 01912 g005
Disclaimer/Publisher’s Note: The statements, opinions and data contained in all publications are solely those of the individual author(s) and contributor(s) and not of MDPI and/or the editor(s). MDPI and/or the editor(s) disclaim responsibility for any injury to people or property resulting from any ideas, methods, instructions or products referred to in the content.

