Article

Changes in Cyanobacterial Phytoplankton Communities in Lake-Water Mesocosms Treated with Either Glucose or Hydrogen Peroxide

by
David Linz
1,
Charlyn G. Partridge
2,
Michael C. Hassett
2,
Nathan Sienkiewicz
3,
Katie Tyrrell
2,
Aimèe Henderson
3,
Renee Tardani
2,
Jingrang Lu
3,
Alan D. Steinman
2 and
Stephen Vesper
3,*
1
Oak Ridge Institute for Science and Education, Oak Ridge, TN 37831, USA
2
Annis Water Resources Institute, Graduate School, Grand Valley State University, Allendale, MI 49441, USA
3
United States Environmental Protection Agency, Cincinnati, OH 45268, USA
*
Author to whom correspondence should be addressed.
Microorganisms 2024, 12(9), 1925; https://doi.org/10.3390/microorganisms12091925
Submission received: 3 September 2024 / Revised: 20 September 2024 / Accepted: 20 September 2024 / Published: 22 September 2024
(This article belongs to the Special Issue Phytoplankton and Environment Interactions)

Abstract

:
When cyanobacterial phytoplankton form harmful cyanobacterial blooms (HCBs), the toxins they produce threaten freshwater ecosystems. Hydrogen peroxide is often used to control HCBs, but it is broadly toxic and dangerous to handle. Previously, we demonstrated that glucose addition to lake water could suppress the abundance of cyanobacteria. In this study, glucose was compared to hydrogen peroxide for the treatment of cyanobacterial phytoplankton communities. The six-week study was conducted in the large mesocosms facility at Grand Valley State University’s Annis Water Resources Institute in Michigan. To 1000 L of Muskegon Lake water, glucose was added at either 150 mg or 30 mg glucose/L. Hydrogen peroxide was added at 3 mg/L to two 1000 L mesocosms. And two mesocosms were left untreated as controls. Triplicate 100 mL samples were collected weekly from each mesocosm, which were then filtered and frozen at −80 °C for 16S rRNA amplicon sequencing. The 16S rRNA amplicon sequencing results revealed that hydrogen peroxide treatment quickly reduced the relative abundance of the cyanobacteria compared to the control mesocosms, but the cyanobacteria population returned over the course of the 6-week study. On the other hand, both glucose concentrations caused a rapid proliferation of multiple low abundance proteobacterial and bacteroidotal taxa resulting in notable increases in taxonomic richness over the duration of the study and reducing the relative abundance of cyanobacteria. Although hydrogen peroxide quickly suppressed the cyanobacteria, the population later returned to near starting levels. The glucose suppressed the cyanobacterial phytoplankton apparently by promoting competitive heterotrophic bacteria.

1. Introduction

Phytoplankton are the major primary producers in aquatic environments. Temperature, light variations, and the annual cycle of nutrient availability drive phytoplankton community dynamics [1]. The combination of eukaryotic algae, cyanobacteria, and heterotrophic bacteria forms the phycosphere [2]. The dynamics of the phycosphere are determined by the size and depth of a waterbody, its hydrology, nutrient concentrations and many other factors [3,4,5]. These natural cycles are now being disrupted by anthropogenic factors leading to harmful cyanobacterial blooms (HCBs), also called harmful algal blooms (HABs).
Blooms of cyanobacteria are occurring more frequently in freshwater [6]. Although cyanobacteria are a natural component of the freshwater ecosystem, the addition of excess nutrients in combination with climate change appears to be promoting HCBs [7]. The long-term solution to these blooms is to eliminate the excess nutrients and mitigate climate change. In the short term, methods are needed to treat the water to prevent blooms. Hydrogen peroxide is currently used to suppress cyanobacterial growth in freshwater [8,9]. As a possible alternative to hydrogen peroxide treatment, glucose was tested and found to suppress cyanobacteria in small mesocosms containing water from an Ohio lake [10,11]. In this study, large mesocosms filled with 1000 L of water from Muskegon Lake in Michigan (USA) were used to compare changes in the cyanobacterial community, after glucose or hydrogen peroxide treatments.

2. Material and Methods

2.1. Muskegon Lake and the AWRI Research Facility

Muskegon Lake is a mesotrophic, drowned river-mouth lake located on the west coast of Michigan’s lower peninsula. The lake has a long history of industrial activity on its shoreline, resulting in its designation as a Great Lakes Area of Concern [12]. The lake has a maximum depth of 24 m, a surface area of 16.8 km2, and an average hydraulic residence time of ~23 days; however, this can range from 14 to 70 days depending on the season [13,14]. The mesocosm facility at Grand Valley State University’s Annis Water Resources Institute (AWRI) on Muskegon Lake was utilized for this study.
The AWRI facility pumps Muskegon Lake water through a series of in-line filters (300 µm pore size) to a head tank, where it is gravity fed into each mesocosm tank. The 1325 L fiberglass mesocosm tanks are illuminated with 1000 W metal halide lamps suspended above each tank to provide full-spectrum photosynthetically active radiation (~300 µmol m2 s1) with a photoperiod of 16 h light (L)/8 h dark (D). Ambient light (mean = 55 µmol m2 s1) was also present for a 14 L:10 D period.

2.2. Experimental Design

On 14 August 2023, 1000 L of filtered Muskegon Lake water was added to six mesocosms. The water in the mesocosms was allowed to equilibrate overnight. On 15 August, two mesocosms were each treated with hydrogen peroxide at 3 mg/L and designated hydrogen peroxide mesocosms A and B. In addition, two mesocosms were treated with glucose, either at 150 mg/L, designated the glucose-high mesocosm, or at 30 mg/L, designated the glucose-low mesocosm. As controls, two of the mesocosms were left untreated and designated control mesocosms A and B. The water in each tank was hand-stirred daily with individual wooden dowels assigned to each mesocosm.

2.3. Mesocosm Sampling and Amplicon Sequencing

During the six-week experiment, triplicate 100 mL samples were obtained weekly from each mesocosm and filtered through Durapore polyvinylidene fluoride (PVDF) filters, with 0.45 μm pore size (MilliPore, Foster City, CA, USA). Each filter was inserted into a 2 mL Matrix Lysis-A tube (MP Biomedicals, LLC, Santa Ana, CA, USA) and 600 μL RLT plus buffer was added to each tube (QIAGEN, Valencia, CA, USA). The tubes were labeled and frozen at −80 °C until they were processed for high-throughput sequencing, as previously described [11].
Sequencing and library preparation were performed to target the 16S rRNA v3-4 region. The methods used were described by Bagley et al. [15] with the following modifications. The first round PCR was performed with 22 µL Accuprime pfx supermix (Thermo-Fisher, Waltham, MA, USA), 0.5 µL of each primer, and 2 µL of DNA. After gel confirmation of amplification products, PCR products were cleaned with 19 µL of AMPure XP beads (Beckman Coulter, Brea, CA, USA), added to 23 µL of the PCR products, and eluted in 35 µL of 10 mM Tris pH 8.5. PCR products were normalized to 5 ng/µL. An index PCR was performed using 22 µL Accuprime pfx supermix, 0.5 µL of 10 µM of each index primer, and the product was cleaned using 27.5 µL AMPure XP added to 25 µL of PCR product and eluted with 35 µL of 10 mM Tris pH 8.5. Samples were normalized to a concentration of 4 nM and 5 µL of each were combined to make the final library. The pooled library was sequenced using a 600 cycle V3 MiSeq sequencing kit (# MS-102-3003, Illumina, San Diego, CA, USA) according to manufacturer’s protocol, using 2 × 300 paired-end sequencing.

2.4. Amplicon Processing

Raw demultiplexed reads, with adapters removed, were processed using the software suite QIIME 2 2021.4.0 [16]. Raw sequence data were quality filtered, denoised, and cleared of chimeras with DADA2 (via q2-dada2) [17]. Taxonomy was assigned to amplicon sequence variants (ASVs) based on the Silva 138 SSU reference using the q2-feature-classifier [18] and the classify-sklearn naive Bayes taxonomy classifier [19,20]. Qiime2 artifacts were then moved to R v4.1.2 using the qiime2R package for further analysis [21].

2.5. Sequence Data Analysis

Analysis of the final sequence dataset was performed in R v4.1.2 [22] using the packages phyloseq (v1.38.0) [23], vegan (v2.5.7) [24] and visualized using ggplot2 (v3.3.5) [25]. Samples were initially pruned of non-bacterial, unidentified taxa, and ASVs were assigned as “chloroplast”. Replicates for each sample were initially examined and, after determining consistency among replicates, merged with phyloseq’s “merge_samples” function for subsequent analysis. For certain components of our analysis, low-abundance taxa (<5%) were removed from the dataset. Bray–Curtis between-sample distances were computed at the phylum level. Distance matrices were then used to cluster samples using non-metric multidimensional scaling (NMDS). The envfit function was used to understand the phyla most significantly correlating with our ordination. Alpha diversity (observed taxa) was assessed at the species level for all bacteria and for the respective phyla of interest.

3. Results

Based on the 16S rRNA amplicon sequencing, the general bacterial community composition across mesocosms was plotted using ordination with non-metric multidimensional scaling (NMDS) and the most significant phyla were projected as vectors (Figure 1). Initially, all mesocosm samples were generally consistent across mesocosms and enriched for the phylum Cyanobacteria (r2 = 0.91, p < 0.001). As the experiment proceeded, the hydrogen peroxide mesocosms and the glucose-high mesocosm developed increasing levels of proteobacteria (r2 = 0.83, p < 0.001), but the glucose-low mesocosm developed more bacteroidota (r2 = 0.88, p < 0.001) (Figure 1).
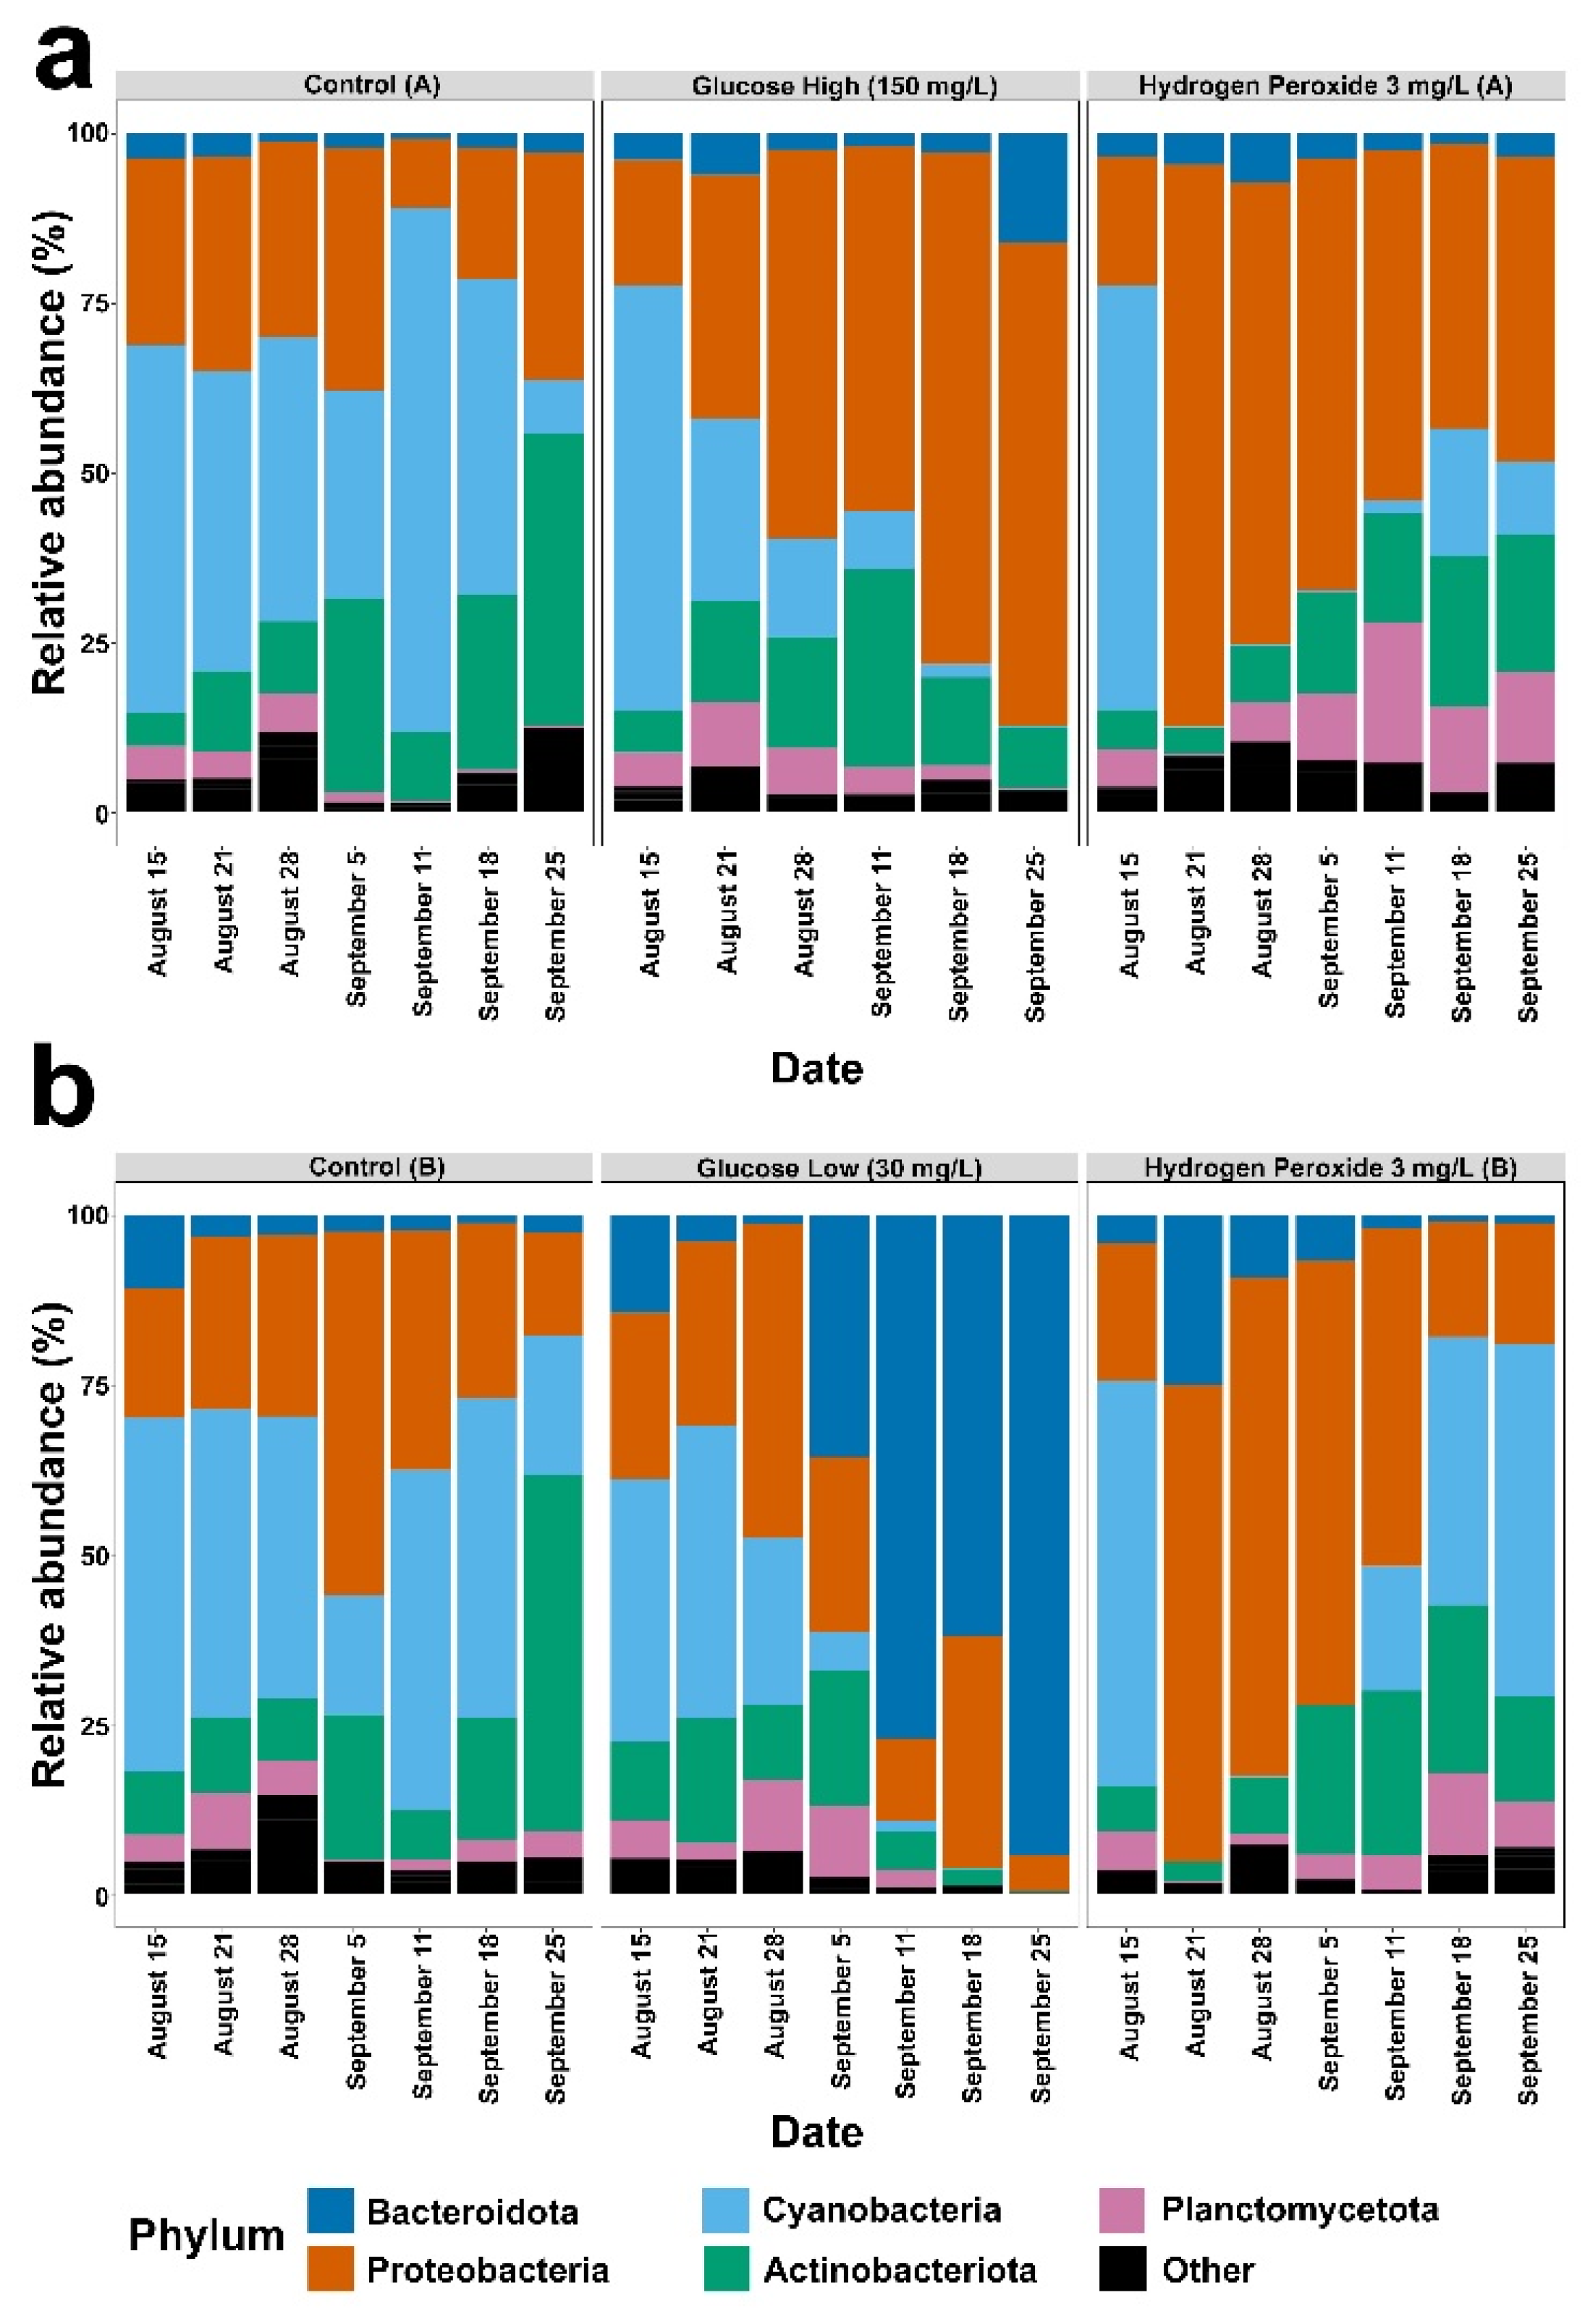
The genera of cyanobacteria detected in the mesocosms during the experiment were Cyanobium (R. Rippka & G. Cohen-Bazire) and Microcystis (Lemmermann) (Figure 2). At the phylum level, control mesocosms primarily consisted of cyanobacteria, but cyanobacteria levels gradually fell and Actinobacteriota levels began to increase (Figure 3, Control A and B). In the hydrogen peroxide treated mesocosms, cyanobacteria were rapidly reduced after about one week, allowing proteobacteria to become the dominant phylum (Figure 3, hydrogen peroxide A and B). Over time, the cyanobacteria gradually increased in relative abundance in the hydrogen peroxide mesocosms to levels comparable to the starting conditions. In both the glucose-high and glucose-low mesocosms, the relative abundance of cyanobacteria diminished (Figure 3) and proteobacteria became the dominant phylum in the glucose-high treated mesocosm (Figure 3a), while the glucose-low mesocosm showed an increase in the relative abundance of bacteroidota (Figure 3b).
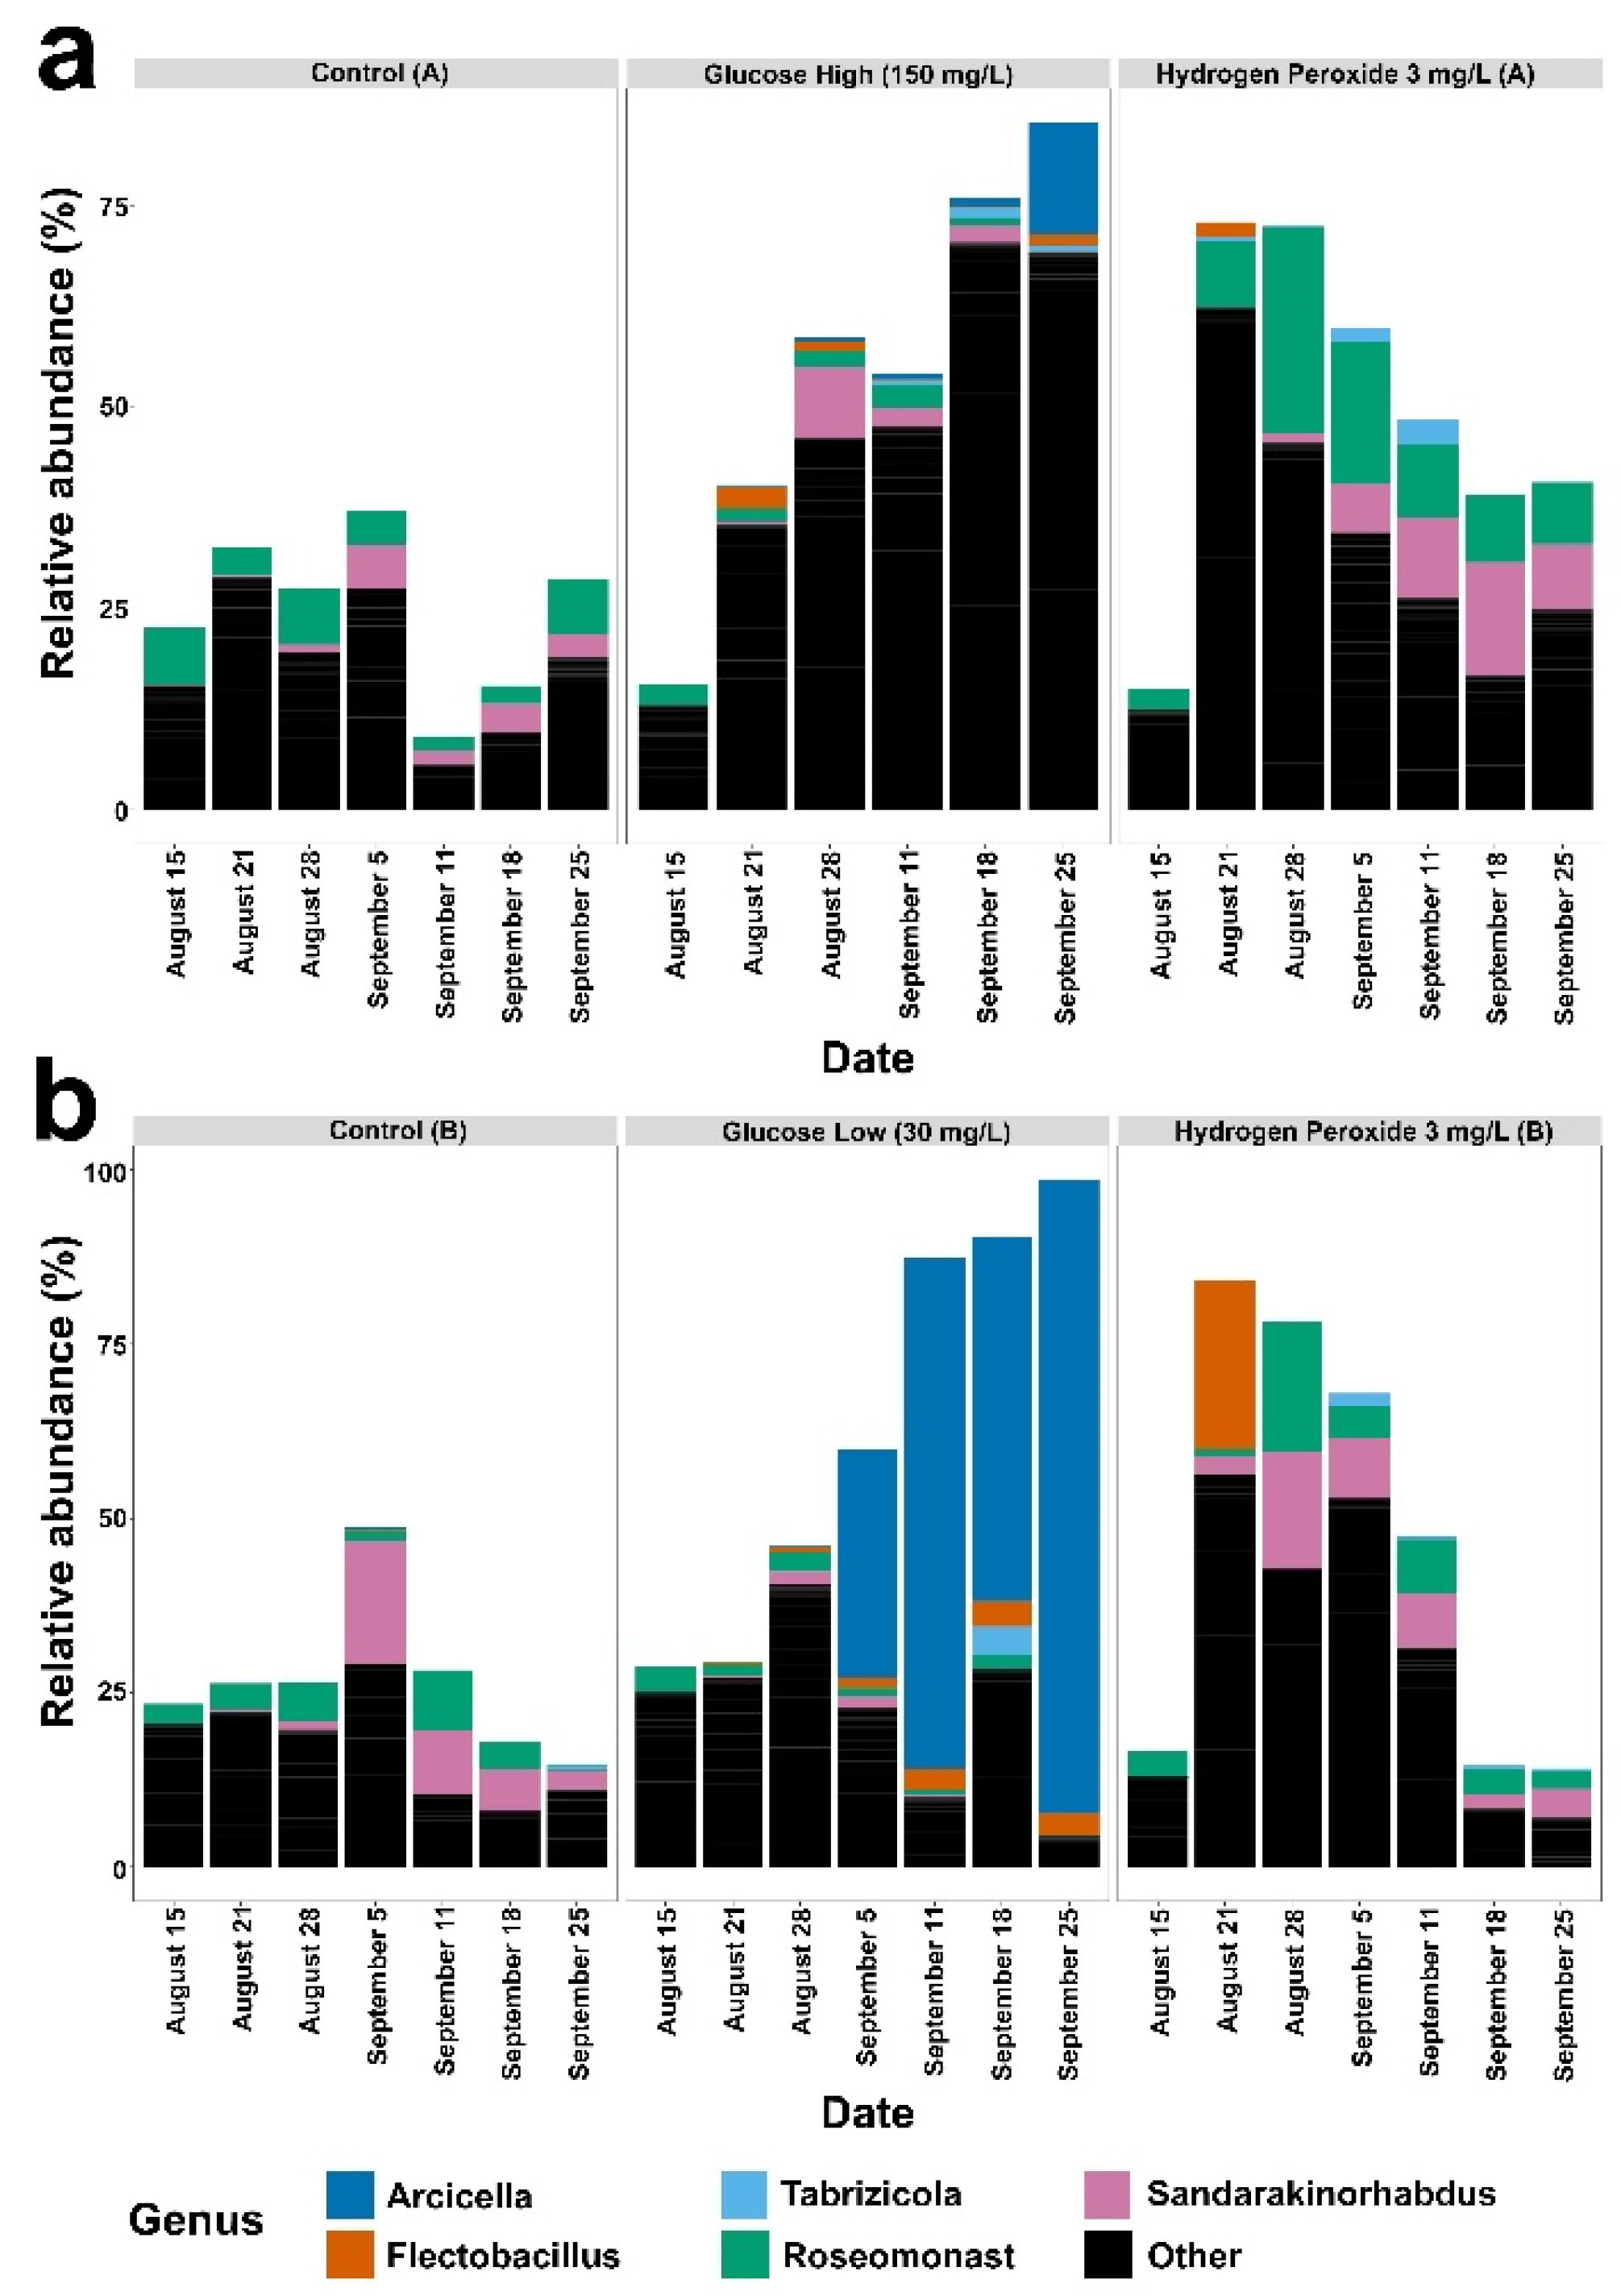
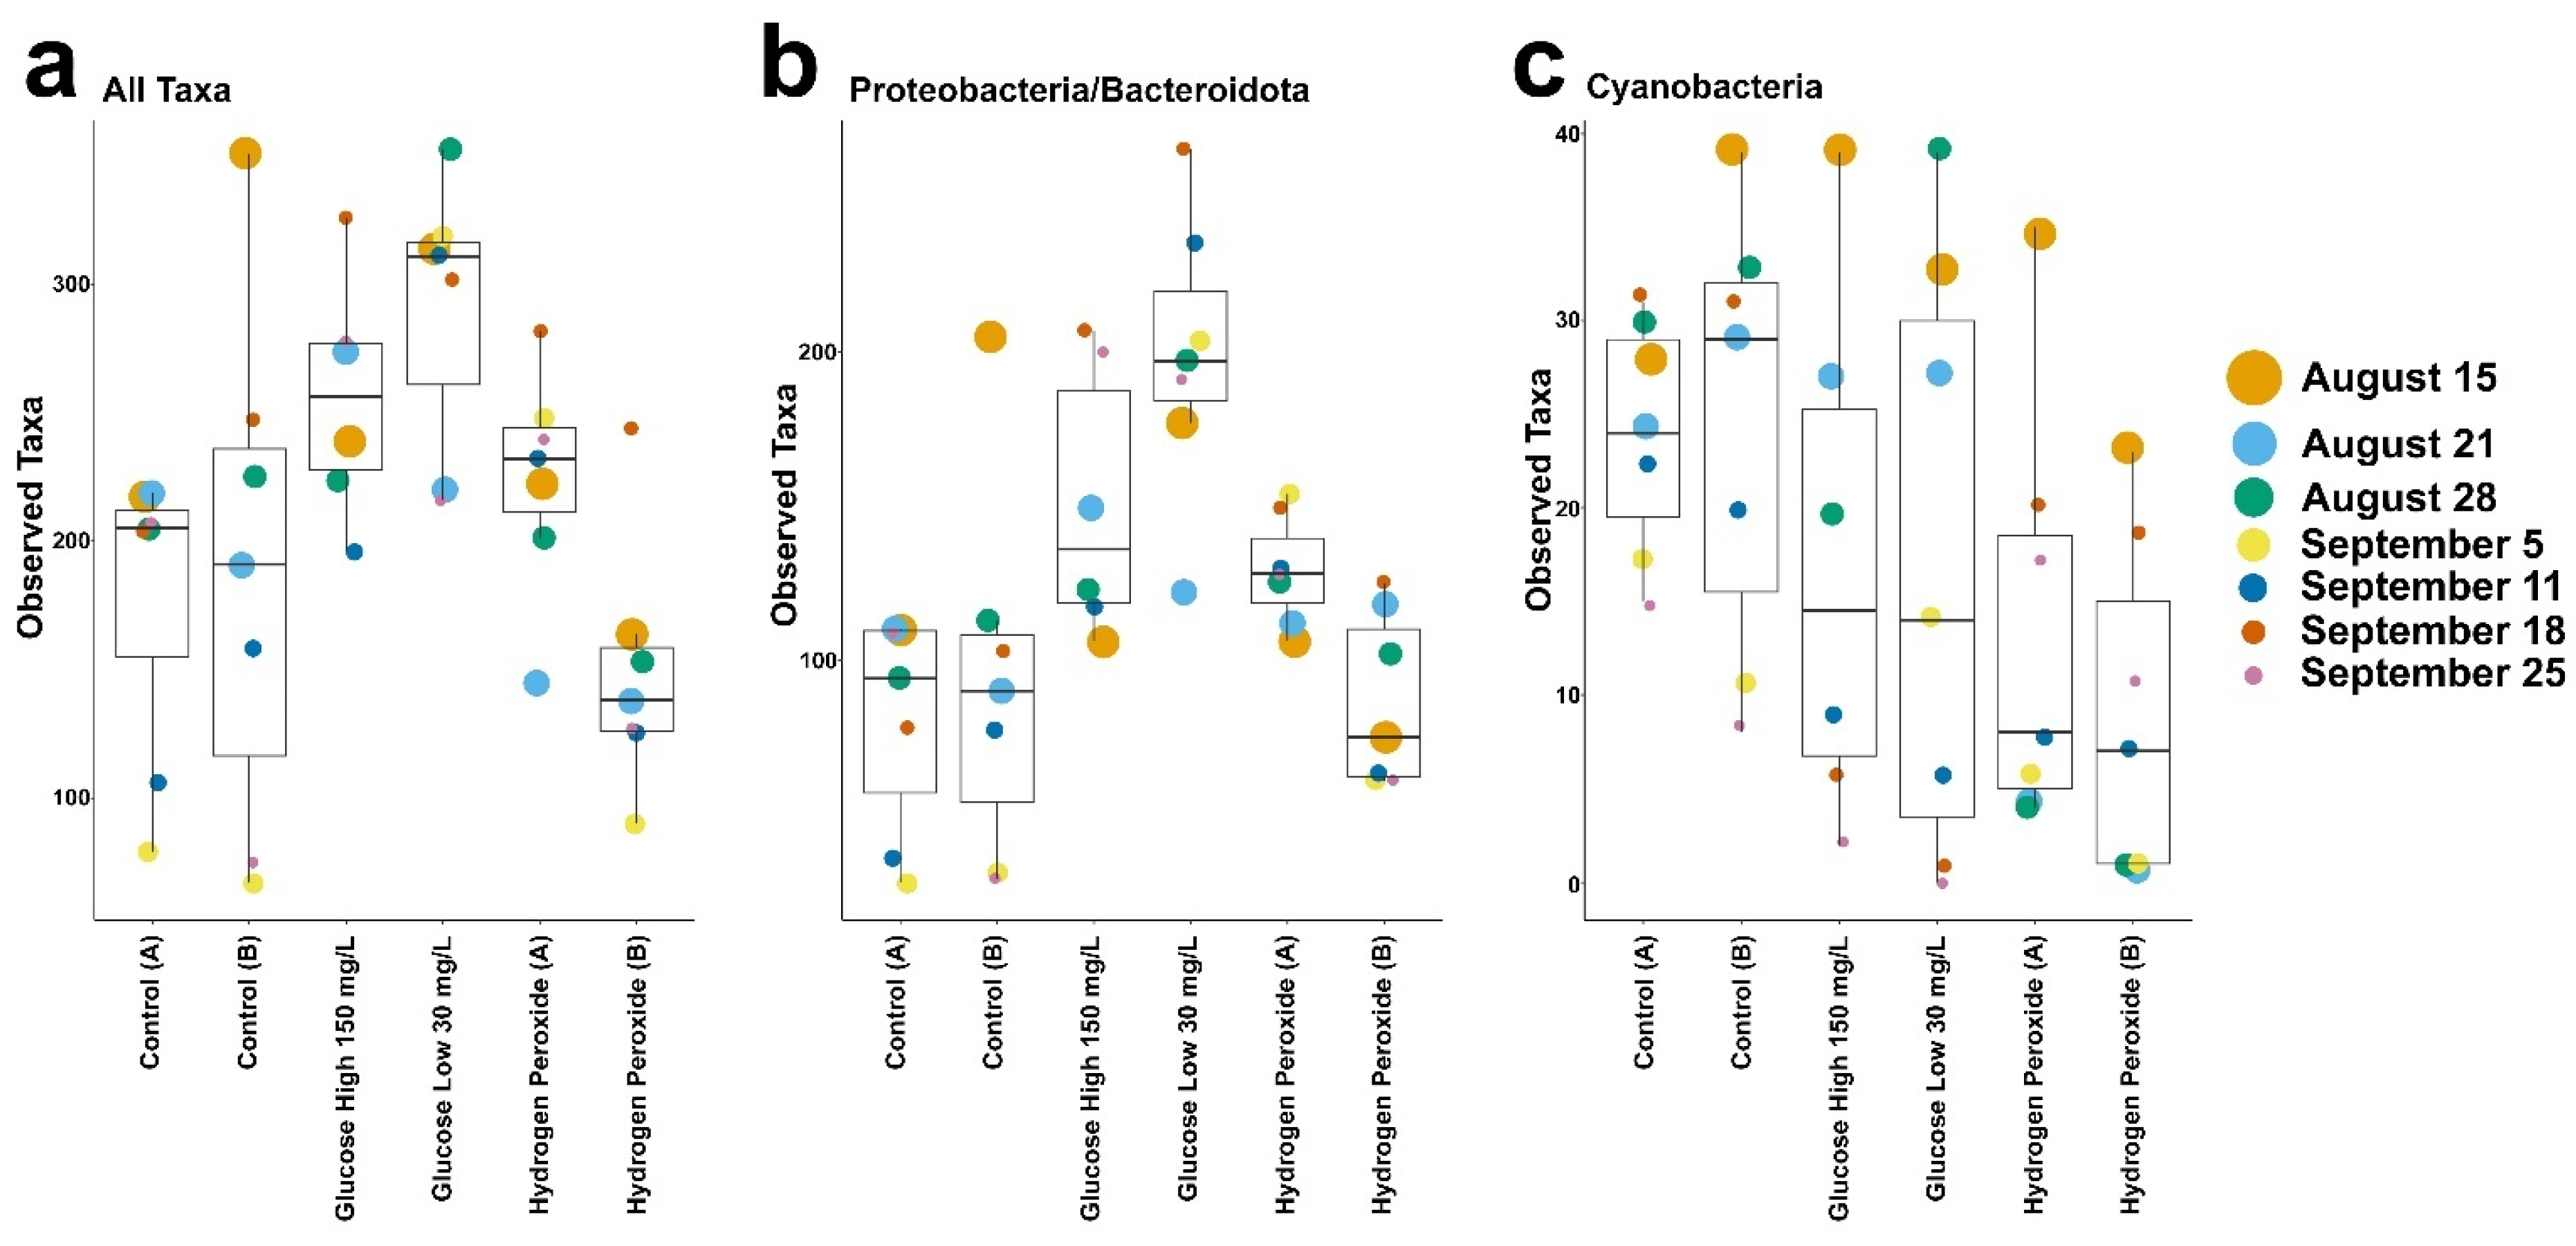
Therefore, the relative abundance of genera in the proteobacteria and bacteroidota phylum were examined in each mesocosm. We found that the shift in proteobacteria and bacteroidota communities was primarily driven by diverse low-abundance genera (Figure 4—“Other”) and, in nearly all mesocosms, the identified genera from the proteobacteria or bacteroidota were below 10% relative abundance (Figure 4). As an exception to this observation, the glucose-low mesocosm showed a distinct increase in the relative abundance of the bacteroidota genus Arcicella (Nikitin) (Figure 4) compared to the glucose-high mesocosm. Both glucose treatments caused an increase in the overall number of observed taxa, i.e., community richness, compared to the control mesocosms and hydrogen peroxide treated mesocosms (Figure 5a). The proteobacteria/bacteroidota increased in the glucose treated mesocosms (Figure 5b) with a corresponding decrease in the observed number of cyanobacterial taxa (Figure 5c).

4. Discussion

In the summer of 2023, Microcystis and Cyanobium were the dominant cyanobacteria in the mesocosm water. Microcystis and Cyanobium are common bloom-forming genera [26,27]. Microcystis is often a dominant taxon in Muskegon Lake [28]. Other components of the bacterioplankton community included the phyla proteobacteria (~25%), bacteroidota (~10%) and Actinobacteriota (~10%), which is consistent with other human-impacted freshwater lakes around the world [29,30].
Many physical, biological, and chemical treatments have been tested to control HCBs, but various concentrations of hydrogen peroxide are commonly utilized. In a laboratory study, hydrogen peroxide at 3 mg/L suppressed Microcystis [31]. In three lakes in the Netherlands, Piel et al. [32] used 2–5 mg/L hydrogen peroxide to control cyanobacteria. The treatment nearly eliminated the cyanobacteria, but new blooms developed within a few weeks. Because of hydrogen peroxide’s toxicity, rotifer populations strongly declined. Chen et al. [33] used 4 to 20 mg/L hydrogen, which resulted in an increase in eukaryotic algae and the dominant taxon of cyanobacteria changed from the nontoxic genus Dactylococcopsis to the toxic genus Oscillatoria. Huang et al. [34] demonstrated that high initial hydrogen peroxide concentrations resulted in an increase in pH, which increased hydrogen peroxide consumption. Lusty and Gobler [35] found that hydrogen peroxide reduced but did not fully eliminate cyanobacteria from eutrophic water bodies and suggested hydrogen peroxide may not be an ideal mitigation approach in high biomass ecosystems. In a recent meta-analysis of HCB treatment technologies, Anantapantula and Wilson [36] suggested that more research on existing and alternative treatments was needed.
Glucose has been proposed as a possible alternative to the use of hydrogen peroxide [10,11]. In this experiment, hydrogen peroxide acted faster than glucose in suppressing the cyanobacteria but maintained only a short efficacy. However, hydrogen peroxide had only minimal effects on the relative abundance of the accompanying bacterioplankton communities. On the other hand, glucose treatments took longer to be effective in suppressing the cyanobacteria. It appears that this delay is associated with the time for the proliferation of proteobacteria and bacteriodota, which likely outcompeted the cyanobacteria, causing their decrease in relative abundance later in the experiment.
We recognize the limitations of this large mesocosm study in replicating the dynamics of the lake itself with its variable light intensity, temperature changes, wind driven mixing, and the additional inputs of nutrients over time. For example, the contained nature of mesocosm water may be responsible for the gradual decline in cyanobacteria even in the control mesocosms. It remains to be seen how glucose additions to the lake itself would change the cyanobacterial community.

5. Conclusions

Glucose treatment should be tested further to determine if glucose additions can have any practical value in controlling HABS.

Author Contributions

Data analysis and interpretation, statistical analyses of sequences, graphic configurations and manuscript writing, D.L.; methodology, data curation, and manuscript writing/review, C.G.P.; sampling coordinator and sample analysis, manuscript editing and review, M.C.H.; research conceptualization, sample analysis, and manuscript review, N.S.; sampling and sample analysis, manuscript review, K.T.; sample analysis and manuscript review, A.H.; methodology, data curation, and manuscript review, R.T.; conceptualization, acquisition of funds, manuscript review/editing, and overall project management, J.L.; conceptualization, acquisition of funds, validation, manuscript review/editing, and on-site project management, A.D.S.; conceptualization, acquisition of funds, original drafting of manuscript, S.V. All authors have read and agreed to the published version of the manuscript.

Funding

This research was funded by the United States Environmental Protection Agency (US EPA) Office of Research and Development’s (ORD’s) research programs: Safe and Sustainable Water Resources (SSWR 4.2.2.1). In addition, US EPA “Pathfinder Innovation Pathways” (PIP) funding supported this research.

Data Availability Statement

All data will be available at the NIH-PMC website. All sequence data have been deposited in the NCBI sequence read archive at accession number: PRJNA1114712.

Conflicts of Interest

The authors declare no conflict of interest.

References

  1. Elser, J.J.; Bracken, M.E.; Cleland, E.E.; Gruner, D.S.; Harpole, W.S.; Hillebrand, H.; Ngai, J.T.; Seabloom, E.W.; Shurin, J.B.; Smith, J.E. Global analysis of nitrogen and phosphorus limitation of primary producers in freshwater, marine and terrestrial ecosystems. Ecol. Lett. 2007, 10, 1135–1142. [Google Scholar] [CrossRef]
  2. Fu, H.; Uchimiya, M.; Gore, J.; Moran, M.A. Ecological drivers of bacterial community assembly in synthetic phycospheres. Proc. Natl. Acad. Sci. USA 2020, 117, 3656–3662. [Google Scholar] [CrossRef] [PubMed]
  3. Wurtsbaugh, W.A.; Paerl, H.W.; Dodds, W.K. Nutrients, eutrophication and harmful algal blooms along the freshwater to marine continuum. Wiley Interdiscipl. Rev. Water 2019, 6, e1373. [Google Scholar] [CrossRef]
  4. Canfield, D.E., Jr.; Bachmann, R.W.; Hoyer, M.V. Restoration of Lake Okeechobee, Florida: Mission impossible? Lake Reserv. Manag. 2020, 37, 95–111. [Google Scholar] [CrossRef]
  5. Phlips, E.J.; Badylak, S.; Mathews, A.L.; Milbrandt, E.C.; Montefiore, L.R.; Morrison, E.S.; Stelling, B. Algal blooms in a river-dominated estuary and nearshore region of Florida, USA: The influence of regulated discharges from water control structures on hydrologic and nutrient conditions. Hydrobiologia 2023, 850, 4385–4411. [Google Scholar] [CrossRef]
  6. Summers, E.J.; Ryder, J.L. A critical review of operational strategies for the management of harmful algal blooms (HABs) in inland reservoirs. J. Environ. Manag. 2023, 330, 117141. [Google Scholar] [CrossRef]
  7. Merder, J.; Harris, T.; Zhao, G.; Stasinopoulos, D.M.; Ribby, R.A.; Michalak, A.M. Geographic redistribution of microcystin hotspots in response to climate warming. Nat. Water 2023, 1, 844–854. [Google Scholar] [CrossRef]
  8. Greenfield, D.I.; Duquette, A.; Goodson, A.; Keppler, C.J.; Williams, S.H.; Brock, L.M.; Stackley, K.D.; White, D.; Wilde, S.B. The effects of three chemical algaecides on cell numbers and toxin content of the cyanobacteria Microcystis aeruginosa and Anabaenopsis sp. Environ. Manag. 2014, 54, 1110–1120. [Google Scholar] [CrossRef]
  9. Moreno-Andrés, J.; Rivas-Zaballos, I.; Acevedo-Merino, A.; Nebot, E. On the efficacy of H2O2 or S2O82- at promoting the inactivation of a consortium of cyanobacteria and bacteria in algae-laden water. Microorganisms 2022, 10, 735. [Google Scholar] [CrossRef]
  10. Vesper, S.; Sienkiewicz, N.; Struewing, I.; Linz, D.; Lu, J. Prophylactic addition of glucose suppresses cyanobacterial abundance in lake water. Life 2022, 12, 385. [Google Scholar] [CrossRef]
  11. Linz, D.; Struewing, I.; Sienkiewicz Steinman, A.D.; Partridge, C.G.; McIntosh, K.; Allen, J.; Lu, J.; Vesper, S. Periodic addition of glucose suppressed cyanobacterial abundance in additive lake water samples during the entire bloom season. J. Water Resour. Prot. 2024, 16, 140–155. [Google Scholar] [CrossRef] [PubMed]
  12. Steinman, A.D.; Ogdahl, M.; Rediske, R.; Ruetz, C.R., III; Biddanda, B.A.; Nemeth, L. Current status and trends in Muskegon Lake, Michigan. J. Great Lakes Res. 2008, 34, 169–188. [Google Scholar] [CrossRef]
  13. Marko, K.M.; Rutherford, E.S.; Eadie, B.J.; Johengen, T.H.; Lansing, M.B. Delivery of nutrients and seston from the Muskegon River Watershed to near shore Lake Michigan. J. Great Lakes Res. 2013, 39, 672–681. [Google Scholar] [CrossRef]
  14. Mader, M.M.; Ruetz, C.R.; Woznicki, S.A.; Steinman, A.D. Land cover and water quality of drowned river mouths: Evidence of an environmental gradient along the eastern Lake Michigan shoreline. J. Great Lakes Res. 2023, 49, 102237. [Google Scholar] [CrossRef]
  15. Bagley, M.; Pilgrim, E.; Knapp, M.; Yoder, C.; Domingo, J.S.; Banerji, A. High-throughput environmental DNA analysis informs a biological assessment of an urban stream. Ecol. Indic. 2019, 104, 378–389. [Google Scholar] [CrossRef]
  16. Bolyen, E.; Rideout, J.R.; Dillon, M.R.; Bokulich, N.A.; Abnet, C.C.; Al-Ghalith, G.A.; Alexander, H.; Alm, E.J.; Arumugam, M.; Asnicar, F.; et al. Reproducible, interactive, scalable and extensible microbiome data science using QIIME 2. Nature Biotech. 2019, 37, 852–857. [Google Scholar] [CrossRef]
  17. Callahan, B.J.; McMurdie, P.J.; Rosen, M.J.; Han, A.W.; Johnson, A.J.; Holmes, S.P. DADA2: High-resolution sample inference from Illumina amplicon data. Nature Methods 2016, 13, 581–583. [Google Scholar] [CrossRef] [PubMed]
  18. Bokulich, N.A.; Kaehler, B.D.; Rideout, J.R.; Dillon, M.; Bolyen, E.; Knight, R.; Huttley, G.A.; Gregory Caporaso, J. Optimizing taxonomic classification of marker-gene amplicon sequences with QIIME 2’s q2-feature-classifier plugin. Microbiome 2018, 6, 90. [Google Scholar] [CrossRef]
  19. Quast, C.; Pruesse, E.; Yilmaz, P.; Gerken, J.; Schweer, T.; Yarza, P.; Peplies, J.; Glöckner, F.O. The SILVA ribosomal RNA gene database project: Improved data processing and web- based tools. Nucleic Acids Res 2013, 41, D590–D596. [Google Scholar] [CrossRef]
  20. Yilmaz, P.; Parfrey, L.W.; Yarza, P.; Gerken, J.; Pruesse, E.; Quast, C.; Schweer, T.; Peplies, J.; Ludwig, W.; Glöckner, F.O. The SILVA and “All-species Living Tree Project (LTP)” taxonomic frameworks. Nucleic Acids Res 2014, 42, D643–D648. [Google Scholar] [CrossRef]
  21. R Core Team. R: A language and environment for statistical computing. R Foundation for Statistical Computing, Vienna, Austria. 2021. Available online: https://www.R-project.org/ (accessed on 6 March 2023).
  22. McMurdie, P.J.; Holmes, S. Phyloseq: An R package for reproducible interactive analysis and graphics of microbiome census data. PLoS ONE 2013, 8, e61217. [Google Scholar] [CrossRef] [PubMed]
  23. Oksanen, J.; Blanchet, F.G.; Friendly, M.; Kindt, R.; Legendre, P.; McGlinn, D.; Stevens, M.H.H. Vegan: Community Ecology Package. R package, version 2.5–7; Scientific Research, Inc.: Glendale, CA, USA, 2018.
  24. Wickham, H. ggplot2: Elegant Graphics for Data Analysis; Springer: New York, NY, USA, 2016; ISBN 978-3-319-24277-4. Available online: https://ggplot2.tidyverse.org (accessed on 7 July 2023).
  25. Clarke, K.R. Non-parametric multivariate analyses of changes in community structure. Aus. J. Ecol. 1993, 18, 117–143. [Google Scholar] [CrossRef]
  26. Harke, M.J.; Steffen, M.M.; Gobler, C.J.; Otten, T.G.; Wilhelm, S.W.; Wood, S.A.; Paerl, H.W. A review of the global ecology, genomics, and biogeography of the toxic cyanobacterium, microcystis spp. Harmful Algae 2016, 54, 4–20. [Google Scholar] [CrossRef] [PubMed]
  27. Urakawa, H.; Steele, J.H.; Hancock, T.L.; Dahedl, E.K.; Schroeder, E.R.; Sereda, J.V.; Kratz, M.A.; García, P.E.; Armstrong, R.A. Interaction among spring phytoplankton succession, water discharge patterns, and hydrogen peroxide dynamics in the Caloosahatchee River in southwest Florida. Harmful Algae 2023, 126, 102434. [Google Scholar] [CrossRef] [PubMed]
  28. Gillett, N.D.; Steinman, A.D. An analysis of long-term phytoplankton dynamics in Muskegon Lake, a Great Lakes Area of Concern. J. Great Lakes Res. 2011, 37, 335–342. [Google Scholar] [CrossRef]
  29. Alegría-Gómez, J.; Castañón-González, J.H.; Hernández-García, J.A.; González-Terreros, E.; Velázquez-Ríos, I.O.; Ruíz-Valdiviezo, V.M. Changes in the abundance and diversity of bacterial and archaeal communities at different depths in a eutrophic freshwater lake in southwestern Mexico. Environ. Sci. Pollut. Res. Int. 2023, 30, 98362–98376. [Google Scholar] [CrossRef]
  30. Sanseverino, I.; Pretto, P.; António, D.C.; Lahm, A.; Facca, C.; Loos, R.; Skejo, H.; Beghi, A.; Pandolfi, F.; Genoni, P.; et al. Metagenomics analysis to investigate the microbial communities and their functional profile during cyanobacterial blooms in Lake Varese. Microb. Ecol. 2022, 83, 850–868. [Google Scholar] [CrossRef]
  31. Struewing, I.; Sienkiewicz, N.; Zhang, C.; Dugan, N.; Lu, J. Effective early treatment of Microcystis exponential growth and microcystin production with hydrogen peroxide and hydroxyapatite. Toxins 2022, 15, 3. [Google Scholar] [CrossRef]
  32. Piel, T.; Sandrini, G.; Weenink, E.F.J.; Qin, H.; Herk, M.J.V.; Morales-Grooters, M.L.; Schuurmans, J.M.; Slot, P.C.; Wijn, G.; Arntz, J.; et al. Shifts in phytoplankton and zooplankton communities in three cyanobacteria-dominated lakes after treatment with hydrogen peroxide. Harmful Algae 2024, 133, 102585. [Google Scholar] [CrossRef]
  33. Chen, C.; Wang, Y.; Chen, K.; Shi, X.; Yang, G. Using hydrogen peroxide to control cyanobacterial blooms: A mesocosm study focused on the effects of algal density in Lake Chaohu, China. Environ. Pollut. 2021, 272, 115923. [Google Scholar] [CrossRef]
  34. Huang, J.; Ghaly, M.; Hobson, P.; Chow, C.W.K. Innovative method of utilising hydrogen peroxide for source water management of cyanobacteria. Environ. Sci. Pollut. Res. Int. 2022, 29, 22651–22660. [Google Scholar] [CrossRef] [PubMed]
  35. Lusty, M.W.; Gobler, C.J. The efficacy of hydrogen peroxide in mitigating cyanobacterial blooms and altering microbial communities across four lakes in NY, USA. Toxins 2020, 12, 428. [Google Scholar] [CrossRef] [PubMed]
  36. Anantapantula, S.S.; Wilson, A.E. Most treatments to control freshwater algal blooms are not effective: Meta-analysis of field experiments. Water Res. 2023, 243, 120342. [Google Scholar] [CrossRef] [PubMed]
Figure 1. Non-metric multidimensional scaling (NMDS) plot of Bray–Curtis distances for the six mesocosms: control A = yellow circle, control B = yellow triangle; glucose-high = blue circle, glucose-low = blue triangle; and hydrogen peroxide A = purple circle, hydrogen peroxide B = purple triangle. Date progression is represented by decreasing shape size. Phylum abundance was fitted as vectors to the NMDS using envfit. Only those with the most significant associations to NMDS clustering are shown. Arrow direction indicates increasing abundance and arrow length represents strength of correlation. *** = p < 0.001.
Microorganisms 12 01925 g001
Figure 2. Results for Control (A), Glucose (A) and Hydrogen Peroxide (A) mesocosms are shown in panel (a). The results for Control (B), Glucose (B) and Hydrogen Peroxide (B) mesocosms are shown in panel (b). The relative abundance of Cyanobacteria genera occurring above 5% (compared to all bacteria) in the six mesocosms (control A or B, glucose-high or glucose-low, and hydrogen peroxide A or B) at each time point sampled and organized by date (x-axis). Genera below 5% relative abundance are grouped as ‘Other’ (black bars).
Microorganisms 12 01925 g002
Figure 3. Results for Control (A), Glucose (A) and Hydrogen Peroxide (A) mesocosms are shown in panel (a). The results for Control (B), Glucose (B) and Hydrogen Peroxide (B) mesocosms are shown in panel (b). Relative abundance of bacterial phyla occurring above 10% (compared to all bacteria) in the six mesocosms (control A or B, glucose-high or glucose-low, and hydrogen peroxide A or B) at each time point sampled and organized by date (x-axis). Phyla below 10% relative abundance are grouped as ‘Other’ (black bars).
Microorganisms 12 01925 g003
Figure 4. Results for Control (A), Glucose (A) and Hydrogen Peroxide (A) mesocosms are shown in panel (a). The results for Control (B), Glucose (B) and Hydrogen Peroxide (B) mesocosms are shown in panel (b). Relative abundance of all genera of proteobacteria and bacteroidota occurring above 10% (compared to all bacteria) in the six mesocosms (control A or B, glucose-high or glucose-low, and hydrogen peroxide A or B) at each time point sampled and organized by date (x-axis). Genera below 10% relative abundance are grouped as ‘Other’ (black bars).
Microorganisms 12 01925 g004
Figure 5. Raw observed taxa in the six mesocosms (control A or B, glucose-high or glucose-low, and hydrogen peroxide A or B) with date indicated by color and size (legend on right applies to all panels). (a) All taxa. (b) Proteobacteria/bacteroidota. (c) Cyanobacteria. Mesocosms are labeled on the x-axis. Note that the y-axis has differed scales for each panel.
Microorganisms 12 01925 g005
Disclaimer/Publisher’s Note: The statements, opinions and data contained in all publications are solely those of the individual author(s) and contributor(s) and not of MDPI and/or the editor(s). MDPI and/or the editor(s) disclaim responsibility for any injury to people or property resulting from any ideas, methods, instructions or products referred to in the content.