Article

Symbiotic N2 Fixation, Leaf Photosynthesis, and Abiotic Stress Tolerance of Native Rhizobia Isolated from Soybean Nodules at Da, Upper West Region, Ghana

by
Mmatladi Tesia Mataboge
1,
Mustapha Mohammed
2 and
Felix Dapare Dakora
3,*
1
Department of Crop Sciences, Tshwane University of Technology, Private Bag X680, Pretoria 0001, South Africa
2
Department of Crop Science, University for Development Studies, Tamale P.O. Box TL 1882, Ghana
3
Department of Chemistry, Tshwane University of Technology, Private Bag X680, Pretoria 0001, South Africa
*
Author to whom correspondence should be addressed.
Microorganisms 2025, 13(4), 876; https://doi.org/10.3390/microorganisms13040876
Submission received: 5 March 2025 / Revised: 3 April 2025 / Accepted: 7 April 2025 / Published: 11 April 2025
(This article belongs to the Section Plant Microbe Interactions)

Abstract

:
The soybean is an important source of protein and is gaining popularity in Ghana due to a rising demand for its use in the poultry industry. However, the grain yield of soybeans is relatively low in the Upper West Region due to infertile soil and climate change. This study evaluated root nodulation and symbiotic effectiveness in 31 rhizobial isolates obtained from the nodules of soybeans planted at Da in the Upper West Region, Ghana, as well as measured photosynthetic activity of the soybean plants grown under glasshouse conditions. This study further assessed the tolerance of the rhizobial isolates to different levels of temperature, drought, salinity, and pH in the laboratory and also measured the ability of the isolates to produce indole-3-acetic acid. An infrared gas analyser and the 15N and 13C natural abundance techniques were used to assess the photosynthetic activity, N2 fixation, and water-use efficiency, respectively. The results showed that the test isolates that induced greater photosynthetic rates from higher stomatal conductance also stimulated increased water loss via leaf transpiration in soybean plants. Isolates TUTGMGH9 and TUTGMGH19 elicited much higher shoot δ13C in the soybean host plant and induced higher shoot biomass, C accumulation, percent relative symbiotic effectiveness, and N2 fixation relative to Bradyrhizobium strain WB74 and 5 mM of nitrate, which were used as positive controls. Although isolate TUTGMGH9 did not grow at 40 °C, it showed growth at 5% of PEG-6000, NaCl, and a low pH while also producing moderate IAA. However, for better utilisation of these rhizobial isolates as bioinoculants, their growth performance needs to be assessed under field conditions to ascertain their competitiveness and symbiotic efficacy.

1. Introduction

The soybean (Glycine max L. Merr.) is a nutritionally important grain legume in the world because of its high protein (40%), oil content (20%), and low cholesterol, as well as its high dietary fibre [1]. In Ghana, soybeans have gained popularity partly due to the increase in demand from the poultry and oil industries [2,3]. Although soybean production in Ghana is relatively low [4], the northern parts of the country account for about 96% of the crop’s output, making its cultivation a major source of livelihood in the region [2].
Over the past decade, the soybean–rhizobia symbiosis has become important due to the role of symbiotic N2 fixation as a component in sustainable and environmentally friendly green agriculture [5]. However, the optimisation of N2 fixation in legumes such as soybeans requires the use of effective microsymbionts that are adapted to prevailing edaphoclimatic conditions [6,7]. Because ineffective indigenous soil rhizobia often outcompete introduced strains for nodule occupancy in field-grown legumes, several attempts to use rhizobial inoculants as biofertilisers have often failed [8,9]. In Africa, however, there are many reports of inoculation success with rhizobial application to field-grown legumes. For example, in Mozambique, inoculating promiscuous-nodulating soybeans with a Bradyrhizobium strain increased plant growth, N2 fixation, and grain yield by 32, 64, and 12%, respectively [10]. In Ethiopia, common bean inoculation with the Rhizobium phaseoli strain HB-429 at Galalicha increased plant growth, %Ndfa, amount of N-fixed, and grain yield by 19, 17, 54, and 48%, respectively, over uninoculated control [11]. Similarly, inoculating beans with the Rhizobium strain HB-429 at Hawassa increased shoot biomass, nodule number per plant, nodule dry matter, and grain yield per hectare by 9, 40, 54, and 49%, respectively, in 2012, and by 20, 39, 13, and 69%, respectively, in 2013 [12]. In Ghana, applying the Bradyrhizobium strain CB756 or the Bradyrhizobium strain BR 3267 to Kersting’s groundnut increased shoot growth, N-fixed, and grain yield of the landraces Dowie and Heng MM at Savelugu, and the landraces Heng MM and Sigiri at Gbalahi, compared to the uninoculated control [13]. Furthermore, in Ghana, inoculating cowpea at different locations yielded benefits, as found with applying the Bradyrhizobium strain BR3267 to variety Zayura, which increased shoot biomass, N-fixed, and grain yield compared to the uninoculated control, but was decreased with the inoculant strain CB756 at Gbalahi [14]. However, at Savelugu, strain CB756 induced a marked increase in shoot growth, N-fixed, and grain yield of variety Bawutawuta, in contrast to Songotra, which recorded greater shoot biomass, higher amounts of N-fixed, and increased grain yield with the Bradyrhizobium strain BR 3267.
Indigenous rhizobia are generally better adapted to local edaphoclimatic conditions than exotic commercial inoculants that often exhibit low effectiveness when transferred from the laboratory to the field due to competition with native rhizobia for the establishment of symbiosis [15,16]. Thus, the competitive ability of introduced rhizobial strains against indigenous soil microbes for nodule occupancy is critical for determining inoculation success in the field [17]. Unfortunately, abiotic stresses have detrimental constraints on symbiotic N2 fixation and the yield of soybeans, among other crops. Ghana is in a tropical region with erratic rainfall and high temperatures, both of which contribute to the occurrence of drought and soil acidity [18]. The optimum temperature for rhizobial growth is 28 °C, and an increase in soil temperature above this value can increase evapo-transpiration rates and, consequently, cause a reduction in rhizobial growth, rate of root colonisation, and nodule biomass [16,19]. Salinity is prevalent in most arid and semiarid regions and can limit the transport of solutes from the root zone to shoots due to insufficient soil moisture. Soil salinity can also affect the legume–rhizobia symbiotic interaction by interfering with the infection process and rhizobial survival, as a result of toxicity and osmotic stress [20,21].
With the changing climate that has characterised most parts of the world, the inoculation of legumes with efficient and stress-tolerant rhizobia is a promising strategy for the sustainable production of grain legumes. For example, the inoculation of legumes with salt-tolerant [22,23], heat-resistant [24], cold-tolerant [25], drought-tolerant [26], and acid (low pH) tolerant rhizobia [27] has been shown to increase the yield of legumes. Thus, there are rhizobial strains that possess intrinsic mechanisms for plant growth promotion and abiotic stress tolerance, including the synthesis of indole acetic acid (IAA) and exopolysaccharides [16]. The search for effective and naturally adapted rhizobial strains for inoculant production often entails the characterisation of native rhizobial isolates for their symbiotic effectiveness and adaptability to changing environmental conditions.
Furthermore, the ability of rhizobia to fix N2 biologically can significantly enhance the photosynthetic efficiency of nodulated legumes, as nitrogen is a key component in the chlorophyll molecule needed for harvesting light energy during photosynthesis, and the Rubisco enzyme, which is important for reducing CO2 to carbohydrates [28]. Grain legumes inoculated with effective rhizobial strains generally exhibit higher photosynthetic rates due to increased chlorophyll and Rubisco biosynthesis. Studies of Bambara groundnut, Kerstings’ groundnut, and cowpea in Ghana, South Africa, and Eswatini have, for example, shown that high N2-fixing rhizobia boosted photosynthetic functioning, leading to greater shoot biomass and higher grain yields [28,29,30,31].
The aim of this study was to (i) assess the root nodulation and symbiotic efficiency of soybean rhizobial isolates obtained from Da in the Upper West Region, Ghana, (ii) determine photosynthetic rates of soybean plants as a measure of N2-fixing effectiveness of the microsymbionts, (iii) assess the tolerance of rhizobial strains to different levels of temperature, drought, salinity, and pH in the laboratory, and (iv) screen the bacterial isolates for their ability to produce indole-3-acetic acid (IAA) under laboratory conditions.

2. Materials and Methods

2.1. Study Sites and Nodule Sample Collection

The bacterial isolates used in this study were obtained from the root nodules of soybean harvested from Da in the Nadowli District of Upper West Region, Ghana. The Upper West Region lies within the Guinea savanna agroecological zone and is characterised by grassland and savanna vegetation. It is a warm, semiarid environment with unimodal rainfall of 800 to 1100 mm, which commences in May and ends in October each year. The experimental field had no history of rhizobia inoculation. The plants were sampled at the flowering stage and the nodules were detached from the roots, washed with running water, placed in vials, and dried on silica gel covered with cotton wool [32].

2.2. Rhizobial Isolation

For bacterial isolation and purification, the nodules were rehydrated by immersing them in distilled water for 2 h. The nodules were then surface-sterilised by exposing them to ethanol (75%) for 10 s, followed by washing in sodium hypochlorite (3%) for 2 min, and rinsed five times with sterilised distilled water. The nodules were then crushed in sterile petri dishes with a drop of autoclave water using a glass rod [32,33], and the nodule suspension was streaked onto sterile yeast mannitol agar (YMA) plates, and incubated at 28 ± 2 °C for 5 to 12 days. Daily observations were made for the appearance of single rhizobial colonies. Bacterial colonies were purified by re-streaking on YMA plates until pure single colonies were obtained. Stock cultures of the single colonies were maintained in 50% glycerol-YMB at −80 °C for long-term use [33].

2.3. Authentication of Rhizobial Isolates

Single colonies of the bacteria were tested for their ability to induce nodule formation in their homologous host using soybean cv. Favour. Prior to planting, river sand was autoclaved in clean, washed pots, and seeds surface-sterilised by soaking in 95% ethanol for 10 s, then in sodium hypochlorite (3%) for 3 min, followed by rinsing six times in sterile distilled water [33]. Two seeds were sown per pot, and three replicated pots were used for each isolate. The pots were arranged in a randomised complete block design in the glasshouse at the Tshwane University of Technology. The glasshouse was naturally lit, with an uncontrolled temperature. The mean daily temperature during the experiment was 28 °C. After germination, the seedlings were thinned out to one plant per pot and then inoculated with bacterial cultures seven days after germination, using 1 mL per plant of rhizobial culture grown in yeast mannitol broth (YMB) to exponential phase (1 × 10⁹ cells mL−1). The commercial Bradyrhizobium strain WB74 obtained from Soygro, Potchefstroom, South Africa, was used as a positive control. Plants receiving 5 mM potassium nitrate (KNO3) every week, and uninoculated plants were included as additional controls. The soybean seedlings were irrigated with sterile N-free nutrient solution [32,33] and deionised water, when necessary. The soybean plants were harvested eight weeks after planting, and root nodulation was assessed. A dark leaf colour (Figure 1) and pink nodule internal colouration indicated effective nodulation.

2.4. Characterization of Rhizobial Isolates

The 31 authenticated isolates were all able to elicit nodulation in the homologous soybean host. The colony morphology and the appearance of the authenticated rhizobial isolates were assessed by re-streaking on YMA media and incubation at 28 °C for 5–12 days. The number of days taken for colonies to appear was used to classify the bacteria into three groups: fast-growers (<3 days), intermediate-growers (3–5 days), and slow-growers (≥6 days). The colony colour was recorded as milkish or white, and the texture was described as watery, gummy, or dry. The colony shape was characterised as circular or irregular, and the elevation was recorded as convex or flat. The colony size was measured as the colony diameter, using graph paper to the nearest millimetre [32,34].

2.5. Leaf Gas-Exchange Studies

Photosynthetic measurements were made on three fully expanded young trifoliate leaves per plant for three replicate plots between 08:00 and 11:00 at 60 days after planting (DAP) using a portable infrared gas analyser, version 6.2 (Li-6400XT, Li-COR, Lincoln, NE, USA). The leaves were allowed to acclimatise to the light environment in the chamber for 4 to 5 min before each measurement was taken. The instrument was calibrated to maintain the following conditions in the leaf chamber before use: a light intensity of 1200 μmol photons m−2s−1, a reference CO2 concentration of 400 ppm, a flow rate of 400 μmol s−1, a leaf temperature of 25 °C, and a relative humidity of 44%. The gas-exchange parameters measured included net photosynthesis (A), transpiration (E), stomatal conductance (gs), intercellular CO2 concentration (Ci), and the ratio of intercellular CO2 to ambient CO2 concentration (Ci/Ca). The intrinsic water-use efficiency (WUEi) was calculated as the ratio of A to gs [35,36].

2.6. Assessing Relative Symbiotic Effectiveness of Rhizobial Isolates

The effectiveness of the rhizobial isolates was determined at 60 days after planting. The harvested plants were separated into shoots, roots, and nodules. The strain symbiotic efficacy isolates were measured as nodule number per plant and nodule fresh weight per plant. The plant shoots and roots were separated, oven-dried separately at 60 °C for 48 h, and weighed. The percent relative symbiotic effectiveness (%RSE) of rhizobial isolates was calculated by expressing the shoot dry matter of soybean plants inoculated with the test isolates as a percentage of the shoot dry matter of plants inoculated with the commercial Bradyrhizobium inoculant strain WB74, as described in earlier studies [37,38,39], as follows:
% RSE = S h o o t   d r y   m a t t e r   o f   p l a n t s   i n o c u l a t e d   w i t h   t e s t   i s o l a t e s s h o o t   d r y   m a t t e r   o f   p l a n t s   i n o c u l a t e d   w i t h   B r a d y r h i z o b i u m   s p . W B 74 × 100
The isolates were considered ineffective at <50% RSE, moderately effective at 50 to 80% RSE, and highly effective at >80% RSE.

2.7. Shoot 15N/14N and 13C/12C Isotopic Analysis

To assess N2 fixation and C assimilation in the test soybean plants, the oven-dried shoot samples were analysed for their 15N/14N and 13C/12C isotopic composition using a mass spectrometer at the Stable Light Isotope Laboratory, University of Cape Town, South Africa. Briefly, about 2 to 3 mg of ground plant samples were weighed into aluminium capsules and fed into a Carlo Erba NA1500 elemental analyser (Fisons Instruments SpA, Strada, Rivoltana, Milan, Italy) coupled to a Finnigan MAT252 mass spectrometer (Fisons Instrument SpA, Strada, Rivoltana, Milan, Italy) via conflo II open-split device to measure 15N/14N isotopic composition. A standard (Merck Gel: δ15N = 6.8‰, N% = 14.64) was included together with a blank sample and run after every 12 samples to calibrate the machine and avoid errors during the isotopic fractionation. All the results were referenced to air for the N isotope values. The isotopic composition (δ15N) was calculated as [40] follows:
δ 15 N   =   [ 15 N / 14 N ] sample 15 N / 14 N atm 15 N / 14 N atm   ×   1000
The 13C natural abundance, or δ13C (‰), was also calculated as [41] follows:
δ 13 C = [ 13 C / 12 C ] sample 13 C / 12 C standard 13 C / 12 C standard ×   1000
The C and N content of the soybean shoots were calculated as the product of the shoot biomass and percent C concentration (%C) or percent N concentration (%N) [42]. The %C and %N were obtained directly from the mass spectrometer. The shoot N-fixed was calculated as follows:
N-fixed = shoot N content (nodulated plants) − shoot N content (uninoculated plants)

2.8. Physiological Characterisation of Isolates

2.8.1. Assessing Temperature Tolerance

To assess the temperature tolerance of the rhizobial isolates, 10 μL of single-colony culture was pipetted onto YMA plates and incubated at 25, 28, 30, 37, 40, and 45 °C. The tolerance of each isolate was evaluated by observing the growth of colonies on the plates for up to seven days, as described by Mohammed et al. [43].

2.8.2. Measuring Drought Tolerance

The tolerance of isolates to drought was determined using yeast mannitol broth containing polyethylene glycol (PEG-6000) at 5, 15, and 30% concentrations (w/v). For this, a 10 μL volume of the test rhizobial culture was pipetted onto YMA plates that were supplemented with the different levels of PEG-6000, and incubated at 28 °C for 72 h. The isolates were shaken on a daily basis and the growth was measured at a wavelength of 600 nm using a spectrophotometer (SpectraMax® 190 microplate reader, Molecular Devices, Sunnyvale, CA, USA). The optical density (OD) values of the test isolates were used as a measure of their tolerance to drought. Thus, an OD < 0.30 was considered to be highly sensitive to drought; an OD = 0.30–0.39 as sensitive to drought; an OD = 0.40–0.50 as tolerant; and an OD > 0.5 as highly tolerant to drought [44].

2.8.3. Determining Salinity Tolerance

The ability of rhizobial isolates to form colonies in the presence of different salt concentrations was assessed. Yeast mannitol agar was supplemented with different levels of NaCl at 0.05, 2.5, 5.0, 10.0, 15.0, 20.0, and 25.0 g per 500 mL YMA, equivalent to 0.01, 0.5, 1, 2, 3, 4, and 5%. This was followed by pipetting a 10 μL volume of the test rhizobial culture onto each plate and incubation at 28 °C for seven days. The bacterial growth rates were scored as +++ indicating full growth, ++ moderate growth, + weak growth, and − no growth [43].

2.8.4. Assessing pH Tolerance

To assess the ability of the test isolates to tolerate different pH levels (pH 4.5, 5, 6, 7, and 8.5), five yeast mannitol broth cultures were prepared with different pH levels in 200 mL Erlenmeyer flasks [45]. For pH values less than 7, an MES hydrate buffer (2-(N-morpholino)ethanesulfonic acid) (Ssigma-Aldrich, Burlington MA, USA) was added to the flask, and for pH 7 and 8.5, HEPES (4-(2-hydroxyethyl)-1-pipera zineethanesulfonic acid (Merck, Burlington MA, USA) was added to the flask containing the broth culture. A 10 µL volume of test isolate was added into the media, adjusted to each pH level, and incubated for seven days at 28 °C. Rhizobial growth was measured at 660 nm using a spectrophotometer (SpectraMax® 190 microplate reader, Molecular Devices, Sunnyvale, CA, USA).

2.8.5. Acid–Alkali Production

The isolates were cultured on YMA plates containing 0.025 g per litre of Bromothymol blue (BTB), which was used as the acid and base indicator, and incubated at 28 °C for seven days [32]. The colony formation and colour change of the medium were observed for 2–7 days. Fast-growing isolates usually change the medium to yellow due to acid production, and slow-growers to blue.

2.9. Statistical Analysis

All data were tested for normality and then subjected to a one-way analysis of variance using Statistica software (version 10.1). Where treatments showed significant differences, the means were separated using Duncan’s multiple range test at p ≤ 0.05. Correlation and regression analyses were performed to assess the existence of any relationships between the measured parameters.

3. Results

3.1. Gas-Exchange Parameters

At 60 days after planting, gas-exchange measurements were taken on the leaves of soybean seedlings nodulated by the 31 test isolates to assess differences in photosynthesis, which indirectly reflects the symbiotic functioning of the isolates used to inoculate the plants (Table 1). The rate of photosynthesis was highest in soybean plants inoculated with isolates TUTGMGH11 (16.18 µmol CO2 m−2s−1) and TUTGMGH8 (16.16 µmol CO2 m−2s−1) (Table 1). The uninoculated control plants induced the lowest photosynthetic rates (2.64 µmol CO2 m−2s−1). Of the 31 test isolates, 16% elicited higher photosynthetic rates (14.71–16.18 µmol CO2 m−2s−1) than the NO3-fed plants (14.47 µmol CO2 m−2s−1). Generally, the isolates that showed greater stomatal conductance also elicited greater CO2 uptake via photosynthesis. For example, the plants inoculated with isolates TUTGMGH8, TUTGMGH11, TUTGMGH22, and TUTGMGH4, and the commercial Bradyrhizobium strain WB74, all showed an increase in stomatal conductance and, hence, greater photosynthetic rates (Table 1).
More than 40% of the isolates induced higher intercellular CO2 concentrations than the commercial strain Bradyrhizobium strain WB74. Isolates TUTGMGH19 and TUTGMGH20 elicited the highest intercellular CO2 concentrations in the host soybean when compared to the other test isolates. In contrast, isolates TUTGMGH21 and TUTGMGH26 caused lower levels of intercellular CO2 (230.75 and 209.91 µmol CO2 molair−1, respectively). About 28 isolates also elicited higher intercellular CO2 concentrations in the soybeans than in the NO3-fed plants (Table 1).
Greater leaf transpiration rates were generally associated with increased photosynthetic rates and higher stomatal conductance. For example, isolate TUTGMGH8 and the commercial Bradyrhizobium strain WB74, as well as TUTGMGH4, induced the highest leaf transpiration (12.62, 12.12, 10.11, and 9.09 mol H2O m−2s−1, respectively), much higher photosynthetic rates, and greater stomatal conductance (Table 1). Including the commercial Bradyrhizobium strain WB74, 16% of the isolates induced greater leaf transpiration than the NO3-fed plants. As expected, the uninoculated control plants showed the lowest leaf transpiration rates, stomatal conductance, and photosynthetic rates (Table 1).
The ratio of the intercellular to ambient CO2 concentrations also differed significantly, with values ranging from 0.53 in plants inoculated with isolate TUTGMGH26 to 12.10 in soybean plants inoculated with the commercial Bradyrhizobium strain WB74 (Table 1). Isolates TUTGMGH6, TUTGMGH8, TUTGMGH11, TUTGMGH17, TUTGMGH20, and TUTGMGH23 elicited significantly higher intercellular to ambient CO2 concentrations than the commercial strain Bradyrhizobium strain WB74 (0.75). However, 21 isolates induced greater leaf intercellular to ambient CO2 concentrations than the commercial Bradyrhizobium strain WB74.
The soybean plants inoculated with isolate TUTGMGH26 recorded the highest intrinsic water-use efficiency (97.09 µmol CO2 mol−1 H2O), followed by the plants inoculated with isolates TUTGMG7H30, TUTGMGH25, and TUTGMGH15 (71.43–72.20 µmol CO2 mol−1 H2O) (Table 1). About 81% of the isolates induced higher intrinsic water-use efficiency than the commercial Bradyrhizobium strain WB74, while 19% induced greater intrinsic water-use efficiency than plants receiving 5 mM KNO3. As to be expected, plants that showed lower photosynthetic rates, stomatal conductance, leaf transpiration, and intercellular CO2 concentrations induced much higher intrinsic water-use efficiency, except for the uninoculated control plants (Table 1).

3.2. Plant Growth

The shoot biomass of soybean plants inoculated with the 31 rhizobial isolates ranged from 0.45 to 1.99 g plant−1 (Table 2). The highest shoot biomass was induced by isolate TUTGMGH21 (1.99 g plant−1), followed by the 5 mM NO3-fed plants (1.85 g plant−1), and isolate TUTGMGH3 (1.74 g plant−1). High leaf photosynthesis was generally associated with an increased shoot biomass and vice versa. For example, isolates TUTGMGH14, TUTGMGH18, and TUTGMGH26, which induced lower photosynthetic rates, resulted in the lowest shoot biomass (0.45–0.72 g plant−1), followed by the uninoculated control plants (0.33 g plant−1) (Table 2).
The root biomass varied significantly among the plants inoculated with the test isolates, with TUTGMGH6, TUTGMGH21, and TUTGMGH30 inducing the highest root dry matter accumulation (0.72–0.85 g plant−1). However, the highest root dry matter was recorded by the 5 mM NO3-fed plants (1.13 g plant−1), and the lowest by the uninoculated control (0.22 g plant−1 (Table 2).
The whole-plant biomass (shoot + root) differed significantly (p ≤ 0.001), with 5 mM NO3-fed plants producing the highest total plant biomass (2.97 g plant−1), followed by plants inoculated with isolates TUTGMGH1, TUTGMGH3, TUTGMGH6, TUTGMGH9, TUTGMGH20, TUTGMGH21, and TUTGMGH30 (2.23–2.70 g plant−1). About 77% of the rhizobial isolates induced greater accumulation of whole plant biomass (1.69–2.70 g plant−1) than the commercial Bradyrhizobium strain WB74 (Table 2).

3.3. Shoot C Concentration

The C concentration (%C) of the soybean shoots varied significantly (p ≤ 0.01) with inoculation and ranged from 40.15% to 44.42% (Table 2). Isolates TUTGMGH24 and TUTGMGH29 elicited the highest shoot C concentrations (44.42 and 44.30%, respectively), followed by the commercial Bradyrhizobium strain WB74, TUTGMGH28, TUTGMGH30, and TUTGMGH20. The lowest shoot C concentration (40.15%) was recorded in the uninoculated control plants.
In general, higher shoot biomass was associated with increased shoot C content and accumulation. As a result, the 5 mM NO3-fed plants and the plants inoculated with isolates TUTGMGH1, TUTGMGH3, TUTGMGH20, TUTGMGH23, TUTGMGH25, TUTGMGH21, and TUTGMGH24 recorded greater shoot biomass, and, hence, higher shoot C content. In contrast, the plants inoculated with isolates TUTGMGH10, TUTGMGH14, TUTGMGH18, TUTGMGH22, TUTGMGH26 and the uninoculated control recorded the least shoot biomass and, hence, the lowest shoot C content. About 81% of the isolates induced greater shoot C content (51.86–84.98 g plant−1) than the commercial Bradyrhizobium strain WB74 (42%) (Table 2).

3.4. Shoot δ13C and C:N Ratio

The shoot δ13C values of the soybean plants differed significantly (p ≤ 0.01) with the test isolates, ranging from −29.55‰ to −27.19‰. Inoculating the soybean plants with isolate TUTGMGH9 resulted in greater shoot δ13C (−27.19‰), followed by isolates TUTGMGH11, TUTGMGH24, TUTGMGH26, and TUTGMGH27 (−27.34‰ to −27.23‰). In contrast, lower δ13C values were recorded in the plants inoculated with the commercial Bradyrhizobium strain WB74 (−29.55‰), and those inoculated with isolates TUTGMGH23 (−28.44‰) and TUTGMGH25 (−28.29‰).
The soybean plants treated with 5 mM KNO3 recorded the highest C:N ratio (23.59 g g−1), followed by the plants inoculated with the commercial Bradyrhizobium strain WB74 (21.59 g g−1) and isolate TUTGMGH13 (21.54 g g−1). In contrast, the plants inoculated with isolates TUTGMGH7 and TUTGMGH25 recorded the lowest C:N ratios (15.57 and 15.91 g g−1, respectively) (Table 2).

3.5. Nodulation Induced by Rhizobial Isolates

The nodule number of the soybean plants inoculated with the different rhizobial isolates varied from 10 to 43 per plant, while the nodule fresh mass ranged from 0.18 to 0.64 g plant−1 (Table 3). The plants inoculated with isolate TUTGMGH20 produced the most root nodules (43 nodules per plant), followed by isolates TUTGMGH3 and TUTGMGH25, which produced similarly high nodule numbers (37 and 35 nodules per plant, respectively). Of the 31 isolates tested, 16% induced significantly greater nodule numbers on the soybeans than the commercial Bradyrhizobium strain WB74 (which formed 24 nodules per plant), while about 71% of them induced fewer nodules in the test soybeans than the commercial Bradyrhizobium strain WB74. Higher nodule numbers generally correlated with greater nodule fresh weights, though there were a few exceptions due to differences in nodule size. For example, isolates TUTGMGH4, TUTGMGH9, TUTGMGH12, and TUTGMGH25 induced more nodules in the soybeans, resulting in the highest nodule fresh weights (0.51–0.6 g plant−1). However, despite inducing fewer nodule numbers per plant, isolates TUTGMGH1, TUTGMGH2, and TUTGMGH6 elicited relatively high nodule fresh masses in the soybeans due to bigger nodule sizes. About 90% of the isolates produced greater nodule biomass (0.31– 0.64 g plant−1) than the commercial Bradyrhizobium strain WB74. In contrast, isolates TUTGMGH26 and TUTGMGH27 induced much lower nodule numbers (16 nodules per plant), and, hence, small nodule fresh weights (0.18 and 0.24 g plant−1) (Table 3).

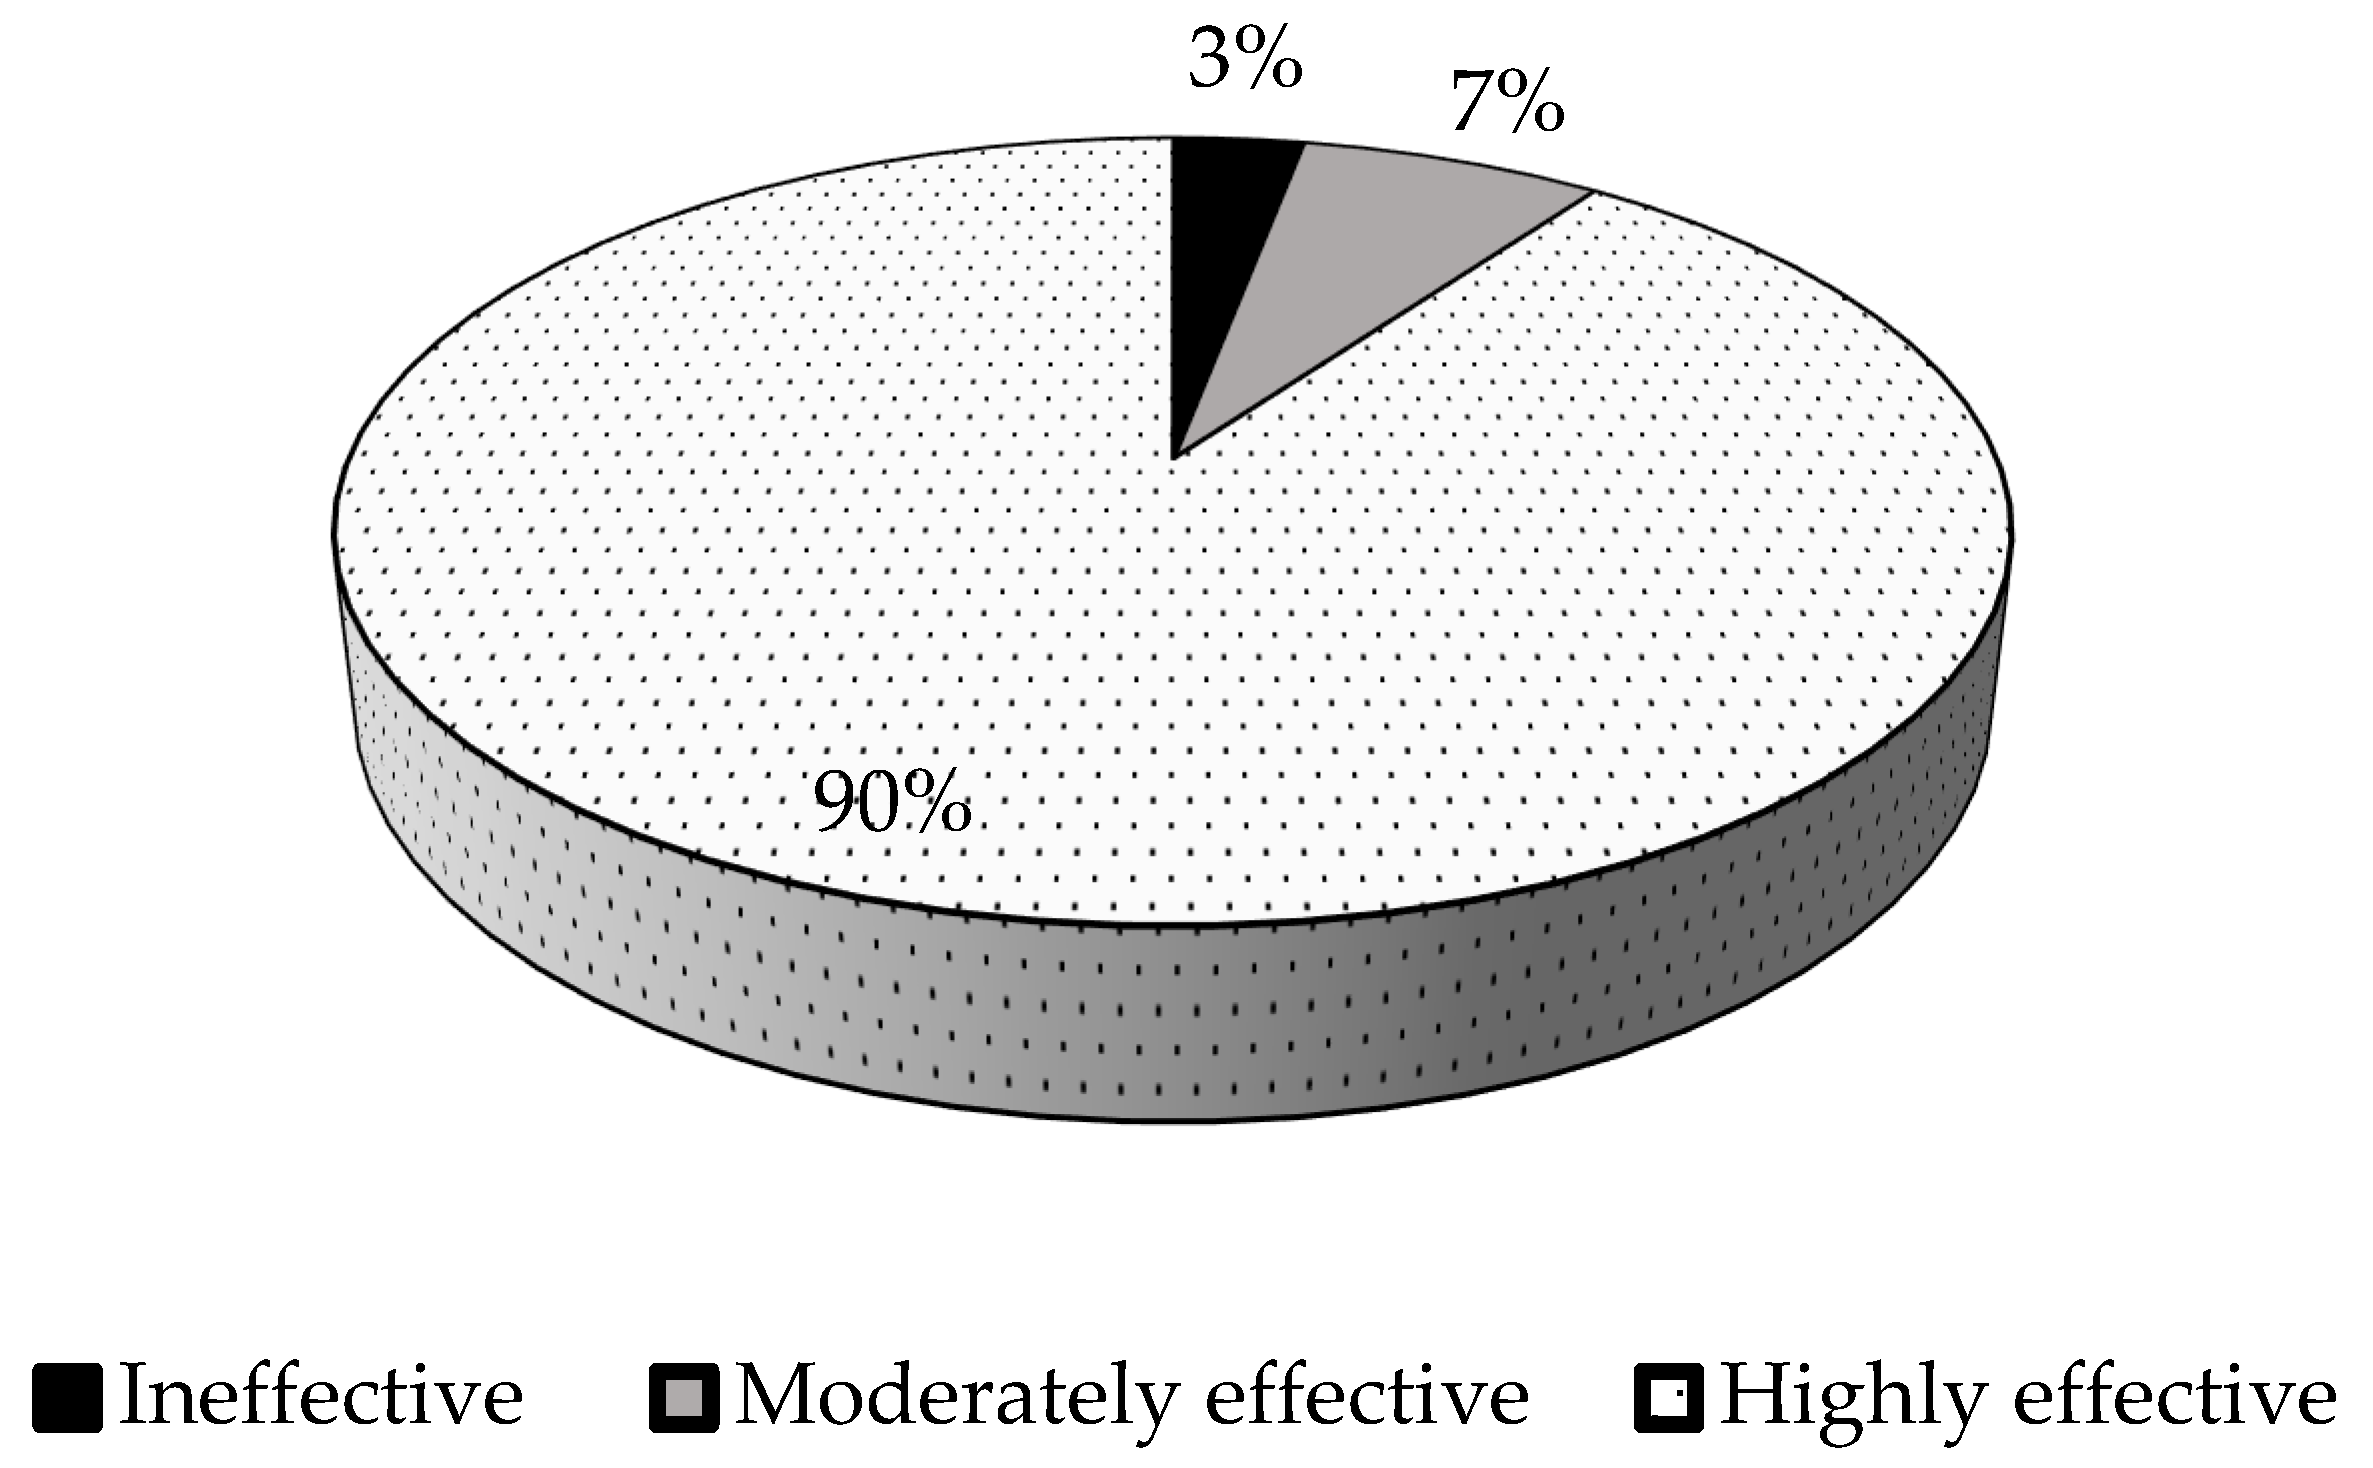
3.6. Relative Symbiotic Effectiveness of Rhizobial Isolates

The percent relative symbiotic effectiveness varied significantly (p ≤ 0.05) among the test isolates, with a range of 42% to 186% (Table 3; Figure 2). According to Rejili et al. [46], the isolates with less than 50% RSE are considered ineffective, 50–80% as moderately effective, and greater than 80% as highly effective. In this study, the isolates were effective, except isolate TUTGMGH14, which scored 42% relative symbiotic effectiveness. Isolates TUTGMGH18 and TUTGMGH26 were moderately effective with 67% and 56% RSE, while the rest of the isolates (90%) were highly effective (%RSE ≥ 80%) (Figure 2). Furthermore, 75% of the isolates were more effective than the commercial Bradyrhizobium strain WB74. Isolate TUTGMGH21 was the most effective, with 186% RSE (Table 3).

3.7. Shoot N Concentration

Inoculating soybeans with rhizobial isolate TUTGMGH23 resulted in a significantly greater shoot N concentration (2.92%), followed by isolates TUTGMGH19, TUTGMG7, and TUTGMGH16 (Table 3). Quite expected, the lowest shoot N concentration (1.13%) was recorded in the uninoculated control plants. However, the plants inoculated with isolates TUTGMGH23 and TUTGMGH21 produced the highest shoot N content, with the uninoculated control (0.37 g plant−1) and the plants inoculated with isolates TUTGMGH18 and TUTGMGH26 recording the lowest shoot N content (1.64 and 1.57 g plant−1) (Table 3).

3.8. Shoot δ15N and N-Fixed

The highest shoot δ15N values were recorded in the uninoculated control plants (+2.16‰), followed by the 5 mM KNO3-fed plants (+1.55‰) (Table 3). Isolates TUTGMGH24 (−1.26‰) and TUTGMGH14 (−1.26‰) recorded the highest δ15N values. The remaining isolates recorded much lower shoot δ15N values, which ranged from −2.64‰ to −1.76‰ (Table 3). The amount of N-fixed by the isolates in the soybeans differed significantly, with values ranging from 0.75 g plant−1 with isolate TUTGMGH14 to 4.77 g plant−1 with isolate TUTGMGH21 (Table 3).

3.9. Phenotypic Characterisation of the Rhizobial Isolates

A total of 31 authenticated soybean rhizobial isolates were evaluated for phenotypic characteristics, such as colony colour, size, texture, elevation, opacity, shape, and the number of days to colony appearance on YMA plates (Figure 3 and Tables S1 and S2). Of the 31 isolates, 42% were classified as intermediate-growers (3–5 days to appear on YMA plates) and 58% as slow-growers (6–8 days). In terms of the colony colour, 22 isolates (71%) were milkish, while the remaining 9 isolates (29%) were white. Regarding colony elevation, 19 isolates (61%) were convex, and 12 isolates (39%) were flat. A number of the isolates were gummy (48%), or watery (32%), and 6 isolates (20%) showed a dry texture. About 94% of the isolates had a circular shape, with only two isolates being irregular. Two isolates (TUTGMGH15 and TUTGMGH23) were transparent, 16 isolates translucent, and the remaining 13 isolates opaque. Most isolates had small colonies with diameters less than 2.5 mm (68%), while the remainder had diameters between 2.5 and 4 mm (Figure 3 and Figure S1). The isolates were also cultured in YMA medium containing Bromothymol Blue (BTB) as the acid/base indicator, and 45% of the isolates turned the medium into yellow within 5 days of incubation, while the remaining isolates turned blue.

3.10. Biochemical Characterisation of Rhizobial Isolates

3.10.1. Temperature Tolerance

Most of the test isolates showed growth at all tested temperatures, except TUTGMGH5, TUTGMGH9, and TUTGMGH28, which failed to grow at 40 and 45 °C (Table 4). Isolates TUTGMGH3 and TUTGMGH4 showed weak growth at all the temperature levels. The test isolates generally exhibited maximum growth at temperatures ranging from 28 to 30 °C. At 25 °C, 14 isolates (45%) showed weak growth, but 6 isolates showed full growth. Only isolate TUTGMGH17 showed good growth at all the temperature levels tested (Table 4).

3.10.2. Salinity Tolerance

All the isolates showed growth in media supplemented with 0.01% (control) and 0.5% NaCl (Table 4). However, isolates TUTGMGH5, TUTGMGH11, and TUTGMGH16 grew in only the 0.01% control but were susceptible to 0.5 to 5% NaCl (Table 4). In contrast, isolates TUTGMGH8, TUTGMGH22, and TUTGMGH27 (in that order), showed moderate to full cell growth at all the salinity levels tested (Figure S2). However, it was only isolate TUTGMGH8 that showed full growth at all the salinity levels (0.01–5% NaCl), followed by TUTGMGH3, TUTGMGH7, TUTGMGH9, TUTGMGH22, TUTGMGH27, and TUTGMGH31, which showed moderate growth at 5% NaCl (Table 4).

3.10.3. Drought Tolerance

Drought tolerance was evaluated in the soybean isolates using polyethylene glycol (PEG)-6000 at different levels, ranging from 5 to 15 to 30% (Table 5). There was a significant suppression of rhizobial cell growth at 15 and 30% PEG-6000. Although isolates TUTGMGH12 (0.424) and TUTGMGH19 (0.461) could tolerate 5% PEG-6000, TUTGMGH9 (0.523) was highly tolerant of PEG-6000, with the rest showing significant cell growth inhibition at 5% PEG-6000. Of all the 31 isolates tested, TUTGMGH12 showed better cell growth at 5, 15, and 30% PEG-6000 than the other isolates, followed by TUTGMGH10, TUTGMGH16, and TUTGMGH15 (Table 5). The isolates that were intolerant of 30% PEG included TUTGMGH17 and TUTGMGH29.

3.10.4. IAA Production

The rhizobial isolates differed significantly (p ≤ 0.05) in their ability to produce IAA using Salkowski’s reagent. The maximum IAA production was by isolate TUTGMGH15 (11.37 µg mL−1), followed by TUTGMGH3, TUTGMGH8, and TUTGMGH5 (9.92, 9.85, and 9.59 µg mL−1). Isolates TUTGMGH26 (0.98 µg mL−1) and TUTGMGH24 (1.21 µg mL−1) produced the lowest IAA (Table 5).

3.10.5. pH Tolerance

The 31 rhizobial isolates exhibited varied responses to different pH levels. The maximum growth in most of the isolates was recorded at pH 8.5, with the lowest at pH 6 (Table 6). In this study, 21 out of the 31 isolates recorded maximum growth at pH 8.5, and these included TUTGMGH4, TUTGMGH9, TUTGMGH10, TUTGMGH12, TUTGMGH17, TUTGMGH18, TUTGMGH21, TUTGMGH21, TUTGMGH30, and TUTGMGH31. However, some isolates, such as TUTGMGH4, TUTGMGH9, and TUTGMGH12, tolerated a wider range of pH conditions, ranging from acidic to alkaline.

4. Discussion

4.1. Diversity of Soybean Rhizobial Isolates and Their Photosynthetic Performance

The presence of diverse rhizobial populations in soils represents an opportunity to identify effective strains for inoculant formulation [47]. With a changing climate, however, the identified rhizobia should have multiple traits for survival in a changing environment that is characterised by high-temperature extremes, drought, salinity, low pH, and low soil nutrient concentrations. The soybean rhizobia obtained from Da in the Upper West Region of Ghana exhibited diverse characteristics. Single colonies isolated from the soybean root nodules displayed a circular shape (>94%) and milkish colour (>71%), as well as a gummy or watery texture (>48 and 32% respectively), were small in size, with diameters of less than 2.5 mm (>68%), and consisted of slow-growers (58%) and intermediate-growers (42%). These colony characteristics suggest that the soybean rhizobia from Da belong to the genus Bradyrhizobium, as described by Somasegaran and Hoben [32] and Pongslip [34]. Bradyrhizobium is the most dominant rhizobial microsymbiont in Africa [48,49,50,51], and is the primary nodulator of soybeans in Ghana [6].
Because bacteroids in legume root nodules require de novo photosynthate to reduce N2 to NH3, photosynthetic rates during legume plant growth generally correlate with the symbiotic efficacy of the nodule occupants [30,52]. In this study, gas-exchange measurements revealed marked differences in photosynthetic functioning, stomatal conductance, leaf transpiration, and water-use efficiency in soybean plants nodulated by the 31 rhizobial isolates from Da, Ghana. In fact, isolates TUTGMGH4, TUTGMGH8, TUTGMGH11, and TUTGMGH22, as well as the commercial Bradyrhizobium strain WB74, generally induced greater photosynthetic rates, powered by higher stomatal conductance, which permitted greater CO2 influx into photosynthetic cells. In contrast, the soybean plants nodulated by isolates TUTGMGH14, TUTGMGH18, and TUTGMGH26 revealed low photosynthesis due to reduced stomatal conductance that led to reduced CO2 influx and, hence, limited accumulation of shoot and whole-plant biomass.
In this study, there was no link between increased nodulation and plant biomass accumulation for some isolates, as reported previously [53]. As a result, although isolatesTUTGMGH8, TUTGMGH11, TUTGMGH22, and TUTGMGH30, and the commercial Bradyrhizobium strain WB74 elicited higher photosynthetic rates, they showed lower nodule dry matter. This contrasted with the lower photosynthetic rates, stomatal conductance, and leaf transpiration induced by isolates TUTGMGH1, TUTGMGH3, and TUTGMGH21, which recorded much higher nodulation, shoot dry matter, and shoot C concentrations (Table 1, Table 2 and Table 3). The instantaneous nature of gas-exchange measurements implies that they are strongly influenced by environmental factors, and this could account for the observed discrepancy [35].
C accumulation in legumes is a function of photosynthesis, which is dependent on symbiotic N2 fixation for the biosynthesis of the light-harvesting chlorophyll molecules and the CO2-reducing Rubisco enzyme. It was, therefore, not surprising that soybean inoculated with rhizobial isolates in this study increased C accumulation, compared to 5 mM NO3 -feeding, with values ranging from 40.15 to 44.30 g plant−1. It was also interesting to note that the rhizobial isolates that induced high shoot C concentrations were associated with more negative shoot δ13C values and vice versa, except for isolate TUTGMGH24. This implies that shoot C accumulation via photosynthesis was linked to plant water-use efficiency, as evidenced by the positive correlation between the shoot C concentration and shoot δ13C (r = 0.52 **) (Table S2).

4.2. Plant Water-Use Efficiency and Strain Symbiotic Effectiveness

Shoot δ13C is a known measure of water-use efficiency in C3 plants [41]. In this study, isolates TUTGMGH9, TUTGMGH11, TUTGMGH19, TUTGMGH24, TUTGMGH26, TUTGMGH27, and TUTGMGH30 induced greater shoot δ13C values (Table 2), and hence, greater water-use efficiency. However, isolates TUTGMGH26, TUTGMGH15, TUTGMGH21, TUTGMGH24, TUTGMGH31, and TUTGMGH9 also showed higher photosynthetic water-use efficiency, in addition to greater shoot δ13C values (Table 1 and Table 2). These results suggest that, as tools, the shoots 13C and photosynthetic water-use efficiency were robust enough in identifying water-use efficiency in soybeans nodulated by different rhizobial strains. Furthermore, isolates TUTGMGH9, TUTGMGH19, and TUTGMGH21 did not only exhibit greater shoot δ13C, but they also showed high shoot N content or N-fixed, as well as increased relative symbiotic effectiveness (Table 3). These results suggest that water-use efficiency was strongly enhanced by potent symbiotic signals that served as environmental cues, in addition to increasing N2 fixation and N nutrition in the legume.
However, the fact that isolates TUTGMGH7, TUTGMGH9, TUTGMGH23, and TUTGMGH25, which obtained a high proportion of their N nutrition from symbiosis and yet exhibited low water-use efficiency, could suggest that partial closure of the stomata during soil water deficit affected photosynthesis, leading to reduced water-use efficiency. This was supported by the negative correlation found between shoot δ13C and stomatal conductance (r = −0.28 **), as well as between shoot δ13C and leaf transpiration rates (r = −0.40 ***) (Table S2).
The symbiotic functioning of the 31 soybean isolates from Da varied significantly, as evidenced by the observed differences in the nodule number, nodule biomass, shoot N concentration, shoot δ15N, amount of N-fixed, and shoot N content. The marked differences in soybean biomass were generally linked to isolate symbiotic efficacy. For example, isolates TUTGMGH16, TUTGMGH21, TUTGMGH23, and TUTGMGH25, which were among the isolates that induced the highest nodulation (nodule number and weight), showed the lowest δ15N values and exhibited greater shoot N concentrations and content, as well as the highest amount of N-fixed, producing the largest soybean biomass (Table 2 and Table 3). Metabolites such as lumichrome and riboflavin, produced by rhizobia during nodule formation, serve as environmental cues for sensing soil moisture deficit [54,55,56]. High N2-fixing rhizobia apparently release more lumichrome than low-fixing microbes [57], suggesting a link between rhizobial strain effectiveness, symbiotic N nutrition, and legume water-use efficiency. It is not surprising that highly effective isolates, such as TUTGMGH9, TUTGMGH19, and TUTGGMGH21, showed high amounts of N-fixed and greater shoot δ13C or water-use efficiency in this study. The results of this study suggest that an increase in nodule functioning induced by the test isolates increased C and N assimilation through photosynthesis and N2 fixation, leading to greater biomass accumulation. In contrast, isolates TUTGMGH14, TUTGMGH18, and TUTGMGH26 produced the lowest nodule mass and N concentrations, high shoot δ15N, and low amounts of N-fixed induced least shoot biomass. These results were supported by the significant correlations between the shoot dry matter and nodule biomass (r = 0.43 ***) and shoot N concentration (r = 0.31 ***) (Table S2). These findings clearly indicate that soybean dry matter accumulation is directly linked to N2 fixation [52]. This is an argument that is consistent with the observed relationship between root nodulation and shoot biomass in Jack beans [39] and cowpeas [14]. Furthermore, the isolates that produced greater symbiotic N also recorded much higher relative symbiotic effectiveness, producing greater symbiotic N.
The data for the percent relative symbiotic effectiveness of the isolates in this study differed significantly (p ≤ 0.01), with a range of 42% for isolate TUTGMGH14 to 186% for isolate TUTGMGH21. Of the 31 isolates evaluated, 28 were more effective than the commercial Bradyrhizobium strain WB74, suggesting the presence of highly effective rhizobial populations in Ghanaian soils, with potential for use as inoculants. These isolates should, however, be further assessed for their ability to increase soybean plant growth and yield under field conditions.

4.3. Plant Growth-Promoting Traits of the Rhizobial Isolates from Da

Many abiotic factors can affect rhizobial growth and survival in soils. Temperature stress can alter the permeability of bacterial membranes and cause the denaturation of enzymes, leading to cell death and low rhizobial populations [58]. Under laboratory conditions, the growth in the test isolates was not markedly affected by temperature, except for TUTGMGH5, TUTGMGH9, and TUTGMGH28, which failed to grow at temperatures above 40 °C. The ability of these isolates to grow in a wide range of temperatures gives them a competitive edge in the rhizosphere to survive and nodulate their host plants. However, isolates are generally origin-related, and therefore, rhizobia from hot climates may generally tolerate high temperatures and vice versa. Yuan et al. [25], for example, found greater shoot biomass and N2 fixation under cooler conditions following inoculation with a cold-tolerant strain (4 °C) than the control commercial inoculant. However, Yuan et al. [25] also showed that rhizobia isolated from soybeans in hot environments could tolerate temperatures up to 44 °C, suggesting the development of heat tolerance mechanisms, such as the production of heat-shock proteins by the rhizobia for cellular protection against high temperatures [24].
The rhizobial isolates from this study were also found to be sensitive to drought, with only a few showing positive growth at 5% PEG-6000. Although isolates TUTGMGH9, TUTGMGH12, TUTGMGH19, TUTGMGH3, TUTGMGH10, and TUTGMGH30 grew well at a 5% PEG-6000 concentration, only TUTGMGH12 showed growth at 5, 15, and 30% PEG-6000, followed by TUTGMGH10, TUTGMGH16, and TUTGMGH15. Many of these isolates could, however, also induce high water-use efficiency and N2 fixation in soybean plants (Table 1 and Table 3), thus making them ideal for use in a changing climate where drought is frequent. The reported high nodulation of Phaseolus vulgaris inoculated with drought-tolerant rhizobia under conditions of soil moisture deficit [59] implies that the soybean isolates with drought tolerance could be recommended to farmers. These drought-tolerant rhizobia can apparently adjust their cell wall elasticity to prevent mechanical damage to the plasma membrane, thus improving water-use efficiency [26].
With climate change, irrigated agriculture and, hence, soil salinity are likely to increase. This would require identifying salt-tolerant crops and rhizobia for achieving food security. The 31 soybean isolates tested in this study, showed markedly different growth rates to various concentrations of salinity (Table 4), with 16 isolates showing an ability to grow at 5% NaCl, a finding better than the report by Khaitov et al. [23]. Khaitov et al. [23] identified rhizobial strains from chickpeas that had good growth at 3% NaCl. In fact, in this study, isolate TUTGMGH8 exhibited maximum growth from 0.01% to 5% NaCl and is therefore an ideal candidate for inoculant formation as a biofertiliser for soybean production under saline conditions. We also found that in this study, the slow-growing rhizobial isolates were sensitive to salinity, whereas the acid-producers could tolerate up to 5% NaCl. While 17 isolates showed low tolerance to increasing NaCl concentrations, 16 isolates were able to grow at all levels of salinity and temperature, though they differed in their growth rates (Table S1).
This study also revealed differences in isolate growth rates at various pH levels. Although these rhizobia were isolated from acidic soil, only isolates TUTGMGH3, TUTGMGH4, and TUTGMGH9 showed positive growth in an acidic medium, with their absorbances ranging from 0.479 to 0.697. This could be because the activity of H+ ions in the culture medium is different from that in the soil, where the charges of the colloids can partially neutralise the activity of the ions [60]. However, isolates TUTGMGH6, TUTGMGH8, TUTGMGH9, TUTGMGH10, TUTGMGH12, TUTGMGH17, TUTGMGH18, TUTGMGH21, TUTGMGH27, and TUTGMGH30 performed better under alkaline conditions. The acid-tolerant isolates were intermediate and slow-growing and changed the YMA medium supplemented with BTB into a blue colour, indicating alkaline production. Slow-growing rhizobia isolates are generally considered highly tolerant of low pH, suggesting that alkaline producers are dominant in tropical soils. In fact, Oliveira et al. [61] have suggested that alkaline-producing rhizobia are dominant in acidic soils, while acid producers are dominant in alkaline soils [62,63].
In conclusion, isolates TUTGMGH1, TUTGMGH3, TUTGMGH9, and TUTGMGH21 were best candidates for relative symbiotic effectiveness and N2-fixation; isolate TUTGMGH16 for drought tolerance and IAA production; isolates TUTGMGH4, TUTGMGH9, and TUTGMGH21 for pH tolerance; isolate TUTGMGH12 for drought; TUTGMGH8 for salinity tolerance and higher leaf photosynthetic activity; and TUTGMGH17 for temperature tolerance. However, for better application of these rhizobial isolates as bioinoculants, their symbiotic performance should be assessed under field conditions to ascertain their competitiveness and symbiotic efficacy.

Supplementary Materials

The following supporting information can be downloaded at: https://www.mdpi.com/article/10.3390/microorganisms13040876/s1. Table S1: the morphological characteristics of the 31 soybean nodulating rhizobial isolates; Table S2: correlation analysis between the shoot biomass of the soybeans and symbiotic N, as well as the gas-exchange parameters; Figure S1: colony morphology characteristics of the soybean rhizobia isolates on the yeast mannitol agar medium; Figure S2: a picture showing NaCl tolerance at different concentrations (A, 0.1 to 3% and B, 4 and 5%), exhibited by the test rhizobial isolates from Da. The numbers in each segment correspond to the number of the test rhizobial isolates, as preceded by the prefix TUTGMGH in Table 4.

Author Contributions

M.T.M. carried out bacterial isolation and characterisation and drafted the manuscript. M.M. is a PhD co-supervisor of M.T.M., collected root nodules, and reviewed the manuscript. F.D.D. is a Ph.D. supervisor of M.T.M., secured funding for the research, and approved the final manuscript. All authors have read and agreed to the published version of the manuscript.

Funding

This research was funded by the National Research Foundation, Tshwane University of Technology, and the South African Research Chair in Agrochemurgy and Plant Symbioses.

Institutional Review Board Statement

Not applicable.

Informed Consent Statement

All authors reader and approved the publication of paper.

Data Availability Statement

Data are contained within the article.

Acknowledgments

We are grateful to Titus Ngmenzuma and Lebogang Msiza for assisting in taking gas-exchange measurements and to the Tshwane University of Technology, Department of Crop Sciences, for technical and infrastructural assistance.

Conflicts of Interest

The authors declare no conflicts of interest.

Abbreviations

The following abbreviations are used in this manuscript:
NaClSodium Chloride
IAAIndole acetic acid
PEG-6000Polyethylene glycol-6000
BTBBromothymol blue
%RSEPercent relative symbiotic effectiveness
O.DOptical density
MDPIMultidisciplinary Digital Publishing Institute
DOAJDirectory of open access journals

References

  1. Meena, I.; Meena, R.; Sharma, S.; Singh, D. Yield and Nutrient Uptake by Soybean as Influenced by Phosphorus and Sulphur Nutrition in Typic Haplustept. Madras Agric. J. 2015, 102, 1. [Google Scholar] [CrossRef]
  2. MacCarthy, D.S.; Traore, P.S.; Freduah, B.S.; Adiku, S.G.K.; Dodor, D.E.; Kumahor, S.K. Productivity of Soybean under Projected Climate Change in a Semi-Arid Region of West Africa: Sensitivity of Current Production System. Agronomy 2022, 12, 2614. [Google Scholar] [CrossRef]
  3. MoFA-SRID. Facts & Figures: Agriculture in Ghana, 2021; Statistics Research, and InformationDirectorate of Minister of Food and Agriculture: Accra, Ghana, 2022; pp. 1–143. [Google Scholar]
  4. FAOSTAT. Food and Agriculture Organization of the United Nations. Available online: https://www.fao.org/faostat/en/#data/QCL/visualize (accessed on 21 March 2024).
  5. Mitran, T.; Meena, R.S.; Lal, R.; Layek, J.; Kumar, S.; Datta, R. Role of soil phosphorus on legume production. In Legumes for Soil Health and Sustainable Management; Springer: Berlin/Heidelberg, Germany, 2018; pp. 487–510. [Google Scholar]
  6. Ayuba, J.; Jaiswal, S.K.; Mohammed, M.; Denwar, N.N.; Dakora, F.D. Adaptability to local conditions and phylogenetic differentiation of microsymbionts of TGx soybean genotypes in the semi-arid environments of Ghana and South Africa. Syst. Appl. Microbiol. 2021, 44, 126264. [Google Scholar] [CrossRef] [PubMed]
  7. Dlamini, S.T.; Jaiswal, S.K.; Mohammed, M.; Dakora, F.D. Studies of Phylogeny, Symbiotic Functioning and Ecological Traits of Indigenous Microsymbionts Nodulating Bambara Groundnut (Vigna subterranea L. Verdc) in Eswatini. Microb. Ecol. 2021, 82, 688–703. [Google Scholar] [CrossRef]
  8. Mwenda, G.M.; Hill, Y.J.; O’Hara, G.W.; Reeve, W.G.; Howieson, J.G.; Terpolilli, J.J. Competition in the Phaseolus vulgaris-Rhizobium symbiosis and the role of resident soil rhizobia in determining the outcomes of inoculation. Plant Soil 2023, 487, 61–77. [Google Scholar] [CrossRef]
  9. Kawaka, F.; Dida, M.M.; Opala, P.A.; Ombori, O.; Maingi, J.; Osoro, N.; Muthini, M.; Amoding, A.; Mukaminega, D.; Muoma, J. Symbiotic Efficiency of Native Rhizobia Nodulating Common Bean (Phaseolus vulgaris L.) in Soils of Western Kenya. Int. Sch. Res. Not. 2014, 2014, 258497. [Google Scholar] [CrossRef]
  10. Gyogluu, C.; Boahen, S.K.; Dakora, F.D. Response of promiscuous-nodulating soybean (Glycine max L. Merr.) genotypes to Bradyrhizobium inoculation at three field sites in Mozambique. Symbiosis 2016, 69, 81–88. [Google Scholar] [CrossRef]
  11. Samago, T.Y.; Anniye, E.W.; Dakora, F.D. Grain yield of common bean (Phaseolus vulgaris L.) varieties is markedly increased by rhizobial inoculation and phosphorus application in Ethiopia. Symbiosis 2018, 75, 245–255. [Google Scholar] [CrossRef]
  12. Samago, T.Y.; Dakora, F.D. Combined use of Rhizobium inoculation and low phosphorus application increased plant growth, root nodulation and grain yield of common bean (Phaseolus vulgaris) in Ethiopia. Front. Agric. Sci. Eng. 2025, 12, 104. [Google Scholar]
  13. Mohammed, M.; Mbah, G.C.; Sowley, E.N.K.; Dakora, F.D. Bradyrhizobium Inoculation of Field-Grown Kersting’s Groundnut [Macrotyloma geocarpum (Harms) Marechal & Baudet] Increased Grain Yield and N2 Fixation, Measured Using the Ureide, and 15N Natural Abundance Techniques. Front. Sustain. Food Syst. 2021, 5, 672247. [Google Scholar] [CrossRef]
  14. Mohammed, M.; Mbah, G.C.; Sowley, E.N.K.; Dakora, F.D. Cowpea Genotypic Variations in N2 Fixation, Water Use Efficiency (δ13C), and Grain Yield in Response to Bradyrhizobium Inoculation in the Field, Measured Using Xylem N Solutes, 15N, and 13C Natural Abundance. Front. Agron. 2022, 4, 764070. [Google Scholar] [CrossRef]
  15. Kumar, A.; Verma, J.P. Does plant—Microbe interaction confer stress tolerance in plants: A review? Microbiol. Res. 2018, 207, 41–52. [Google Scholar] [CrossRef] [PubMed]
  16. Sindhu, S.; Dahiya, A.; Gera, R.; Sindhu, S.S. Mitigation of abiotic stress in legume-nodulating rhizobia for sustainable crop production. Agric. Res. 2020, 9, 444–459. [Google Scholar] [CrossRef]
  17. Mendoza-Suárez, M.; Andersen, S.U.; Poole, P.S.; Sánchez-Cañizares, C. Competition, Nodule Occupancy, and Persistence of Inoculant Strains: Key Factors in the Rhizobium-Legume Symbioses. Front. Plant Sci. 2021, 12, 690567. [Google Scholar] [CrossRef]
  18. Bationo, A.; Fening, J.O.; Kwaw, A. Assessment of soil fertility status and integrated soil fertility management in Ghana. In Improving the Profitability, Sustainability and Efficiency of Nutrients Through Site Specific Fertilizer Recommendations in West Africa Agro-Ecosystems; Springer: Berlin/Heidelberg, Germany, 2018; Volume 1, pp. 93–138. [Google Scholar]
  19. Gopalakrishnan, S.; Sathya, A.; Vijayabharathi, R.; Varshney, R.K.; Gowda, C.L.; Krishnamurthy, L. Plant growth promoting rhizobia: Challenges and opportunities. 3 Biotech 2015, 5, 355–377. [Google Scholar] [CrossRef]
  20. Bouizgarne, B.; Oufdou, K.; Ouhdouch, Y. Actinorhizal and Rhizobial-Legume symbioses for alleviation. In Plant Microbes Symbiosis: Applied Facets; Springer: New Delhi, India, 2014. [Google Scholar]
  21. Rasanen, L.A.; Lindstrom, K. Effects of biotic and abiotic constraints on the symbiosis between rhizobia and the tropical leguminous trees Acacia and Prosopis. Indian J. Exp. Biol. 2003, 41, 1142–1159. [Google Scholar]
  22. Ali, Q.; Shabaan, M.; Ashraf, S.; Kamran, M.; Zulfiqar, U.; Ahmad, M.; Zahir, Z.A.; Sarwar, M.J.; Iqbal, R.; Ali, B.; et al. Comparative efficacy of different salt tolerant rhizobial inoculants in improving growth and productivity of Vigna radiata L. under salt stress. Sci. Rep. 2023, 13, 17442. [Google Scholar] [CrossRef]
  23. Khaitov, B.; Kurbonov, A.; Abdiev, A.; Adilov, M. Effect of chickpea in association with Rhizobium to crop productivity and soil fertility. Eurasian J. Soil Sci. 2016, 5, 105–112. [Google Scholar] [CrossRef]
  24. Bansal, M.; Kukreja, K.; Sunita, S.; Dudeja, S. Symbiotic effectivity of high temperature tolerant mungbean (Vigna radiata) rhizobia under different temperature conditions. Int. J. Curr. Microbiol. Appl. Sci. 2014, 3, 807–821. [Google Scholar]
  25. Yuan, K.; Reckling, M.; Ramirez, M.D.A.; Djedidi, S.; Fukuhara, I.; Ohyama, T.; Yokoyama, T.; Bellingrath-Kimura, S.D.; Halwani, M.; Egamberdieva, D. Characterization of rhizobia for the improvement of soybean cultivation at cold conditions in central Europe. Microbes Environ. 2020, 35, ME19124. [Google Scholar] [CrossRef]
  26. del-Canto, A.; Sanz-Saez, Á.; Sillero-Martínez, A.; Mintegi, E.; Lacuesta, M. Selected indigenous drought tolerant rhizobium strains as promising biostimulants for common bean in Northern Spain. Front. Plant Sci. 2023, 14, 1046397. [Google Scholar] [CrossRef] [PubMed]
  27. Avelar Ferreira, P.A.; Bomfeti, C.A.; Lima Soares, B.; de Souza Moreira, F.M. Efficient nitrogen-fixing Rhizobium strains isolated from amazonian soils are highly tolerant to acidity and aluminium. World J. Microbiol. Biotechnol. 2012, 28, 1947–1959. [Google Scholar] [CrossRef] [PubMed]
  28. Ibny, F.Y.; Jaiswal, S.K.; Mohammed, M.; Dakora, F.D. Symbiotic effectiveness and ecologically adaptive traits of native rhizobial symbionts of Bambara groundnut (Vigna subterranea L. Verdc.) in Africa and their relationship with phylogeny. Sci. Rep. 2019, 9, 12666. [Google Scholar]
  29. Mbah, G.C.; Mohammed, M.; Jaiswal, S.K.; Dakora, F.D. Phylogenetic Relationship, Symbiotic Effectiveness, and Biochemical Traits of Native Rhizobial Symbionts of Cowpea (Vigna unguiculata L. Walp) in South African Soil. J. Soil Sci. Plant Nutr. 2022, 22, 2235–2254. [Google Scholar] [CrossRef]
  30. Jaiswal, S.K.; Dakora, F.D. Maximizing Photosynthesis and Plant Growth in African Legumes Through Rhizobial Partnerships: The Road Behind and Ahead. Microorganisms 2025, 13, 581. [Google Scholar] [CrossRef]
  31. Mohammed, M.; Jaiswal, S.K.; Sowley, E.N.; Ahiabor, B.D.; Dakora, F.D. Symbiotic N2 fixation and grain yield of endangered Kersting’s groundnut landraces in response to soil and plant associated Bradyrhizobium inoculation to promote ecological resource-use efficiency. Front. Microbiol. 2018, 9, 2105. [Google Scholar] [CrossRef]
  32. Somasegaran, P.; Hoben, H.J. Handbook for Rhizobia: Methods in Legume-Rhizobium Technology; Springer Science & Business Media: Berlin, Germany, 2012. [Google Scholar]
  33. Vincent, J.M. A Manual for the Practical Study of the Root-Nodule Bacteria; Wiley Online Library: Hoboken, NJ, USA, 1970. [Google Scholar]
  34. Pongslip, N. Phenotypic and Genotypic Diversity of Rhizobia; Bentham Science Publishers: Sharjah, United Arab Emirates, 2012. [Google Scholar]
  35. Makoi, J.H.J.R.; Chimphango, S.B.M.; Dakora, F.D. Photosynthesis, water-use efficiency and δ13C of five cowpea genotypes grown in mixed culture and at different densities with sorghum. Photosynthetica 2010, 48, 143–155. [Google Scholar] [CrossRef]
  36. Rai, V.; Sanagala, R.; Sinilal, B.; Yadav, S.; Sarkar, A.K.; Dantu, P.K.; Jain, A. Iron availability affects phosphate deficiency-mediated responses, and evidence of cross-talk with auxin and zinc in Arabidopsis. Plant Cell Physiol. 2015, 56, 1107–1123. [Google Scholar] [CrossRef]
  37. Kebede, E.; Amsalu, B.; Argaw, A.; Tamiru, S. Symbiotic effectiveness of cowpea (Vigna unguiculata (L.) Walp.) nodulating rhizobia isolated from soils of major cowpea producing areas in Ethiopia. Cogent Food Agric. 2020, 6, 1763648. [Google Scholar] [CrossRef]
  38. Purcino, H.; Festin, P.; Elkan, G. Identification of effective strains of Bradyrhizobium for Arachis pintoi. Trop. Agric. 2000, 77, 226–231. [Google Scholar]
  39. Ngwenya, Z.D.; Dakora, F.D. Symbiotic Functioning and Photosynthetic Rates Induced by Rhizobia Associated with Jack Bean (Canavalia ensiformis L.) Nodulation in Eswatini. Microorganisms 2023, 11, 2786. [Google Scholar] [CrossRef] [PubMed]
  40. Mariotti, A.; Germon, J.; Hubert, P.; Kaiser, P.; Letolle, R.; Tardieux, A.; Tardieux, P. Experimental determination of nitrogen kinetic isotope fractionation: Some principles; illustration for the denitrification and nitrification processes. Plant Soil 1981, 62, 413–430. [Google Scholar] [CrossRef]
  41. Farquhar, G.D.; Ehleringer, J.R.; Hubick, K.T. Carbon isotope discrimination and photosynthesis. Annu. Rev. Plant Biol. 1989, 40, 503–537. [Google Scholar] [CrossRef]
  42. Pausch, R.C.; Mulchi, C.L.; Lee, E.H.; Forseth, I.N.; Slaughter, L.H. Use of 13C and 15N isotopes to investigate O3 effects on C and N metabolism in soybeans. Part I. C fixation and translocation. Agric. Ecosyst. Environ. 1996, 59, 69–80. [Google Scholar] [CrossRef]
  43. Mohammed, M.A.; Chernet, M.T.; Tuji, F.A. Phenotypic, stress tolerance, and plant growth promoting characteristics of rhizobial isolates of grass pea. Int. Microbiol. 2020, 23, 607–618. [Google Scholar] [CrossRef]
  44. Susilowati, A.; Puspita, A.; Yunus, A. Drought resistant of bacteria producing exopolysaccharide and IAA in rhizosphere of soybean plant (Glycine max) in Wonogiri Regency Central Java Indonesia. IOP Conf. Ser. Earth Environ. Sci. 2018, 142, 012058. [Google Scholar]
  45. Guerrero-Castro, J.; Lozano, L.; Sohlenkamp, C. Dissecting the acid stress response of Rhizobium tropici CIAT 899. Front. Microbiol. 2018, 9, 846. [Google Scholar] [CrossRef]
  46. Rejili, M.; Mahdhi, M.; Fterich, A.; Dhaoui, S.; Guefrachi, I.; Abdeddayem, R.; Mars, M. Symbiotic nitrogen fixation of wild legumes in Tunisia: Soil fertility dynamics, field nodulation and nodules effectiveness. Agric. Ecosyst. Environ. 2012, 157, 60–69. [Google Scholar] [CrossRef]
  47. Grönemeyer, J.L.; Kulkarni, A.; Berkelmann, D.; Hurek, T.; Reinhold-Hurek, B. Rhizobia indigenous to the Okavango region in Sub-Saharan Africa: Diversity, adaptations, and host specificity. Appl. Environ. Microbiol. 2014, 80, 7244–7257. [Google Scholar] [CrossRef]
  48. Ngwenya, Z.D.; Mohammed, M.; Jaiswal, S.K.; Dakora, F.D. Phylogenetic relationships among Bradyrhizobium species nodulating groundnut (Arachis hypogea L.), jack bean (Canavalia ensiformis L.) and soybean (Glycine max Merr.) in Eswatini. Sci. Rep. 2022, 12, 10629. [Google Scholar] [CrossRef]
  49. Gyogluu, C.; Mohammed, M.; Jaiswal, S.K.; Kyei-Boahen, S.; Dakora, F.D. Assessing host range, symbiotic effectiveness, and photosynthetic rates induced by native soybean rhizobia isolated from Mozambican and South African soils. Symbiosis 2018, 75, 257–266. [Google Scholar] [CrossRef]
  50. Mohammed, M.; Jaiswal, S.K.; Dakora, F.D. Distribution and correlation between phylogeny and functional traits of cowpea (Vigna unguiculata L. Walp.)-nodulating microsymbionts from Ghana and South Africa. Sci. Rep. 2018, 8, 18006. [Google Scholar] [CrossRef] [PubMed]
  51. Osei, O.; Abaidoo, R.C.; Ahiabor, B.D.K.; Boddey, R.M.; Rouws, L.F.M. Bacteria related to Bradyrhizobium yuanmingense from Ghana are effective groundnut micro-symbionts. Appl. Soil Ecol. 2018, 127, 41–50. [Google Scholar] [CrossRef] [PubMed]
  52. Belane, A.K.; Dakora, F.D. Assessing the relationship between photosynthetic C accumulation and symbiotic N nutrition in leaves of field-grown nodulated cowpea (Vigna unguiculata L. Walp.) genotypes. Photosynthetica 2015, 53, 562–571. [Google Scholar] [CrossRef]
  53. Parvin, S.; Uddin, S.; Tausz-Posch, S.; Armstrong, R.; Tausz, M. Carbon sink strength of nodules but not other organs modulates photosynthesis of faba bean (Vicia faba) grown under elevated [CO2] and different water supply. New Phytol. 2020, 227, 132–145. [Google Scholar] [CrossRef]
  54. Phillips, D.A.; Joseph, C.M.; Yang, G.-P.; Martínez-Romero, E.; Sanborn, J.R.; Volpin, H. Identification of lumichrome as a Sinorhizobium enhancer of alfalfa root respiration and shoot growth. Proc. Natl. Acad. Sci. USA 1999, 96, 12275–12280. [Google Scholar] [CrossRef]
  55. Matiru, V.; Dakora, F. Xylem transport and shoot accumulation of lumichrome, a newly recognized rhizobial signal, alters root respiration, stomatal conductance, leaf transpiration and photosynthetic rates in legumes and cereals. New Phytol. 2005, 165, 847–855. [Google Scholar] [CrossRef]
  56. Matiru, V.N.; Dakora, F.D. The rhizosphere signal molecule lumichrome alters seedling development in both legumes and cereals. New Phytol. 2005, 166, 439–444. [Google Scholar] [CrossRef]
  57. Dakora, F.D.; Matiru, V.; Kanu, A.S. Rhizosphere ecology of lumichrome and riboflavin, two bacterial signal molecules eliciting developmental changes in plants. Front. Plant Sci. 2015, 6, 146621. [Google Scholar] [CrossRef]
  58. Bhargava, Y.; Murthy, J.; Kumar, T.R.; Rao, M.N. Phenotypic, stress tolerance and plant growth promoting characteristics of rhizobial isolates from selected wild legumes of semiarid region, Tirupati, India. Adv. Microbiol. 2016, 6, 1–12. [Google Scholar] [CrossRef]
  59. Mhadhbi, H.; Chihaoui, S.; Mhamdi, R.; Mnasri, B.; Jebara, M. A highly osmotolerant rhizobial strain confers a better tolerance of nitrogen fixation and enhances protective activities to nodules of Phaseolus vulgaris under drought stress. Afr. J. Biotechnol. 2011, 10, 4555–4563. [Google Scholar]
  60. Li, D.; Gao, Y. Hydrogen Ion Concentration Index of Culture Media. In Quality Management in the Assisted Reproduction Laboratory; Springer Nature: Singapore, 2024; pp. 37–47. [Google Scholar]
  61. Oliveira, A.N.d.; Oliveira, L.A.d.; Andrade, J.S. Production and some properties of crude alkaline proteases of indigenous Central Amazonian rhizobia strains. Braz. Arch. Biol. Technol. 2010, 53, 1185–1195. [Google Scholar] [CrossRef]
  62. Adhikari, D.; Kaneto, M.; Itoh, K.; Suyama, K.; Pokharel, B.B.; Gaihre, Y.K. Genetic diversity of soybean-nodulating rhizobia in Nepal in relation to climate and soil properties. Plant Soil 2012, 357, 131–145. [Google Scholar] [CrossRef]
  63. Yan, J.; Han, X.Z.; Ji, Z.J.; Li, Y.; Wang, E.T.; Xie, Z.H.; Chen, W.F. Abundance and diversity of soybean-nodulating rhizobia in black soil are impacted by land use and crop management. Appl. Environ. Microbiol. 2014, 80, 5394–5402. [Google Scholar] [CrossRef] [PubMed]
Figure 1. Photo of inoculated soybean plants showing greater symbiotic effectiveness and dark leaves with isolate TUTGMGH21, compared to pale leaves with ineffective isolate TUTGMGH18.
Microorganisms 13 00876 g001
Figure 2. Classification of 31 native rhizobial isolates based on percent relative symbiotic effectiveness.
Microorganisms 13 00876 g002
Figure 3. Phenotypic characterisation of 31 soybean rhizobial isolates.
Microorganisms 13 00876 g003
Table 1. Effect of 31 rhizobial inoculation and nitrate-feeding on leaf gas exchange in soybean plants. Values (mean ± S.E.) followed by dissimilar letters are significant at ** p ≤ 0.01 or *** p ≤ 0.001.
IsolatesAGsCiECi/CaWUEi
µmol (CO2)
m−2s−1
Mol (H2O)
m−2s−1
µmol (CO2)
molair−1
Mol (H2O)
m−2s−1
µmol (CO2)
mol−1(H2O)
TUTGMGH111.34 ± 0.76 d–l0.16 ± 0.01 j–m257.38 ± 1.38 fg5.41 ± 0.07 ij0.65 ± 0.01 i–j70.36 ± 2.43 bc
TUTGMGH212.48 ± 0.40 fg0.26 ± 0.01 d–f285.89 ± 3.89 a–d7.81 ± 0.21 d–h0.74 ± 0.01 a–e48.30 ± 2.11 d–g
TUTGMGH311.59 ± 0.01 g–k0.19 ± 0.02 h–j277.25 ± 5.98 a–f6.12 ± 0.44 g–j0.72 ± 0.01 a–i63.80 ± 7.59 b–e
TUTGMGH414.81 ± 0.07 bc0.33 ± 0.0001 b285.99 ± 0.27 a–d9.09 ± 0.01 b–d0.75 ± 0.001 abc44.54 ± 0.13 h–j
TUTGMGH510.62 ± 0.12 j–m0.18 ± 0.03 h–l261.91 ± 21.91 d–g9.84 ± 2.46 cd0.67 ± 0.06 g–j65.69 ± 16.51 b–d
TUTGMGH611.81 ± 0.01 g–i0.30 ± 0.03 c290.18 ± 0.66 ab7.97 ± 0.001 c–g0.76 ± 0.003 ab40.49 ± 3.49 ij
TUTGMGH711.26 ± 0.02 h–m0.27 ± 0.003 cd290.69 ± 3.60 ab8.29 ± 0.004 b–f0.75 ± 0.01 a–c41.29 ± 0.54 ij
TUTGMGH816.16 ± 0.63 a0.39 ± 0.03 a285.08 ± 0.25 a–e12.62 ± 0.01 a0.76 ± 0.003 ab41.06 ± 1.20 ij
TUTGMGH913.05 ± 0.10 ef0.21 ± 0.01 g–i266.68 ± 5.76 b–h7.40 ± 0.04 c–h0.70 ± 0.01 b–j62.08 ± 2.23 b–f
TUTGMGH1012.44 ± 0.31 fg0.24 ± 0.01 e–g271.05 ± 1.85 a–f8.12 ± 0.35 c–f0.71 ± 0.01 a–i53.08 ± 1.38 b–i
TUTGMGH1116.18 ± 0.01 a0.39 ± 0.001 a286.22 ± 0.18 a–d10.11 ± 0.01 b0.76 ± 0.001 ab41.57 ± 0.11 ij
TUTGMGH129.03 ± 0.73 o0.14 ± 0.002 lm260.12 ± 9.90 e–g6.01 ± 0.06 h–j0.67 ± 0.02 f–j62.60 ± 5.87 b–f
TUTGMGH1311.78 ± 0.74 g–j0.23 ± 0.01 e–g274.35 ± 1.67 a–g8.74 ± 0.10 b–e0.70 ± 0.001 a–i50.58 ± 0.47 e–j
TUTGMGH1410.94 ± 0.00 h–m0.27 ± 0.001 c–e283.46 ± 7.89 a–e8.38 ± 1.22 b–f0.74 ± 0.02 a–d40.83 ± 0.16 ij
TUTGMGH159.25 ± 0.04 no0.13 ± 0.01 mn243.343 ± 10.34 gh7.19 ± 1.25 d–i0.63 ± 0.02 j71.59 ± 6.07 b
TUTGMGH1610.15 ± 0.08 mn0.17 ± 0.003 i–l263.78 ± 3.02 c–g7.09 ± 0.13 e–i0.69 ± 0.01 c–j58.43 ± 1.51 c–g
TUTGMGH1710.96 ± 0.38 h–m0.25 ± 0004 d–f288.84 ± 3.23 a–c8.41 ± 0.03 b–f0.76 ± 0.01 ab43.13 ± 1.53 ij
TUTGMGH187.76 ± 0.08 p0.15 ± 0.0001 k–m281.28 ± 0.91 a–f7.24 ± 0.002 c–i0.71 ± 0.002 a–i51.77 ± 0.57–i
TUTGMGH1911.44 ± 0.36 g–l0.28 ± 0.003 cd293.69 ± 2.53 a8.67 ± 0.32 b–e0.77 ± 0.02 a41.01 ± 0.85 ij
TUTGMGH207.86 ± 0.02 p0.21 ± 0.01 k–n294.82 ± 3.90 a7.84 ± 0.06 d–h0.76 ± 0.01 ab37.63 ± 1.68 j
TUTGMGH2110.40 ± 0.29 lm0.15 ± 0.002 k–m230.75 ± 16.97 h6.12 ± 0.002 g–j0.61 ± 0.04 e–j70.88 ± 2.75 bc
TUTGMGH2215.71 ± 0.35 ab0.30 ± 0.0014 c272.51 ± 2.23 a–g7.79 ± 0.11 d–h0.71 ± 0.07 a–i52.62 ± 0.54 e–i
TUTGMGH2312.04 ± 0.29 f–h0.25 ± 0.02 d–f276.83 ± 6.81 a–f8.34 ± 0.02 b–f0.76 ± 0.004 ab47.90 ± 2.15 g–j
TUTGMGH2413.57 ± 0.42 de0.21 ± 0.002 gh262.06 ± 4.01 b–g7.91 ± 0.16–h0.67 ± 0.01 f–j63.60 ± 1.42 b–e
TUTGMGH2513.07 ± 0.19 ef0.18 ± 0.002 h–k265.45 ± 1.68 b–g6.49 ± 0.04 f–j0.66 ± 0.01 h–j71.43 ± 1.26 b
TUTGMGH2610.58 ± 0.19 j–l0.11 ± 0.001 n209.91 ± 3.81 i4.80 ± 0.03 jk0.53 ± 0.010 j97.09 ± 2.40 a
TUTGMGH2711.46 ± 0.01 g–l0.20 ± 0.001 g–i245.10 ± 20.48 gh7.40 ± 0.54 d–h0.64 ± 0.06 j56.32 ± 0.23 d–h
TUTGMGH2811.403 ± 0.08 g–l0.22 ± 0.002 fg279.53 ± 0.97 a–f7.18 ± 0.05 d–i0.73 ± 0.002 a–h50.81 ± 0.70 f–i
TUTGMGH2910.67 ± 0.17 i–m0.23 ± 0.001 fg279.44 ± 0.07 a–f8.24 ± 0.50 b–f0.74 ± 0.02 a–f46.63 ± 0.63 d–j
TUTGMGH3014.74 ± 0.71 bc0.20 ± 0.002 g–i259.90 ± 6.45 e–g7.79 ± 0.47 d–h0.64 ± 0.02 j72.20 ± 3.08 b
TUTGMGH3111.49 ± 0.28 g–l0.18 ± 0.001 h–l265.91 ± 8.97 b–g7.68 ± 0.57 d–h0.68 ± 0.02 d–j64.15 ± 0.68 b–e
Bradyrhizobium
strain WB74
15.59 ± 0.03 bc0.37 ± 0.001 a279.293 ± 0.24 a–f12.10 ± 0.01 a0.75 ± 0.001 a–d42.39 ± 0.18 ij
Uninoculated2.64 ± 0.26 q0.07 ± 0.0002 o293.67 ± 0.69 a3.58 ± 0.01 i0.76 ± 0.019 ab40.43 ± 4.08 ij
5 mM KNO314.47 ± 0.53 cd0.21 ± 0.001 g–i256.56 ± 4.31 fg8.81 ± 0.29 b–e0.72 ± 0.002 a–i70.34 ± 2.60 bc
F-statistics59.32 **46.96 **6.66 ***9.72 ***6.99 ***12.68 **
Table 2. Plant growth, shoot C accumulation, and δ13C of soybean inoculated with different rhizobial isolates. Values (mean ± S.E.) followed by dissimilar letters are significant at ** p ≤ 0.01 or *** p ≤ 0.001.
IsolatesShoot Dry MatterRoot Dry MatterTotal BiomassC ConcentrationC Contentδ13CC:N Ratio
g Plant−1g Plant−1g Plant−1%g Plant−1g·g−1
TUTGMGH11.72 ± 0.09 a–d0.64 ± 0.03 b–e2.36 ± 0.13 bc43.30 ± 0.05 f–h74.48 ± 4.05 ab−27.52 ± 0.01 e–i18.31 ± 0.04 c–g
TUTGMGH21.44 ± 0.03 c–h0.50 ± 0.05 c–g1.94 ± 0.07 c–k43.27 ± 0.03 f–i62.16 ± 1.22 b–k−27.95 ± 0.02 mn17.99 ± 0.03 c–i
TUTGMGH31.74 ± 0.09 a–c0.51 ± 0.01 c–g2.25 ± 0.11 c–f43.42 ± 0.28 d–g75.58 ± 4.29 bc−27.51 ± 0.01 d–h18.59 ± 0.18 c–g
TUTGMGH41.32 ± 0.23 e–l0.37 ± 0.01 f–h1.69 ± 0.26 h–l42.99 ± 0.13 ij56.83 ± 10.89 d–m−27.65 ± 0.06 h–k17.40 ± 0.02 e–l
TUTGMGH51.22 ± 0.05 h–l0.35 ± 0.01 gh1.57 ± 0.05 g–k43.37 ± 0.06 e–g52.92 ± 2.07 h–m−28.11 ± 0.03 no17.33 ± 0.11 e–l
TUTGMGH61.49 ± 0.07 c–j0.85 ± 0.18 b2.33 ± 0.19 b–d43.81 ± 0.09 bc65.14 ± 3.01 b–j−27.74 ± 0.03 j–l17.55 ± 0.27 d–l
TUTGMGH71.54 ± 0.01 b–i0.50 ± 0.04–g2.03 ± 0.03 c–h43.72 ± 0.03 b–d67.19 ± 0.35 c–g−28.07 ± 0.01 no15.57 ± 0.10 l
TUTGMGH81.27 ± 0.14 f–l0.45 ± 0.02 d–h1.59 ± 0.05 d–j42.82 ± 0.10 jk54.37 ± 6.13 g–m−28.13 ± 0.06 o16.54 ± 0.45 g–l
TUTGMGH91.61 ± 0.19 b–f0.62 ± 0.01 b–e2.23 ± 0.19 b–e43.27 ± 0.09 f–i69.64 ± 8.01 b–e−27.19 ± 0.04 a16.69 ± 0.10 f–l
TUTGMGH101.08 ± 0.02 l0.39 ± 0.01 e–h1.47 ± 0.01 l–n42.76 ± 0.016 jk46.04 ± 0.86 lm−27.67 ± 0.03 h–l16.17 ± 0.10 h–m
TUTGMGH111.53 ± 0.05 b–i0.37 ± 0.02 f–h1.90 ± 0.04 d–k43.69 ± 0.11 b–d66.85 ± 2.11 c–g−27.25 ± 0.02 ab17.07 ± 0.28 e–l
TUTGMGH121.38 ± 0.03 d–k0.57 ± 0.02 c–g1.95 ± 0.05 c–k43.44 ± 0.02 d–g59.81 ± 1.40 i–m−27.76 ± 0.07 j–l19.54 ± 0.24 cd
TUTGMGH131.21 ± 0.08 i–l0.52 ± 0.002 c–g1.73 ± 0.08 g–l42.86 ± 0.011 j51.86 ± 3.23 g–k−27.69 ± 0.01 i–l21.54 ± 0.07 b
TUTGMGH140.45 ± 0.05 mn0.23 ± 0.01 h0.68 ± 0.05 n43.66 ± 0.11 b–e19.44 ± 2.42 mn−27.60 ± 0.05 g–j19.86 ± 1.04 bc
TUTGMGH151.23 ± 0.09 g–l0.61 ± 0.003 c–f1.84 ± 0.09 e–l43.45 ± 0.09 d–g53.43 ± 3.96 h–l−27.38 ± 0.09 b–f19.87 ± 0.17 bc
TUTGMGH161.54 ± 0.03 b–i0.61 ± 0.01 c–f2.15 ± 0.04 c–g43.01 ± 0.13 h–j66.24 ± 1.60 b–i−27.85 ± 0.01 lm16.04 ± 0.09 i–l
TUTGMGH171.57 ± 0.01 b–h0.67 ± 0.08 b–d1.90 ± 0.40 c–f43.56 ± 0.01 c–f68.25 ± 0.28 b–g−27.40 ± 0.02 b–f18.78 ± 0.36 bcd
TUTGMGH180.72 ± 0.01 m0.42 ± 0.05 d–h1.14 ± 0.04 n42.53 ± 0.35 kl30.48 ± 0.38 no−27.97 ± 0.05 m–o18.67 ± 0.37 c–f
TUTGMGH191.56 ± 0.07 b–i0.60 ± 0.01 c–f2.16 ± 0.06 c–h43.32 ± 0.07 fg67.43 ± 2.83 b–h−27.35 ± 0.02 a–e17.68 ± 2.09 d–k
TUTGMGH201.62 ± 0.04 b–f0.61 ± 0.03 c–f2.23 ± 0.07 c–f43.81 ± 0.03 bc70.97 ± 1.74 a–d−27.82 ± 0.03 k–m15.68 ± 0.68 kl
TUTGMGH211.99 ± 0.10 a0.72 ± 0.02 bc2.70 ± 0.12 ab42.77 ± 0.03 jk84.98 ± 4.38 a−27.37 ± 0.03 b–f17.05 ± 0.10 e–l
TUTGMGH221.17 ± 0.09 j–l0.64 ± 0.09 b–e1.80 ± 0.15 f–l41.88 ± 0.06 m48.87 ± 3.73 j–l−27.45 ± 0.05 c–g17.18 ± 0.04 e–l
TUTGMGH231.55 ± 0.10 c–g0.52 ± 0.07 c–g2.07 ± 0.15 c–h43.35 ± 0.15 e–g70.75 ± 2.02 a–d−28.44 ± 0.04 q16.03 ± 1.29 i–l
TUTGMGH241.61 ± 0.02 b–f0.51 ± 0.12 c–g2.11 ± 0.11 c–i44.42 ± 0.09 a71.36 ± 0.84 a–d−27.24 ± 0.01 ab18.61 ± 0.36 e–g
TUTGMGH251.30 ± 0.03 e–k0.61 ± 0.05 c–f1.91 ± 0.02 d–k42.43 ± 0.05 l55.02 ± 1.38 e–l−28.29 ± 0.04 p15.91 ± 0.50 j–l
TUTGMGH260.60 ± 0.32 mn0.60 ± 0.23 c–f1.20 ± 0.44 mn43.21 ± 0.12 g–i26.00 ± 13.95 mn−27.33 ± 0.02 a–c16.87 ± 0.58 e–l
TUTGMGH271.48 ± 0.15 c–j0.53 ± 0.02 c–g2.00 ± 0.14 c–j42.84 ± 0.04 j63.25 ± 6.52 b–j−27.34 ± 0.01 a–d16.86 ± 0.58 e–l
TUTGMGH281.54 ± 0.15 b–i0.58 ± 0.09 c–g2.12 ± 0.20 c–h43.90 ± 0.03 b67.76 ± 6.50 b–h−27.54 ± 0.01 f–i17.55 ± 0.29 d–l
TUTGMGH291.48 ± 0.02 c–k0.45 ± 0.01 d–h1.93 ± 0.01 c–k44.30 ± 0.02 a65.56 ± 0.74 b–h−27.74 ± 0.01 j–l17.54 ± 0.67 d–l
TUTGMGH301.58 ± 0.09 b–f0.72 ± 0.05 bc2.30 ± 0.04 b–d43.83 ± 0.01 bc69.23 ± 3.79 b–f−27.66 ± 0.10 h–k17.84 ± 0.13 d–j
TUTGMGH311.13 ± 0.04 kl0.41 ± 0.12–h1.54 ± 0.07 k–m42.84 ± 0.04 j48.26 ± 1.83 k–m−27.34 ± 0.11 a–d16.86 ± 0.58 e–l
Bradyrhizobium strain WB741.07 ± 0.001 l0.57 ± 0.04 c–g1.64 ± 0004 i–m43.88 ± 0.01 b46.95 ± 0.02 l−29.55 ± 0.06 r21.59 ± 0.08 b
Uninoculated0.33 ± 0.01 n0.22 ± 0.07 h0.54 ± 0.07 o40.15 ± 0.02 n13.12 ± 0.30 n−27.77 ± 0.09 j–l18.15 ± 0.98 c–i
5 mM KNO31.85 ± 0.07 ab1.13 ± 0.08 a2.97 ± 0.07 a41.77 ± 0.01 m77.14 ± 2.78 ab−27.75 ± 0.01 j–l23.59 ± 0.1.71 a
F-statistics13.50 **5.74 ***15.74 **68.00 **13.18 **70.00 **8.90 ***
Table 3. Nodulation, relative symbiotic effectiveness, and N fixation of soybeans inoculated with different rhizobial isolates. Values (mean ± S.E.) followed by dissimilar letters are significant at ** p ≤ 0.01 or *** p ≤ 0.001, NA = not applicable.
IsolatesNodule
Number
Nodule Fresh WeightRelative
Symbiotic
Effectiveness
N ConcentrationN Contentδ15NN-Fixed
per Plant g Plant−1%%g Plant−1g Plant−1
TUTGMGH119 ± 0.88 h–j0.64 ± 0.01 a161 ± 8.63 ab2.36 ± 0.01 f–i4.07 ± 0.23 b–e−2.02 ± 0.02 f–i3.82 ± 0.23 b–e
TUTGMGH210 ± 0.58 k0.52 ± 0.003 a–c134 ± 2.55 b–i2.41 ± 0.02 d–i3.46 ± 0.06 c–h−2.08 ± 0.05 f–k3.21 ± 0.06 c–h
TUTGMGH337 ± 1.15 ab0.44 ± 0.02 c–f163 ± 8.63 ab2.25 ± 0.02 g–i3.91 ± 0.19 b–f−1.76 ± 0.05 d3.66 ± 0.19 b–f
TUTGMGH430 ± 1.15 b–e0.61 ± 0.01 ab124 ± 24.07 d–j2.53 ± 0.03 b–h3.36 ± 0.70 c–h−2.15 ± 0.05 g–l3.11 ± 0.70 c–h
TUTGMGH525 ± 6.35 e–i0.34 ± 0.002 f–i114 ± 4.32 f–j2.52 ± 0.03 b–h3.07 ± 0.14 f–h−1.94 ± 0.02 d–g2.82 ± 0.14 f–h
TUTGMGH618 ± 0.58 h–j0.52 ± 0.001 bc139 ± 6.14 b–h2.60 ± 0.01 b–f3.87 ± 0.18 b–f−1.95 ± 0.02 d–g3.62 ± 0.18 b–f
TUTGMGH720 ± 6.69 g–j0.42 ± 0.02 c–g144 ± 0.82 b–g2.72 ± 0.03 a–c4.18 ± 0.03 a–d−2.28 ± 0.01 j–l3.93 ± 0.03 a–d
TUTGMGH824 ± 1.73–j0.44 ± 0.01 c–f119 ± 1.49 e–j2.61 ± 0.07 b–f3.31 ± 0.40 d–h−2.35 ± 0.01 l3.06 ± 0.40 d–h
TUTGMGH935 ± 5.77 a–c0.51 ± 0.10 b–d150 ± 17.59 b–e2.59 ± 0.02 b–f4.16 ± 0.45 a–d−2.17 ± 0.02 g–l3.91 ± 0.45 a–d
TUTGMGH1016 ± 0.58 jk0.43 ± 0.01 c–f101 ± 1.89 j2.61 ± 0.04 b–f2.81 ± 0.05 gh−1.76 ± 0.02 d2.56 ± 0.05 gh
TUTGMGH1128 ± 0.88 c–g0.43 ± 0.003 c–f143 ± 4.32 b–g2.59 ± 0.06 b–f3.96 ± 0.15 b–f−2.31 ± 0.03 kl3.71 ± 0.15 b–f
TUTGMGH1234 ± 0.33 bd0.56 ± 0.01 ab129 ± 2.97 c–j2.27 ± 0.05 g–i3.13 ± 0.11 e–h−2.18 ± 0.01 g–l2.88 ± 0.11 e–h
TUTGMGH1330 ± 1.15 b–e0.40 ± 0.03 d–h133 ± 7.01 g–j2.33 ± 0.08 f–i2.79 ± 0.07 gh−2.13 ± 0.05 g–l2.54 ± 0.07 gh
TUTGMGH1424 ± 2.03 e–j0.36 ± 0.04 f–h42 ± 5.13 k2.23 ± 0.21 hi0.99 ± 0.16 ij−1.26 ± 0.03 c0.75 ± 0.16 j
TUTGMGH1526 ± 6.43 d–h0.40 ± 0.03 d–h115 ± 8.63 f–j2.28 ± 0.03 g–i2.81 ± 0.25 gh−2.16 ± 0.02 g–l2.56 ± 0.25 gh
TUTGMGH1620 ± 0.58 g–j0.43 ± 0.10 c–f144 ± 3.24 b–g2.70 ± 0.01 a–d4.16 ± 0.10 a–d−2.64 ± 0.28 m3.91 ± 0.10 a–d
TUTGMGH1725 ± 3.06 e–g0.43 ± 0.01 c–f146 ± 0.627 b–g2.23 ± 0.02 g–i3.50 ± 0.02 c–h−2.11 ± 0.05 g–l3.25 ± 0.02 c–h
TUTGMGH1820 ± 3.76 g–j0.19 ± 0.01 jk67 ± 0.82 j2.17 ± 0.11 i1.56 ± 0.01 i−2.14 ± 0.01 g–l1.31 ± 0.10 i
TUTGMGH1922 ± 0.58 e–j0.55 ± 0.03 ab145 ± 6.21 b–g2.78 ± 0.06 ab4.33 ± 0.24 a–c−2.01 ± 0.03 e–h4.08 ± 0.24 a–c
TUTGMGH2043 ± 1.45 a0.38 ± 0.01 e–h151 ± 3.77 b–e2.41 ± 0.11 d–i3.90 ± 0.15 b–f−2.29 ± 0.04 j–l3.65 ± 0.15 b–f
TUTGMGH2127 ± 0.33 c–h0.50 ± 0.01 b–e186 ± 9.51 a2.53 ± 0.03 b–g5.02 ± 0.23 a−2.23 ± 0.03 h–l4.77 ± 0.23 a
TUTGGH2220 ± 0.88 g–j0.39 ± 0.04 e–i109 ± 8.24 h–j2.34 ± 0.10 f–i2.71 ± 0.14 gh−2.23 ± 0.01 h–l2.46 ± 0.14 gh
TUTGMGH2323 ± 0.33 e–j0.51 ± 0.01 b–e153 ± 4.59 b–d2.92 ± 0.04 a4.77 ± 0.12 ab−2.65 ± 0.24 m4.53 ± 0.12 ab
TUTGMGH2421 ± 0.33 f–j0.38 ± 0.03 d–h150 ± 1.89 b–e2.39 ± 0.04 f–i3.84 ± 0.10 b–f−1.26 ± 0.03 c3.59 ± 0.10 b–f
TUTGMGH2535 ± 1.53 ab0.58 ± 0.01 ab121 ± 2.97 b–j2.69 ± 0.07 a–e3.49 ± 0.01 c–h−2.79 ± 0.04 m3.24 ± 0.01 c–h
TUTGMGH2616 ± 0.88 i–k0.18 ± 0.05 k56 ± 29.93 k2.46 ± 0.16 c–i1.57 ± 0.92 i−2.05 ± 0.001 f–j1.32 ± 0.92 i
TUTGMGH2716 ± 1.73 jk0.24 ± 0.03 i–k138 ± 14.30 b–i2.37 ± 0.16 f–i3.47 ± 0.35 c–h−2.08 ± 0.03 f–k3.22 ± 0.35 c–h
TUTGMGH2829 ± 1.15 b–f0.31 ± 0.01 g–i144 ± 13.75 b–g2.36 ± 0.15 f–i3.64 ± 0.41 c–g−1.86 ± 0.05 d–f3.39 ± 0.41 c–g
TUTGMGH2920 ± 0.33 g–j0.43 ± 0.002 c–f138 ± 1.62 b–i2.43 ± 0.20 c–i3.60 ± 0.29 c–g−2.10 ± 0.05 f–k3.35 ± 0.29 c–g
TUTGMGH3021 ± 1.45 f–g0.40 ± 0.08 d–h147 ± 8.09 b–f2.46 ± 0.02 c–i3.88 ± 0.20 b–f−1.79 ± 0.02 de3.63 ± 0.20 b–f
TUTGMGH3116 ± 0.58 jk0.31 ± 0.01 g–i105 ± 4.05 ij2.37 ± 0.16 f–i2.68 ± 0.29 gh−2.08 ± 0.04 f–k2.43 ± 0.29 gh
Bradyrhizbium strain WB7430 ± 0.33 b–e0.29 ± 0.01 h–j100 ± 0.00 j2.40 ± 0.16 e–i2.57 ± 0.17 h−2.26 ± 0.04 i–l2.32 ± 0.17 h
UninoculatedNANANA1.13 ± 0.05 k0.37 ± 0.02 j+1.55 ± 0.01 bNA
5 mM KNO3NANANA1.39 ± 0.02 j2.57 ± 0.12 g+2.16 ± 0.06 aNA
F-statistics8.05 ***9.95 ***9.90 ***14.97 **12.96 **194.76 **12.96 **
Table 4. Tolerance of introduced soybean rhizobial isolates to different levels of temperature, and NaCl and pH indicators. Scoring was completed as +++ = full growth, ++ = moderate growth, + = weak growth, and − no growth, as illustrated in Figure S1.
IsolatesTemperature
°C
Salinity (NaCl)
%
2528303740450.010.5012345
TUTGMGH1+++++++++++++++++++
TUTGMGH2++++++++++++++++++++++
TUTGMGH3+++++++++++++++++++++++
TUTGMGH4+++++++++++++++++++++
TUTGMGH5++++++++++++++
TUTGMGH6++++++++++++++++++++++++
TUTGMGH7++++++++++++++++++++++++++++++
TUTGMGH8+++++++++++++++++++++++++++++
TUTGMGH9+++++++++++++++++++++++++++
TUTGMGH10+++++++++++++++++++++++++++++
TUTGMGH11+++++++++++++++++
TUTGMGH12+++++++++++++++++++++++
TUTGMGH13+++++++++++++++++++++++++++
TUTGMGH14++++++++++++++++++++++
TUTGMGH15+++++++++++++++++++++++++
TUTGMGH16+++++++++++++++++++
TUTGMGH17++++++++++++++++++++++
TUTGMGH18++++++++++++++++++++++++
TUTGMGH19+++++++++++++++++++++++++++
TUTGMGH20++++++++++++++++++++++++++
TUTGMGH21+++++++++++++++++++++++++++++
TUTGMGH22+++++++++++++++++++++++++++++++++++
TUTGMGH23+++++++++++++++++++++++
TUTGMGH24+++++++++++++++
TUTGMGH25++++++++++++++++++
TUTGMGH26++++++++++++++++++++++++++++
TUTGMGH27++++++++++++++++++++++++++++++++
TUTGMGH28+++++++++++++++++++++++++
TUTGMGH29++++++++++++++++++++
TUTGMGH30++++++++++++++++++++++
TUTGMGH31+++++++++++++++++++++++++++++++
Table 5. Tolerance of isolates to drought and IAA-producing properties of rhizobial isolates nodulating soybeans. Values followed by dissimilar letters are significant at ** p ≤ 0.01. OD < 0.30 is highly sensitive to drought; OD = 0.30–0.39 is sensitive; OD = 0.40–0.50 is tolerant; and OD > 0.5 is highly tolerant.
IsolatesDroughtIAA
Control5%15%30%(µg mL−1)
TUTGMGH10.170 ± 0.012 i–k0.204 ± 0.003 f–h0.084 ± 0.001 lm0.078 ± 0.0003 e–h8.59 ± 0.03 d
TUTGMGH20.333 ± 0.006 k–m0.142 ± 0.0010.088 ± 0.005 j–l0.065 ± 0.006 gh6.52 ± 0.15 f
TUTGMGH30.262 ± 0.001 h–j0.258 ± 0.002 de0.176 ± 0.004 b0.069 ± 0.002 fgh9.92 ± 0.10 b
TUTGMGH40.330 ± 0.036 d–g0.210 ± 0.001 fg0.077 ± 0.001 mn0.075 ± 0.0003 e–h8.59 ± 0.47 d
TUTGMGH50.238 ± 0.023 ij0.103 ± 0.001 k–n0.144 ± 0.003 e0.083 ± 0.002 d–h9.39 ± 0.16 bc
TUTGMGH60.634 ± 0.048 b0.256 ± 0.005 de0.114 ± 0.001 h0.083 ± 0.002 d–h8.74 ± 0.054 cd
TUTGMGH70.225 ± 0.003 i–k0.131 ± 0.001 i–m0.110 ± 0.002 h0.084 ± 0.001 d–h8.49 ± 0.15 de
TUTGMGH80.282 ± 0.0196 f–i0.145 ± 0.0050.135 ± 0.006 ef0.086 ± 0.002 d–f9.85 ± 0.01 b
TUTGMGH90.526 ± 0.015 c0.523 ± 0.003 a0.157 ± 0.009 d0.067 ± 0.0003 f–h8.30 ± 0.13 de
TUTGMGH100.277 ± 0.003 f–i0.377 ± 0.067 c0.171 ± 0.003 bc0.154 ± 0.026 b4.52 ± 0.03 g
TUTGMGH110.137 ± 0.002 mn0.099 ± 0.001 l–n0.085 ± 0.002 k–m0.106 ± 00.004 c8.65 ± 0.11 d
TUTGMGH120.639 ± 0.019 a0.424 ± 0.002 b0.243 ± 0.001 a0.164 ± 0.001 a8.11 ± 0.64 de
TUTGMGH130.338 ± 0.007 d–f0.175 ± 0.0003 f–k0.165 ± 0.002 cd0.065 ± 0.002 h7.75 ± 0.10 e
TUTGMGH140.105 ± 0.002 n0.093 ± 0.0003 mn0.057 ± 0.0003 p0.089 ± 0.0003 c–e4.01 ± 0.07 gh
TUTGMGH150.307 ± 0.003 e–h0.082 ± 0.001 n0.072 ± 0.001 no0.085 ± 0.0003 d–g7.75 ± 0.05 e
TUTGMGH160.447 ± 0.003 d0.218 ± 0.0003 ef0.164 ± 0.001 cd0.098 ± 0.0003 cd11.37 ± 0.23 a
TUTGMGH170.350 ± 0.002 d–f0.172 ± 0.010 f–k0.106 ± 0.0003 hi0.041 ± 0.001 i8.49 ± 0.04 de
TUTGMGH180.203 ± 0.042 j–l0.096 ± 0.002 l–n0.127 ± 0.001 fg0.069 ± 0.001 f–h4.16 ± 0.37 gh
TUTGMGH190.223 ± 0.007 i–k0.461 ± 0.038 b0.124 ± 0.003 g0.142 ± 0.001 b4.69 ± 0.35 g
TUTGMGH200.314 ± 0.005 e–h0.128 ± 0.0003 i–n0.097 ± 0.001 ij0.075 ± 0.001 e–h3.00 ± 0.14 ij
TUTGMGH210.270 ± 0.061 g–j0.167 ± 0.006 g–j0.166 ± 0.005 cd0.101 ± 0.0123 cd6.35 ± 0.03 f
TUTGMGH220.266 ± 0.002 g–j0.086 ± 0.003 mn0.05 ± 0.001 q0.067 ± 0.0003 f–h8.06 ± 0.69 de
TUTGMGH230.265 ± 0.013 h–j0.176 ± 0.004 f–j0.081 ± 0.001 lm0.085 ± 0.00 d–14.48 ± 0.29 g
TUTGMGH240.156 ± 0.011 l–n0.127 ± 0.006 j–n0.090 ± 0.0003 j–l0.091 ± 0.003 c–e1.21 ± 0.14 k
TUTGMGH250.228 ± 0.012 i–k0.128 ± 0.001 i–n0.139 ± 0.003 e0.078 ± 0.001 e–h2.76 ± 0.04 jk
TUTGMGH260.258 ± 0.009 h–j0.161 ± 0.005 h–j0.096 ± 0.001 j0.090 ± 0.001 c–e0.98 ± 0.11 l
TUTGMGH270.235 ± 0.008 ij0.159 ± 0.003 h–j0.162 ± 0.001 cd0.074 ± 0.002 e–h3.02 ± 0.22 ij
TUTGMGH280.388 ± 0.002 de0.159 ± 0.003 h–j0.162 ± 0.001 cd0.074 ± 0.002 e–h2.14 ± 0.02 k
TUTGMGH290.269 ± 0.001 g–j0.105 ± 0.0003 k–n0.067 ± 0.001 o0.044 ± 0.004 i4.12 ± 0.07 gh
TUTGMGH300.227 ± 0.003 i–k0.282 ± 0.003 d0.094 ± 0.001 jk0.089 ± 0.001 c–e3.59 ± 0.26 hi
TUTGMGH310.257 ± 0.009 h–0.160 ± 0.004 h–j0.096 ± 0.001 j0.091 ± 0.001 c–e0.98 ± 0.11 l
F-statistics41.294 **62.881 **207.34 **22.857 **135.02 **
Table 6. Growth response of soybean isolates to pH levels. Values followed by dissimilar letters are significant at ** p ≤ 0.01 and *** p ≤ 0.001, N/A = not applicable.
Isolates45678.5pH Indicator (BTB)
TUTGHGM10.184 ± 0.002 k–m0.466 ± 0.008 b0.287 ± 0.079 de0.178 ± 0.006 l0.341 ± 0.055 d–hBlue
TUTGHGM20.208 ± 0.008 h–m0.151 ± 0.008 k0.169 ± 0.004 m–o0.250 ± 0.005 jk0.355 ± 0.004 d–gYellow
TUTGHGM30.514 ± 0.019 b0.452 ± 0.005 b0.277 ± 0.009 d–f0.245 ± 0.004 jk0.284 ± 0.001 g–jYellow
TUTGHGM40.479 ± 0.062 b0.349 ± 0.005 c0.440 ± 0.009 b0.429 ± 0.004 bc0.475 ± 0.060 bBlue
TUTGHGM50.158 ± 0.008 m–o0.240 ± 0.002 fg0.158 ± 0.002 no0.237 ± 0.003 jk0.258 ± 0.010 g–jBlue
TUTGHGM60.230 ± 0.015 h–l0.260 ± 0.026 ef0.242 ± 0.011 e–j0.238 ± 0.007 jk0.417 ± 0.062 b–dYellow
TUTGHGM70.181 ± 0.002 lm0.153 ± 0.002 k0.242 ± 0.0002 e–j0.222 ± 0.003 j–l0.242 ± 0.009 h–jBlue
TUTGHGM80.125 ± 0.005 no0.279 ± 0.002 e0.179 ± 0.004 l–o0.416 ± 0.006 b–d0.385 ± 0.063 b–fYellow
TUTGHGM90.585 ± 0.004 a0.697 ± 0.008 a0.556 ± 0.013 a0.504 ± 0.003 a0.388 ± 0.044 b–fYellow
TUTGHGM100.284 ± 0.045 fg0.334 ± 0.005 cd0.164 ± 0.007 no0.421 ± 0.101 b–d0.462 ± 0.0002 bcBlue
TUTGHGM110.217 ± 0.004 h–l0.199 ± 0.006 hi0.231 ± 0.004 f–k0.271 ± 0.005 h–j0.220 ± 0.006 jBlue
TUTGHGM120.423 ± 0.001 c0.326 ± 0.006 cd0.279 ± 0.002 d–f0.383 ± 0.009 c–e0.576 ± 0.005 aBlue
TUTGHGM130.260 ± 0.001 gh0.321 ± 0.005 d0.204 ± 0.010 h–n0.209 ± 0.007 kl0.320 ± 0.004 d–jYellow
TUTGHGM140.256 ± 0.001 g–i0.182 ± 0.015 j0.183 ± 0.002 k–o0.318 ± 0.010 f–h0.301 ± 0.012 e–jBlue
TUTGHGM150.328 ± 0.010 ef0.233 ± 0.006 gh0.256 ± 0.010 e–h0.447 ± 0.08 b0.240 ± 0.006 h–jYellow
TUTGHGM160.186 ± 0.010 j–m0.156 ± 0.002 k0.251 ± 0.003 e–i0.341 ± 0.090 e–g0.327 ± 0.019 d–iYellow
TUTGHGM170.330 ± 0.001 ef0.062 ± 0.002 o0.223 ± 0.003 j–l0.335 ± 0.010 e–g0.459 ± 0.060 bcBlue
TUTGHGM180.128 ± 0.004 no0.186 ± 0.001 ij0.073 ± 0.0004 p0.214 ± 0.002 j–l0.397 ± 0.059 b–eYellow
TUTGHGM190.351 ± 0.016 de0.329 ± 0.001 cd0.376 ± 0.004 c0.372 ± 0.007 d–f0.311 ± 0.031 e–jBlue
TUTGHGM200.341 ± 0.005 de0.209 ± 0.004 hi0.273 ± 0.002 e–g0.229 ± 0.002 j–l0.362 ± 0.010 c–fBlue
TUTGHGM210.190 ± 0.020 j–m0.126 ± 0.007 lm0.170 ± 0.010 m–o0.174 ± 0.007 l0.402 ± 0.013 b–dBlue
TUTGHGM220.240 ± 0.006 g–k0.095 ± 0.002 n0.144 ± 0.001 o0.264 ± 0.003 i–k0.268 ± 0.015 g–jBlue
TUTGHGM230.318 ± 0.005 ef0.225 ± 0.003 gh0.199 ± 0.001 i–n0.251 ± 0.005 jk0.230 ± 0.004 ijYellow
TUTGHGM240.175 ± 0.012 l–n0.134 ± 0.007 kl0.195 ± 0.006 j–o0.411 ± 0.001 b–d0.380 ± 0.005 b–fBlue
TUTGHGM250.192 ± 0.006 j–m0.143 ± 0.015 kl0.154 ± 0.005 no0.329 ± 0.002 e–g0.223 ± 0.006 ijBlue
TUTGHGM260.213 ± 0.004 h–l0.154 ± 0.008 k0.206 ± 0.004 h–n0.216 ± 0.007 j–l0.320 ± 0.015 e–jYellow
TUTGHGM270.113 ± 0.002 o0.109 ± 0.008 mn0.218 ± 0.0004 h–m0.225 ± 0.003 j–l0.461 ± 0.014 bcBlue
TUTGHGM280.384 ± 0.00001 cd0.232 ± 0.010 gh0.292 ± 0.002 de0.224 ± 0.007 j–l0.285 ± 0.018 f–jBlue
TUTGHGM290.204 ± 0.003 i–m0.153 ± 0.005 k0.187 ± 0.008 k–o0.225 ± 0.006 j–l0.302 ± 0.032 e–jYellow
TUTGHGM300.240 ± 0.020 g–j0.248 ± 0.007 fg0.326 ± 0.005 d0.311 ± 0.003 ghi0.420 ± 0.005 b–dYellow
TUTGHGM310.123 ± 0.002 no0.111 ± 0.008 mn0.216 ± 0.0004 h–m0.215 ± 0.003 j–l0.461 ± 0.014 bcYellow
F-statistics50.01 **268.21 **36.60 **26.49 **8.23 ***N/A
Disclaimer/Publisher’s Note: The statements, opinions and data contained in all publications are solely those of the individual author(s) and contributor(s) and not of MDPI and/or the editor(s). MDPI and/or the editor(s) disclaim responsibility for any injury to people or property resulting from any ideas, methods, instructions or products referred to in the content.

