Article

Comparative Transcriptome Analyses during the Vegetative Cell Cycle in the Mono-Cellular Organism Pseudokeronopsis erythrina (Alveolata, Ciliophora)

1
Guangzhou Key Laboratory of Subtropical Biodiversity and Biomonitoring, School of Life Science, South China Normal University, Guangzhou 510631, China
2
Pilot National Laboratory for Marine Science and Technology (Qingdao), Qingdao 266237, China
3
Institute of Microbial Ecology & Matter Cycle, School of Marine Sciences, Sun Yat-sen University, Zhuhai 519000, China
4
Southern Marine Science and Engineering Guangdong Laboratory (Zhuhai), Zhuhai 519000, China
5
School of Science, Mae Fah Luang University, Chiang Rai 57100, Thailand
*
Author to whom correspondence should be addressed.
These authors contributed equally to this work.
Microorganisms 2020, 8(1), 108; https://doi.org/10.3390/microorganisms8010108
Submission received: 30 October 2019 / Revised: 8 January 2020 / Accepted: 9 January 2020 / Published: 12 January 2020

Abstract

:
Studies focusing on molecular mechanisms of cell cycles have been lagging in unicellular eukaryotes compared to other groups. Ciliates, a group of unicellular eukaryotes, have complex cell division cycles characterized by multiple events. During their vegetative cell cycle, ciliates undergo macronuclear amitosis, micronuclear mitosis, stomatogenesis and somatic cortex morphogenesis, and cytokinesis. Herein, we used the hypotrich ciliate Pseudokeronopsis erythrina, whose morphogenesis has been well studied, to examine molecular mechanisms of ciliate vegetative cell cycles. Single-cell transcriptomes of the growth (G) and cell division (D) stages were compared. The results showed that (i) More than 2051 significantly differentially expressed genes (DEGs) were detected, among which 1545 were up-regulated, while 256 were down-regulated at the D stage. Of these, 11 randomly picked DEGs were validated by reverse transcription quantitative polymerase chain reaction (RT-qPCR); (ii) Enriched DEGs during the D stage of the vegetative cell cycle of P. erythrina were involved in development, cortex modifications, and several organelle-related biological processes, showing correspondence of molecular evidence to morphogenetic changes for the first time; (iii) Several individual components of molecular mechanisms of ciliate vegetative division, the sexual cell cycle and cellular regeneration overlap; and (iv) The P. erythrina cell cycle and division have the same essential components as other eukaryotes, including cyclin-dependent kinases (CDKs), cyclins, and genes closely related to cell proliferation, indicating the conserved nature of this biological process. Further studies are needed focusing on detailed inventory and gene interactions that regulate specific ciliated cell-phase events.

1. Introduction

The cell cycle is a series of processes during the life history of a cell that lead to growth and proliferation [1]. During its life history, a cell undergoes multiple rounds of division. Studying mechanisms of cell cycles, of which proliferation is a major part, is important for understanding cell cycle regulation, development, and cell biology [2,3,4,5]. In recent decades, cell cycles of different organisms have been examined in detail using a variety of molecular methods. For instance, cell division cycle-modulated genes in yeast [6], human cells [7], plant cells [8], and ciliated protozoa [9] have been identified and characterized using microarrays, cDNA-amplified fragment length polymorphism (AFLP), or deep RNA sequencing (RNA-Seq). Reverse transcription quantitative polymerase chain reaction (RT-qPCR), the “gold” standard method for mRNA quantification [10], has also been used to explore gene expression during the cell cycle [11]. Nonetheless, using any of these methods to investigate the molecular mechanisms of the cell cycle requires large numbers of synchronous cells [8]. However, this is nearly impossible to accomplish for most species of unicellular eukaryotes. Recent investigations have shown that results obtained from RNA-Seq and RT-qPCR analyses of single cells were comparable to those obtained from bulk samples [12,13]. Thus, these technologies can be used to study the gene expression and cell cycle regulation of unicellular eukaryotes. The cell cycle of unicellular eukaryotes is of interest because the process is inexorably linked to cell division in these organisms.
Ciliates, a group of unicellular eukaryotes, have been used extensively as model organisms to study a broad range of topics due to dual genome architecture, unique macronuclear genome characters (Figure 1), and complex morphology [14,15,16,17,18,19,20,21,22,23,24]. Recently, molecular events underlying the sexual cell cycle of the model ciliate Tetrahymena thermophila were examined. Using microarray and high-throughput sequencing, Xiong et al. [9] and Miao et al. [25] identified genes that were specifically up- or down-regulated in growing, starved, and conjugating cells. Knocking out the CYC2 cyclin gene revealed its crucial role in T. thermophila meiosis [26]. In a later study, Xu et al. [27] further researched the Cyc2p function and its precise regulation mechanism during the micronuclear elongation of T. thermophila.
Vegetative proliferation is asexual cell division in ciliates and occurs by binary fission. The vegetative cell cycle consists of three consecutive periods, i.e., growth (G), morphogenesis (S), and cell division (D) [14]. Two “sister cells”—the proter and the opisthe—are produced during the process of cell division, which occurs after duplication of organelles (cell morphogenesis). Morphogenetic studies have revealed rich morphological patterns during the process [38,39,40]. This is due to a multitude of events that occur during that time including macronuclear amitosis, micronuclear mitosis, cortical stomatogenesis, somatic cortex morphogenesis, and cytokinesis [14]. Molecular mechanisms underlying vegetative cell division of ciliates are largely unknown, with the exception of a study showing that Ca2+/CaM, p85, and RAN have important roles in the progression of cell division in Tetrahymena [40,41]. Ciliate cell division is more complex than that of other eukaryotes, comprising at least 4 types and 15 modes of stomatogenesis, and hence is of great significance for understanding the evolution of this process in eukaryotes [42].
Herein, we used the hypotrich Pseudokeronopsis erythrina to examine the molecular mechanisms of its vegetative cell division cycle. This is an atypical ciliate species with apokinetal stomatogenesis, whereby proliferation of kinetosomes occurs independently of the parental oral apparatus [15]. The vegetative cell cycle of this genus has been well investigated in morphogenetic studies [15,43]. Furthermore, the large cell size of P. erythrina (200 vs. 50 μm in Tetrahymena) is conducive to accurately identifying different stages of the vegetative cell cycle when using microscopy. Single-cell RNA-Seq and RT-qPCR methods were applied to identify key pathways and genes underlying vegetative cell division.

2. Materials and Methods

2.1. Cell Growth and Sorting

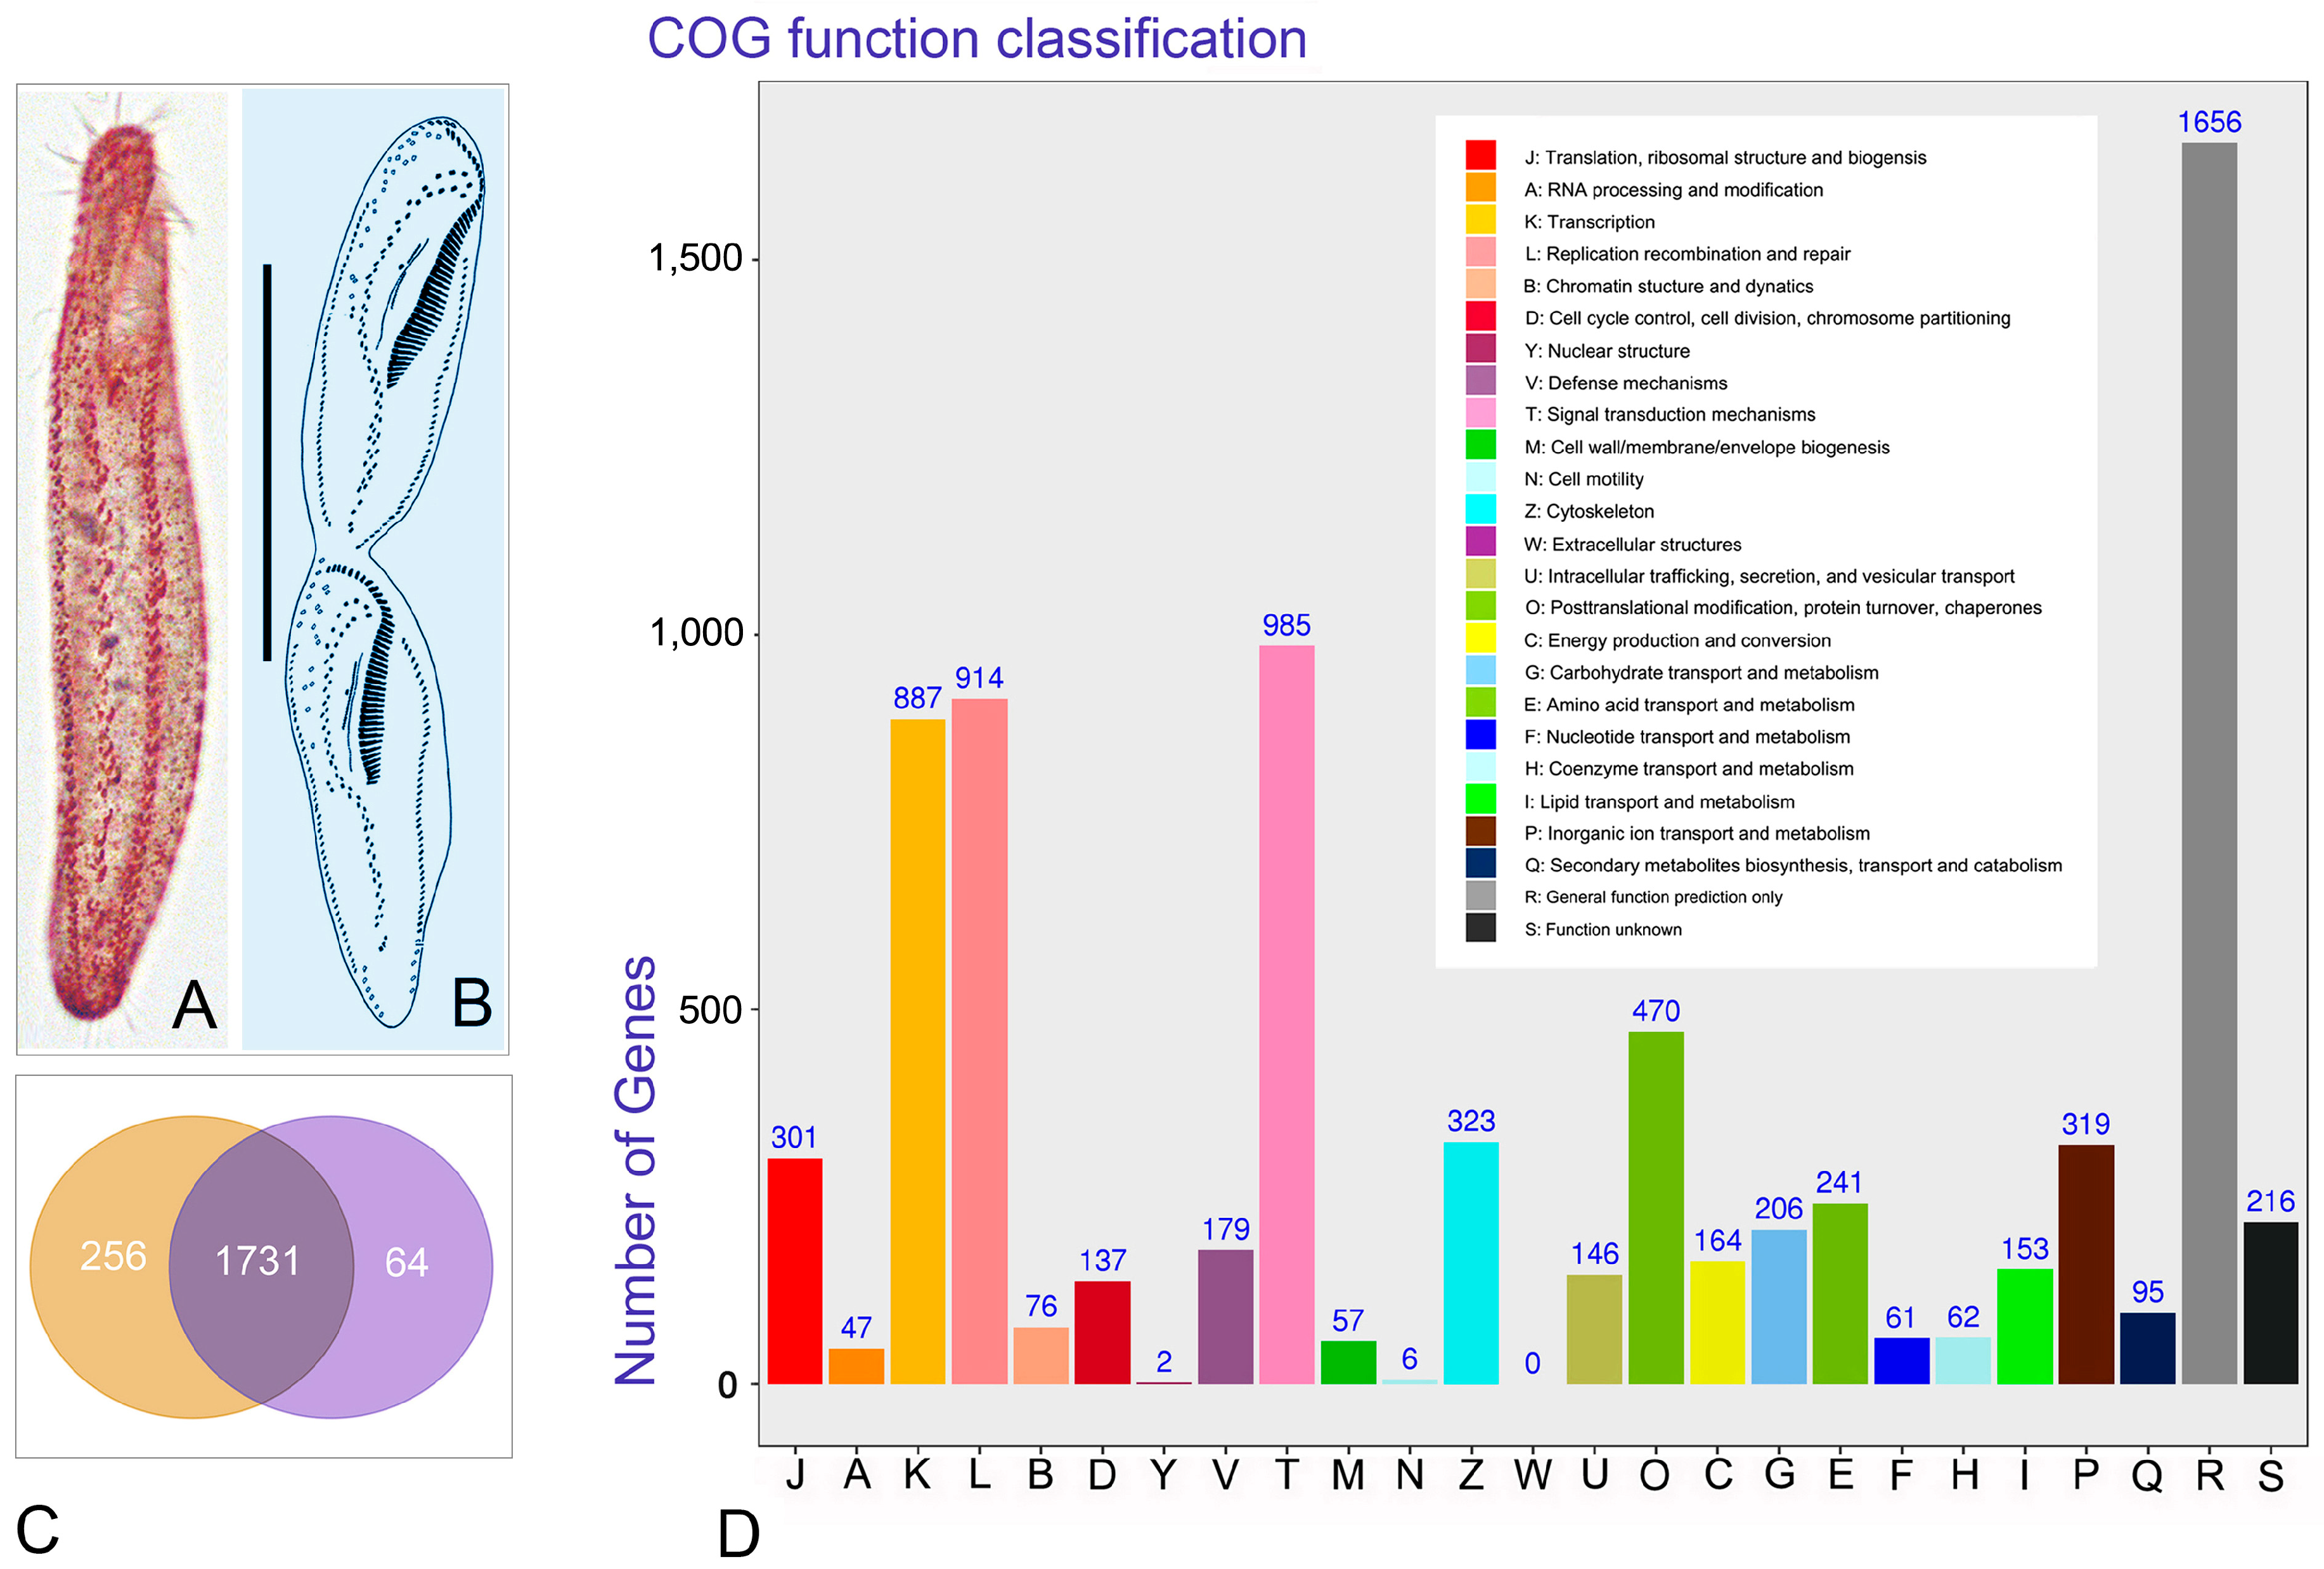
Pseudokeronopsis erythrina cells were sampled from the Pearl River estuary (22°41′ N; 113°38′ E), Guangdong, China, and then cultured at room temperature in artificial seawater with a rice grain to enrich the growth of bacteria [44]. We picked one cell at the cell division (D) stage in morphogenesis for each replicate and two individual cells at the growth (G) stage for each replicate, considering that cell volume at the D stage is nearly double that of a cell at the G stage (Figure 2A). The latter originated from the same cell 30 minutes after cell division. In order to reduce cell heterogeneity, three replicates were collected for each stage: G1, G2, G3 and D1, D2, D3. Each cell was washed five times with inactivated calcium and magnesium-free PBS buffer using a nuclease-free pipette and was then transferred to a nuclease-free Eppendorf tube with a minimum volume of liquid.

2.2. Single Cell cDNA Amplification and Library Construction

Each cell was placed into a tube containing 2 μL of cell lysis buffer (0.2% Triton X-100 and 2U μL/1 RNase inhibitor) and kept in a volume as low as possible (less than 5 μL). Collected cells were amplified using the Smart-Seq2 of SMARTer Ultra Low RNA Kit for Illumina sequencing [45]. The cDNA concentration was measured using a Qubit 3.0 Fluorometer (Life Technologies, Foster City, CA, USA).

2.3. Sequence Assembly and Analysis

Each single-cell library was sequenced (1 × 50 bases) using an Illumina HiSeq 2000 with replicate libraries of each type in the same lane. Raw reads were processed with the existing sequence grooming tool FastQC, assembled with Trinity v.2.1.1 [46] and aligned using Bowtie2 v2.2.3 [47]. Q30, N50, the GC content, and the sequence duplication level of clean data were calculated. The unigenes were annotated based on the following six databases: NCBI non-redundant protein sequence (nr) database, NCBI nucleotide sequence (nt/nr) database, PFAM, Clusters of Orthologous Groups (COG), Kyoto Encyclopedia of Genes and Genomes (KEGG), and Gene Ontology (GO), using BLAST with a cut off e-value of < 10−5. In order to ensure that all annotated genes were ciliate specific, we selected ciliates genes against annotated genes in the nr database using BlastX.

2.4. Differential Gene Expression

Expression levels were estimated as follows: cleaned reads were mapped back onto the assembled transcriptome and then the read count for each predicted gene was obtained from the mapping results and was normalized to reads per kb of exon model per million mapped reads (RPKM). Differential expression analysis of two samples was performed using DEGseq2 [48]. The p-value was adjusted using the q-value, which was defined as the multiple testing analog of p-value, and q-value < 0.05 and |log2 fold change (FC)| ≥ 1 were set as the threshold for differential expression. Variations in predicted gene expression levels were analyzed for specific comparisons that encompass two categories: (i) cells at the D stage and (ii) cells at the G stage. GO terms and KEGG pathway enrichment were used to analyze differentially expressed genes (DEGs) using the online tool OmicShare (http://www.omicshare.com/tools/). The threshold of the false discovery rate (FDR) was set at 0.05. For each group, the Euclidean distance was calculated according to the expression level of DEGs, taking the logarithm of the base 10, and then hierarchical clustering was performed using OmicShare tools to obtain the overall clustering results for each group.

2.5. Reverse Transcription Quantitative Polymerase Chain Reaction (RT-qPCR)

Cells of Pseudokeronopsis erythrina were collected as described above. Total RNA was extracted with an RNeasy Plus Micro Kit (Qiagen, Hilden, Germany). cDNA was generated using SuperScript® III Reverse Transcriptase (Life Technologies, Carlsbad, CA, USA). RT-qPCR primers were designed using Primer Premier 5.0 software (PREMIER Biosoft International, Palo Alto, CA, USA) and Primer-BLAST (http://blast.ncbi.nlm.nih.gov/) (Supplementary Table S1). RT-qPCR was performed on an Applied Biosystems® QuantStudio® 5 instrument (Applied Biosystems, Carlsbad, CA, USA), and the reaction was conducted in a 20 μL reaction system containing 10 μL of the QuantiNova SYBR Green PCR kit (Qiagen, Hilden, Germany), 10 μM of each primer, cDNA and nuclease-free water (Qiagen, Hilden, Germany). PCR cycling conditions were set as follows: 2 min at 95 °C, 40 cycles of 5 s at 95 °C, and 10 s at 60 °C. Three biological replicates were used for all experiments and for each biological replicate, and three technical replicates were employed [49]. The relative expression of each predicted gene was calculated by the comparative 2−ΔΔct method [50] with RpS6 used as the housekeeping gene [51].

3. Results

3.1. Transcriptome Sequencing, Assembly Evaluation and Annotation of Unigenes

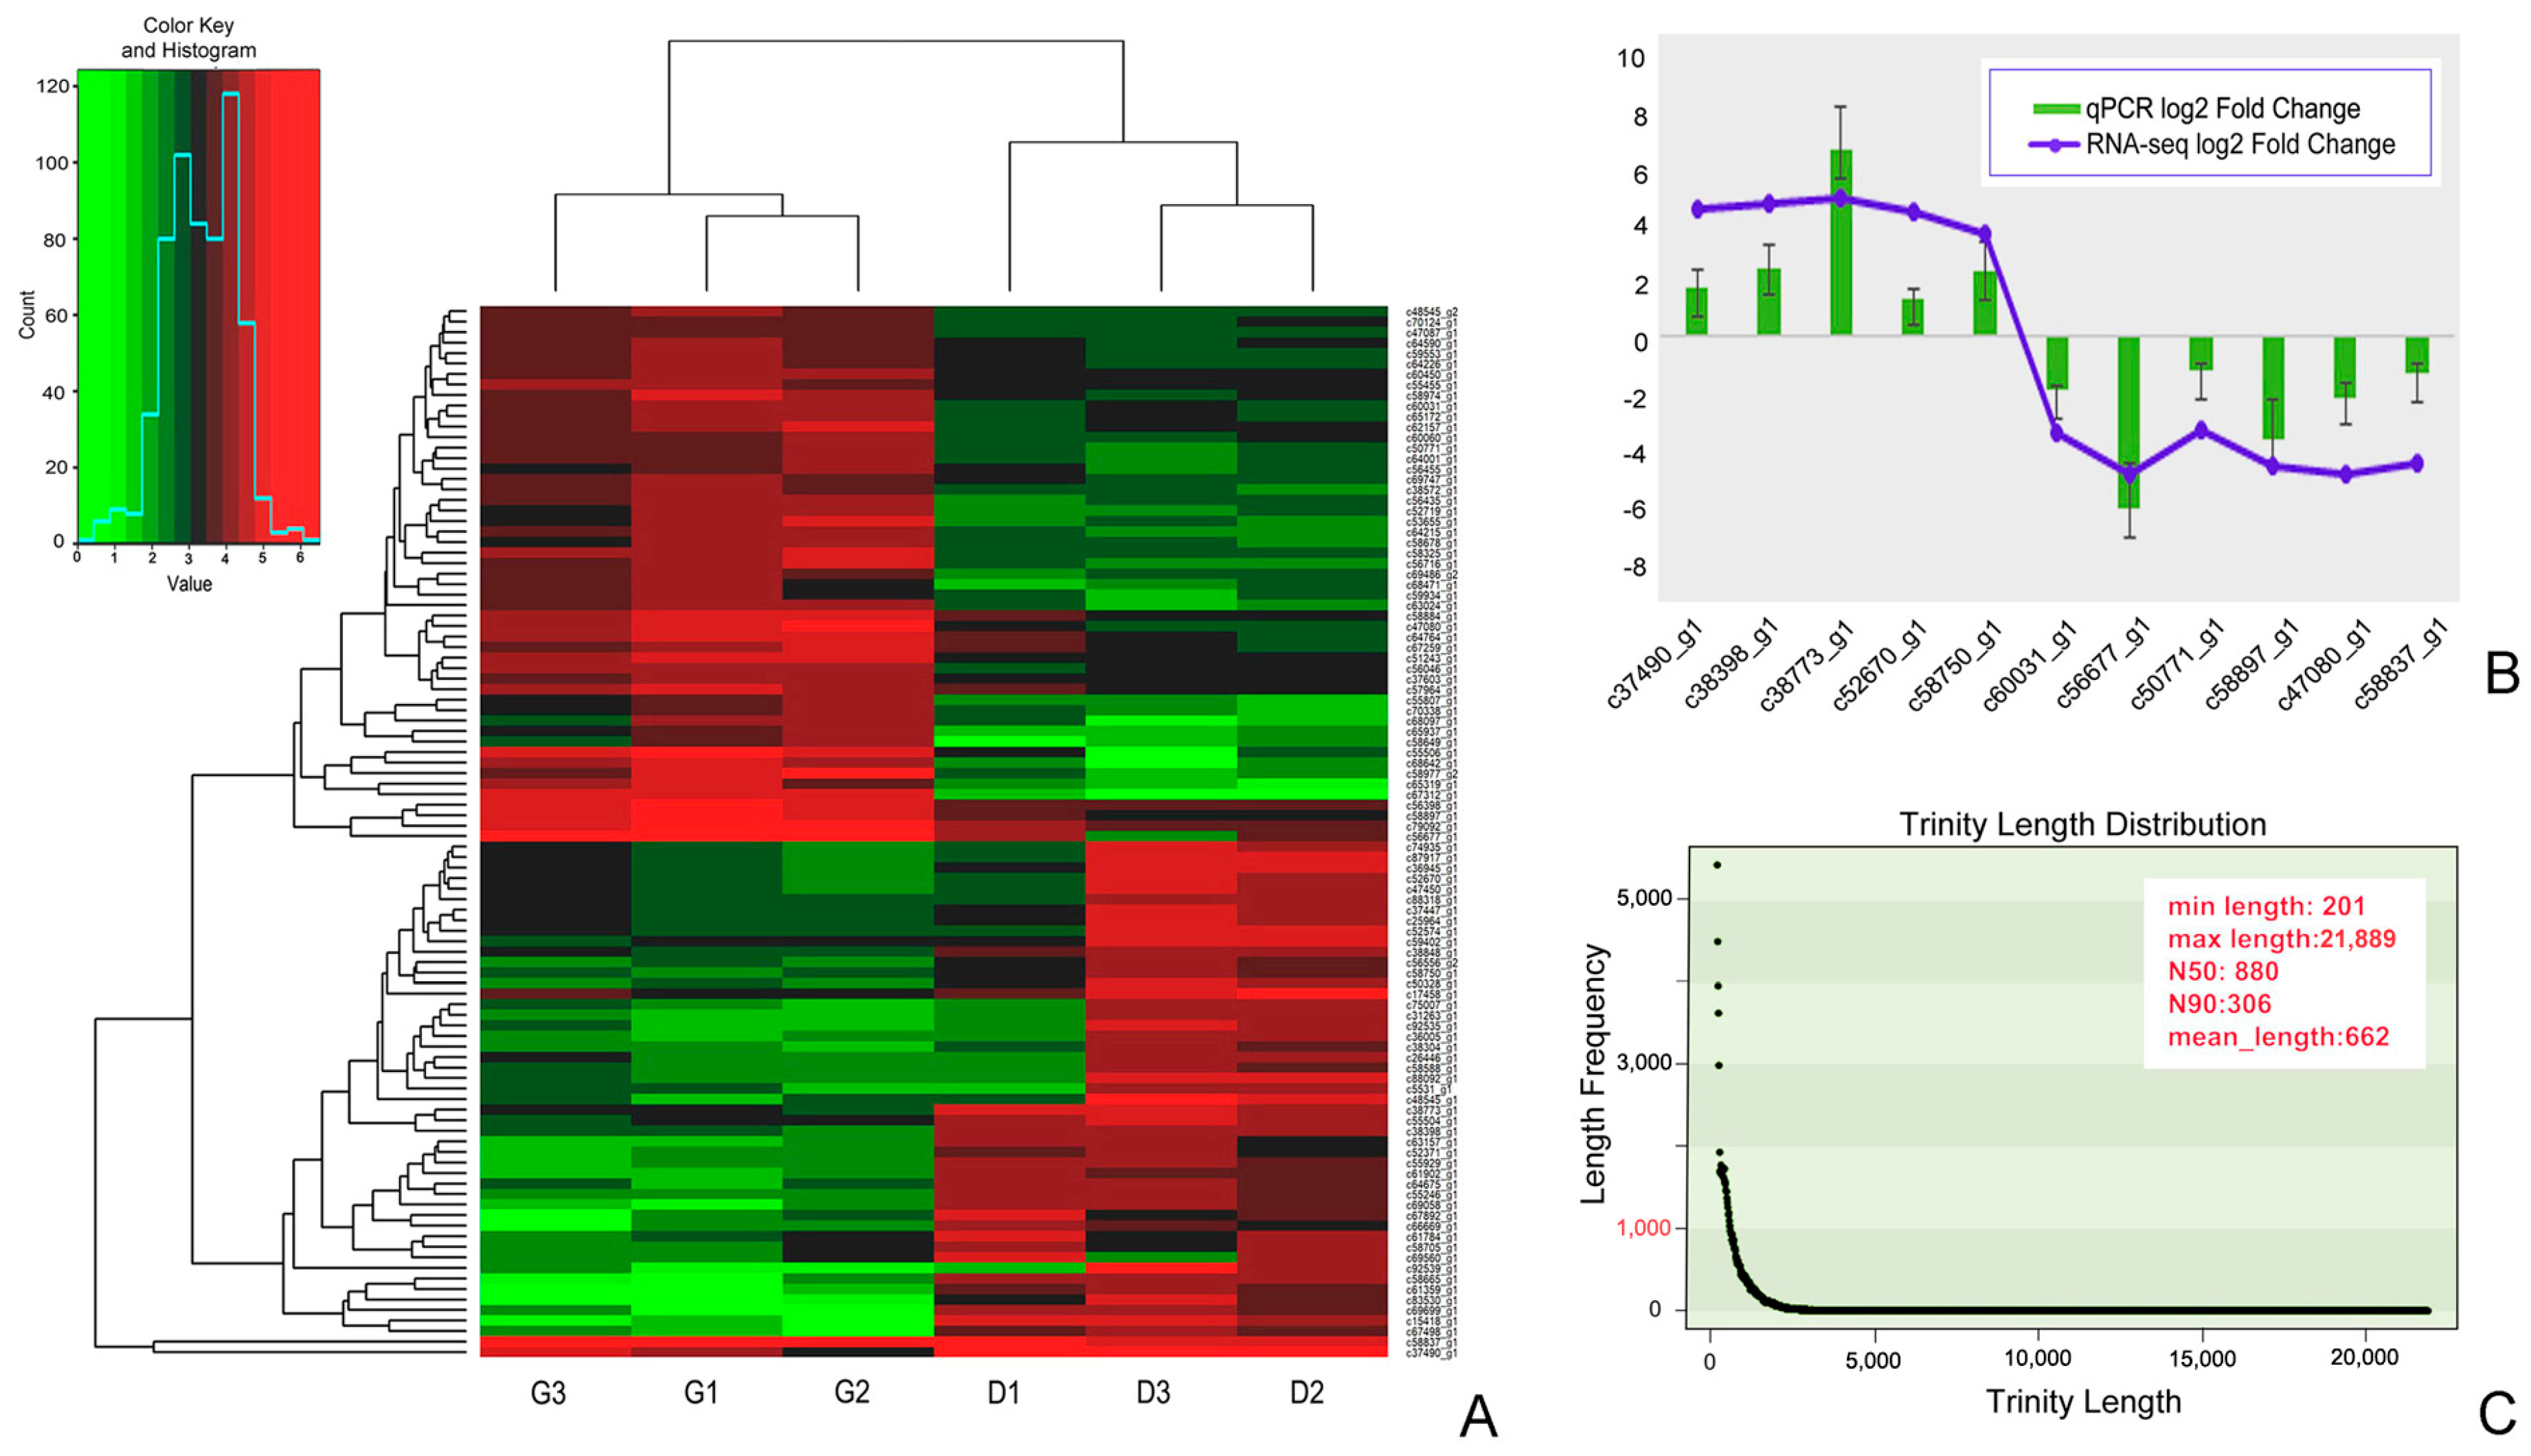
In total, 297,955,888 raw reads were obtained from six transcriptomes. After removing low-quality regions, adapters, and contaminants as much as possible, we obtained clean reads with numbers ranging from 35,788,890 to 43,051,906. Reads have been deposited in GenBank under BioSample number SAMN13668481-SAM13668486 with Bio Project ID PRJNA597169. Clean reads with a quality score Q30 comprised 81.4% of raw reads (Table 1). The overall GC content of contigs was 43.83% and that of unigenes was 44.59%. The total length and number of contigs were 58,260,420 bp and 88,014, respectively (Supplementary Table S2). The maximum contig length was 21,889 bp with an average length of 661.94 bp (N50: 880). The total number of unigenes was 76,358 comprising 47,567,028 bp. The longest unigene was 21,889 bp, while the average length was 622.95 bp (N50: 806). The length distribution of unigene sequences is shown in Figure 2C.
Of the 76,358 unigenes, 19,884 (26%) had a best hit to genes of ciliates in the NCBI non-redundant protein sequence (nr) database and were used for downstream analyses. Of these, 5489 unigenes were aligned to the COG database, 7730 unigenes were annotated with GO functions, and 4354 unigenes were mapped using KEGG.

3.2. Differentially Expressed Genes between the G and D Stages

Reads per kb of exon model per million mapped reads (RPKM) results showed that 2051 unigenes were differentially expressed (with fold changes > 2 and q < 0.05) between groups G and D. Among these unigenes, 1545 were up-regulated, while 506 were down-regulated during the D stage (Supplementary Table S3). Most cyclin, anaphase-promoting complex (APC), and cyclin-dependent kinase (CDKs) genes were up-regulated. Other mostly up-regulated unigenes were dual-specificity tyrosine-(Y)-phosphorylation regulated kinase (DYRK), MORN domain-containing proteins, and mitogen-activated protein kinases (MAPK), all of which are known for their involvement in the cell cycle (Table 2).
Among 256 uniquely expressed unigene during stage D (Figure 3A–C), 140 (54.69%) had known functions in the nr database, while 116 (45.31%) were hypothetical protein genes with unknown functions. At the G stage, 64 unigenes were uniquely expressed (Figure 3A–C), 42 of which (65.63%) had known functions in the nr database, while 22 (34.37%) were hypothetical protein genes and with unknown functions.

3.3. Annotation of Unigenes Using COG Functional Categories

A total of 5489 unigenes had a COG classification covering 24 functional classifications (Figure 3D). The top three identified functional categories were as follows: general function prediction only accounted for 30.17% (n = 1656); signal transduction mechanisms for 17.94% (n = 985), and replication, recombination, and repair for 16.65% (n = 914). There were 482 DEGs between groups D and G, of which 331 were up-regulated and 151 down-regulated. In each case, DEGs covered 22 COG categories (Supplementary Table S4). It is noteworthy that 19 significantly transcribed DEGs were enriched in cell cycle control, cell division, and the chromosome partitioning category (Supplementary Table S5) with a single unigene being down-regulated, while all others were up-regulated. Up-regulated unigenes mainly contained kinase and cyclin genes.

3.4. Annotation of Unigenes Using GO Enrichment

A total of 7730 unigenes were assigned to three major functional GO terms: 82.90% (n = 6408) of unigenes were assigned to the biological process level, and 85.74% (n = 6628) and 86.46% (n = 6683) of unigenes were assigned to the cellular component and molecular function level, respectively. Within the biological process level, most abundant categories were cellular, single-organism, and metabolic process. The GO terms cell, cell part, and organelle were most abundant with respect to the cellular component category. Within the molecular function level, unigenes were predominantly associated with binding, catalytic activity, and transporter activity terms. These unigenes were further summarized into 60 sub-categories using Blast2GO.
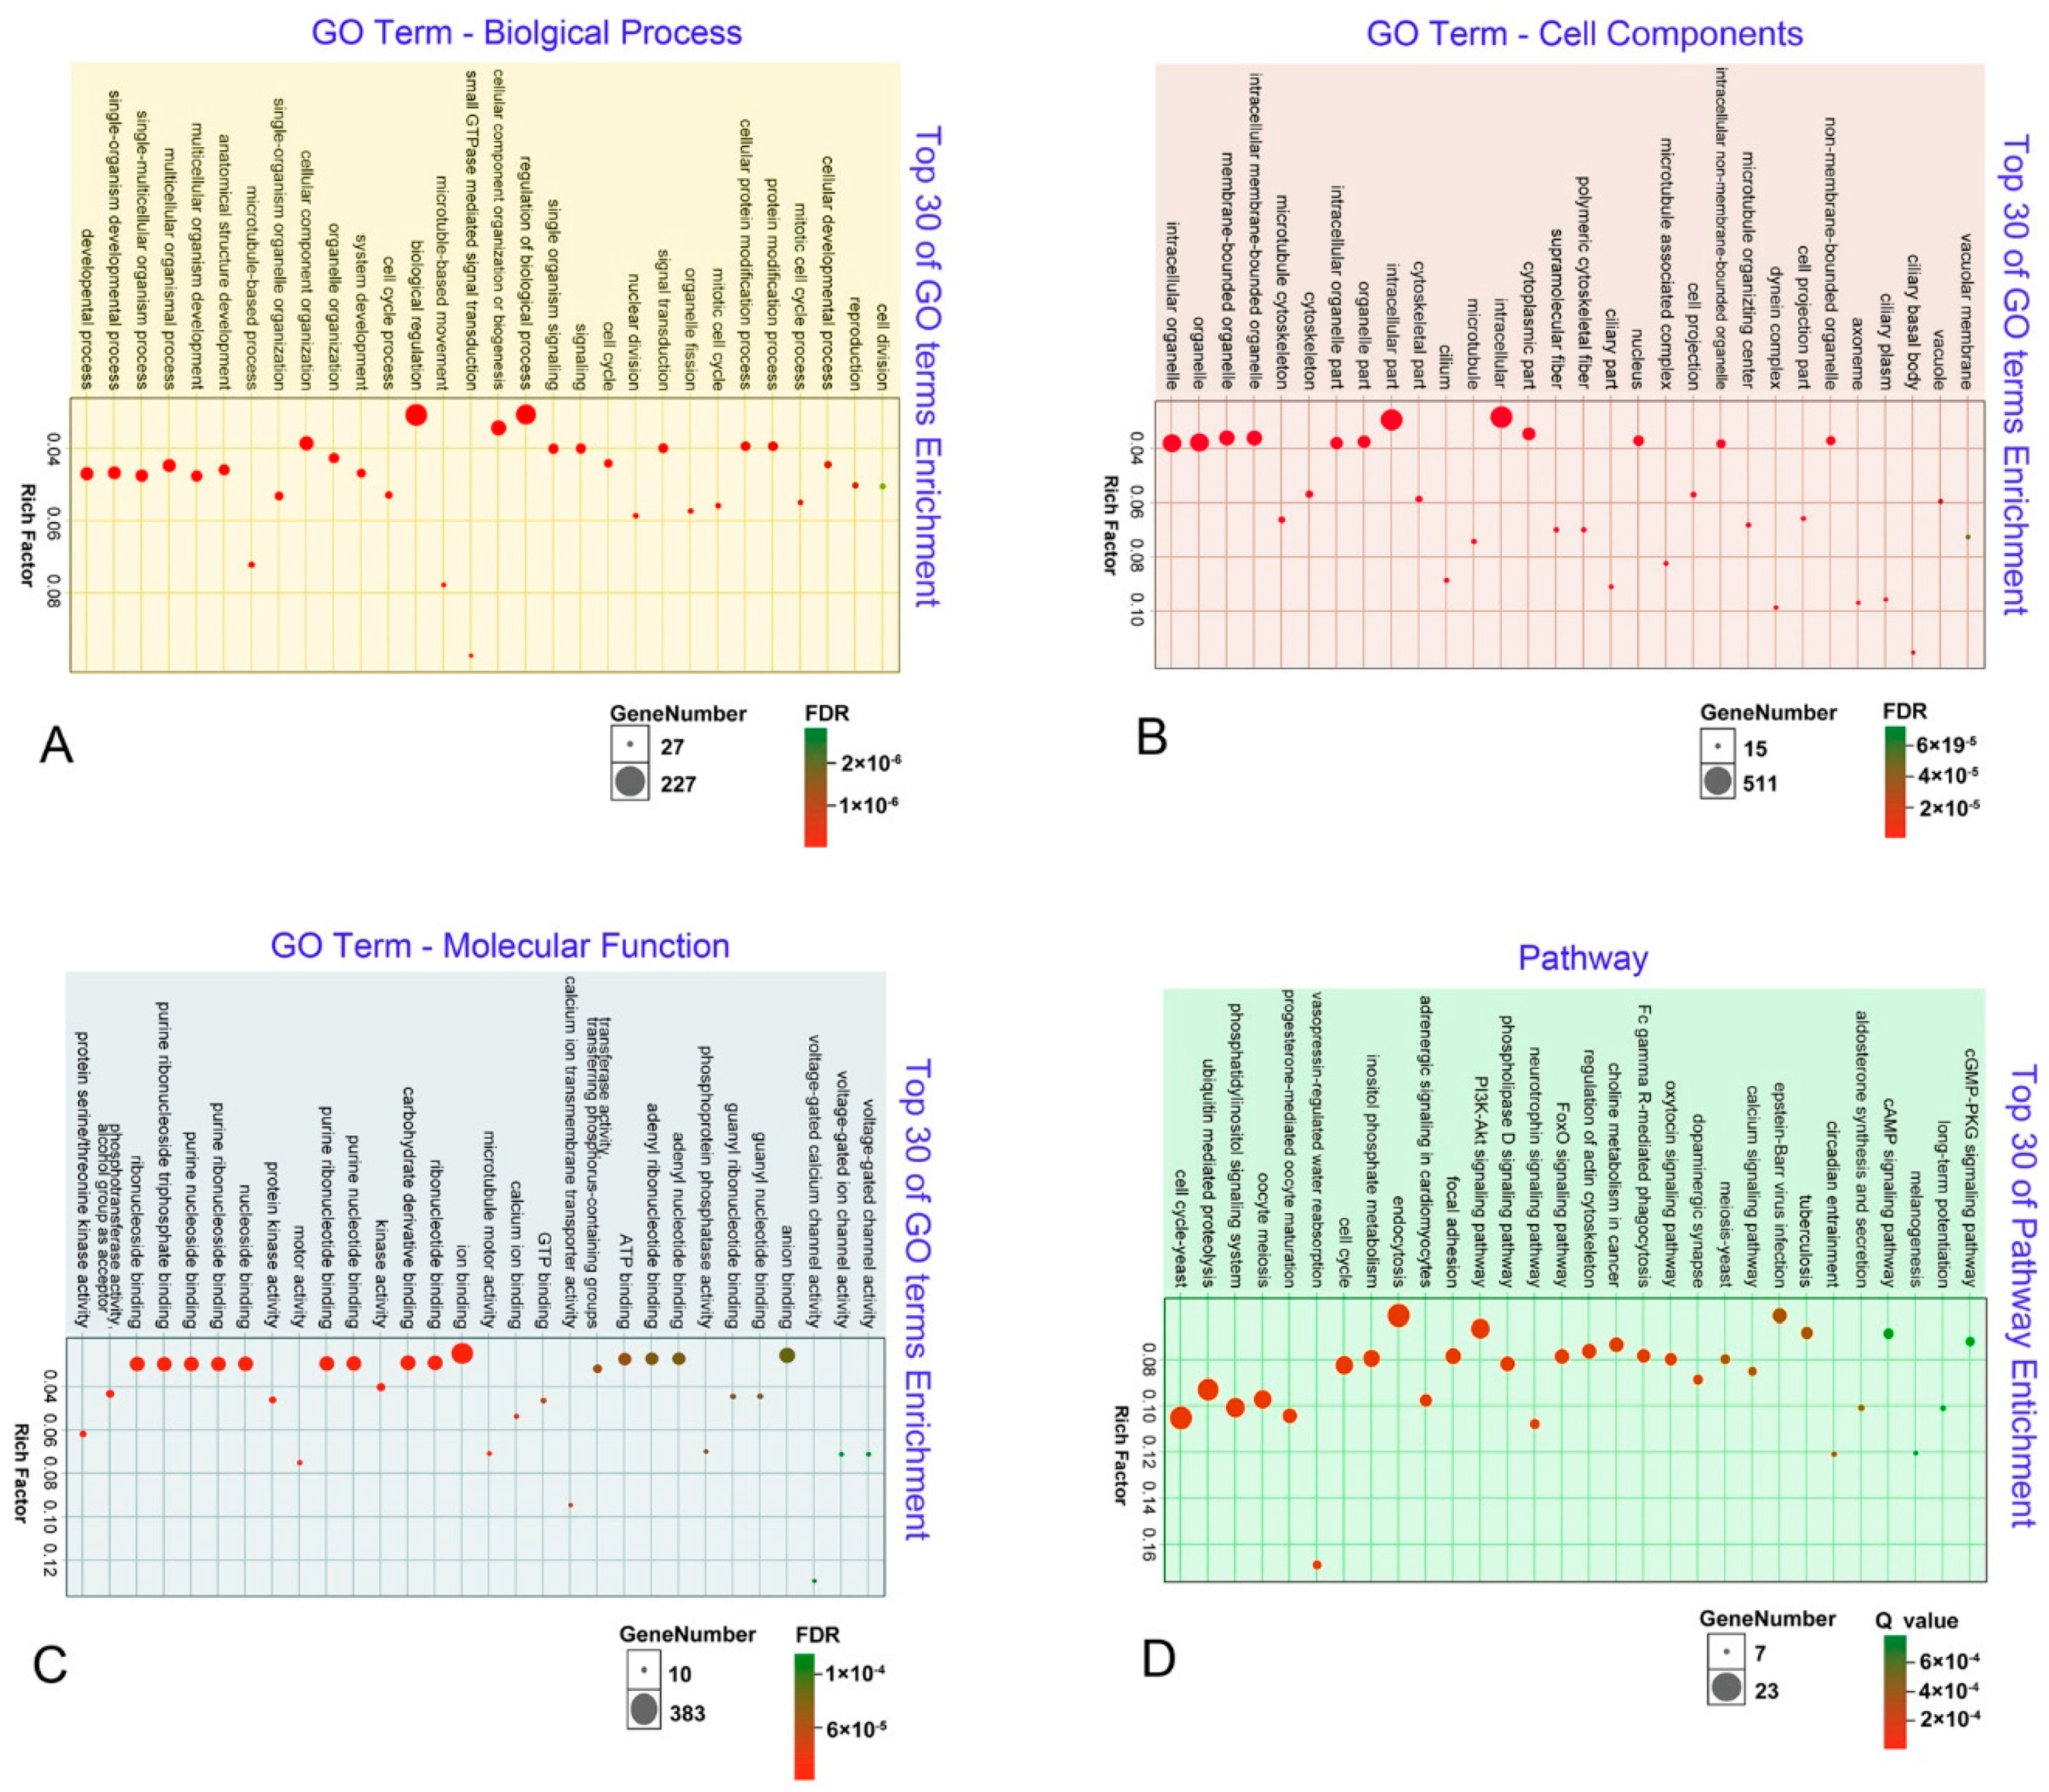
Within the 7730 unigenes, 725 were DEGs between group D and G. Of these, 151 were significantly enriched in the biological process category with the top ones being developmental processes, including single-organism developmental and single-multicellular organism processes (Figure 4A). Other significant processes included microtubule-based process, cilium morphogenesis, development, and cell division (Supplementary Table S6). Thirty-five DEGs were enriched in stage D, of which 28 were up-regulated and 7 were down-regulated. Up-regulated DEGs mainly contained cyclin and cyclin-dependent kinase (Supplementary Table S3). In the cell components category, there were 92 significantly enriched GO terms (Supplementary Table S6). The top five significant GO terms were intracellular organelle, organelle, membrane-bound organelle, intracellular membrane-bound organelle, and microtubule cytoskeleton. Significant pathways included the nucleus, ciliary basal body, and anaphase-promoting complex (Figure 4B). There were 90 significantly enriched GO terms in the molecular function category (Supplementary Table S6) including protein serine/threonine kinase activity, phosphotransferase activity, and ribonucleoside binding (Figure 4C). The top three pathways were the yeast cell cycle, ubiquitin-mediated proteolysis, and the phosphatidylinositol signaling system (Figure 4D).

3.5. Annotations of Unigenes Using KEGG

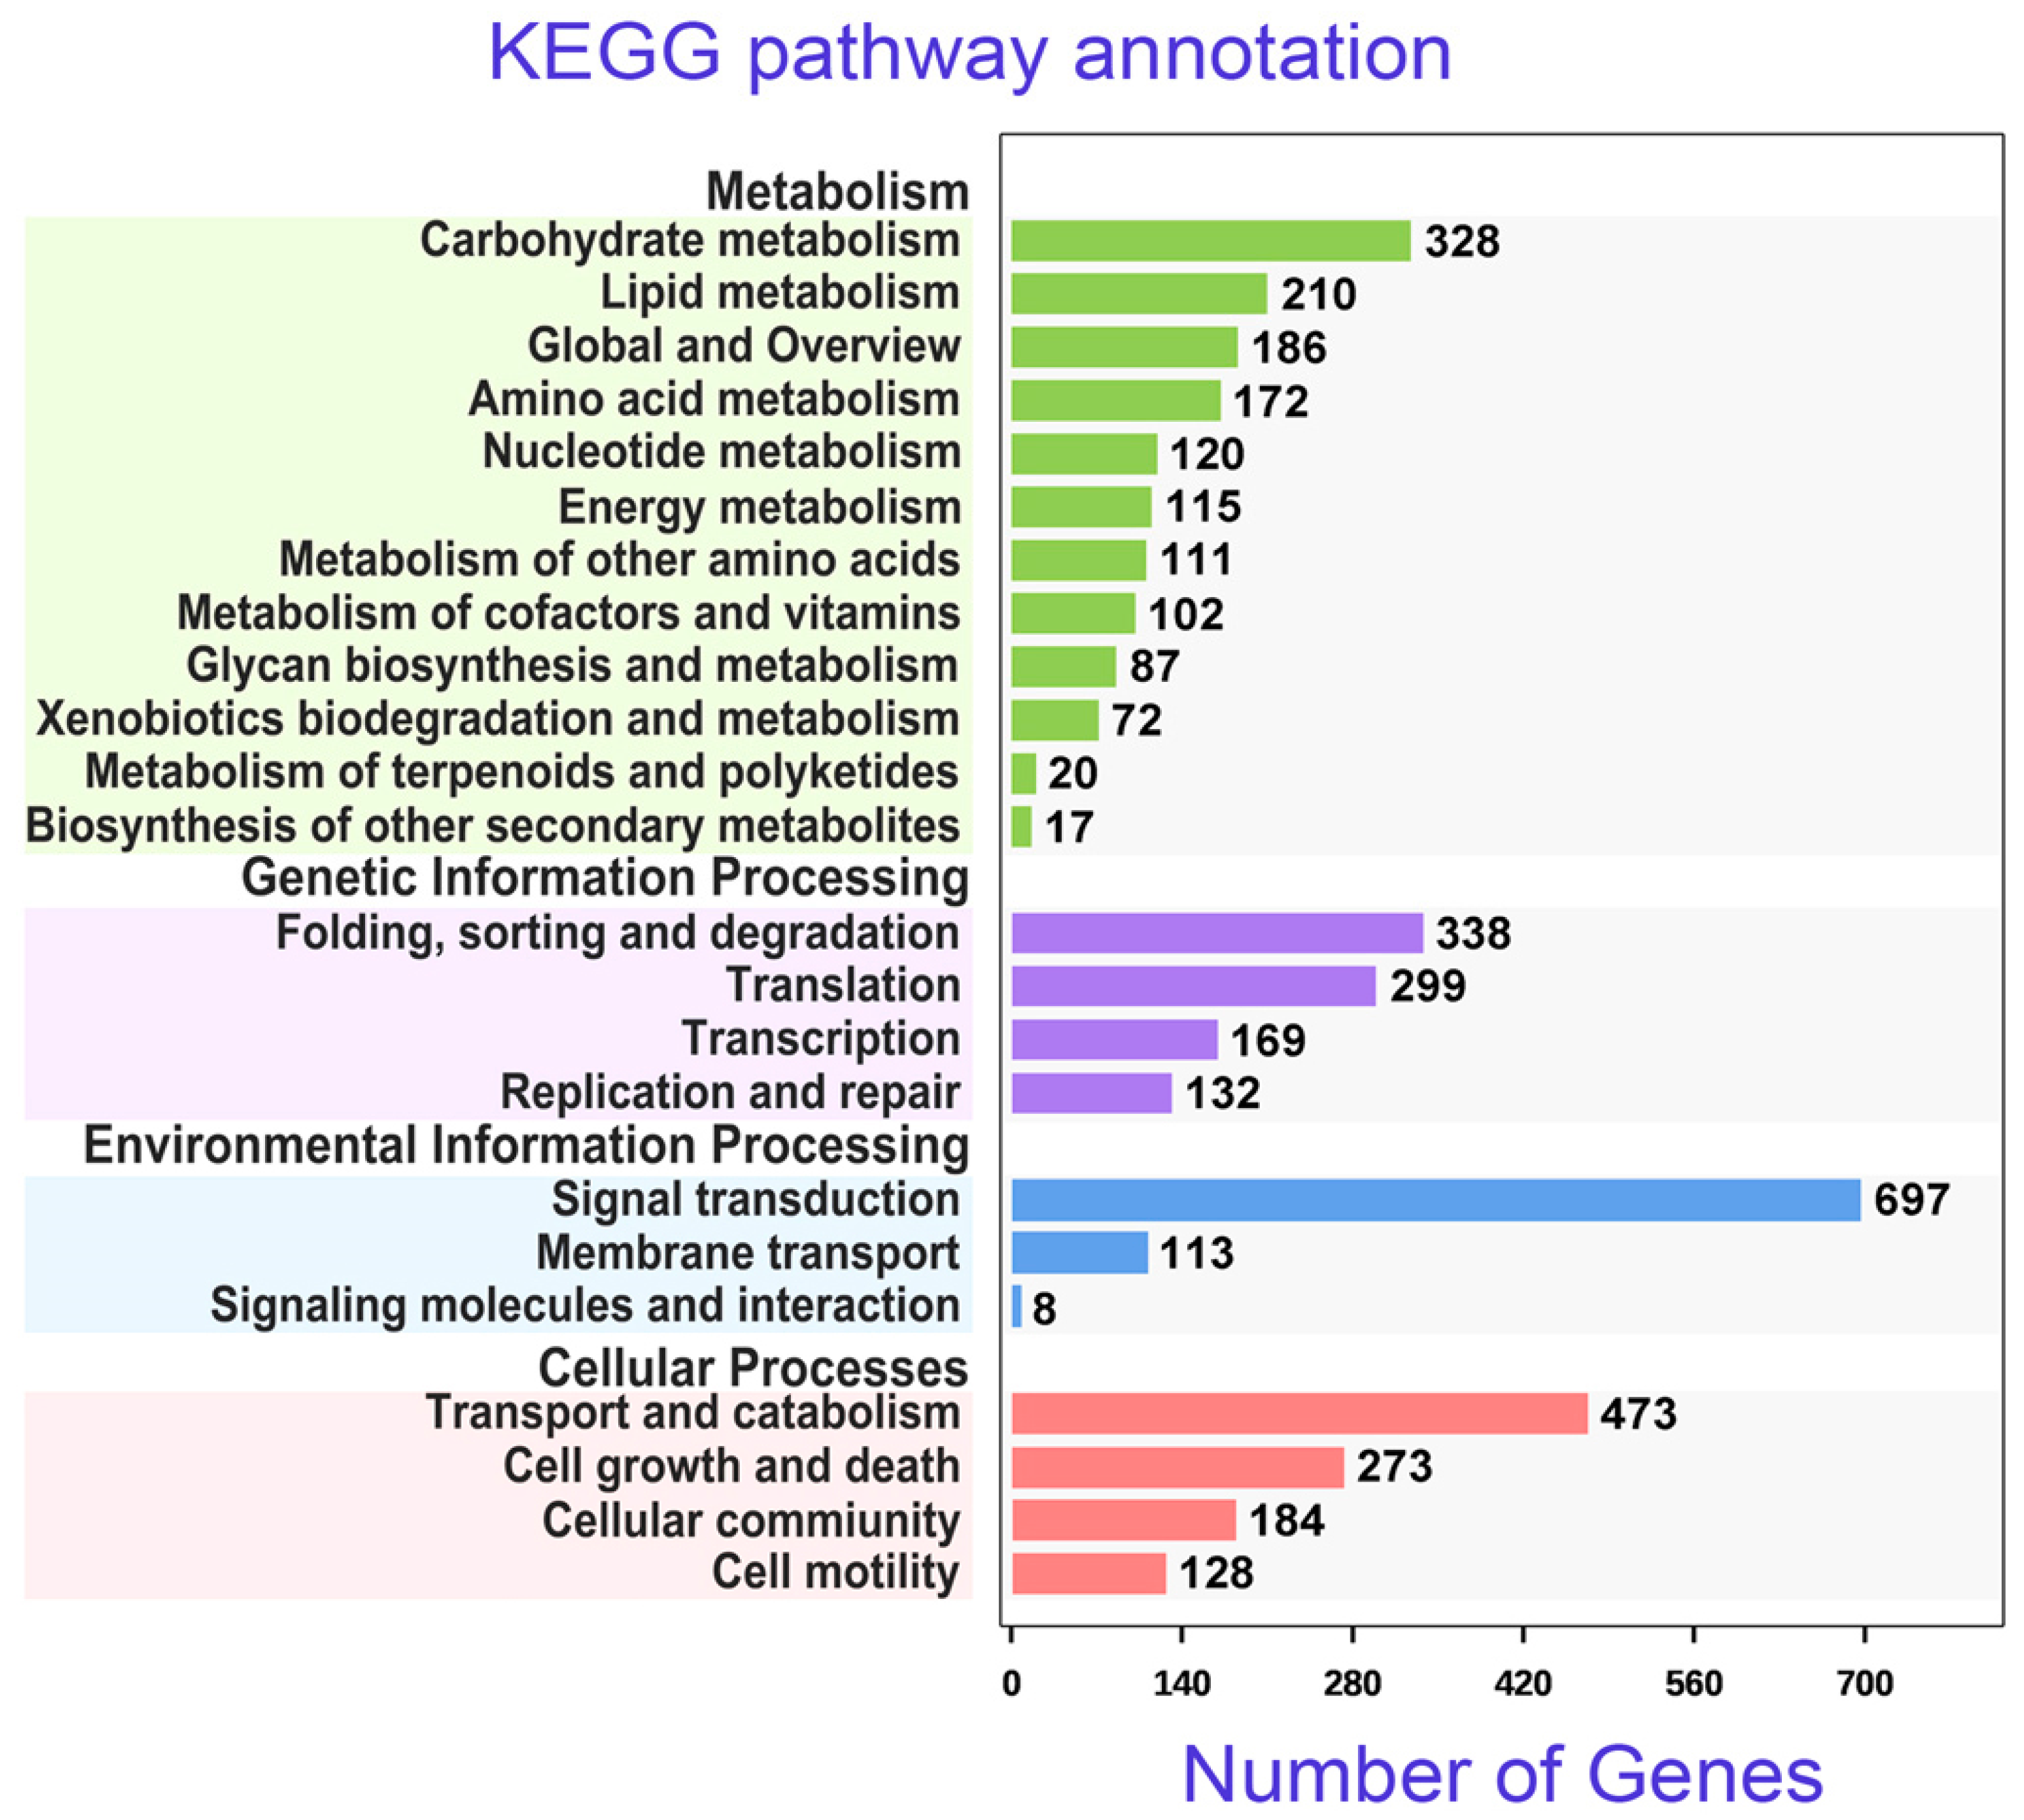
In sum, 4354 unigenes of Pseudokeronopsis erythrina mapped onto KEGG pathways that were related to metabolism, genetic information processing, environmental information processing, and cellular processes (Figure 5). Of these unigenes, 489 DEGs were mapped to 129 pathways. Fourteen enriched pathways (q-value < 0.05) were mainly related to cell growth and death, as well as signal transduction, when comparing group D with group G (Supplementary Table S7). Anaphase-promoting complex subunit 11, anaphase-promoting complex subunit 8-like, anaphase-promoting complex subunit 10, and the TRR repeat-protein, closely related to cell division, were involved in the four most significant KEGG pathways.

3.6. RT-qPCR Validation of DEGs

A heatmap of the 100 most highly expressed DEGs showed 51 down-regulated genes in the top branch, 47 up-regulated genes in the next branch, while the nethermost branches contained only two genes (Figure 2A). There were two distinct clusters at the left and right sides of the heatmap. DEGs of groups G and D were clearly separated, with samples from individual stages grouping together.
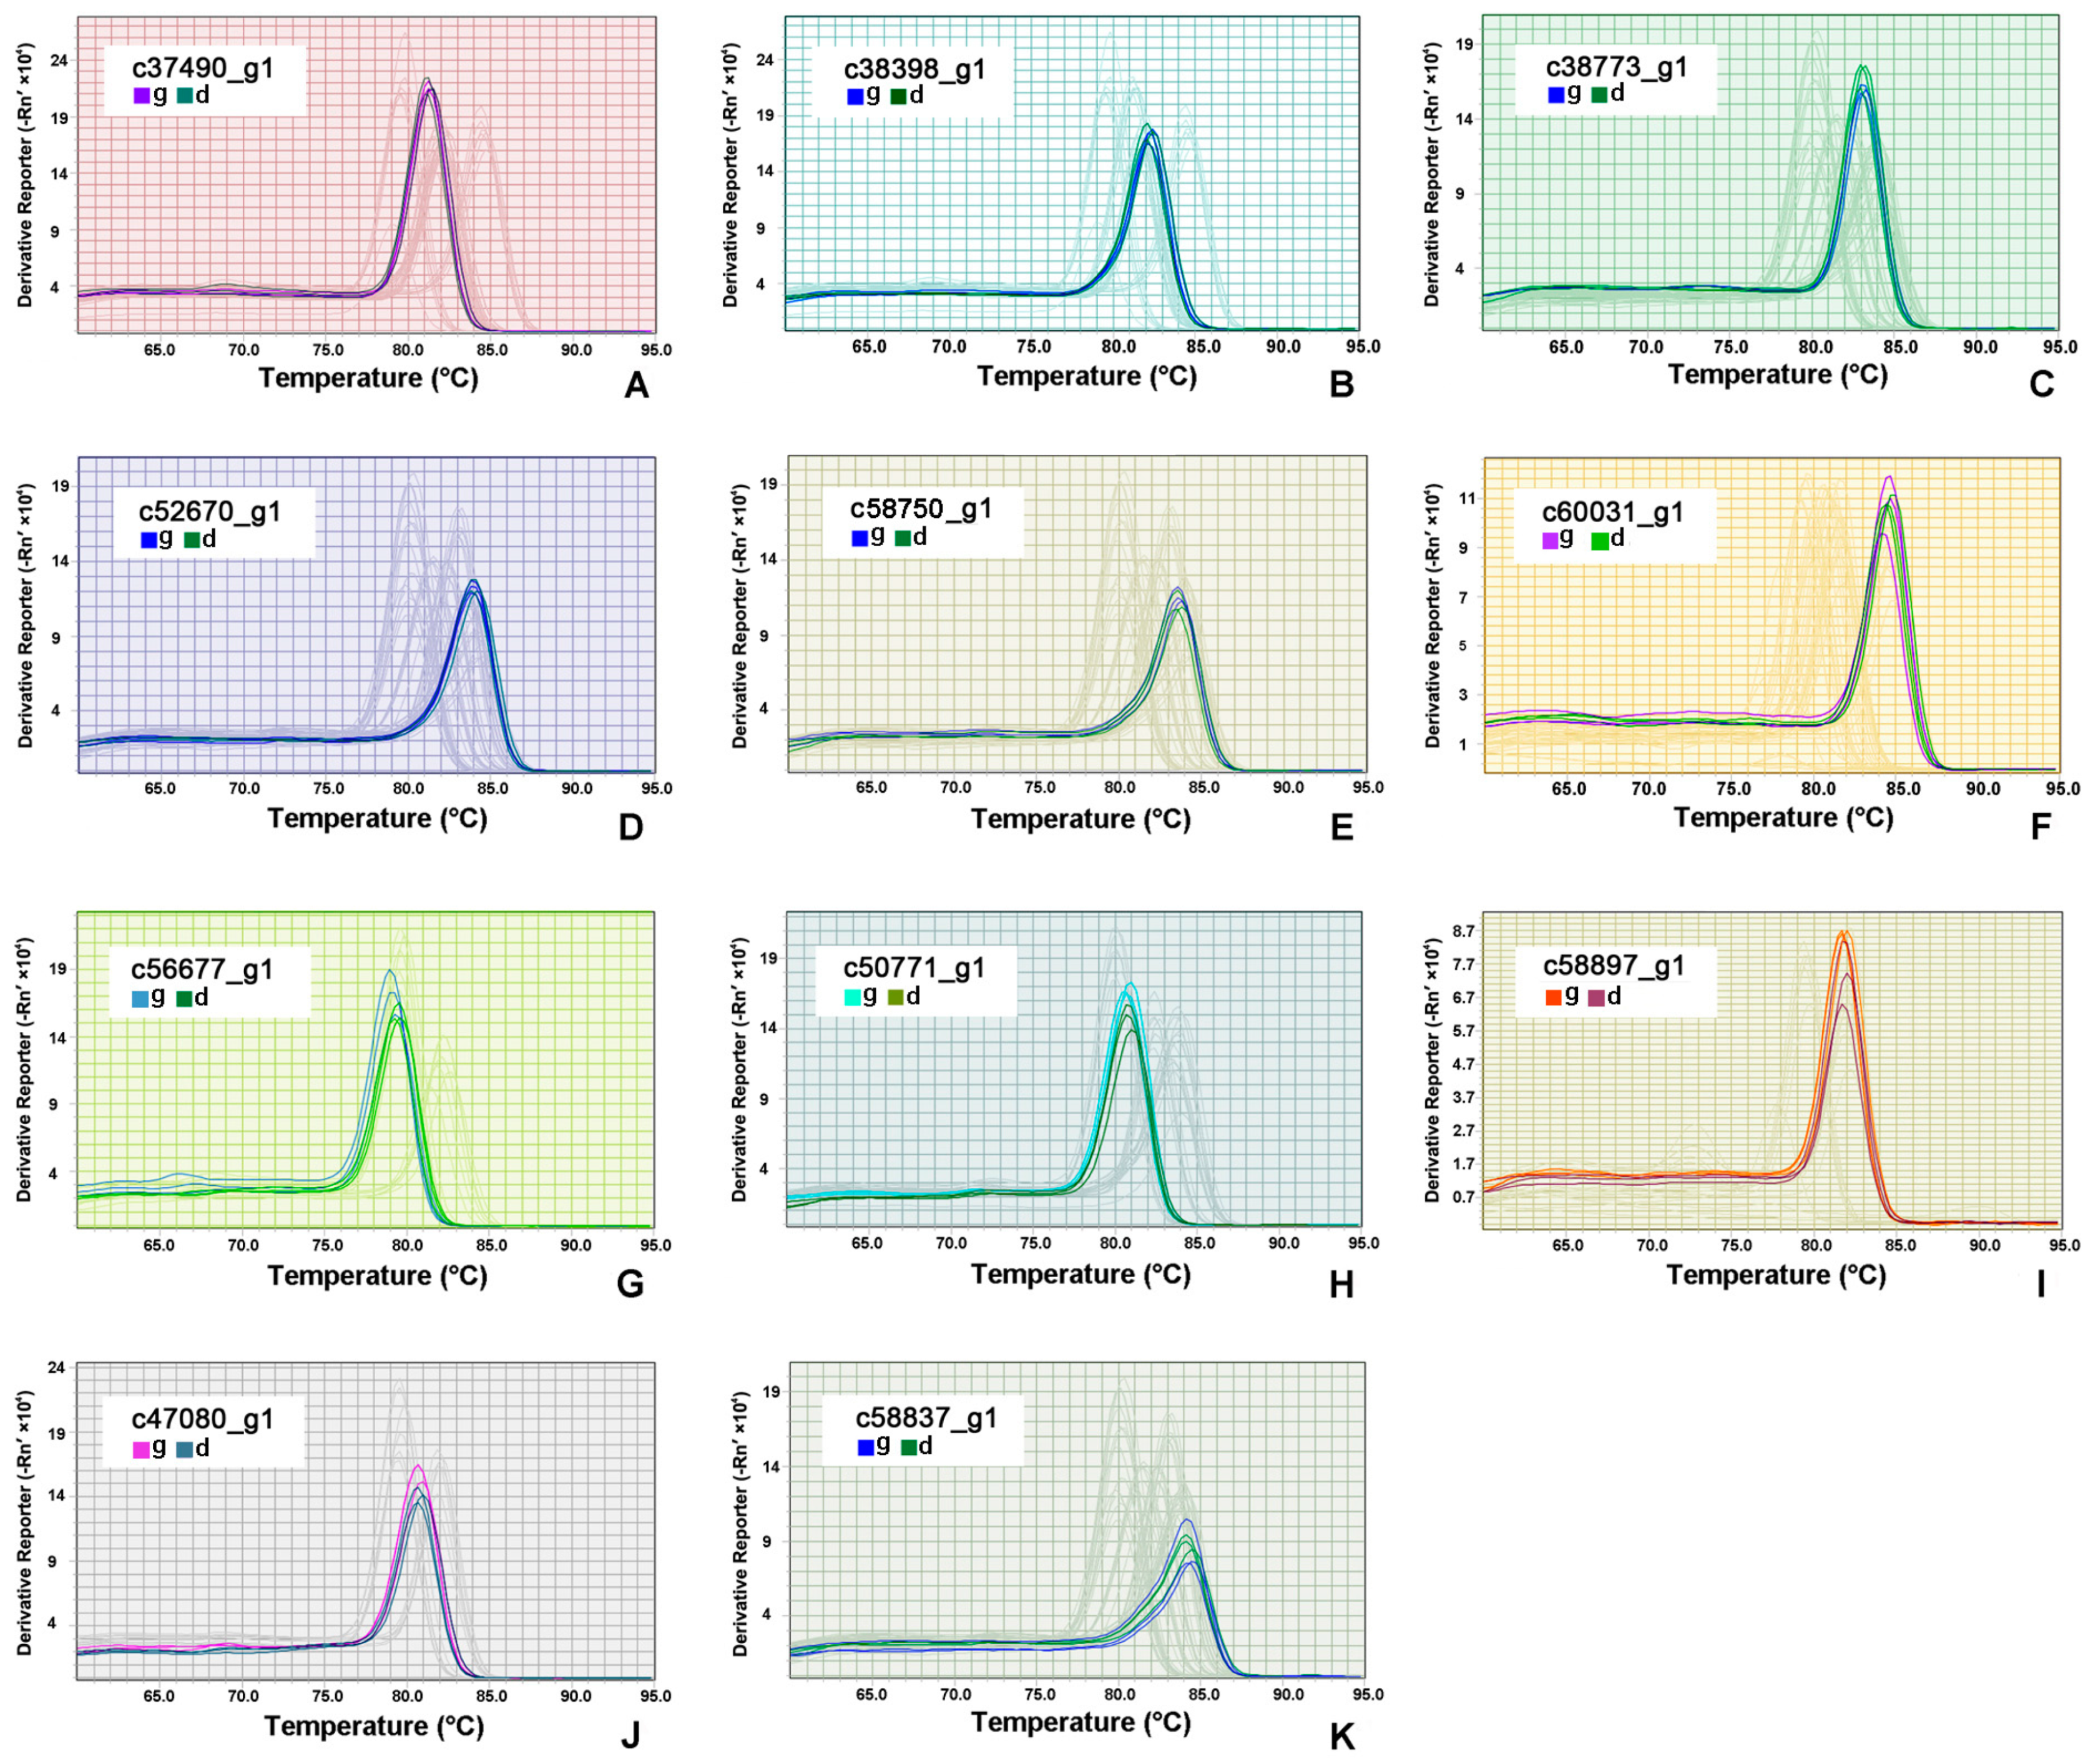
In order to validate results of transcriptome analyses, we randomly selected 6 down- and 5 up-regulated DEGs from the top 100 DEGs for RT-qPCR. Melting curve analysis of RT-qPCR demonstrated a single product for all tested DEGs (Figure 6). The highly up-regulated DEGs alpha-tubulin, 14-3-3 domain containing protein, histone variant H3.8, electron transferring flavor protein dehydrogenase, and proteasome subunit beta type were chosen from group D. Their expression levels were 1.74, 2.46, 6.64, 1.36, and 2.28 times higher, respectively, than those in group G (Table 3). When comparing group D with group G, the predicted DEGs eukaryotic aspartyl protease family protein (c60031_g1), EF hand family protein (56677_g1), cAMP-dependent protein kinase catalytic subunit (c50771_g1), citrate synthase (58897_g1), adenosine kinase (c47080_g1), and s-adenosyl-l-homocysteine hydrolase (c58837_g1) were down-regulated. The expression levels of these 6 DEGs in group D were decreased by 1.89, 6.61, 1.22, 3.68, 2.71, and 1.35 times, respectively, when compared to group G (Table 3). The log2-fold changes from RT-qPCR and RNA-Seq expression profiles were largely consistent (Figure 2B).

4. Discussion

4.1. Ciliates Share Essential Mechanisms of Cell Division with Other Eukaryotic Organisms

To identify the transcriptome profile of vegetative cell division and to control of the cell cycle progression of ciliates, we used single cells of Pseudokeronopsis erythrina at the G and D stages and performed RNA-Seq in triplicate for each stage. A combined annotation profile derived from COG, GO, and KEGG comprised unigenes related to cell division and growth, consistent with the cell stages being analyzed. Herein, 2051 predicted unigenes were differentially expressed between stages G and D. Hierarchical clustering (Figure 2A) of the expression profiles clearly separated the two stages, indicating that the transcribed unigenes in the two stages were rather different. Essential genes involved in the progression of cell division have been characterized in various organisms, including protists [6,7,8,52,53,54].
As expected, vegetative proliferation of Pseudokeronopsis erythrina shared many similarities with the cell division cycles of other eukaryotic organisms. In eukaryotes, the cell cycle comprises four separate phases: growth (G1), DNA synthesis (S), growth (G2), and mitosis (M). Cell cycle progression from G1-S-G2-M occurs via the action of CDKs. The latter are activated when they form complexes with their corresponding cyclins, which are synthesized and degraded throughout the cell cycle. Specific cyclins are expressed at various stages of the cycle. Both the regulation and order of progression are highly conserved across eukaryotes, including yeast, mammals, and plants [55,56,57,58]. Herein, transcribed sequences corresponding to CDKs and cyclins were mostly up-regulated during the D stage (Table 2), in agreement with previous studies [56,57,58]. Specifically, mitotic cyclins and their corresponding CDKs were highly up-regulated, while cyclins of the G1/S phase were down-regulated. This indicates that the cell was past the S and G2 phases and at the peak of mitosis, possibly at the end of metaphase and beginning of anaphase. In support of this, predicted unigenes corresponding to the anaphase-promoting complex and proteasome subunits were also highly up-regulated during the D stage (Table 2). Consistent with this finding, analysis of predicted DEGs revealed significant enrichment in the chromosome partitioning COG category and APC-associated subunits in both GO terms and KEGG pathways. The APC is an ubiquitin ligase that ensures progression of mitosis by mediating protein degradation of multiple targets including cyclins. This occurs by adding a ubiquitin tag to the protein, which is then targeted for degradation via the proteasome. APC becomes active once all chromosomes are attached to the mitotic spindle and thus ensures progression of cell division to anaphase [56]. Similar to other protists, yeasts and metazoans, future studies focusing on identifying CDK/cyclins complexes and associated proteins of various ciliates would be of interest [52,59,60].
Transcribed sequences corresponding to proteins with DYRK domains were strongly up-regulated, including dual specificity protein phosphatases. A putative ortholog of cdc14 phosphatase was also identified. This phosphatase has a regulatory role during anaphase in budding yeast; its observed significant upregulation noted herein suggests that it likely has a similar role in P. erythrina. Members of DYRKs phosphorylate a wide range of targets including cell cycle regulators. Previous studies have revealed that DYRK regulates cell proliferation [61] and phosphorylation of microtubule-organizing proteins [62].
Transcripts corresponding to MORN domain-containing proteins, MAPK, and tubulins, all of which are known to be closely related to cell proliferation, were significantly up-regulated during the D stage (Table 2). MORN domain-containing proteins have been proposed to regulate cellular localization and enzyme activity and stimulate vegetative growth [63,64,65,66]. MAPK genes also play important roles in the proliferation and differentiation of mammalian cells [67]. Tubulin genes are the major components of microtubule cytoskeletons in eukaryotic cells and are highly modulated in cell division [8]. The mitotic spindle, which forms during mitosis, is comprised of tubulin heterodimers. Up-regulation of transcripts associated with tubulin suggests that the cell elongation of Pseudokeronopsis erythrina at the D stage might occur through active tubulin extension, as demonstrated in the kinetoplastid Trypanosoma [59].
Overall, the ciliate Pseudokeronopsis erythrina shares many essential cell cycle pathways with other eukaryotic organisms, highlighting the conserved nature of this process. Previous transcriptome analyses detected homologs of yeast cell cycle regulators in dinoflagellate protists [52] while several components essential in yeast were absent. Given that single-cell transcriptomics cannot reliably capture low-abundance transcripts [68,69], it is too early at this stage to draw conclusions regarding absent components in P. erythrina. Future work should focus on deep sequencing using multiple cells so that the overall diversity of transcribed cell cycle components is captured.

4.2. Comparisons with Previous Studies Focusing on the Cell Cycle Regulation of Ciliates

Previous morphogenetic studies of ciliates [14,15,70,71,72] have shown that many biological processes, including somatic cortex morphogenesis, stomatogenesis, and organelle morphogenesis, occur at stage D. Transcriptomes from the G and D stages (Figure 4C) and RT-qPCR analyses revealed that phosphotransferase activity might be related to cortex modifications [73] as it was enriched during the D stage. Common amino acid residues typically phosphorylated by kinases include serine, threonine, and tyrosine. Our analyses showed that serine/threonine kinase activity was significantly enriched at the D stage (Supplementary Table S6), indicating that this kinase might also play a role in Pseudokeronopsis erythrina somatic cortex morphogenesis. Serine/threonine protein kinase and cation transport ATPase were also significantly enriched. Both of these fell under the GO term of development, indicating potential association with the formation of new oral structures (Supplementary Table S6). Several organelle-related biological processes were enriched (Figure 4A), in agreement with previous morphogenetic studies of P. erythrina, whereby the two “sister cells” (proter and opisthe) are created after organelle differentiation and dedifferentiation [15]. Previous transcriptome investigation of Cryptocaryon irritans, a parasitic ciliate species, also indicated that organelle-related biological processes were enriched during the population growth of ciliates [44]. Experiments using technologies such as gene silencing and fluorescence in situ hybridization are suggested to validate bioinformatic results.
Previous morphological and cell biological studies have indicated that vegetative division and cellular regeneration of ciliates share many similarities [74,75]. In line with this, most significantly enriched DEGs are involved in developmental, organelle, and microtubule-based processes. Previously, Onsbring et al. [76] studied the regeneration of Stentor polymorphus and identified several eukaryotic cell cycle-related biological processes and homologs known for their roles in eukaryotic cell division. Serine/threonine kinase at the D stage was most significantly enriched in our study (Figure 4C), in agreement with the results of Onsbring et al. [76], indicating the overlap of expressed genes in regeneration and cell division processes. Furthermore, MAPK genes, closely related to cell proliferation, were up-regulated at the D stage in Pseudokeronopsis erythrina (Supplementary Table S3), as well as at the alternative splicing stage in the conjugation cell cycle of Tetrahymena thermophila [9]. Herein, we showed that some molecular mechanisms are shared among vegetative division, conjugation, and cellular regeneration in ciliates, based on transcriptomes of vegetative division for the first time. Future studies should focus on the cell biology of P. erythrina to further characterize the transcribed sequences identified in this study.
Since vegetative cell division of ciliates has rich morphological patterns [14,28,40,43,77], we analyzed, for the first time, the mechanism of proliferation during the vegetative cell cycle in these organisms. Future studies geared towards ciliate species with different types of morphogenetic patterns will greatly enrich our knowledge of the molecular mechanisms of ciliate vegetative cell cycles and will facilitate better understanding of the proliferation process of eukaryotic cells overall.

Supplementary Materials

Supplementary materials can be found at https://www.mdpi.com/2076-2607/8/1/108/s1. Table S1 primer sequences in the RT-qPCR experiment; Table S2 summary of de novo assembly of transcriptomic profiles of Pseudokeronopsis erythrina; Table S3 detailed information of DEGs between stages G and D; Table S4 COG annotation of DEGs between stages G and D; Table S5 COG analysis of DEGs in cell cycle control, cell division, and chromosome partitioning category; Table S6 GO enrichment analysis of DEGs in the biological process, cell components, and molecular function category; Table S7 KEGG pathway enrichment analysis of DEGs.

Author Contributions

Z.Y. & Z.S. designed the project. Y.X. & J.X. performed experiments. Y.X., E.G., J.X. analyzed data. Y.X., Z.S., Z.Y. drafted the MS. E.G. improved the MS. All authors have read and agreed to the published version of the manuscript.

Funding

This work was supported by the Marine S & T Fund of Shandong Province for the Pilot National Laboratory for Marine Science and Technology (Qingdao) (2018SDKJ0406-1), the National Natural Science Foundation of China (grant numbers 31772440, 31970486), and Guangdong MEPP Fund [No. GDOE(2019)A23]. The APC was funded by the National Natural Science Foundation of China (grant number 31970486).

Acknowledgments

We are grateful to Weibo Song from Ocean University of China for his constructive comments to improve the manuscript. Many thanks are due to Xuefen Lu, a former student at SCNU, for her help in the preparation of sequencing samples.

Conflicts of Interest

The authors declare no conflict of interest.

References

  1. Zhai, Z.; Wang, X.; Ding, M. Cell Biology; Science Press: Beijing, China, 2011. [Google Scholar]
  2. Amarnath, D.; Li, X.; Kato, Y.; Tsunoda, Y. Gene expression in individual bovine somatic cell cloned embryos at the 8-cell and blastocyst stages of preimplantation development. J. Reprod. Dev. 2007, 53, 1247–1263. [Google Scholar] [CrossRef] [Green Version]
  3. Orford, K.W.; Scadden, D.T. Deconstructing stem cell self-renewal: Genetic insights into cell-cycle regulation. Nat. Rev. Genet. 2008, 9, 115. [Google Scholar] [CrossRef] [PubMed]
  4. Hi, X.; Ran, L.; Liu, Y.; Zhong, S.H.; Zhou, P.P.; Liao, M.X.; Fang, W. Knockdown of hnRNP A2/B1 inhibits cell proliferation, invasion and cell cycle triggering apoptosis in cervical cancer via PI3K/AKT signaling pathway. Oncol. Rep. 2018, 39, 939–950. [Google Scholar]
  5. Jiang, Y.H.; Zhang, T.T.; Vallesi, A.; Yang, X.Y.; Gao, F. Time-course analysis of nuclear events during conjugation in the marine ciliate Euplotes vannus and comparison with other ciliates (Protozoa, Ciliophora). Cell Cycle 2019, 18, 288–298. [Google Scholar] [CrossRef] [PubMed] [Green Version]
  6. Spellman, P.T.; Sherlock, G.; Zhang, M.Q.; Iyer, V.R.; Anders, K.; Eisen, M.B.; Brown, P.O.; Botstein, D.; Futcher, B. Comprehensive identification of cell cycle–regulated genes of the yeast Saccharomyces cerevisiae by microarray hybridization. Mol. Biol. Cell 1998, 9, 3273–3297. [Google Scholar] [CrossRef] [PubMed]
  7. Cho, R.J.; Huang, M.; Campbell, M.J.; Dong, H.; Steinmetz, L.; Sapinoso, L.; Hampton, G.; Elledge, S.J.; Davis, R.W.; Lockhart, D.J. Transcriptional regulation and function during the human cell cycle. Nat. Genet. 2001, 27, 48. [Google Scholar] [CrossRef]
  8. Breyne, P.; Dreesen, R.; Vandepoele, K.; De Veylder, L.; Van Breusegem, F.; Callewaert, L.; Rombauts, S.; Raes, J.; Cannoot, B.; Engler, G.; et al. Transcriptome analysis during cell division in plants. Prod. Natl. Acad. Sci. USA 2002, 99, 14825–14830. [Google Scholar] [CrossRef] [Green Version]
  9. Xiong, J.; Lu, X.; Zhou, Z.; Chang, Y.; Yuan, D.; Tian, M.; Zhou, Z.; Wang, L.; Fu, C.; Orias, E.; et al. Transcriptome analysis of the model protozoan, Tetrahymena thermophila, using deep RNA sequencing. PLoS ONE 2012, 7, e30630. [Google Scholar] [CrossRef] [Green Version]
  10. Nolan, T.; Hands, R.E.; Bustin, S.A. Quantification of mRNA using real-time RT-PCR. Nat. Protoc. 2006, 1, 1559. [Google Scholar] [CrossRef]
  11. Wang, Z.; Gerstein, M.; Snyder, M. RNA-Seq: A revolutionary tool for transcriptomics. Nat. Rev. Genet. 2009, 10, 57. [Google Scholar] [CrossRef]
  12. Kolisko, M.; Boscaro, V.; Burki, F.; Lynn, D.H.; Keeling, P.J. Single-cell transcriptomics for microbial eukaryotes. Curr. Biol. 2014, 24, R1081–R1082. [Google Scholar] [CrossRef] [PubMed] [Green Version]
  13. Dzamba, D.; Valihrach, L.; Kubista, M.; Anderova, M. The correlation between expression profiles measured in single cells and in traditional bulk samples. Sci. Rep. 2016, 6, 37022. [Google Scholar] [CrossRef] [PubMed] [Green Version]
  14. Cheng, T.; Wang, Y.Y.; Huang, J.; Chen, X.; Zhao, X.L.; Gao, S.; Song, W.B. Our recent progress in epigenetic research using the model ciliate, Tetrahymena thermophila. Mar. Life Sci. Technol. 2019, 1, 4–14. [Google Scholar] [CrossRef] [Green Version]
  15. Chen, X.M.; Clamp, J.C.; Song, W.B. Phylogeny and systematic revision of the family Pseudokeronopsidae (Protista, Ciliophora, Hypotricha), with description of a new estuarine species of Pseudokeronopsis. Zool. Scr. 2011, 40, 659–671. [Google Scholar] [CrossRef]
  16. Chen, X.; Jiang, Y.; Gao, F.; Zheng, W.; Krock, T.J.; Stover, N.A.; Lu, C.; Katz, L.A.; Song, W. Genome analyses of the new model protist Euplotes vannus focusing on genome rearrangement and resistance to environmental stressors. Mol. Ecol. Resour. 2019. [Google Scholar] [CrossRef]
  17. Gao, S.; Xiong, J.; Zhang, C.; Berquist, B.R.; Yang, R.; Zhao, M.; Molascon, A.J.; Kwiatkowski, S.Y.; Yuan, D.; Qin, Z.; et al. Impaired replication elongation in Tetrahymena mutants deficient in histone H3 Lys 27 monomethylation. Genes Dev. 2013, 27, 1662–1679. [Google Scholar] [CrossRef] [Green Version]
  18. Wang, Y.Y.; Chen, X.; Sheng, Y.L.; Liu, Y.; Gao, S. N6-adenine DNA methylation is associated with H2A.Z-containing well-positioned nucleosomes in Pol II-transcribed genes in Tetrahymena. Nucleic Acid Res. 2017, 45, 11594–11606. [Google Scholar]
  19. Wang, Y.R.; Wang, C.; Jiang, Y.; Katz, L.A.; Gao, F.; Yan, Y. Further analyses of variation of ribosome DNA copy number and polymorphism in ciliates provide insights relevant to studies of both molecular ecology and phylogeny. Sci. China Life Sci. 2019, 62, 203–214. [Google Scholar] [CrossRef]
  20. Zhang, T.T.; Wang, C.D.; Katz, L.A.; Gao, F. A paradox: Rapid evolution rates of germline-limited sequences are associated with conserved patterns of rearrangements in cryptic species of Chilodonella uncinata (Protista, Ciliophora). Sci. China Life Sci. 2018, 61, 1071–1078. [Google Scholar] [CrossRef]
  21. Zhao, Y.; Yi, Z.Z.; Warren, A.; Song, W.B. Species delimitation for the molecular taxonomy and ecology of the widely distributed microbial eukaryote genus Euplotes (Alveolata, Ciliophora). Proc. R. Soc. B Biol. Sci. 2018, 285. [Google Scholar] [CrossRef] [Green Version]
  22. Zhao, X.; Xiong, J.; Mao, F.; Sheng, Y.; Chen, X.; Feng, L.; Dui, W.; Yang, W.; Kapusta, A.; Feschotte, C.; et al. RNAi-dependent Polycomb repression controls transposable elements in Tetrahymena. Genes Dev. 2019, 33, 348–364. [Google Scholar] [CrossRef] [PubMed] [Green Version]
  23. Zheng, W.B.; Wang, C.D.; Yan, Y.; Gao, F.; Doak, T.G.; Song, W.B. Insights into an extensively fragmented eukaryotic genome: De novo genome sequencing of the multi-nuclear ciliate Uroleptopsis citrina. Genome Biol. Evol. 2018, 10, 883–894. [Google Scholar] [CrossRef] [PubMed] [Green Version]
  24. Li, X.H.; Huang, J.; Filker, S.; Stoeck, T.; Bi, Y.H.; Song, W.B. Spatio-temporal patterns of zooplankton in a main-stem dam affected tributary: A case study in the Xiangxi River of the Three Gorges Reservoir. Sci. China Life Sci. 2019. [Google Scholar] [CrossRef] [PubMed]
  25. Miao, W.; Xiong, J.; Bowen, J.; Wang, W.; Liu, Y.F.; Braguinets, O. Microarray analyses of gene expression during the Tetrahymena thermophila life cycle. PLoS ONE 2009, 4, e4429. [Google Scholar] [CrossRef] [PubMed] [Green Version]
  26. Xu, Q.; Wang, R.; Ghanam, A.; Yan, G.; Miao, W.; Song, X. The key role of CYC2 during meiosis in Tetrahymena thermophila. Protein Cell 2016, 7, 236–249. [Google Scholar] [CrossRef] [Green Version]
  27. Xu, J.; Li, X.; Song, W.; Wang, W.; Gao, S. Cyclin Cyc2p is required for micronuclear bouquet formation in Tetrahymena thermophila. Sci. China Life Sci. 2019, 62, 668–680. [Google Scholar] [CrossRef]
  28. Lipps, H.J.; Nock, A.; Riewe, M.; Steinbruck, G. Chromatin structure in the macronucleus of the ciliate Stylonychia mytilus. Nucleic Acids Res. 1978, 5, 4699–4709. [Google Scholar] [CrossRef] [Green Version]
  29. Prescott, D.M. The DNA of ciliated protozoa. Microbiol. Rev. 1994, 58, 233–267. [Google Scholar] [CrossRef]
  30. Bender, J.; Klein, A. The telomere binding protein of Euplotes crassus prevents non-specific transcription initiation but has no role in positioning transcription initiation complexes. Nucleic Acids Res. 1997, 25, 2877–2882. [Google Scholar] [CrossRef] [Green Version]
  31. Duerr, H.P.; Eichner, M.; Ammermann, D. Modeling senescence in hypotrichous ciliates. Protist 2004, 155, 45–52. [Google Scholar] [CrossRef]
  32. Aury, J.M.; Jaillon, O.; Duret, L.; Noel, B.; Jubin, C.; Porcel, B.M.; Ségurens, B.; Daubin, V.; Anthouard, V.; Aiach, N.; et al. Global trends of whole-genome duplications revealed by the ciliate Paramecium tetraurelia. Nature 2006, 444, 171–178. [Google Scholar] [CrossRef]
  33. Eisen, J.A.; Coyne, R.S.; Wu, M.; Wu, D.; Thiagarajan, M.; Wortman, J.R.; Badger, J.H.; Ren, Q.; Amedeo, P.; Jones, K.M.; et al. Macronuclear genome sequence of the ciliate Tetrahymena thermophila, a model eukaryote. PLoS Biol. 2006, 4, 1620–1642. [Google Scholar] [CrossRef] [PubMed]
  34. Coyne, R.S.; Thiagarajan, M.; Jones, K.M.; Wortman, J.R.; Tallon, L.J.; Haas, B.J.; Cassidy-Hanley, D.M.; Wiley, E.A.; Smith, J.J.; Collins, K. Refined annotation and assembly of the Tetrahymena thermophila genome sequence through EST analysis, comparative genomic hybridization, and targeted gap closure. BMC Genom. 2008, 9, 562. [Google Scholar] [CrossRef] [PubMed] [Green Version]
  35. Estienne, C.; Swart, J.R.; Bracht, V.M.; Patrick, M.; Chen, X. The Oxytricha trifallax macronuclear genome: A complex eukaryotic genome with 16,000 tiny chromosomes. PLoS Biol. 2013, 11, e1001473. [Google Scholar] [CrossRef] [Green Version]
  36. Chen, X.; Jung, S.; Beh, L.Y.; Eddy, S.R.; Landweber, L.F. Combinatorial DNA rearrangement facilitates the origin of new genes in ciliates. Genome Biol. Evol. 2015. [Google Scholar] [CrossRef] [PubMed] [Green Version]
  37. Lobanov, A.V.; Heaphy, S.M.; Turanov, A.A.; Gerashchenko, M.V.; Picciarelli, S.; Devaraj, R.R. Position-dependent termination and widespread obligatory frame shifting in Euplotes translation. Nat. Struct. Mol. Biol. 2016. [Google Scholar] [CrossRef] [Green Version]
  38. Berger, H. Monograph of the Urostyloidea (Ciliophora, Hypotricha). Monogr. Biol. 2006, 85, 1–1304. [Google Scholar]
  39. Song, W.B.; Shao, C. Ontogenetic Patterns of Hypotrich Ciliates; Science Press: Beijing, China, 2017. (In Chinese) [Google Scholar]
  40. Numata, O.; Fujiu, K.; Gonda, K. Macronuclear division and cytokinesis in Tetrahymena. Cell Biol. Int. 1999, 23, 849–857. [Google Scholar] [CrossRef]
  41. Liang, H.X.; Jing, X.U.; Wang, W. Overexpression of RAN1 inhibits macronuclear amitosis in Tetrahymena thermophila. Chin. J. Biochem. Mol. Biol. 2013, 29, 42–48. [Google Scholar]
  42. Foissner, W. Ontogenesis in ciliated protozoa, with emphasis on stomatogenesis. In Ciliates, Cells as Organisms; Hausmann, K., Bradbury, P.C., Eds.; Gustav Fischer Verlag: Stuttgart, Germany, 1996; pp. 95–177. [Google Scholar]
  43. Hu, X.Z.; Song, W.B. Morphological redescriotion and morphogenesis of the marine cilaite, Pseudokeronopsis rubra (Ciliophora: Hypotrichida). Acta Protozool. 2001, 40, 107–115. [Google Scholar]
  44. Yi, Z.; Huang, L.; Yang, R.; Lin, X.; Song, W. Actin evolution in ciliates (Protist, Alveolata) is characterized by high diversity and three duplication events. Mol. Phylogenet. Evol. 2016, 96, 45–54. [Google Scholar] [CrossRef] [PubMed]
  45. Picelli, S.; Faridani, O.R.; Björklund, Å.K.; Winberg, G.; Sagasser, S.; Sandberg, R. Full-length RNA-seq from single cells using Smart-seq2. Nat. Protoc. 2014, 9, 171. [Google Scholar] [CrossRef] [PubMed]
  46. Grabherr, M.G.; Haas, B.J.; Yassour, M.; Levin, J.Z.; Thompson, D.A.; Amit, I.; Adiconis, X.; Fan, L.; Raychowdhury, R.; Zeng, Q.; et al. Trinity: Reconstructing a full-length transcriptome without a genome from RNA-Seq data. Nat. Biotechnol. 2011, 29, 644–652. [Google Scholar] [CrossRef] [PubMed] [Green Version]
  47. Langmead, B.; Salzberg, S.L. Fast gapped-read alignment with Bowtie 2. Nat. Methods 2012, 9, 357. [Google Scholar] [CrossRef] [Green Version]
  48. Love, M.I.; Huber, W.; Anders, S. Moderated estimation of fold change and dispersion for RNA-seq data with DESeq2. Genome Biol. 2014, 15, 550. [Google Scholar] [CrossRef] [Green Version]
  49. Chen, X.; Wang, Y.R.; Sheng, Y.L.; Warren, A.; Gao, S. GPSit: An automated method for evolutionary analysis of nonculturable ciliated microeukaryotes. Mol. Ecol. Resour. 2018, 18, 700–713. [Google Scholar] [CrossRef]
  50. Pfaffl, M.W. A new mathematical model for relative quantification in real-time RT-PCR. Nuclcic Acids Res. 2001, 29, e45. [Google Scholar] [CrossRef]
  51. Jaramillo, M.L.; Ammar, D.; Quispe, R.L.; Guzman, F.; Margis, R.; Nazari, E.M.; Müller, Y.M. Identification and evaluation of reference genes for expression studies by RT-qPCR during embryonic development of the emerging model organism, Macrobrachium olfersii. Gene 2017, 598, 97–106. [Google Scholar] [CrossRef]
  52. Morse, D.; Daoust, P.; Benribague, S. A transcriptome-based perspective of cell cycle regulation in dinoflagellates. Protist 2016, 167, 610–621. [Google Scholar] [CrossRef]
  53. Zhang, H.; Huang, X.; Tang, L.; Zhang, Q.J.; Frankel, J.; Berger, J.D. A cyclin-dependent protein kinase homologue associated with the basal body domains in the ciliate Tetrahymena thermophile. Biochim. Biophys. Acta Mol. Cell Res. 2002, 1591, 119–128. [Google Scholar] [CrossRef] [Green Version]
  54. Zhuang, Y.; Zhang, H.; Lin, S. Cyclin B gene and its cell cycle-dependent differential expression in the toxic dinoflagellate Alexandrium fundyense Atama Group, I./Clade, I. Harmful Algae 2013, 26, 71–79. [Google Scholar] [CrossRef]
  55. Morgan, D.O. The cell cycle: Principles of control. In Niederrheinischen Gesellschaft für Natur-und Heilkunde zu Bonn; New Science Press: London, UK, 2007; pp. 259–263. [Google Scholar]
  56. Cross, F.R.; Umen, J.G. The Chlamydomonas cell cycle. Plant J. 2015, 82, 370–392. [Google Scholar] [CrossRef] [PubMed]
  57. Fehér, A.; Magyar, Z. Coordination of cell division and differentiation in plants in comparison to animals. Acta Biol. Szeged. 2015, 59, 275–289. [Google Scholar]
  58. Ewald, J.C. How yeast coordinates metabolism, growth and division. Curr. Opin. Microbiol. 2018, 45, 1. [Google Scholar] [CrossRef] [PubMed]
  59. Hammarton, T.C.; Engstler, M.; Mottram, J.C. The Trypanosoma brucei cyclin, CYC2, is required for cell cycle progression through G1 phase and for maintenance of procyclic form cell morphology. J. Biol. Chem. 2004, 279, 24757–24760. [Google Scholar] [CrossRef] [PubMed] [Green Version]
  60. Sivakumar, S.; Gorbsky, G.J. Spatiotemporal regulation of the anaphase-promoting complex in mitosis. Nat. Rev. Mol. Cell Biol. 2015. [Google Scholar] [CrossRef] [Green Version]
  61. Taira, N.; Mimoto, R.; Kurata, M.; Yamaguchi, T.; Kitagawa, M.; Miki, Y.; Yoshida, K. DYRK2 priming phosphorylation of c-Jun and c-Myc modulates cell cycle progression in human cancer cells. J. Clin. Investig. 2012, 122, 859–872. [Google Scholar] [CrossRef] [Green Version]
  62. Woods, Y.L.; Cohen, P.; Becker, W.; Jakes, R.; Goedert, M.; Xuemin, W.A.; Proud, C.G. The kinase DYRK phosphorylates protein-synthesis initiation factor eIF2Bɛ at Ser539 and the microtubule-associated protein tau at Thr212: Potential role for DYRK as a glycogen synthase kinase 3-priming kinase. Biochem. J. 2001, 355, 609–615. [Google Scholar] [CrossRef]
  63. Shimada, H.; Koizumi, M.; Kuroki, K.; Mochizuki, M.; Fujimoto, H.; Ohta, H.; Masuda, T.; Takamiya, K.I. ARC3, a chloroplast division factor, is a chimera of prokaryotic FtsZ and part of eukaryotic phosphatidylinositol-4-phosphate 5-kinase. Plant Cell Physiol. 2004, 45, 960–967. [Google Scholar] [CrossRef]
  64. Ma, H.; Lou, Y.; Lin, W.H.; Xue, H.W. MORN motifs in plant PIPKs are involved in the regulation of subcellular localization and phospholipid binding. Cell Res. 2006, 16, 466. [Google Scholar] [CrossRef] [Green Version]
  65. Kusano, H.; Testerink, C.; Vermeer, J.E.; Tsuge, T.; Shimada, H.; Oka, A.; Munnik, T.; Aoyama, T. The Arabidopsis phosphatidylinositol phosphate 5-kinase PIP5K3 is a key regulator of root hair tip growth. Plant Cell 2008, 20, 367–380. [Google Scholar] [CrossRef] [PubMed] [Green Version]
  66. Lee, J.; Han, C.T.; Hur, Y. Overexpression of BrMORN, a novel ‘membrane occupation and recognition nexus’ motif protein gene from Chinese cabbage, promotes vegetative growth and seed production in Arabidopsis. Mol. Cells 2010, 29, 113–122. [Google Scholar] [CrossRef] [PubMed]
  67. Robinson, M.J.; Cobb, M.H. Mitogen-activated protein kinase pathways. Curr. Opin. Cell Biol. 1997, 9, 180–186. [Google Scholar] [CrossRef]
  68. Feng, J.M.; Jiang, C.Q.; Sun, Z.Y.; Hua, C.J.; Wen, J.F.; Miao, W.; Xiong, J. Single-cell transcriptome sequencing of rumen ciliates provides insight into their molecular adaptations to the anaerobic and carbohydrate-rich rumen microenvironment. Mol. Phylogenet. Evol. 2020, 143, 116087. [Google Scholar] [CrossRef]
  69. Hwang, B.; Lee, J.H.; Bang, D. Single-cell RNA sequencing technologies and bioinformatics pipelines. Exp. Mol. Med. 2018, 50, 96. [Google Scholar] [CrossRef] [Green Version]
  70. Foissner, W. Life cycle, morphology, ontogenesis, and phylogeny of Bromeliothrix metopoides nov. gen., nov. spec., a peculiar ciliate (Protista, Colpodea) from tank bromeliads (Bromeliaceae). Acta Protozool. 2010, 49, 159–193. [Google Scholar]
  71. Liu, W.W.; Shao, C.; Gong, J.; Li, J.Q.; Lin, X.F.; Song, W.B. Morphology, morphogenesis, and molecular phylogeny of a new marine urostylid ciliate (Ciliophora, Stichotrichia) from the South China Sea, and a brief overview of the convergent evolution of the midventral pattern within the Spirotrichea. Zool. J. Linn. Soc. 2010, 158, 697–710. [Google Scholar] [CrossRef] [Green Version]
  72. Lu, X.; Huang, J.; Shao, C.; Berger, H. Morphology, cell-division, and phylogeny of Schmidingerothrix elongata spec. nov. (Ciliophora, Hypotricha), and brief guide to hypotrichs with Gonostomum-like oral apparatus. Eur. J. Protistol. 2018, 62, 24–42. [Google Scholar] [CrossRef]
  73. Keryer, G.; Davis, F.M.; Rao, P.N.; Beisson, J. Protein phosphorylation and dynamics of cytoskeletal structures associated with basal bodies in Paramecium. Cell Motil. Cytoskelet. 1987, 8, 44–54. [Google Scholar] [CrossRef]
  74. Nussbaum, M. Über spontane und künstliche Zellteilung. Sitzungsberichte der Niederrheinischen Gesellschaft für Natur-und Heilkunde zu Bonn 1884, 41, 259–263. [Google Scholar]
  75. Tang, S.K.; Marshall, W.F. Self-repairing cells: How single cells heal membrane ruptures and restore lost structures. Science 2017, 356, 1022–1025. [Google Scholar] [CrossRef] [PubMed] [Green Version]
  76. Onsbring, H.; Jamy, M.; Ettema, T.J. RNA sequencing of Stentor cell fragments reveals transcriptional changes during cellular regeneration. Curr. Biol. 2018, 28, 1281–1288. [Google Scholar] [CrossRef] [PubMed] [Green Version]
  77. Hu, X.Z.; Warren, A.; Song, W.B. Observations on the morphology and morphogenesis of a new marine hypotrich ciliate (Ciliophora, Hypotrichida) from China. J. Nat. Hist. 2004, 38, 1059–1069. [Google Scholar] [CrossRef]
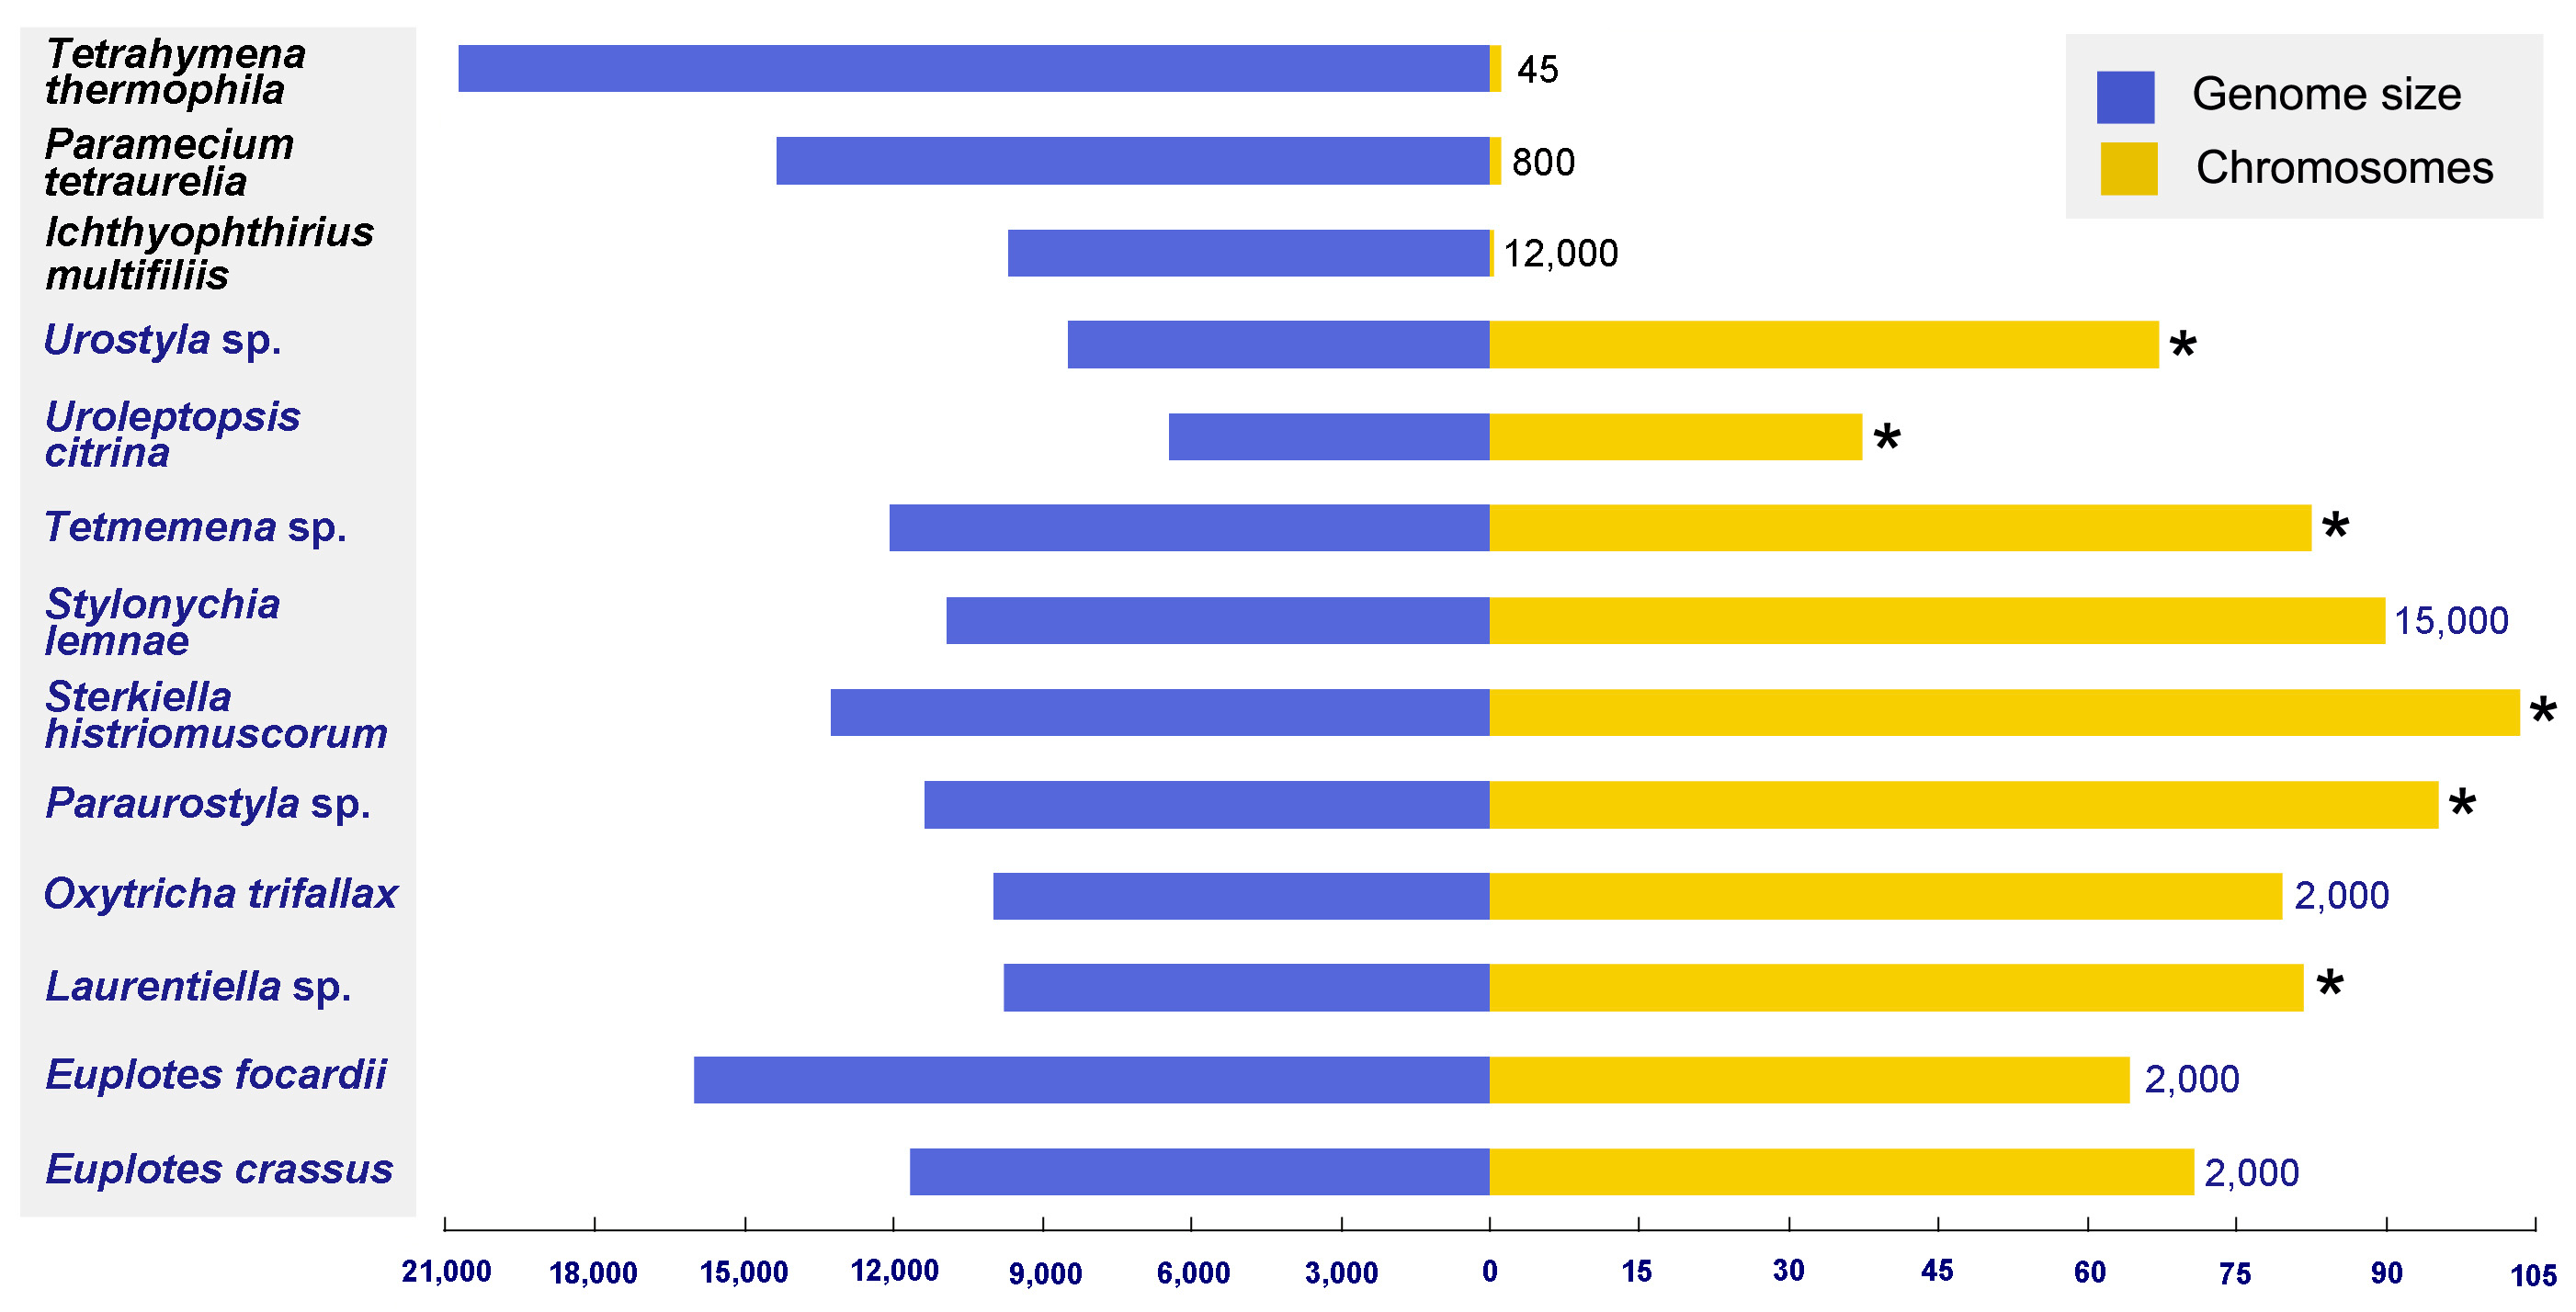
Figure 1. Comparison of 13 ciliate macronuclear genomes. Blue lines denote the genome size; yellow lines represent the number of chromosomes. Species names are listed on the left, while macronuclear ploidy is shown on the right. Asterisks denote that macronuclear ploidy is unclear. Species names and ploidy are depicted in different colors for different ciliate groups (Spirotrichea: dark blue; Oligohymenophorea: black). All data were obtained from references [20,28,29,30,31,32,33,34,35,36,37].
Microorganisms 08 00108 g001
Figure 2. Statistics of transcriptomic data and cluster analysis of differentially expressed genes (DEGs). (A), Heatmap of the top 100 DEGs between the cell division (D) and growth (G) stages from three replicates. Each column represents a sample, and each row represents a unigene. (B), Relative transcription levels of DEGs in group D in comparison with group G shown by RT-qPCR and RNA-Seq. Blue lines represent the fold change of gene transcription revealed by RNA-Seq using log2. Green bars represent the relative transcription level determined by RT-qPCR using log2 (2−ΔΔct). Error bars represent standard deviations from three independent biological replicates. (C), Length distributions of unigene sequences derived from the transcriptome assembly of Pseudokeronopsis erythrina.
Microorganisms 08 00108 g002
Figure 3. Morphology of Pseudokeronopsis erythrina, analysis, and functional annotation of unigenes. (A,B), P. erythrina from life at growth stage (A) and infraciliature at cell division stages from Chen et al. [15] (B). (C), Venn diagram of DEGs for stage D and stage G. Unigenes shared by stages D and G are in dark purple, while unique ones at stage D and G are in orange and light purple, respectively. (D), Annotation of unigenes according to clusters of orthologous groups (COG). Numbers above bars represent predicted unigenes. Scale bars in (A, B): 60 μm.
Microorganisms 08 00108 g003
Figure 4. Top 30 GO terms and enrichment of the DEGs at the D stage in the biological process category (A), cell components category (B), molecular function category (C), and KEGG pathway enrichment (D). The size of dots indicates the number of DEGs. The color of dots corresponds to the FDR/Q value.
Microorganisms 08 00108 g004
Figure 5. Number of unigenes in Pseudokeronopsis erythrina annotated in KEGG pathways.
Microorganisms 08 00108 g005
Figure 6. RT-qPCR melting curves for five up-regulated (AE) and six down-regulated differentially expressed genes (FK). (A), c37490_g1; (B), c38398_g1; (C), c38773_g1; (D), c52670_g1; (E), c60031_g1; (F), c60031_g1; (G), c56677_g1; (H), c50771_g1; (I), c58897_g1; (J), c47080_g1; (K), c58837_g1. In each figure, “g” and “d” represent stage G and stage D.
Microorganisms 08 00108 g006
Table 1. Statistical summary of sequencing and assembly results.
SampleD1D2D3G1G2G3
raw read number87,103,77884,670,77657,275,04452,963,60260,176,33450,426,634
clean read number39,375,24440,285,35641,369,50441,684,59643,051,90635,788,890
raw base number (Mb)12,460.3012,112.258193.267576.508608.297213.59
clean base number (Mb)5576.195721.745913.745958.986154.615116.24
Q30 (%)81.482.2596.3796.3996.1396.27
Table 2. Significant up- or down-regulated expressed in stage D compared to stage G.
Gene FamilyUp/DownGene_idNr Description
CYCsupc62398_g1Mitotic cyclin-CYC2 [Oxytricha trifallax]
upc67538_g2Cyclin [Oxytricha trifallax]
upc17611_g1Cyclin-T [Oxytricha trifallax]
upc9656_g1Cyclin, N-terminal domain-containing protein [Oxytricha trifallax]
upc36176_g1Mitotic cyclin-CYC2, putative [Oxytricha trifallax]
upc48130_g1Cyclin, N-terminal domain-containing protein [Oxytricha trifallax]
upc54046_g1Amine-terminal domain cyclin [Tetrahymena thermophila SB210]
downc60024_g1G1/S-specific cyclin-E1, putative [Oxytricha trifallax]
APCsupc57016_g1TPR repeat-containing protein [Oxytricha trifallax]
upc75917_g1TPR repeat-containing protein [Oxytricha trifallax]
upc54345_g1Anaphase-promoting complex subunit 8-like [Stylonychia lemnae]
upc58189_g1Anaphase-promoting complex subunit 10 [Stylonychia lemnae]
upc16402_g1Anaphase-promoting complex subunit 11 [Stylonychia lemnae]
CDKsupc61357_g2Cyclin-dependent kinase b2-2-like [Stylonychia lemnae]
upc40281_g1Cyclin-dependent kinase regulatory subunit family protein [Stylonychia lemnae]
DYRKupc61235_g1Putative dual specificity protein phosphatase cdc14 [Oxytricha trifallax]
upc58364_g1Dual specificity protein phosphatase [Stylonychia lemnae]
downc47824_g1Dual specificity phosphatase, catalytic domain-containing protein [Oxytricha trifallax]
downc12202_g1Dual specificity catalytic domain-containing protein [Stylonychia lemnae]
MORNupc56401_g1Putative MORN repeat protein [Oxytricha trifallax]
upc60320_g1Putative MORN repeat protein [Oxytricha trifallax]
upc60776_g1Putative MORN repeat protein [Oxytricha trifallax]
upc48198_g1Putative MORN repeat protein [Oxytricha trifallax]
upc66123_g1Putative MORN repeat protein [Oxytricha trifallax]
upc62710_g1MORN repeat protein [Stylonychia lemnae]
upc60934_g1MORN repeat protein [Stylonychia lemnae]
upc50818_g1MORN repeat-containing protein 5 [Stylonychia lemnae]
upc59470_g1MORN repeat protein [Stylonychia lemnae]
upc26899_g1MORN motif protein [Tetrahymena thermophila SB210]
MAPKupc57299_g1Putative MAPK [Oxytricha trifallax]
upc59004_g1Mitogen-activated protein kinase kinase [Oxytricha trifallax]
Tubulinupc37490_g1Alpha tubulin, putative [Oxytricha trifallax]
upc7781_g1Microtubule-associated RP/EB member 2 [Stylonychia lemnae]
Table 3. Up- or down-regulated DEGs checked by RT-PCR.
Gene idNr DescriptionUp/
Down
Fold Changelog2 Fold Change
c37490_g1Alpha tubulin, putative [Oxytricha trifallax]up3.341.74
c38398_g114-3-3 domain-containing protein [Oxytricha trifallax]up5.52.46
c38773_g1Histone variant H3.8 [Stylonychia lemnae]up100.016.64
c52670_g1Electron transferring flavor protein dehydrogenase [Oxytricha trifallax]up2.561.36
c58750_g1Proteasome subunit beta type [Stylonychia lemnae]up4.872.28
c60031_g1Eukaryotic aspartyl protease family protein [Stylonychia lemnae]down0.27−1.89
c56677_g1EF hand family protein [Stylonychia lemnae]down0.01−6.16
c50771_g1cAMP-dependent protein kinase catalytic subunit, putative [Oxytricha trifallax]down0.43−1.22
c58897_g1Citrate synthase [Stylonychia lemnae]down0.09−3.68
c47080_g1Adenosine kinase [Stylonychia lemnae]down0.22−2.17
c58837_g1S-adenosyl-L-homocysteine hydrolase [Stylonychia lemnae]down0.39−1.35