Article

Genetic Traces of the Francisella tularensis Colonization of Spain, 1998–2020

by
Kerstin Myrtennäs
1,*,
Raquel Escudero
2,
Ángel Zaballos
2,
Rosa González-Martín-Niño
2,
Miklós Gyuranecz
3 and
Anders Johansson
4
1
Division of CBRN Defence and Security, Swedish Defence Research Agency (FOI), 90182 Umeå, Sweden
2
Instituto de Salud Carlos III, Centro Nacional de Microbiología, 28220 Madrid, Spain
3
Institute for Veterinary Medical Research, Centre for Agricultural Research, Hungária körút 21, 1143 Budapest, Hungary
4
Department of Clinical Microbiology, Umeå University, SE-901 87 Umeå, Sweden
*
Author to whom correspondence should be addressed.
Microorganisms 2020, 8(11), 1784; https://doi.org/10.3390/microorganisms8111784
Submission received: 23 October 2020 / Revised: 6 November 2020 / Accepted: 12 November 2020 / Published: 14 November 2020
(This article belongs to the Special Issue Epidemiology of Tularemia and Francisella tularensis)

Abstract

:
More than 1000 humans have acquired the febrile disease tularemia in Spain since the first notification of human cases in 1997. We here aimed to study the recent molecular evolution of the causative bacterium Francisella tularensis during disease establishment in Spain. Single-nucleotide polymorphisms (SNPs) and variable-number tandem repeats (VNTRs) were analyzed in whole-genome sequences (WGS) of F. tularensis. Short-read WGS data for 20 F. tularensis strains from humans infected in the periods 2014–2015 and 2018–2020 in Spain were generated. These data were combined with WGS data of 25 Spanish strains from 1998 to 2008 and two reference strains. Capillary electrophoresis data of VNTR genetic regions were generated and compared with the WGS data for the 11 strains from 2014 to 2015. Evolutionary relationships among strains were analyzed by phylogenetic methods. We identified 117 informative SNPs in a 1,577,289-nucleotide WGS alignment of 47 F. tularensis genomes. Forty-five strains from Spain formed a star-like SNP phylogeny with six branches emerging from a basal common node. The most recently evolved genomes formed four additional star-like structures that were derived from four branches of the basal common node. VNTR copy number variation was detected in two out of 10 VNTR regions examined. Genetic clustering of strains by VNTRs agreed with the clustering by SNPs. The SNP data provided higher resolution among strains than the VNTRs data in all but one cases. There was an excellent correlation between VNTR marker sizing by capillary electrophoresis and prediction from WGS data. The genetic data strongly support that tularemia, indeed, emerged recently in Spain. Distinct genetic patterns of local F. tularensis population expansions imply that the pathogen has colonized a previously disease-free geographical area. We also found that genome-wide SNPs provide higher genetic resolution among F. tularensis genomes than the use of VNTRs, and that VNTR copy numbers can be accurately predicted using short-read WGS data.

1. Introduction

Francisella tularensis causes the zoonotic disease tularemia. In Europe, the F. tularensis subspecies holarctica is the causative agent often resulting in a febrile, long-lasting disease characterized by lymph node enlargement among humans (type B tularemia) but with a rate of mortality less than one percent. In North America, type B tularemia exists side by side with type A tularemia, a disease that is caused by the F. tularensis subspecies tularensis, with a mortality among humans of several percent. Infected insect or tick bites or direct contact with sick small mammals are common routes of infection for humans in both types of tularemia [1]. It appears that F. tularensis can persist locally somewhere in the environment between seasonal outbreaks of disease [2,3,4,5,6]. The advancement of genetic typing methods for F. tularensis has shown that the evolution of F. tularensis is clonal, that the subspecies holarctica evolved recently, and that this subspecies has successfully spread across large geographical distances in Europe [7,8,9,10,11,12]. The limited genetic variation and the clonal inheritance pattern of this bacterium are helpful properties in the interpretation of the genetic kinship of F. tularensis. Commonly used genetic markers for evolutionary and epidemiology studies of F. tularensis include multi-locus variable-number tandem repeats (VNTRs) [13,14,15] and single-nucleotide polymorphisms (SNPs) mapped in a few genes or at the whole genome scale [7,8,9,10,11,12]. It has been argued that markers with a more rapid evolution, such as VNTRs, could be especially useful for tracking the recent evolution of F. tularensis [13], but it is unknown if this property of VNTRs provides as much discrimination as the more recent approach of mapping SNPs in the full genome of the bacterium using whole-genome sequencing (WGS) [14,16].
In Spain, tularemia was first reported in 1997 when an outbreak affected 585 humans [17]. More than 1000 patients have since been reported, with a geographical focus of disease in the autonomous community of Castilla y León. All the infections in humans and animals in Spain appear to be caused by a single, genetically extremely-coherent subpopulation of F. tularensis subspecies holarctica [16]. This situation with intense disease activity and a recent disease introduction should provide an excellent opportunity for investigating bacterial evolution in a natural environment. Bacteria cultured from infected individuals in recurrent outbreaks in Spain can provide evolutionary snap-shots of an F. tularensis population of very recent common ancestry.
The choice of genetic markers for evolutionary and epidemiology studies of F. tularensis has, to some extent, been influenced by the technology available for mapping the markers. VNTRs were popular markers when capillary electrophoresis for detecting VNTR copy-number variation became widely available in the late 1990s [14,18]. A few years later, when short-read WGS, which was ideal to reliably map SNPs, became cheaper and widely available, VNTRs were more or less abandoned [8].
Here, we describe the recent molecular evolution of F. tularensis in Spain by utilizing short-read WGS data. We have investigated the relationship between two types of genetic markers, VNTRs and SNPs, in these data. In addition, we investigated the reliability of predicting VNTR copy numbers from WGS data by comparison with capillary electrophoresis data.

2. Materials and Methods

2.1. Strains

Twenty F. tularensis strains isolated from humans in 2014–2015 and 2018–2020 and 25 strains isolated in 1998 and 2007–2008 in the autonomous community of Castila y León, Spain, were included (Table 1). The latter 25 strains were previously genome-sequenced [16] (summarized in Appendix A Table A1). In addition, reference strains from Italy (FSC031; O-407) and France (FTNF002-00 (FTA) GenBank acc. no. CP000803.1.) were included.

2.2. Genome Sequencing

The 20 strains isolated in 2014–2015 and 2018–2020 were cultivated on cysteine heart agar supplemented with 9% chocolatized red blood cells (CHAB). DNA was prepared and purified using the QIAamp DNA mini kit (Qiagen, Hilden, Germany). A library was prepared using the Nextera XT kit and sequenced at the Centro Nacional de Microbiología-Instituto de Salud Carlos III, Genomic Unit, on a MiSeq instrument (Illumina Inc., San Diego, CA, USA), which produced 2 × 300 bp pair-end read data. The genomes were assembled using ABySS 1.5.1 [19] and submitted to GenBank under BioProject accession number PRJNA548692.

2.3. Taxonomic Classification

Each genome was assigned to a genetic clade using CanSNPer [20,21]. Upon detection of a new clade with at least two taxa, this clade was given a new taxonomic canSNP index following the scheme at Github [20]. One SNP per branch was selected to define the whole branch.

2.4. Sizing of PCR Products Targeting VNTRs with Capillary Electrophoresis and Genome Sequencing

PCR product capillary electrophoretic sizing, or fragment analysis for short, of ten VNTRs (Ft-M2, Ft-M3, Ft-M4, Ft-M5, Ft-M6, Ft-M10, Ft-M20, Ft-M22, Ft-M23, and Ft-M24) was performed at the Institute for Veterinary Medical Research, Hungarian Academy of Science, on an ABI Prism 3100 Genetic Analyzer (Applied Biosystems, Foster City, CA, USA) using primers described in Appendix A Table A2, and under the following conditions: the PCRs were done in single-plex in a 25-μL volume using 0.5–2 μL of each primer, 1 μL DNA template, and a reaction mixture with 5 μL 5× Colorless GoTaq Flexi Buffer (Thermo Fisher Scientific, Waltham, MA, USA), 2 μL 25 mM MgCl2 (Thermo Fisher Scientific), 0.8 μL 10 mM dNTP (Thermo Fisher Scientific), and 0.2–0.4 μL GoTaq Polymerase (5 unit/μL) (Thermo Fisher Scientific). The cycling conditions were 94 °C for 5 min and then 35 cycles with denaturation at 94 °C for 30 s, primer annealing at 58 °C for 30 s, and extension at 72 °C for 30 s. The program ended with a final extension at 72 °C for 30 s [21]. The PCR product size was determined with Peak ScannerTM Software v.1.0 (Applied Biosystems). These ten markers have previously been used to subtype the subspecies holarctica from Europe [13]. The marker Ft-M20 was targeted using two assays—Ft-M20A and Ft-M20B.
Sizing of PCR products was performed using an in-house Python script by mapping the primer sequences to each genome.

2.5. Phylogenetics and Phylogeography

Single-nucleotide polymorphisms and genetic distances among the strains were determined using a whole-genome alignment produced by progressiveMauve with default settings. A neighbor-joining tree based on the core of the 47 genomes was constructed in MEGAX (Tamura et al.) with the number of differences method and complete deletion. The SNP phylogeny was compared with VNTR marker patterns. The geographical and temporal distributions of F. tularensis strains belonging in different phylogenetic clades were analyzed for the seven provinces of Spain experiencing tularemia outbreaks.

3. Results

3.1. Genome Sequencing, Assembly and SNP Identification

We performed short-read sequencing and created new genome assemblies for 20 F. tularensis isolates cultured from diagnostic specimens of humans infected in Spain in 2014–2015 and 2018–2020. The assemblies typically consisted of 100 contigs with ends corresponding to the multiple copy insertion sequence elements ISFtu1 or ISFtu2 or the multiple copy ribosomal operon of F. tularensis (Appendix A, Table A3). The mean sequence depth (genome coverage) ranged from 89 to 578. These new sequence data were analyzed together with previously published genome sequence assemblies of 25 F. tularensis genomes from Spain using a common analysis pipeline. This resulted in a core genome of 1,577,289 nt, including genes and intergenic regions excluding multiple copy insertion sequence elements and ribosomal operons representing 45 genomes from Spain and two closely related reference genomes from Italy and France. The core genome size corresponds to 88% of the total reference genome of the strain SCHU S4, including its multiple copy insertion sequence elements and ribosomal operons. We found 117 SNPs in the core genome of the 47 genomes analyzed in this work (Figure 1), corresponding to a core genome identity of 99.9925%.

3.2. Taxonomic Classification

To facilitate future comparisons with genomes included in this study, all genomes were assigned to the general taxonomic system built on canSNPs of F. tularensis. To this end, 34 SNPs defined 13 genetic clades having more than one member among the 47 strains, i.e., these canSNPs were not strain-specific (Appendix A, Table A4). Five of the 13 genetic clades were new to this study and the four branches leading to these new clades were indexed from B.107 to B.110 and B.315. One canonical SNP per new branch was selected to represent each branch as follows: B.107 (canSNP 520,520), B.108 (1,327,297), B.109 (1,082,513), B.110 (1,301,561), and B.315 (1,721,277), with the positions in brackets referring to the genome FTNF002-00 (FTA) with GenBank acc. no. CP000803.1. The canSNP typing scheme is available at Github [20], including the five new canSNPs described in this work.

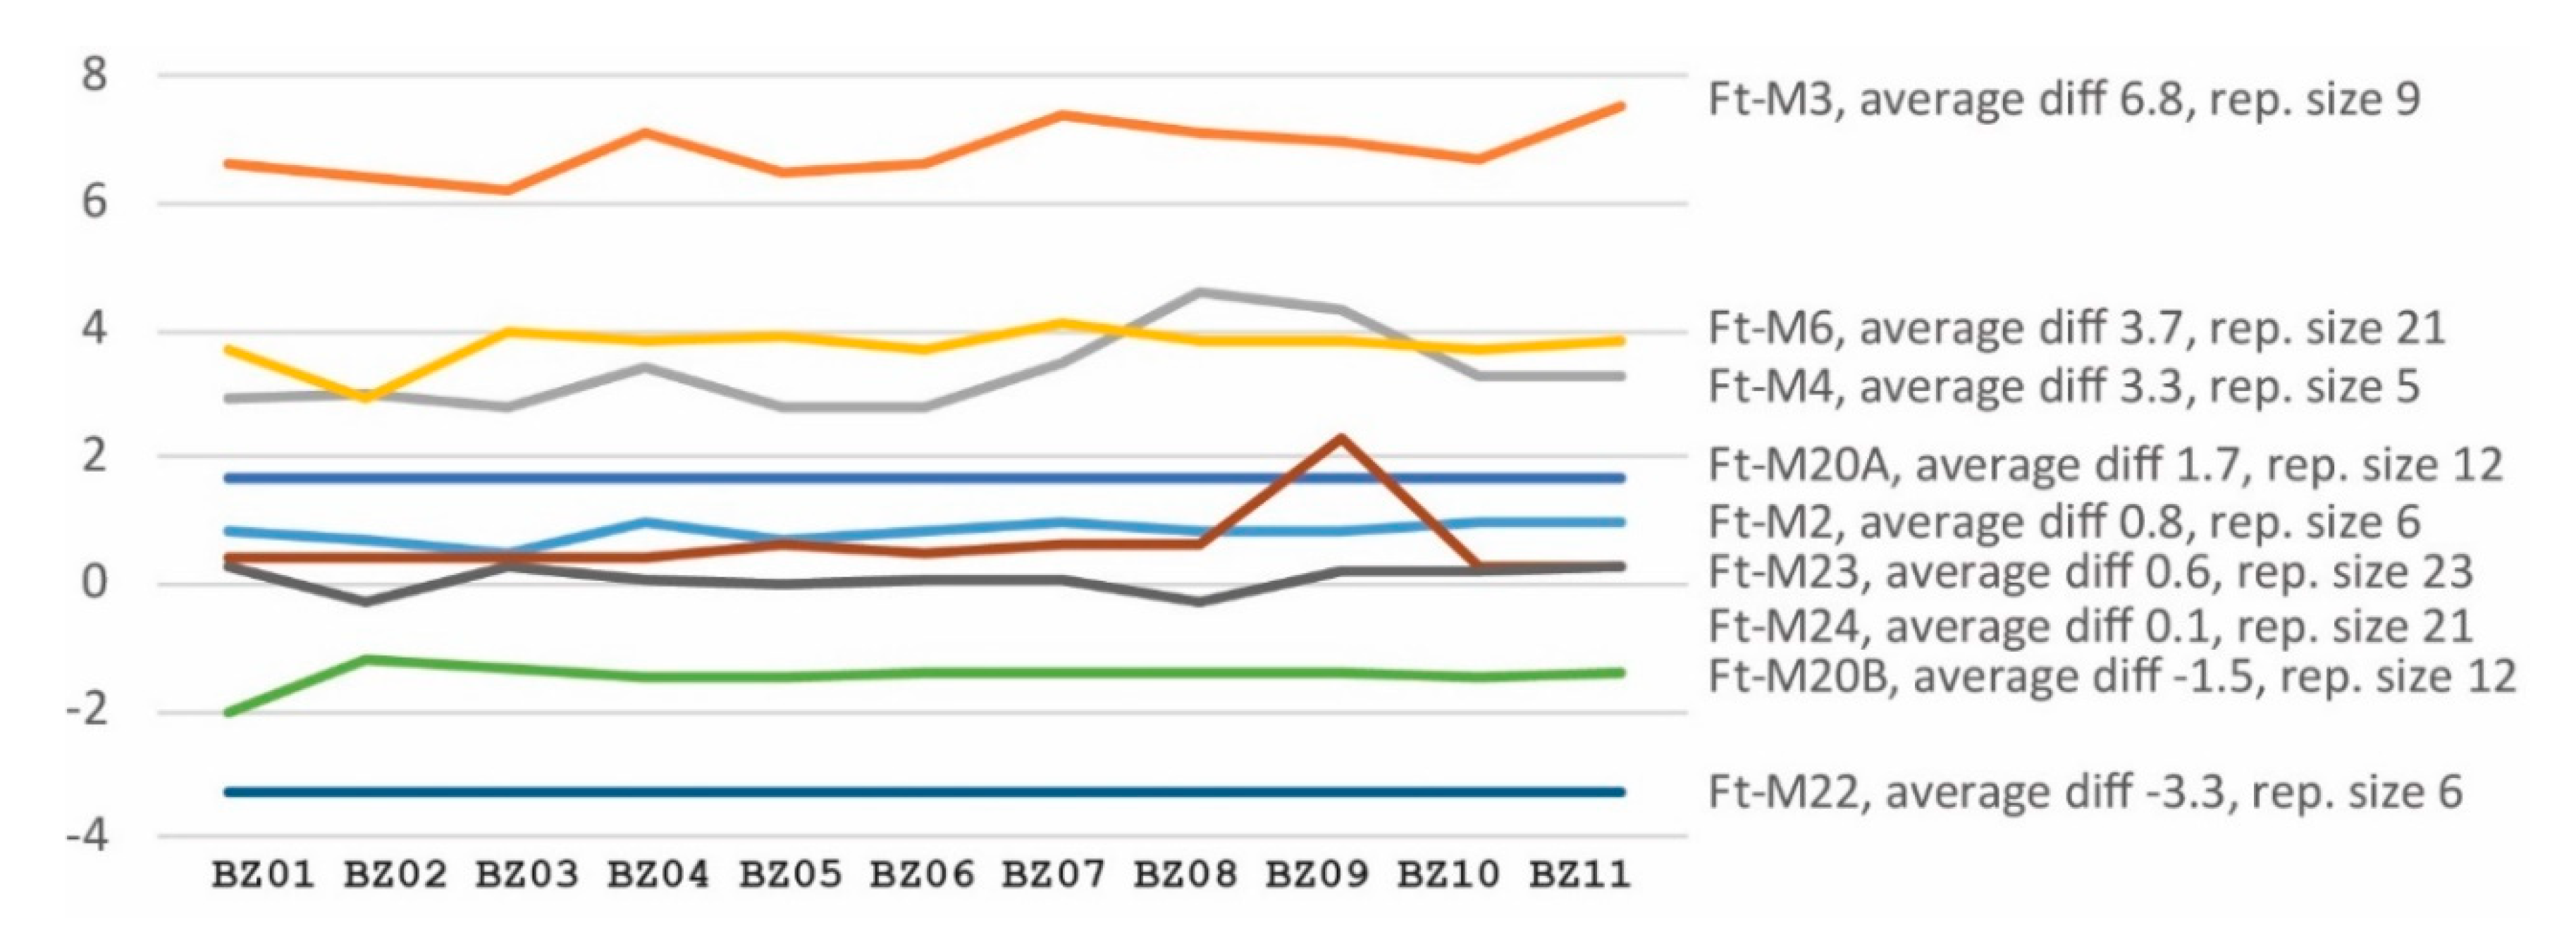
3.3. Analysis of VNTRs by Short Read Genome Sequencing and Capillary Electrophoresis

To investigate if VNTR copy numbers in F. tularensis genomes can be predicted using short-read genome sequence data, we compared PCR product capillary electrophoretic VNTR sizing versus sizes from short-read data. We found that only two VNTR markers out of the ten VNTR markers tested by capillary electrophoresis varied between the 47 F. tularensis strains (Appendix A, Table A5 and Table A6). Data for the two variable markers, that are named Ft-M3 and Ft-M4, can be found in Table 2 for the 11 genomes with WGS data generated in this study. No variation was observed for any other marker among the 47 strains (Ft-M2, Ft-M5, Ft-M6, Ft-M10, Ft-M20A, Ft-M20B, Ft-M22, Ft-M23, and Ft-M24 were invariable). Comparison of VNTR sizes predicted from capillary electrophoresis fragment analysis versus WGS data revealed that the size estimates were consistent across different genomes (Figure 2 and Appendix A Table A7). The analysis showed that translation from VNTR sizes obtained by fragment analysis to true VNTR sizes in the WGS data needs marker-specific correction of the former, and that this is especially important for markers with a short repeat size (<10 bp).

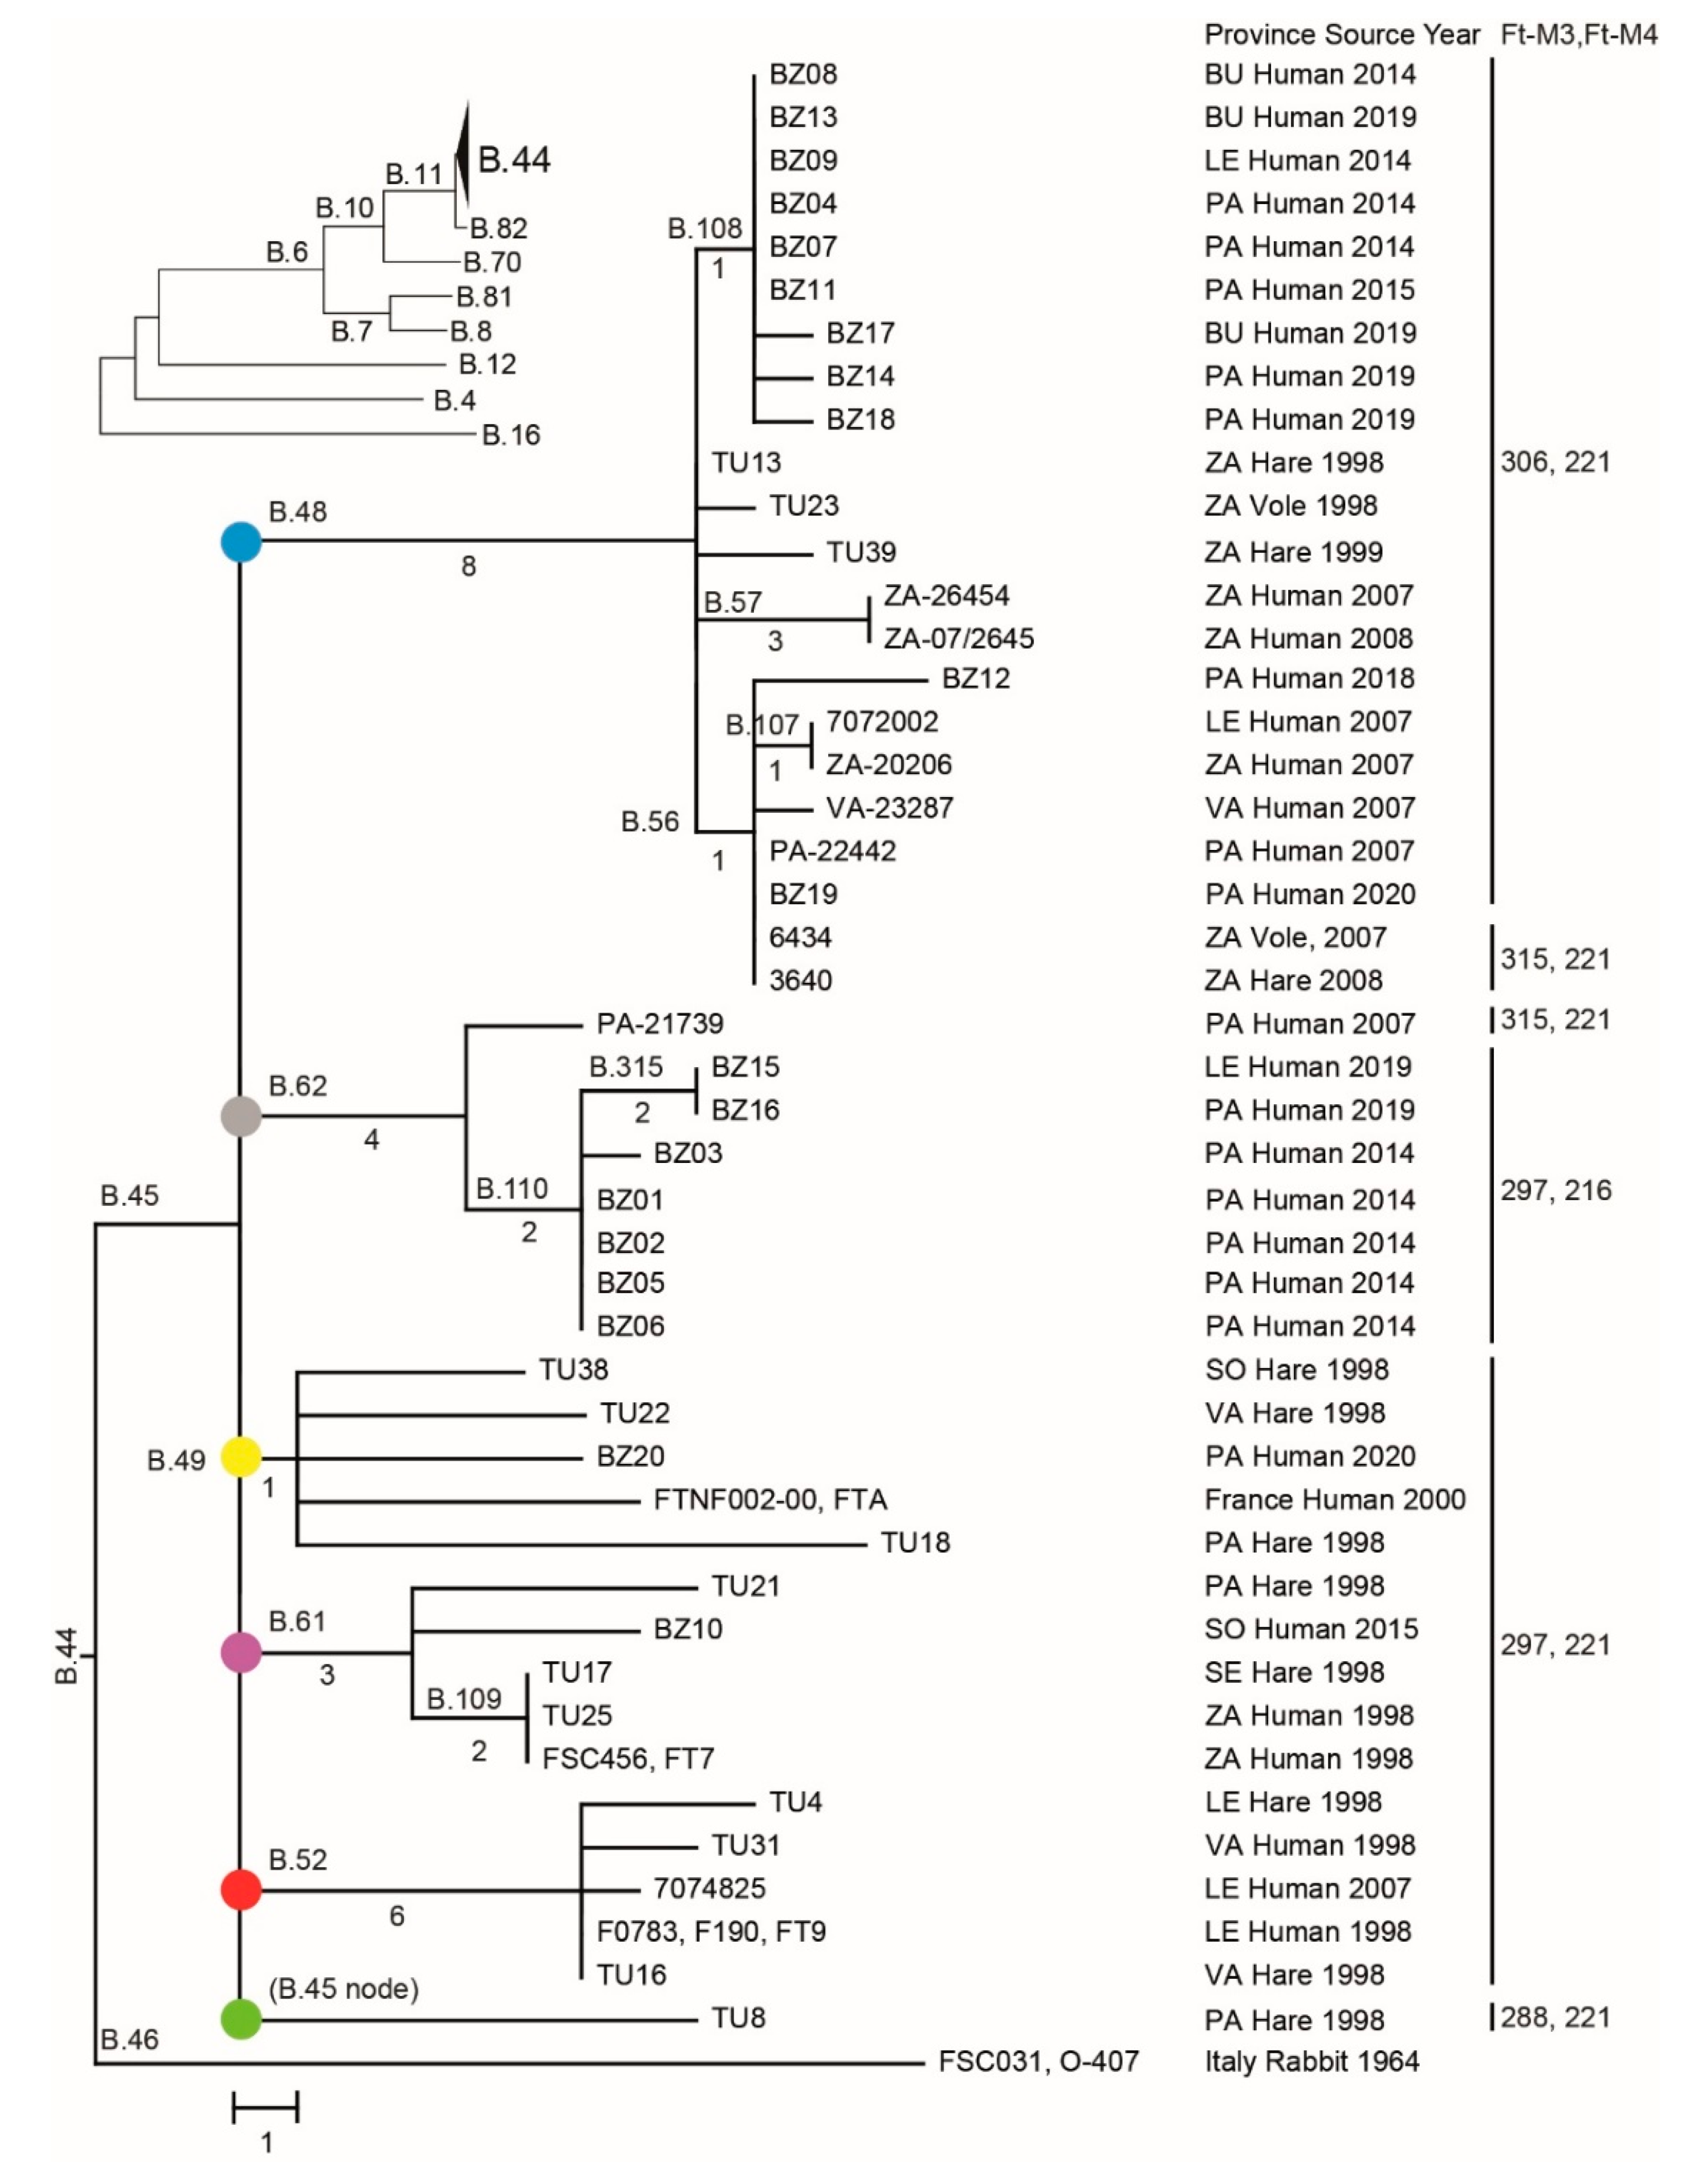
3.4. Phylogenetic Analysis Using SNP or VNTR Data
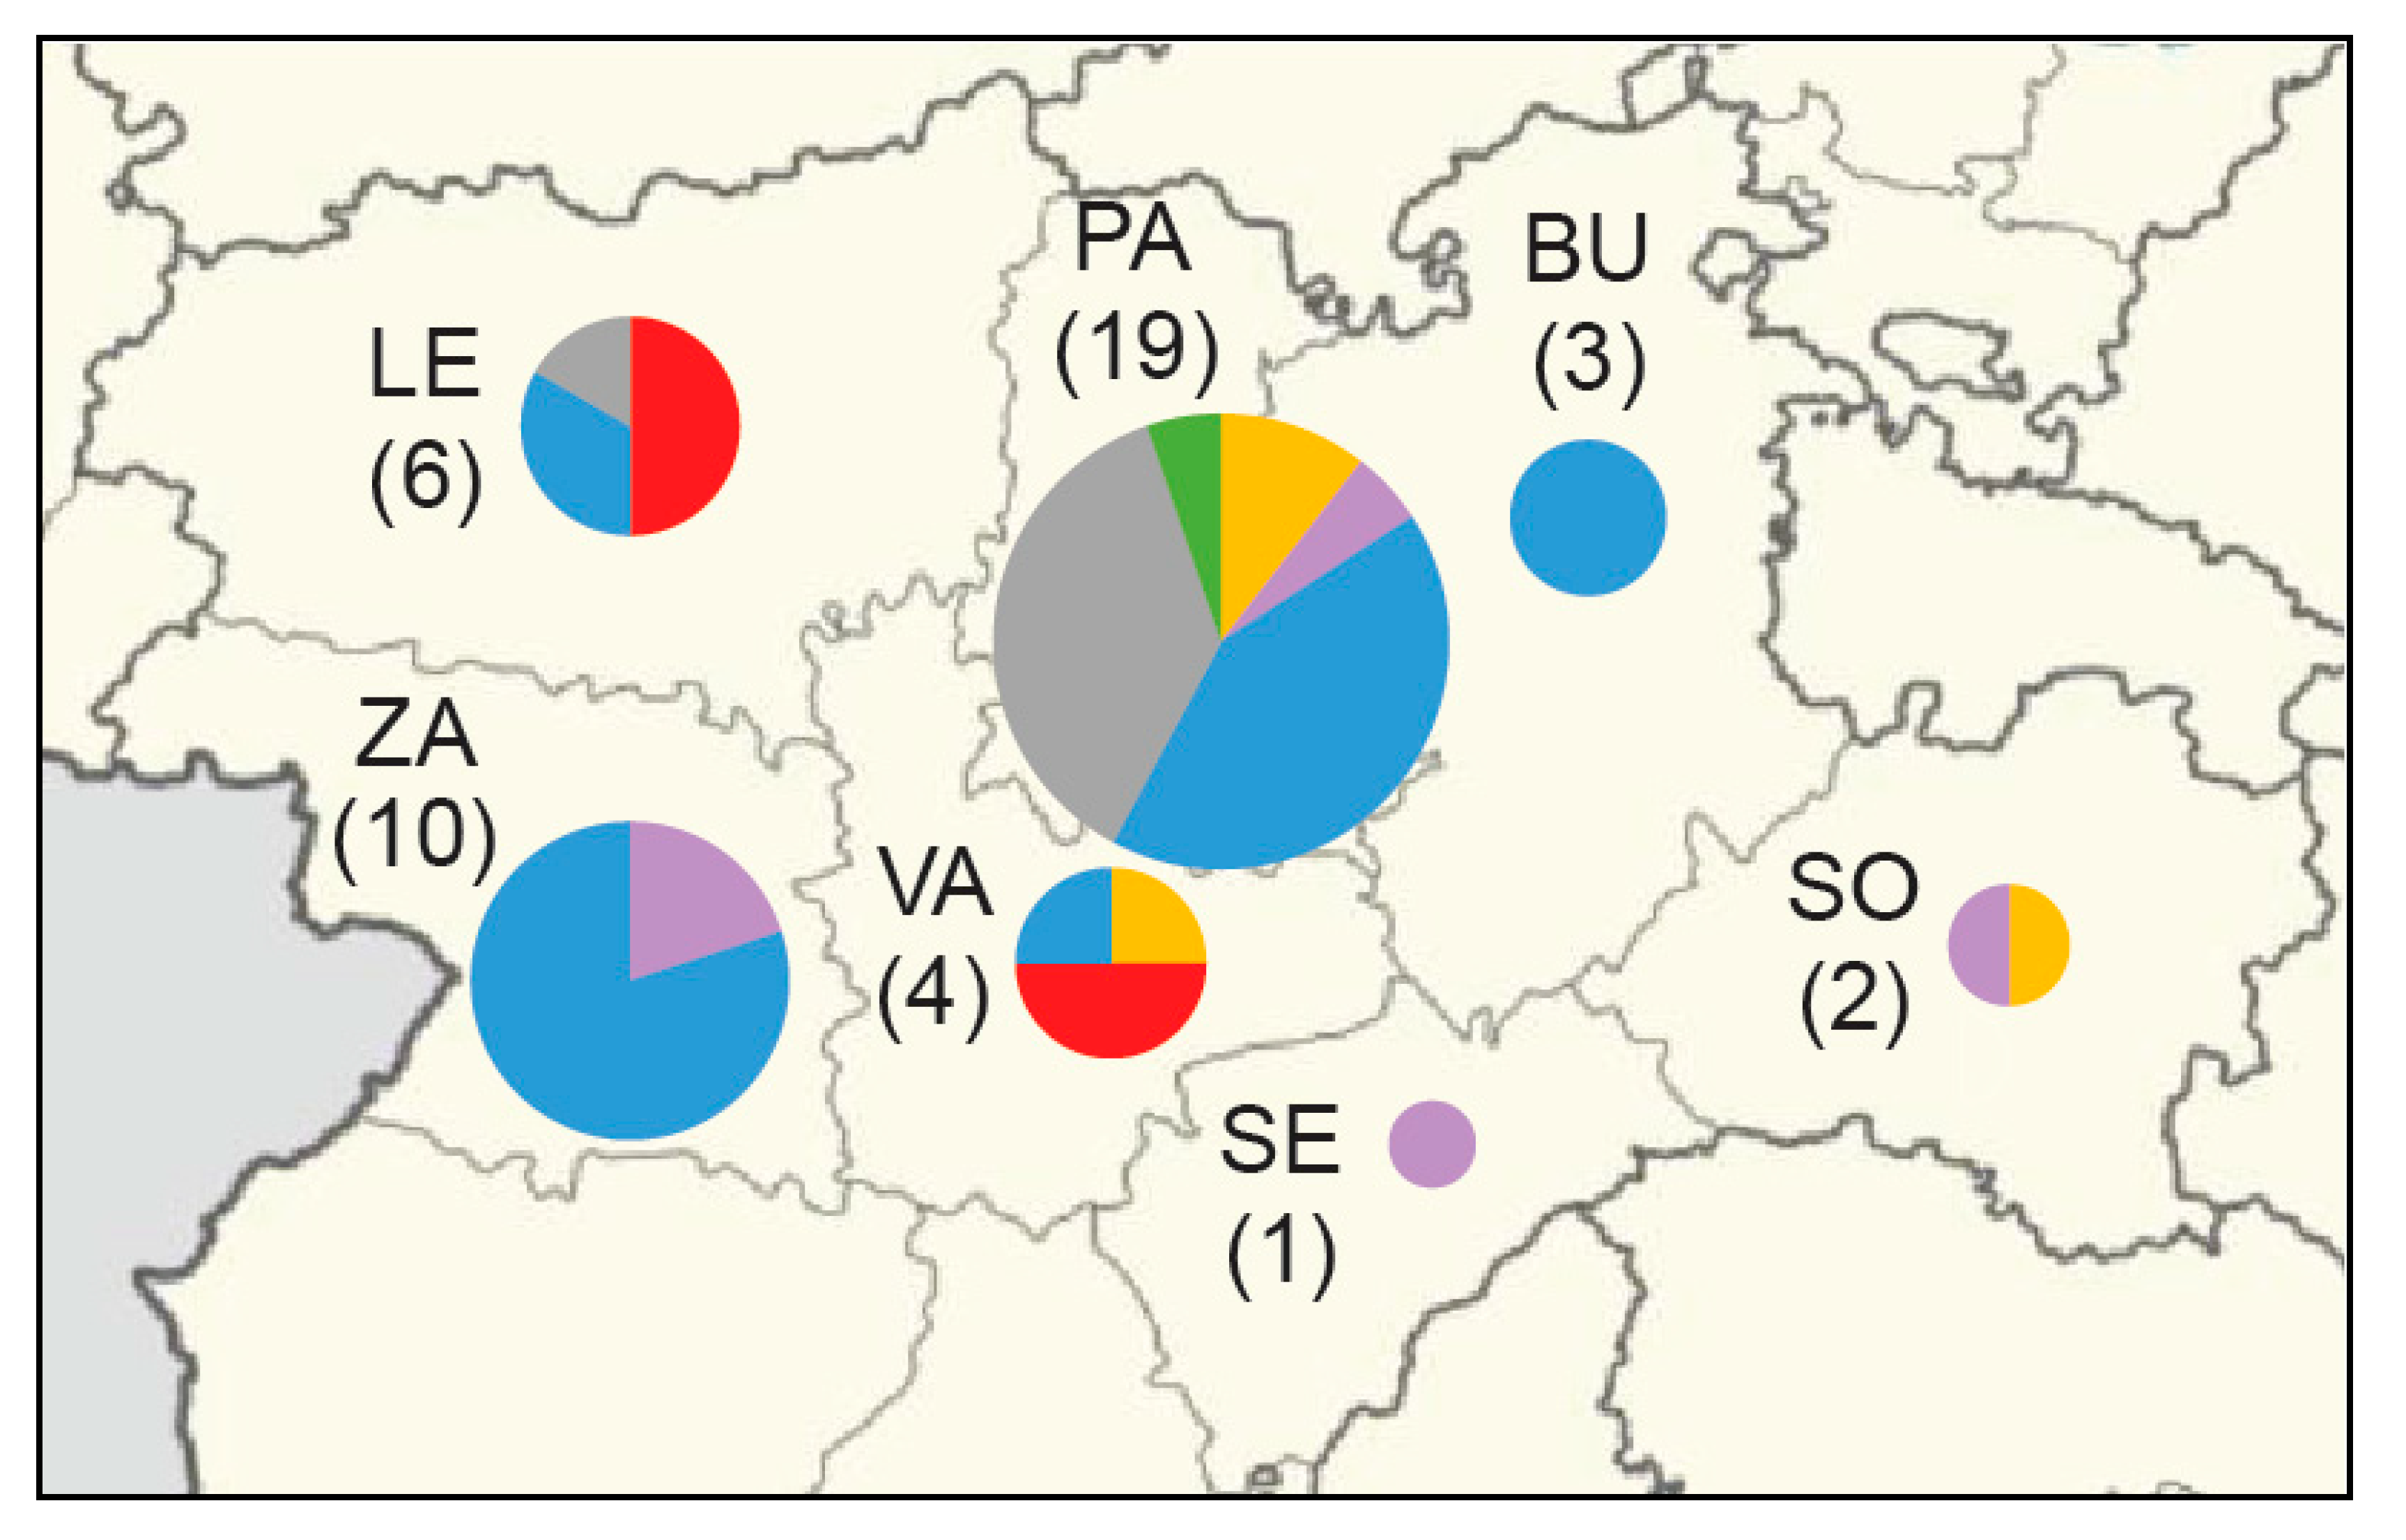
The phylogenetic tree based on 117 core SNPs displayed a star-like shape with multiple hard polytomies, of which the most basal polytomy had six tree branches corresponding to genetic distances ranging from 1 to 8 nt, emerging from a common node representing the most recent common ancestor (Figure 1). Four additional polytomies were present among the downstream branching patterns of the tree. The SNP inheritance pattern along the different branching structures of the tree was strictly clonal, i.e., there were no SNPs that were inconsistent with the tree structure. The genetic clustering by VNTR markers agreed to the clustering by SNPs, although the VNTR markers in all but one cases resulted in a lower resolution among taxa (Figure 1, strains 3640 and 6434). There were, in total, 23 SNP genotypes that matched six VNTR genotypes.

3.5. Phylogeography

The phylogeography of six major clades including 45 F. tularensis strains with a known place of isolation in seven Spanish provinces is shown in Figure 3. The total diversity at the clade level and their spatiotemporal distribution is illustrated in Figure 1 and Figure 4. Most strains and the largest genetic diversity were from the province of Palencia. We found that F. tularensis strains belonging to two distinct clades, B.108 and B.110, caused the 2014–2015 human tularemia outbreaks in Palencia. Notably, we found that a single strain ancestral to B.110, named PA-21739, was isolated from a human in Palencia as early as 2007. In 2018–2019, strains of a new subclade, B.315, which is closely related to B.110, caused new outbreaks in Palencia. In contrast to this regional pattern of genetic homogeneity over time, Palencia strains from 2020 were genetically more diverse, belonging in B.49 and B.56. The diversity was apparently present in Palencia already in 1998, as we found single isolates obtained from hares in three diverse major clades, B.49, B.61, and B.45. The largest genetic distance within a clade with strains from Spain was 15 SNPs and was found between two strains from Palencia in 1998 and 2020 (clade B.49). The human epidemiological data connected to the 20 F. tularensis strains from 2014–2015 and 2018–2020 suggested that the disease had been acquired during outdoor activities (Table 1).

4. Discussion

The introduction of tularemia into Spain offered an opportunity to study the recent molecular evolution of F. tularensis in relation to disease emergence in a new geographical area. We found an evolutionary pattern strongly suggesting recent pathogen population expansion in Spain. The data are consistent with epidemiological records of recent disease import into Spain and show that the F. tularensis population size has rapidly increased locally, now causing disease among large numbers of humans and small mammals. We also found that two types of evolutionary marker in the F. tularensis genomes, SNPs and VNTRs, essentially tell the same story.
The analysis of 20 new F. tularensis genomes from 2014 to 2015 and 2018 to 2020 and 25 older genomes of strains from 1998 and 2007–2008, revealed a star-like phylogeny with six branches emerging from a common basal node, a pattern supporting a recent pathogen population expansion. A basal star-like structure was accompanied by additional star-like branching structures further out on the tree branches signifying that the initial population expansion was followed by additional population expansions within the country. We previously reported a star-like phylogeny for F. tularensis in an investigation of disease introduction from more Eastern countries into Western Europe as a whole, but it was not as pronounced as observed here [16]. Other recent reports of the migration pattern of F. tularensis in Europe include studies from France, Switzerland, Germany, and Austria [22,23,24,25]. The star-like phylogenetic pattern seen here is an example of rapidly increasing biodiversity at the subspecies level of a genetically monomorphic infectious agent. The phenomenon as such, however, is more often described at a higher taxonomic level in eukaryotic species and is named evolutionary radiation, one of the examples being Darwin’s finches. In the current work, we have captured bacterial subpopulations that are in very early stages of increasing biodiversity connoted by star-like structures in analyses of bacterial WGS data. Evolutionary theory predicts that the number of star-like structures (evolutionary radiations) will be reduced with evolutionary time, as genetic variants within an evolutionary radiation become extinct by random and selection effects; see Simões et al. for a review of the current understanding of genetic radiation patterns [26]. Indeed, star-like structures appear to get lost over time in F. tularensis. In countries with long-term tularemia endemicity, e.g., in Sweden, Norway, or Turkey [7,11,12], having large disease outbreaks since many decades, F. tularensis WGS star phylogenies are rare and found at the tree tips only. In these countries, phylogenies are characterized by long tree branches between major genetic groups of strains, each major group having many unique genotypes. In line with evolutionary predictions, these long tree branches represent the few bacterial genetic lineages that did not become extinct during long-term evolution. A recent genome comparison of 350 F. tularensis strains from France, where tularemia emerged between 1940 and 1950, provides additional support for this scenario with star-like phylogeny formation followed by random extinction of genetic variants over longer time frames [25]. The comprehensive analysis of F. tularensis genomes from France showed the emergence of longer tree branches separating star-like structures at the tip of the phylogenetic tree. The stars at the tree-tips among the genomes from France generally represented strains of recent origin, isolated after 1990. Taken together, these earlier findings from Sweden, Norway, Turkey, and France coupled to the present findings from Spain support that WGS analyses of F. tularensis provide some information about how long tularemia has been endemic in a particular geographical area.
A probable explanation of the rapid expansion of F. tularensis populations in Castilla-y-León, Spain, is that human activities have created excellent opportunities for pathogen expansion. The F. tularensis subspecies holarctica is known to be associated with water [27], and common disease transmission paths to humans include vector bites, crayfish fishing, and contact with infected mammals [27,28,29]. The natural climate of Castilla-y-León, however, is hostile to F. tularensis subspecies holarctica, with hot and dry summers and mesic habitats that restrict the abundance of ticks. To solve the problem of agricultural drought, an extensive network of irrigation water canals and ditches have been established from the 1970s to 1990s. This solution, at the same time, provides an excellent habitat for F. tularensis subspecies holarctica to survive and replicate [30]. The irrigation system has caused an explosion of voles in the irrigated fields. As voles easily get tularemia, these animals can serve to amplify the expansion of F. tularensis populations. The beginning of the tularemia outbreak in Spain in 1997 coincides with this change in the local ecology. Additional sampling in irrigation channels, rivers, and lagoons and animals in 2016–2017 has confirmed the presence of F. tularensis in water, sediments, hares, and ticks in the local area (personal communications, M Dolores Vidal, Instituto de Salud Carlos III, Madrid, Spain).
We also wanted to investigate if WGS data are suitable for predicting VNTR copy numbers in F. tularensis because these markers are known to evolve fast and may complement SNPs as markers of recent evolution. Our results show that capillary electrophoresis sizing is not any longer necessary for obtaining VNTR data in F. tularensis. Both SNP and VNTR data can be extracted from the same WGS short reads, meaning that draft sequencing provides a simpler, faster, and cheaper method for VNTR typing. Our work further illustrates the need for marker-specific correction when using capillary electrophoresis sizing of VNTRs, which, if not performed, complicates comparison between studies. Finally, we found, contradictory to the assumption that VNTRs evolve faster than SNPs and, therefore, should be better for resolving recent evolution, that the use of SNPs across the whole F. tularensis genome gave a higher typing resolution than VNTRs in all but one cases. One simple explanation for the observation is that SNPs across the genomes occur in higher numbers, i.e., 117 different SNPs compared with 10 VNTR regions.

5. Conclusions

The phylogenetic analysis strongly supported a recent rapid expansion of F. tularensis populations in Spain, consistent with the recent disease introduction into the country and that human activities may have facilitated this expansion. The use of whole-genome SNPs provided higher resolution than the use of multiple VNTRs for depicting F. tularensis evolution. We found that VNTR copy numbers of F. tularensis can be accurately predicted using short-read WGS data but provide little extra information for epidemiological studies.

Author Contributions

Conceptualization, A.J.; methodology, R.E. provided study materials, carried out the MLVA, prepared the sequencing libraries; R.G.-M.-N. contributed to the preparation of the sequencing libraries. Á.Z. performed the sequencing. M.G. contributed to the MLVA analysis.; formal analysis, K.M. performed the bioinformatics analyses.; resources, A.J. and K.M.; data curation, K.M.; writing—original draft preparation, A.J. and K.M.; writing—review and editing, A.J. and K.M., R.E. contributed in reviewing the manuscript; visualization, K.M.; supervision, A.J.; project administration, K.M. All authors have read and agreed to the published version of the manuscript.

Funding

This research was funded by the Ministerio de Economía y Competitividad, Government of Spain/FEDER, RESERTULA (CLG2015-66962-C2-2-R) project; the Ministerio de Ciencia e Innovación, project PID2019-109327RB-I00; MedVetNet Association (ref STM2015-1), and the Swedish Ministry of Foreign Affairs, FOI project no. A4952.

Acknowledgments

We thank Zsuzsa Kreizinger at the Institute for Veterinary Medical Research, Hungarian Academy of Sciences, for supportive MLVA work, and Mª Antonia García Castro at the Complejo Asistencial Universitario de Palencia for providing the isolates.

Conflicts of Interest

The authors declare no conflict of interest.

Appendix A

Table A1. Twenty-five strains isolated in 1998 and 2007–2008 in the autonomous community of Castilla y León, Spain.
IDSourceProvinceYear of IsolationAccession 1Clade
F0783, FT9, F190Human León1998SAMN03773734B.52
TU4Hare León1998SAMN03773884B.52
TU21Hare Palencia1998SAMN03773885B.61
TU39Hare Zamora1999SAMN03773886B.48
TU8Hare Palencia1998SAMN03773887B.45
TU17Hare Segovia1998SAMN03773888B.61
TU18Hare Palencia1998SAMN03773889B.49
TU16Hare Valladolid1998SAMN03773890B.52
TU38Hare Soria1998SAMN03773891B.49
TU23VoleZamora1998SAMN03773892B.48
TU22Hare Valladolid1998SAMN03773893B.49
TU31HumanValladolid1998SAMN03773894B.52
TU13Hare Zamora1998SAMN03773895B.48
TU25HumanZamora1998SAMN03773896B.61
VA-23287HumanValladolid2007SAMN03773897B.56
ZA-07/2645HumanZamora2008SAMN03773898B.57
7072002HumanLeón2007SAMN03773899B.56
6434VoleZamora2007SAMN03773900B.56
3640Hare Zamora2008SAMN03773901B.56
ZA-26454HumanZamora2007SAMN03773902B.57
PA-21739HumanPalencia2007SAMN03773903B.62
ZA-20206HumanZamora2007SAMN03773904B.56
7074825HumanLeón2007SAMN03773905B.52
PA-22442HumanPalencia2007SAMN03773906B.56
FSC456, FT7HumanZamora1998SAMN03774111B.61
1 Dwibedi et al., [16].
Table A2. Primers for PCR product sizing using capillary electrophoresis.
PrimerSequenceFluorescence DyeMelting Point
Ft-M03_FgcacgcttgtctcctatcatcctctggtagtcHEX64.7 °C
Ft-M03_Rgaacaacaaaagcaacagcaaaattcacaaaa 59.4 °C
Ft-M04_FgcgcgctatctaactaatttttatattgaaacaatcaaatFAM59.3 °C
Ft-M04_Rgcaaatataccgtaatgccacctatgaaaactc 60.2 °C
Ft-M05_FgtttgttacgccaataaacaaaaagtgtaaataatgNED57.6 °C
Ft-M05_Rgctcagctcgaactccgtcataccttcttc 64.1 °C
Ft-M10_FgctaattttttcatatttatctccatttttacttttttgcHEX57 °C
Ft-M10_Rgctcagctcgaactccgtcataccttcttc 64.1 °C
Ft-M20A_FgtatatcttggaataagccggagttagatggttctFAM61.1 °C
FtM20A_Rgcaataactttatcacccttattgtagactgcttctgc 62.1 °C
Ft-M20B_Fgggtgataaagttattgttaatggtgtgacttatgaa 59.5 °C
Ft-M20B_RgtaactacttgaccgccagtatatgcttgacctHEX63 °C
Ft-M06_FgtttttggtgaactgccaacaccataacttNED61.1 °C
Ft-M06_Rgcaattcagcgaaaccctatcttagcctc 62 °C
Ft-M02_FgctgctgtggctgtaaatgttgctatgctFAM64.1 °C
Ft-M02_Rgcagggcacaattcttgaccatcagg 63.3 °C
Ft-M22_FgtggaaatgcaaaaacaatatcgaggaactttaFAM59.1 °C
Ft-M22_Rgttttttctcgtccgctgttagtgattttacatc 60.5 °C
Ft-M23_FgctggattattaaagcatatgacagacgagtaggNED60.6 °C
Ft-M23_Rgttccctcaggtttatccaaagttttaatgttttatt 59 °C
Ft-M24_FgaatcttaatccatacggtcctaataatattcctgtcaatNED59.8 °C
Ft-M24_Rgttggtacttatgggctatagcggatattatttcagt 61.2 °C
Table A3. Genome information for 20 new genomes from Spain, 2014–2015 and 2018–2020.
IDTotal No. BasesTotal No. ContigsN50Mean Sequence DepthBioSample Accession *CladeSubclade Path
BZ011,810,5919527699455SAMN12071621B.62B.62–B.110
BZ021,821,5809527699431SAMN12071622B.62B.62–B.110
BZ031,825,76011123863466SAMN12071623B.62B.62–B.110
BZ041,823,4389826961481SAMN12071624B.48B.48–B.108
BZ051,809,2179725525410SAMN12071625B.62B.62–B.110
BZ061,825,94210525544574SAMN12071626B.62B.62–B.110
BZ071,812,1339826732550SAMN12071627B.48B.48–B.108
BZ081,818,4959427699559SAMN12071628B.48B.48–B.108
BZ091,825,89310825990424SAMN12071629B.48B.48–B.108
BZ101,811,2368833271417SAMN12071630B.61B.61
BZ111,808,1319229735514SAMN12071631B.48B.48–B.108
BZ121,830,40010026972340SAMN16515973B.48B.48–B.56
BZ131,756,60621815177269SAMN16515974B.48B.48–B.108
BZ141,775,41820115465282SAMN16515975B.48B.48–B.108
BZ151,818,7389926747242SAMN16515976B.62B.62–B.110–B.315
BZ161,813,9419726857281SAMN16515977B.62B.62–B.110–B.315
BZ171,819,7859727089331SAMN16515978B.48B.48–B.108
BZ181,708,0333697369231SAMN16515979B.48B.48–B.108
BZ191,833,2959427956103SAMN16515980B.48B.48–B.56
BZ201,834,431892959989SAMN16515981B.49B.49
* BioProject no. PRJNA548692.
Table A4. Thirty-four identified canonical SNPs for clades in Figure 1 with more than two members. The clades are in the same order as they appear in Figure 1. The position in the reference genome of FTNF002-00 (FTA) is indicated. Members of clades are shown. The canonical SNPs selected to represent the branches for five new clades, B.107–B.110 and B.315, are indicated in bold.
CladeGenomesNo. SNPsSNP Position (Anc/Der)
B.48BZ04:BZ07:BZ08:BZ09:BZ11:
BZ12:BZ13:BZ14:BZ17:BZ18:
BZ19:TU39:TU23:TU13:
VA-23287:ZA-07/2645:7072002:
6434:3640:ZA-26454:
ZA-20206:PA-22442
8170,704 (C/T);258,998 (G/T);
736,278 (G/A);1,075,715 (C/T);
1,194,117 (G/A);1,225,490 (G/A);
1,558,703 (C/T);1,746,518 (C/T)
B.108BZ04:BZ07:BZ08:BZ09:BZ11:
BZ13:BZ14:BZ17:BZ18
11,327,297 (C/T)
B.57ZA-07/2645:ZA-264543668,630 (T/C);1,747,062 (G/T);1,860,651 (G/A)
B.56BZ12:BZ19:VA-23287:
7072002:6434:3640:ZA-20206:
PA-22442
1827,994 (G/A)
B.1077072002:ZA-202061520,520 (C/T)
B.62BZ01:BZ02:BZ03:BZ05:BZ06:
BZ15:BZ16:PA-21739
4155,417 (G/A);411,903 (C/T);
505,602 (C/T);691,772 (C/T)
B.110BZ01:BZ02:BZ03:BZ05:BZ06:
BZ15:BZ16
21,301,561 (G/A);1,742,563 (G/A)
B.315BZ15:BZ162975,621 (G/C);1,721,277 (T/C)
B.61BZ10:TU21:TU17:TU25:FSC4563235,472 (G/A);1,009,840 (G/T);1,332,119 (G/A)
B.109TU17:TU25:FSC45621,082,513 (T/C);1,171,726 (G/A)
B.49BZ20:TU18:TU38:TU22:FTNF0021224,367 (G/A)
B.52F0783:TU4:TU16:TU31:70748256238,894 (C/T);324,043 (C/T);
1,009,935 (C/T);1,130,906 (C/T);
1,151,666 (T/C);444,395 (C/T)
Table A5. Sizes of PCR Fragments targeting ten VNTR markers determined by capillary electrophoresis.
IDFt-M2Ft-M3Ft-M4Ft-M5Ft-M6Ft-M10Ft-M20AFt-M20BFt-M22Ft-M23Ft-M24
BZ01339.8303.6218.9–219.9299.6275.7199.6307.7151.0174.7327.4400.3
BZ02339.7303.4219.0300.0274.9199.6307.7151.8174.7327.4399.7
BZ03339.5303.2218.8–219.8300.3276.0199.6307.7151.7174.7327.4400.3
BZ04340.0313.1224.4300.3275.8199.6307.7151.5174.7327.4400.1
BZ05339.7303.5218.8–219.8300.0275.9199.6307.7151.5174.7327.6400.0
BZ06339.8303.6218.8–219.8300.1275.7199.6307.7151.6174.7327.5400.1
BZ07340.0313.4224.5300.3276.1199.6307.7151.6174.7327.6400.1
BZ08339.8313.1225.6299.7275.8199.6307.7151.6174.7327.6399.7
BZ09339.8313.0225.3300.2275.8199.6307.7151.6174.7327.3400.2
BZ10340.0303.7224.3300.2275.7199.6307.7151.5174.7327.3400.2
BZ11340.0313.5224.3300.1275.8199.6307.7151.6174.7327.3400.3
Table A6. Sizing of PCR fragments targeting ten VNTR markers from genomes.
IDFt-M2Ft-M3Ft-M4Ft-M5Ft-M6Ft-M10Ft-M20AFt-M20BFt-M22Ft-M23Ft-M24
BZ01339297216-272-306153178327400
BZ02339297216-272-306153178327400
BZ03339297216298272-306153178327400
BZ04339306221298272197306153178327400
BZ05339297216- 272- 306153178327400
BZ06339297216298272197306153178327400
BZ07339306221- 272- 306153178327400
BZ08339306221289 *272188 *306153178327400
BZ09339306221- 272- 306153178325400
BZ10339297221298272197306153178327400
BZ11339306221- 272- 306153178327400
* BZ08 Ft-M5 and Ft-M10 hit is not 100% length. -: The size could not be determined.
Table A7. Differences between size (Table A5) and genomic size (Table A6) of PCR products.
IDFt-M2Ft-M3Ft-M4Ft-M6Ft-M20AFt-M20BFt-M22Ft-M23Ft-M24
BZ010.86.62.93.71.7−2−3.30.40.3
BZ020.76.432.91.7−1.2−3.30.4−0.3
BZ030.56.22.841.7−1.3−3.30.40.3
BZ0417.13.43.81.7−1.5−3.30.40.1
BZ050.76.52.83.91.7−1.5−3.30.60
BZ060.86.62.83.71.7−1.4−3.30.50.1
BZ0717.43.54.11.7−1.4−3.30.60.1
BZ080.87.14.63.81.7−1.4−3.30.6−0.3
BZ090.874.33.81.7−1.4−3.32.30.2
BZ1016.73.33.71.7−1.5−3.30.30.2
BZ1117.53.33.81.7−1.4−3.30.30.3
Median diff.0.86.73.33.81.7−1.4−3.30.40.1
Average diff.0.86.83.33.71.7−1.5−3.30.60.1
Repeat size69521121262321

References

  1. Keim, P.; Johansson, A.; Wagner, D.M.; Epidemiology, M. Molecular epidemiology, evolution, and ecology of Francisella. Ann. N. Y. Acad. Sci. 2007, 1105, 30–66. [Google Scholar] [CrossRef] [PubMed]
  2. Parker, R.R.; Steinhaus, E.A.; Kohls, G.M.; Jellison, W.L. Contamination of natural waters and mud with Pasteurella tularensis and tularemia in beavers and muskrats in the northwestern United States. Bull. Natl. Inst. Health 1951, 193, 1–161. [Google Scholar] [PubMed]
  3. Broman, T.; Thelaus, J.; Andersson, A.-C.; Bäckman, S.; Wikström, P.; Larsson, E.; Granberg, M.; Karlsson, L.; Bäck, E.; Eliasson, H.; et al. Molecular Detection of Persistent Francisella tularensis Subspecies holarctica in Natural Waters. Int. J. Microbiol. 2011, 2011, 1–26. [Google Scholar] [CrossRef] [PubMed] [Green Version]
  4. Schulze, C.; Heuner, K.; Myrtennäs, K.; Karlsson, E.; Jacobs, D.; Kutzer, P.; Große, K.; Forsman, M.; Grunow, R. High and novel genetic diversity of Francisella tularensis in Germany and indication of environmental persistence. Epidemiol. Infect. 2016, 144, 3025–3036. [Google Scholar] [CrossRef] [Green Version]
  5. Janse, I.; Maas, M.; Rijks, J.M.; Koene, M.; van der Plaats, R.Q.; Engelsma, M.; van der Tas, P.; Braks, M.; Stroo, A.; Notermans, D.W.; et al. Environmental surveillance during an outbreak of tularaemia in hares, the Netherlands, 2015. Eurosurveillance 2017, 22, 30607. [Google Scholar] [CrossRef] [Green Version]
  6. Janse, I.; van der Plaats, R.Q.J.; Van Passel, M.W.J. Environmental surveillance of zoonotic Francisella tularensis in the Netherlands. Front. Cell. Infect. Microbiol. 2018, 8, 140. [Google Scholar] [CrossRef]
  7. Vogler, A.J.; Birdsell, D.; Price, L.B.; Bowers, J.R.; Beckstrom-Sternberg, S.M.; Auerbach, R.K.; Beckstrom-Sternberg, J.S.; Johansson, A.; Clare, A.; Buchhagen, J.L.; et al. Phylogeography of Francisella tularensis: Global expansion of a highly fit clone. J. Bacteriol. 2009, 191, 2474–2484. [Google Scholar] [CrossRef] [Green Version]
  8. Svensson, K.; Granberg, M.; Karlsson, L.; Neubauerova, V.; Forsman, M.; Johansson, A. A real-time PCR array for hierarchical identification of Francisella isolates. PLoS ONE 2009, 4, e8360. [Google Scholar] [CrossRef]
  9. Svensson, K.; Bäck, E.; Eliasson, H.; Berglund, L.; Granberg, M.; Karlsson, L.; Larsson, P.; Forsman, M.; Johansson, A. Landscape Epidemiology of Tularemia Outbreaks in Sweden. Emerg. Infect. Dis. 2009, 15, 1937–1947. [Google Scholar] [CrossRef] [Green Version]
  10. Chanturia, G.; Birdsell, D.N.; Kekelidze, M.; Zhgenti, E.; Babuadze, G.; Tsertsvadze, N.; Tsanava, S.; Imnadze, P.; Beckstrom-Sternberg, S.M.; Beckstrom-Sternberg, J.S.; et al. Phylogeography of Francisella tularensis subspecies holarctica from the country of Georgia. BMC Microbiol. 2011, 11, 139. [Google Scholar] [CrossRef] [Green Version]
  11. Gyuranecz, M.; Birdsell, D.N.; Splettstoesser, W.; Seibold, E.; Beckstrom-sternberg, S.M.; Makrai, L.; Fodor, L.; Fabbi, M.; Vicari, N.; Johansson, A.; et al. Phylogeography of Francisella tularensis subsp. holarctica, Europe. Emerg. Infect. Dis. 2012, 18, 290–293. [Google Scholar] [CrossRef] [PubMed] [Green Version]
  12. Karlsson, E.; Svensson, K.; Lindgren, P.; Byström, M.; Sjödin, A.; Forsman, M.; Johansson, A.; Karlsson, E.; Svensson, K.; Lindgren, P.; et al. The phylogeographic pattern of Francisella tularensis in Sweden indicates a Scandinavian origin of Eurosiberian tularaemia. Environ. Microbiol. 2013, 15, 634–645. [Google Scholar] [CrossRef] [PubMed]
  13. Johansson, A.; Farlow, J.; Larsson, P.; Dukerich, M.; Chambers, E.; Bystrom, M.; Fox, J.; Chu, M.; Forsman, M.; Sjostedt, A.; et al. Worldwide Genetic Relationships among Francisella tularensis Isolates Determined by Multiple-Locus Variable-Number Tandem Repeat Analysis. J. Bacteriol. 2004, 186, 5808–5818. [Google Scholar] [CrossRef] [PubMed] [Green Version]
  14. Johansson, A.; Forsman, M.; Sjöstedt, A. The development of tools for diagnosis of tularemia and typing of Francisella tularensis. APMIS 2004, 112, 898–907. [Google Scholar] [CrossRef]
  15. Timofeev, V.; Bakhteeva, I.; Titareva, G.; Kopylov, P.; Christiany, D.; Mokrievich, A.; Dyatlov, I.; Vergnaud, G. Russian isolates enlarge the known geographic diversity of Francisella tularensis subsp. mediasiatica. PLoS ONE 2017, 12, e0183714. [Google Scholar] [CrossRef] [Green Version]
  16. Dwibedi, C.; Birdsell, D.; Lärkeryd, A.; Myrtennäs, K.; Öhrman, C.; Nilsson, E.; Karlsson, E.; Hochhalter, C.; Rivera, A.; Maltinsky, S.; et al. Long-range dispersal moved Francisella tularensis into Western Europe from the East. Microb. Genom. 2016, 2. [Google Scholar] [CrossRef]
  17. Eiros Bouza, J.M.; Rodríguez-Torres, A. Tularemia. Rev. Clin. Esp. 1998, 198, 785–788. [Google Scholar]
  18. Farlow, J.; Smith, K.L.K.L.; Wong, J.; Abrams, M.; Lytle, M.; Keim, P. Francisella tularensis strain typing using multiple-locus, variable-number tandem repeat analysis. J. Clin. Microbiol. 2001, 39, 3186–3192. [Google Scholar] [CrossRef] [Green Version]
  19. Li, R.; Zhu, H.; Ruan, J.; Qian, W.; Fang, X.; Shi, Z.; Li, Y.; Li, S.S.; Shan, G.; Kristiansen, K.; et al. ABySS: A parallel assembler for short read sequence data. Genome Res. 2009, 19, 1117–1123. [Google Scholar] [CrossRef] [Green Version]
  20. Lärkeryd, A.; Myrtennäs, K.; Karlsson, E.; Dwibedi, C.K.; Forsman, M.; Larsson, P.; Johansson, A.; Sjödin, A. CanSNPer: A hierarchical genotype classifier of clonal pathogens. Bioinformatics 2014, 30, 1762–1764. [Google Scholar] [CrossRef] [Green Version]
  21. Kreizinger, Z. Comparative Characterisation of Members of the Family Francisellaceae. Ph.D. Thesis, Szent István University, Doctoral School of Veterinary Science, Gödöllo, Hungary, 2016. [Google Scholar]
  22. Wittwer, M.; Altpeter, E.; Pilo, P.; Gygli, S.M.; Beuret, C.; Foucault, F.; Ackermann-Gäumann, R.; Karrer, U.; Jacob, D.; Grunow, R.; et al. Population Genomics of Francisella tularensis subsp. holarctica and its Implication on the Eco-Epidemiology of Tularemia in Switzerland. Front. Cell. Infect. Microbiol. 2018, 8, 1–16. [Google Scholar] [CrossRef] [PubMed]
  23. Appelt, S.; Köppen, K.; Radonić, A.; Drechsel, O.; Jacob, D.; Grunow, R.; Heuner, K. Genetic Diversity and Spatial Segregation of Francisella tularensis Subspecies holarctica in Germany. Front. Cell. Infect. Microbiol. 2019, 9. [Google Scholar] [CrossRef] [PubMed] [Green Version]
  24. Seiwald, S.; Simeon, A.; Hofer, E.; Weiss, G.; Bellmann-Weiler, R. Tularemia Goes West: Epidemiology of an Emerging Infection in Austria. Microorganisms 2020, 8, 1597. [Google Scholar] [CrossRef] [PubMed]
  25. Kevin, M.; Girault, G.; Caspar, Y.; Cherfa, M.A.; Mendy, C.; Tomaso, H.; Gavier-Widen, D.; Escudero, R.; Maurin, M.; Durand, B.; et al. Phylogeography and Genetic Diversity of Francisella tularensis subsp. holarctica in France (1947–2018). Front. Microbiol. 2020, 11, 1–17. [Google Scholar] [CrossRef] [PubMed] [Green Version]
  26. Simões, M.; Breitkreuz, L.; Alvarado, M.; Baca, S.; Cooper, J.C.; Heins, L.; Herzog, K.; Lieberman, B.S. The Evolving Theory of Evolutionary Radiations. Trends Ecol. Evol. 2016, 31, 27–34. [Google Scholar] [CrossRef]
  27. Anda, P.; Segura del Pozo, J.; Díaz García, J.M.; Escudero, R.; García Peña, F.J.; López Velasco, M.C.; Sellek, R.E.; Jiménez Chillarón, M.R.; Sánchez Serrano, L.P.; Martínez Navarro, J.F. Waterborne outbreak of tularemia associated with crayfish fishing. Emerg. Infect. Dis. 2001, 7, 575–582. [Google Scholar] [CrossRef] [Green Version]
  28. Allue, M.; Sopeña, C.R.; Gallardo, M.T.; Mateos, L.; Vian, E.; Garcia, M.J.; Ramos, J.; Berjon, A.C.; Viña, M.C.; Garcia, M.P.; et al. Tularaemia outbreak in Castilla y León, Spain, 2007: An update. Eurosurveillance 2008, 13, 18948. [Google Scholar] [CrossRef] [PubMed]
  29. Mörner, T. The ecology of tularaemia. Rev. Sci. Tech. 1992, 11, 1123–1130. [Google Scholar] [CrossRef] [Green Version]
  30. Luque-Larena, J.J.; Mougeot, F.; Arroyo, B.; Vidal, M.D.; Rodríguez-Pastor, R.; Escudero, R.; Anda, P.; Lambin, X. Irruptive mammal host populations shape tularemia epidemiology. PLoS Pathog. 2017, 13, 1–5. [Google Scholar] [CrossRef] [Green Version]
Figure 1. Neighbor-joining phylogeny based on 117 single-nucleotide polymorphisms (SNPs) in whole-genome sequencing (WGS) data of 45 F. tularensis strains from Spain, 1998 to 2020, and two reference genomes from France and Italy demonstrating a star-like branching pattern. The tree is rooted in the Italian genome as this genome is the most ancestral in relation to the global Francisella tularensis subspecies holarctica phylogeny (see the upper-left inset tree). Major genetic groups of strains from Spain are labelled by color-filled circles. Tree branches are labelled by canSNPs (the letter B followed by a number). The number of SNPs along the branches is indicated for branches with multiple taxa (see Appendix A Table A4 for canSNP positions in the reference strain FTNF002-00). Province abbreviations are Burgos (BU), León (LE), Palencia (PA), Segovia (SE), Soria (SO), Valladolid (VA), and Zamora (ZA). Variable-number tandem repeat (VNTR) marker data are in the right column.
Microorganisms 08 01784 g001
Figure 2. Difference between VNTR PCR product sizes determined by capillary electrophoresis and by WGS data. Eleven F. tularensis strains from 2014 to 2015 are named along the X-axis. Dissimilarities in the size estimates (no. of nucleotides) are shown on the Y-axis. The Ft-M5 and Ft-M10 data are incomplete because these VNTR loci are adjacent to a large insertions-sequence element at the end of contigs in the WGS data.
Microorganisms 08 01784 g002
Figure 3. Phylogeography of 45 F. tularensis strains with a known place of isolation in seven Spanish provinces from 1998 to 2020. Major phylogenetic clades are labelled by colors corresponding to Figure 1. Province labels are Burgos (BU), León (LE), Palencia (PA), Segovia (SE), Soria (SO), Valladolid (VA), and Zamora (ZA). The number of genomes is within round brackets.
Microorganisms 08 01784 g003
Figure 4. Timing and size of F. tularensis genetic clades. Horizontal lines represent the different phylogenetic clades over time. The circle size represents the number of genomes, with grey shades distinguishing different provinces. The major phylogenetic clades are color-coded on the Y-axis, corresponding to Figure 1. Provinces are Burgos (BU), León (LE), Palencia (PA), Segovia (SE), Soria (SO), Valladolid (VA), and Zamora (ZA).
Microorganisms 08 01784 g004
Table 1. Francisella tularensis strains from 20 human specimens in Spain, 2014–2020.
IDSourceTransmission Related toYearProvince
BZ01Skin ulcerCrayfish2014Palencia
BZ02Skin ulcerCrayfish2014Palencia
BZ03Skin ulcerCrayfish/rodents/gardening2014Palencia
BZ04Skin ulcerCrayfish/countryside walks2014Palencia
BZ05BloodRodent/agriculture2014Palencia
BZ06Skin ulcerCrayfish2014Palencia
BZ07BloodCountry house2014Palencia
BZ08Transbronchial needle aspiration of lymph nodeEnvironment2014Burgos
BZ09Skin ulcer Hunting2014Leon
BZ10Skin ulcer Hunting2015Soria
BZ11BloodNot available2015Palencia
BZ12BloodFarming2018Palencia
BZ13Skin abscessCrayfish2019Burgos
BZ14BloodGardening2019Palencia
BZ15Lymph node abscessNot available2019León
BZ16Lymph node abscessCrayfish2019Palencia
BZ17Skin ulcerCrayfish2019Burgos
BZ18Skin ulcerHunting2019Palencia
BZ19BloodNot available2020Palencia
BZ20Lymph node abscessCountryside walks2020Palencia
Table 2. Capillary electrophoresis sizing of VNTR markers Ft-M3 and Ft-M4 in relation to nucleotide size data determined by WGS of 11 F. tularensis genomes from 2014 to 2015, Spain.
Ft-M3
(9 bp Repeat Size)
Ft-M4
(5 bp Repeat Size)
IDNo. Repeats Assay WGS No. RepeatsAssayWGS
BZ018303.62971218.9–219.9216
BZ028303.42971219.0216
BZ038303.22971218.8–219.8216
BZ049313.13062224.4221
BZ058303.52971218.8–219.8216
BZ068303.62971218.8–219.8216
BZ079313.43062224.5221
BZ089313.13062225.6221
BZ099313.03062225.3221
BZ108303.72972224.3221
BZ119313.53062224.3221
Publisher’s Note: MDPI stays neutral with regard to jurisdictional claims in published maps and institutional affiliations.

