Abstract
The recalcitrance of complex organic polymers such as lignocellulose is one of the major obstacles to sustainable energy production from plant biomass, and the generation of toxic intermediates can negatively impact the efficiency of microbial lignocellulose degradation. Here, we describe the development of a model microbial consortium for studying lignocellulose degradation, with the specific goal of mitigating the production of the toxin formaldehyde during the breakdown of methoxylated aromatic compounds. Included are Pseudomonas putida, a lignin degrader; Cellulomonas fimi, a cellulose degrader; and sometimes Yarrowia lipolytica, an oleaginous yeast. Unique to our system is the inclusion of Methylorubrum extorquens, a methylotroph capable of using formaldehyde for growth. We developed a defined minimal “Model Lignocellulose” growth medium for reproducible coculture experiments. We demonstrated that the formaldehyde produced by P. putida growing on vanillic acid can exceed the minimum inhibitory concentration for C. fimi, and, furthermore, that the presence of M. extorquens lowers those concentrations. We also uncovered unexpected ecological dynamics, including resource competition, and interspecies differences in growth requirements and toxin sensitivities. Finally, we introduced the possibility for a mutualistic interaction between C. fimi and M. extorquens through metabolite exchange. This study lays the foundation to enable future work incorporating metabolomic analysis and modeling, genetic engineering, and laboratory evolution, on a model system that is appropriate both for fundamental eco-evolutionary studies and for the optimization of efficiency and yield in microbially-mediated biomass transformation.
1. Introduction
The global economy relies substantially on fossil fuels as a source of carbon compounds with applications ranging from energy to medicine. The pressing need to reduce dependency on these nonrenewable sources has inspired interest in the development of sustainable energy and bioproduct feedstocks. Due to its availability and energy density, lignocellulosic biomass has long been a target for the bioproduction of fuels, bioplastics, and other commodity chemicals [1,2,3]. However, while biological methods for upcycling the cellulosic portion are well developed, a significant challenge to the economic feasibility of using lignocellulose for bioenergy is the chemical complexity of lignin and its recalcitrance to breakdown.
Lignin can compose 15–40% of unprocessed plant matter; initial processing of lignin yields complex mixtures of aromatic compounds, which may vary between types of feedstock [4,5]. There is no known single organism capable of catabolizing every compound in this complex mixture, and degradation can result in toxic intermediates that inhibit the growth of some of the very organisms involved. For instance, lignin-derived aromatic compounds are heavily substituted by methoxy (-OCH3) groups, which are transformed to formaldehyde in the process of microbial degradation [6,7,8,9,10,11]. Chemical pretreatment of lignin requires extreme chemicals or heat and may result in the destruction of important organisms or enzymes. Lignin is, therefore, considered an economically ineffective waste product of the food and other commercial industries. For lignocellulose to compete with nonrenewable carbon feedstocks, efficient, cost-effective processes of transformation must be developed that are robust over time and adaptable to diverse feedstocks.
In nature, lignocellulose is consumed by complex and dynamic communities of microbes, where distinct catabolic niches allow symbiosis by crossfeeding and detoxification of dangerous intermediates. While industries may mimic this “natural” strategy by using complex, undefined microbial communities (as is done in wastewater treatment [12]), there are long-standing problems with an approach in which the chemical transformations are not fully understood, particularly when it comes to the efficient production of specific desired bioproducts.
To the same ends, with very different means, synthetic and systems biology research frequently attempts to build a single metabolic powerhouse: one well-understood, often genetically engineered species capable of carrying out the entire process (e.g., [13]). This strategy has the advantage of not requiring the careful balance of growth conditions tailored to multiple species, and it is theoretically possible to maintain a consistent community in a fermentation system. However, when the specific enzymes responsible for particular transformations—as in the case of many lignocellulose components—are unknown, or function poorly in organisms with well-developed systems, complex and multistep processes can be a challenge.
Incorporating the best of both systems, the synthetic ecology approach describes a highly defined and specifically engineered community of organisms [14,15,16,17]. By narrowing the number of organisms, compared to “natural” undefined communities, it is possible to create conditions where each can thrive, especially if organisms are engineered or evolved for their roles. It is also possible, in contrast to the “powerhouse” strain approach, to select organisms with native affinities and tolerances suited for their role that are complex to engineer, including resistances to heat, acid, toxic intermediates, or the ability to store carbon or biomass in a form that can be used economically in downstream processes.
In this work, we describe a synthetic microbial community designed for the degradation of lignocellulose, with a particular focus on addressing the problem of a toxic compound generated in lignin degradation: formaldehyde. Formaldehyde is a small aliphatic aldehyde that is often overlooked in bioprocessing. Yet it is inhibitory to ethanol-generating yeast at concentrations as low as 1.0 mM, lower than is found in many chemically pretreated lignocellulosic feedstocks, resulting in a reduction in product generation of up to tenfold [18]; formaldehyde accumulation is often a challenge overcome via engineered resistance [19]. It can be inhibitory even to the organisms that generate it: formaldehyde detoxification can prove a rate-limiting step in the microbial degradation of methoxylated aromatic compounds [8,9,20]. In this study, we have taken advantage of the single-carbon (C1) metabolism of the model methylotroph Methylorubrum extorquens (formerly Methylobacterium extorquens), which uses formaldehyde as a central metabolic intermediate [21]. Our aim was to investigate the potential for M. extorquens, as a member of a defined lignocellulose-degrading community, to increase the efficiency of lignocellulosic breakdown by consuming the inhibitory formaldehyde.
The Methylobacterium and Methylorubrum clade encompasses a diverse range of species in a variety of metabolic niches, including commensal relationships with plants as well as independently, in soil and leaf litter [22]. While the extent of the metabolic capabilities of the genus is not fully characterized—and recent work suggests some species may have the ability to utilize lignin-derived aromatic compounds [23]—we chose to include in our consortium, M. extorquens PA1, a model organism for which extensive metabolic and physiological data exist [21,24,25,26]. The other bacterial members of this defined community included Pseudomonas putida, a canonical lignin degrader that has been studied extensively for its aromatic catabolism [20,27,28,29,30], and Cellulomonas fimi, a cellulose degrader of interest for its ability to utilize diverse polysaccharides and to channel the products of their degradation to other organisms in co-culture [31,32,33]. In some experiments, a fourth microbial strain, the oleaginous yeast Yarrowia lipolytica, was included for its ability to grow on organic acids generated by other consortium members, and to produce neutral lipids as a potential end product [33,34,35]. We envision, ultimately, developing a stirred aerobic bioreactor for the transformation of lignocellulose hydrolysate; for this reason, we chose not to work with mycelial fungi or filamentous bacteria.
In place of a complex and undefined plant biomass substrate, we opted for a simple and defined set of compounds to stand in for lignocellulose: cellobiose (a disaccharide of glucose, a product of cellulose hydrolysis), xylose (a 5-carbon sugar found in hemicellulose), and vanillic acid (a simple methoxylated aromatic compound, a derivative of guaiacyl lignin phenylpropanoids, for which formaldehyde generation is the first step in catabolism by P. putida [20]). Of these compounds, P. putida could consume only vanillic acid and C. fimi only cellobiose and xylose (with cellobiose the preferred substrate [33]); M. extorquens and Y. lipolytica could consume neither and, therefore, subsisted on metabolites generated by P. putida and C. fimi. The hypothesized interactions around which this community is built are shown in Figure 1.
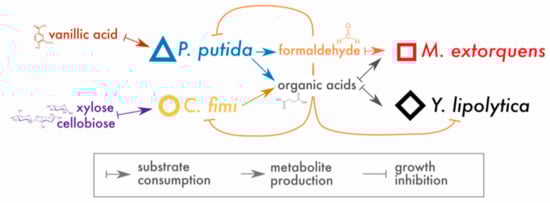
Figure 1.
Conceptual model of interactions in the lignocellulose-degrading microbial consortium. Arrows indicate hypothesized interactions as described in the key. The colors and symbols used for compounds and species in this figure are the same as those used in data plots throughout the manuscript.
Our ultimate goal is the development of a metabolically efficient and ecologically robust model microbial lignocellulose-degrading community, in which we can take advantage of recent developments in metabolomic measurement and metabolic modeling to enable a flexible, predictive strategy to maximize community output [36]. To achieve this, we sought to establish robust and reproducible methods for the culture of this novel community and for measurement of organism growth, activity, and interactions; to characterize the dynamics of formaldehyde during the consumption of lignin-derived aromatic compounds.
2. Materials and Methods
Specifics of the strains and culture conditions used in each experiment are given in Table S1. Details are provided below; abbreviations used in Table S1 are denoted by square brackets.
Strains: The strains used were Cellulomonas fimi ATCC 484 [CF], Pseudomonas putida KT2440 [PP], Yarrowia lipolytica CLIB122 [YL], and three strains of Methylorubrum extorquens PA1 [ME]. Strain CM2730 is the wild-type strain, M. extorquens PA1 ΔcelABC: the cellulose-synthesis locus was deleted to eliminate clumping and facilitate growth analysis by OD [26]. Strain CM3745 is M. extorquens PA1 ΔcelABC ΔefgA, a mutant with increased tolerance to formaldehyde [37]. CM3745 was used in early experiments, but as the formaldehyde concentrations in coculture never exceeded the maximum inhibitory concentration (MIC) of wild-type M. extorquens and we observed no difference in performance between the two strains, later experiments were conducted with CM2730.
Strain CM4744 was a methionine-overproducing strain developed for this study, by taking advantage of the fact that methionine overproduction can confer resistance to the methionine-analog ethionine [38,39]. M. extorquens CM2730 was grown to stationary phase in MP + 15 mM methanol. A total of 200 µL of culture was spread-plated onto each of two plates with MP-methanol agar medium containing 1 mg/mL of ethionine. A total of 8 colonies were chosen and re-streaked onto fresh MP-methanol-ethionine plates. These isolates were then tested for their ability to promote the growth of C. fimi in the absence of methionine, and all performed equally well. Results shown in this text (Figure 9) are from a single isolate, CM4744.
For all experiments, freezer stocks were streaked onto MPI agar plates with 15 mM succinate or 125 mM methanol (M. extorquens), or onto Nutrient Agar (Difco) (other strains), to obtain colonies. A single colony was used to inoculate 5 mL of liquid culture medium and grown overnight until stationary phase. Unless otherwise noted, pre-growth medium was MP with methionine/thiamine/biotin supplements in standard concentrations and 15 mM methanol (M. extorquens) or 10 mM glucose (other strains). When necessary, this inoculum was subcultured once into a different medium (e.g., Model Lignocellulose) for an additional 24 h of growth to acclimate it for the experiment. After 24 h, stationary-phase cultures of all species were diluted to normalize their ODs to match that of the least-dense culture, then equal volumes of all cultures were inoculated into the experimental medium, at a dilution of 1:64 (vol:vol) into the final medium, unless otherwise stated.
Basal medium and buffer: The medium used as a basis for all growth experiments was a modified PIPES-buffered medium previously described [26] [MP]: 30 mM PIPES, 1.45 mM K2HPO4, 1.88 mM NaH2PO4, 0.5 mM MgCl2, 5.0 mM (NH4)2SO4, 0.02 mM CaCl2, 45.3 µM Na3C6H5O7, 1.2 µM ZnSO4, 1.02 µM MnCl2, 17.8 µM FeSO4, 2 µM (NH4)6Mo7O24, 1 µM CuSO4, 2 µM CoCl2, 0.338 µM Na2WO4, pH 6.7. As described in the Results and in Table 1, we conducted some experiments with a variant of MP with lower PIPES or higher phosphate [P] concentrations. “P” refers to the combination of K2HPO4 and NaH2PO4 in the same ratio as in the final medium. Most experiments used either 1× (30 mM) or 0.1× (3 mM) PIPES, and either 1× P (~3 mM phosphate) or 5× P (~15 mM phosphate).

Table 1.
Components of Model Lignocellulose medium. Basic MP medium is prepared as described in [26], with the exception that PIPES and P concentrations are altered in Model Lignocellulose: originally published concentrations for these compounds are given in square brackets.
Carbon substrates and supplements: Carbon substrates consisted of glucose [G], methanol [MeOH], succinate [S], vanillic acid [VA], protocatechuic acid [PCA], cellobiose [CB], and xylose [XY]. All were stored as sterile aqueous stock solutions and added to cultures by pipet. Because of their poor solubility in water, VA and PCA were stored as 50 mM stock in MP medium so that their addition would not dilute the final culture medium. Whereas most carbon substrates were sterilized by autoclaving, VA and PCA were sterilized by filtration out of an abundance of caution because we found that autoclaving changed their color (brown and purple, respectively).
For the experiments identifying the nutritional needs of C. fimi (Figure S5), all amino acid stocks were made in MP medium at 10 g/L (10 mL vol), except asparagine (6.67 g/L), aspartic acid (2 g/L, NaOH added to bring pH to 6.5), and tyrosine (50 g/L in DMSO), due to solubility. For all stocks, regardless of concentration, 100 µL of stock added to 10 mL culture medium, with the exception of the tyrosine DMSO stock, of which only 10 µL was added. Wolfe’s vitamins made according to [40] and provided at 1×. Yeast extract (VWR) was provided at a final concentration of 0.3 g/L and tryptone (Peptone from Casein, Sigma Aldrich) at 0.16 g/L.
In Model Lignocelluose medium, methionine [M], thiamine [T], and biotin [B] aqueous stocks were provided at concentrations of 2 mg/L, 5 µg/L, and 40 µg/L, respectively (standard concentrations), unless otherwise noted. Stocks were made in water, filter-sterilized, stored at 4 °C, and added to medium prior to each experiment. For experiments testing vanillic acid toxicity, glucose was provided for C. fimi and methanol for M. extorquens as additional carbon substrates as they cannot grow on vanillic acid, but no additional carbon substrate was provided for P. putida. For experiments testing the effect of iron concentration, 17 mM (1000×) aqueous, autoclave-sterile FeSO4 stock was added.
For use in enumerating colony-forming units of the different species from cocultures, standard MP medium was prepared with 1.8 g/L glucose and 4.05 g/L sodium succinate dibasic hexahydrate, methionine/thiamine/biotin in standard concentrations, and 15 g/L agar.
Formaldehyde was produced fresh weekly as 1 M stock by combining 0.3 g paraformaldehyde powder (Sigma Aldrich, St. Louis, MO, USA), 9.95 mL ultrapure water, and 50 µL 10 N NaOH solution in a sealed tube and immersing in a boiling water bath for 20 min to depolymerize. The stock was stored at room temperature and removed from the sealed tube using a syringe when needed.
Vessels and incubation conditions: All cultures were grown at 30 °C, either in culture flasks, culture tubes, multiwell culture plates, or culture plates with solid medium [agar]. For multiwell culture plates [multiwell], we used 48-well tissue culture plates (Corning Costar, Tewksbury, MA, USA) with a total volume of 640 µL per well, and incubated in a LPX44 Plate Hotel (LiCONiC, Mauren, Liechtenstein) with shaking at 650 RPM. For glass tubes, we originally used Balch tubes with serum stoppers [Balch] (Chemglass, Vineland, NJ, USA) in order to ensure that volatile compounds such as formaldehyde were not lost in the gas phase; however, experiments demonstrated no difference in any measured compounds between Balch tubes and simple 16 × 150 mm glass culture tubes with loose-fitting lids [tube], so we ultimately used aerobic tubes for convenience. All culture tubes contained 5 mL of liquid medium unless otherwise stated and were incubated with shaking at 250 rpm. For culture flasks [flask], we used 50 mL-capacity glass Erlenmeyer flasks, containing 10 mL of liquid culture, also shaken at 250 rpm.
Measurements: In growth experiments conducted in tubes or flasks with multiple timepoints, a typical sampling procedure was as follows: 100 µL of culture was removed from the vessel, by syringe and needle through the stopper for Balch tubes or by pipet otherwise, transferred into a microcentrifuge tube, and centrifuged for 1 min at 14,000× g to pellet the cells. 60 µL of supernatant was used for formaldehyde measurement and 20 µL for GC-MS or HPLC analysis. The cell pellet was reserved for species-specific analysis of cell abundance as colony-forming units [CFU]. Not all analyses were carried out for all timepoints, but the sampling procedure nonetheless remained the same. Abbreviations in Table S1 are as follows: optical density at 600 nm [OD]; formaldehyde [F]; cellobiose by HPLC [HPLC]; vanillic acid or protocatechuic acid by GC-MS [GC-MS].
For CFU measurement, cell pellets were resuspended in 980 µL of MP medium without carbon substrate (1:10 dilution) and then subjected to serial 1:10 dilutions down to 10−6 (7 dilutions total). These dilutions were either spread-plated or spot-plated onto solid culture medium. For spot-plates, three replicates spots of 10 µL of each dilution were pipetted onto plates and spots were dried under a laminar flow hood, then incubated at 30 °C for 4 days or until colonies were visible. Species were identified by colony morphology (Figure S1). The colonies in each series of 7 dilution spots was counted; the number of colonies in the two spots of the highest dilution levels that had countable colonies were summed, then multiplied by 1.1 times the lower of the two dilution factors to calculate the number of colony-forming units (CFU) per mL in the original undiluted sample. The mean and standard deviation were calculated for the three replicate spot series representing each sample. For spread-plates, between 1 and 3 dilutions were chosen for plating based on predicted cell abundance; from each dilution, 100 µL of the dilution was spread onto a culture plate. Plates were dried and incubated as for spot-plates. CFU/mL was calculated by multiplying by the dilution factor and accounting for the volume plated.
Measurement of optical density at 600 nm (OD600) for cultures in glass tubes was carried out nondestructively by reading the whole tube with a Spectronic 200 spectrophotometer (Thermo Fisher, Waltham, MA, USA). For cultures in flasks, a 100 µL sample was transferred to a trUVue low-volume cuvette (Bio-Rad, Hercules, CA, USA) and read in a SmartSpec Plus spectrophotometer (Bio-Rad). For experiments in multiwell plates, optical density was assessed using a Wallac 1420 Victor2 Microplate Reader (Perkin Elmer, Waltham, MA, USA), reading OD600 for 0.4 s. In experiments involving different carbon substrates, blank wells were included for each medium composition for blanking purposes, as solutions containing PCA and VA were purple and brown, respectively.
Formaldehyde was measured using the method of Nash [41]. Reagent B was prepared as described (2 M ammonium acetate, 50 mM glacial acetic acid, 20 mM acetylacetone); for each assay, equal volumes of sample (or standard) and Reagent B were combined in a microcentrifuge tube and incubated for 6 min at 60 °C. Absorbance was read on a spectrophotometer at 412 nm and formaldehyde concentration calculated using a standard curve made from freshly prepared formaldehyde stock. To assay large numbers of samples, a 96-well polystyrene flat-bottom culture plate (Olympus Plastics, San Diego, CA, USA) was used, with a total volume of 200 µL per well and incubation time of 10 min before absorbance at 432 nm was read using a Wallac 1420 Victor2 plate reader. A clean plate was used for each assay; each plate contained each sample in triplicate as well as a standard curve run in triplicate. The absorbance of vanillic acid was not found to interfere with formaldehyde measurements.
Vanillic acid was measured by gas chromatography-mass spectrometry (GC-MS) using an extraction and derivatization procedure modified from [42]. 20 µL of culture supernatant was combined with 1.2 µL of 1 M HCl to acidify to pH ~ 2. The sample was combined with 100 µL of a 1:100 mixture of 2-chlorobenzoic acid:ethyl acetate, and vortexed to extract the vanillic acid into the organic phase. The sample was centrifuged at 14,000× g for 1 min to separate the phases, and 80 µL of the organic phase was transferred to a clean GCMS sample vial (1 mL capacity). Samples were dried in a fume hood, then 400 µL of derivatization reagent was added. The derivatization reagent consisted of a 99:1:1000 mixture of N,O-Bistrifluoroacetamide:Trimethylsylil chloride:acetonitrile (that is, BSTFA-TMCS (TCI America, Portland, OR, USA) diluted 1:10 in acetonitrile). The sample was incubated, sealed, at 70 °C for 30 min, then cooled. Samples were analyzed on a Shimadzu GCMS-QP2010 Plus with a 30 m × 0.25 mm dimethyl polysiloxane column (Rxi-1ms, Restek, Bellefonte, PA, USA) in splitless mode with a 1-min injection at 280 °C. The GC run program was as follows: hold at 80 °C for 1 min; ramp to 110 °C at 20 degrees/min; ramp to 240 °C at 10 degrees/min; ramp to 280 °C at 40 degrees/min; hold at 280 °C for 5 min. The MS was run on SIM mode. Vanillic acid was detected as as 3-methoxy-4-[(trimethylsilyl)oxy]-benzoic acid trimethylsilyl ester, with retention time 10.4 min. Characteristic fragments used for quantitation were at m/z 267 and 297, with other fragments at 126, 193, 253, 312. Standard curves were generated from vanillic acid stocks made in lab and extracted alongside the samples.
Cellobiose and xylose were measured using a Shimadzu LC-20 high-performance liquid chromatograph (HPLC). Supernatant samples were filtered through a 0.2 µm syringe filter to remove any particles, and diluted in water if necessary to maintain signal within quantifiable range. They were run on an Aminex HPX-87h column (Bio-Rad) at a flow rate of 0.6 mL/min, column temperature 30 °C, with 5 mM H2SO4 as eluent. Peaks were detected using a RID-20A refractive index detector: cellobiose with a retention time of 7.1 min and xylose at 9.3 min.
Formaldehyde tolerance distributions: The distribution of formaldehyde tolerance phenotypes within a population was assessed by counting colony-forming units on agar medium containing formaldehyde, as described previously [43]. MP medium was prepared with the necessary carbon substrates and supplements for each species; after autoclaving, the medium was cooled to 50 °C and formaldehyde was rapidly mixed in. Agar was poured into 100 mm culture plates, dish lids were replaced, and plates were allowed to cool on the benchtop. Plates were stored at 4 °C for no longer than 1 week. Cultures were grown to stationary phase on MP medium with a preferred carbon source (methanol for M. extorquens; glucose for other species), then CFU were spot-plated as described above onto a series of plates containing a range of formaldehyde concentrations, and the number of cells capable of forming colonies at each concentration of formaldehyde was calculated. Note that an abundance of 34 CFU/mL is necessary to observe 1 cell per 30 µL plated, so for a population of ~2 × 10⁸ CFU/mL (as was typical for M. extorquens samples), this method has a limit of detection of 1.65 × 10⁻⁷.
Spent medium experiment: To generate P. putida spent medium, P. putida was grown on Model Lignocellulose medium (Table 1) to stationary phase. The culture was then centrifuged and the supernatant filtered through a 0.2 µm filter to remove cells. Vanillic acid was added again to a final concentration of 4 mM, to replenish the vanillic acid consumed by P. putida. This was then used as the growth medium for C. fimi.
Data analysis and visualization: Original data are available as spreadsheets in Supplemental Data File 1. All data were analyzed using R v. 4.0.2 in Rstudio v.1.3.959. Growth rates (r) were calculated by fitting the exponential portion of the growth curve to the model N(t) = N0ert. Lag time was calculated as the intersection of the fitted growth curve with OD = 0.0126 (the threshold of detection in multiwell plates). The relationships between lag time and substrate concentration, or between growth rate and concentration, were calculated by fitting a linear relationship using the lm package in R. Inkscape v. 1.0 was used to generate the conceptual figures (Figure 1 and Figure 10) and for customizing layout and annotations on other figures.
3. Results
3.1. Both Vanillic Acid and the Formaldehyde Generated during Its Degradation Are Toxic to Consortium Members
Our initial experiments aimed to define the role of toxic compounds in our community, particularly formaldehyde generation and consumption, and formaldehyde-mediated growth inhibition. Previous work in our lab has shown that P. putida growing on vanillic acid can generate formaldehyde that escapes the cell to accumulate in the growth medium [23]. However, the effect of that formaldehyde on other members of the microbial community is unknown. Moreover, given that lignin-derived aromatic compounds can themselves be toxic, we reasoned it was possible that vanillic acid could also inhibit growth in our consortium and that the benefit of its degradation might even outweigh the risks of formaldehyde production. We, therefore, assessed the tolerance of consortium members to both compounds.
Because P. putida can grow on vanillic acid as a sole carbon source and would be required to do so in our consortium, we tested its growth tolerance to a range of vanillic acid concentrations while using the compound as its sole carbon substrate. For the other organisms, we were required to provide an alternative growth substrate in addition to the vanillic acid (see Table S1 for details). Remarkably, vanillic acid had a very small effect on the growth rate (slope = −0.0032, p < 0.05), and no detectable effect on the lag time, for M. extorquens, up to 14 mM (Figure 2). However, vanillic acid did inhibit the growth of both C. fimi and P. putida; both organisms showed a significant increase in lag time (slope = 1.77 and 0.93, respectively; p < 0.05), and C. fimi showed a decrease in growth rate (slope = −0.0097, p < 0.05), with increasing vanillic acid concentrations (Figure 2, Figure S2). For C. fimi, no growth was detectable at 14 mM vanillic acid and it was not possible to calculate lag time above 8 mM.
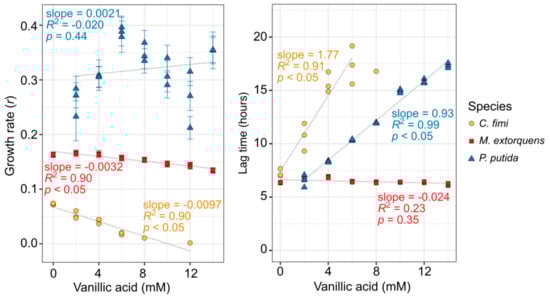
Figure 2.
Vanillic acid inhibits the growth of C. fimi and P. putida substantially, but has only a minor effect on M. extorquens growth. Each organism was grown in pure culture in mineral medium and OD600 monitored for up to 60 h with a range of vanillic acid concentrations (original growth curves are shown in Figure S2). C. fimi was provided with cellobiose and M. extorquens with methanol as growth substrates, whereas P. putida was able to use the vanillic acid as a growth substrate. Each point represents a biological replicate. Only growth rates for which R2 > 0.9 are shown here. In the left panel, error bars denote the standard error of the fitted growth rate. For C. fimi and P. putida, lag time and growth rate are dependent on vanillic acid concentration.
For P. putida, we conducted similar experiments on protocatechuic acid, another lignin-derived aromatic compound that lacks the methoxyl group but is otherwise identical to vanillic acid. While P. putida showed a slight decrease in growth rate with PCA concentration, it was much lower than that for vanillic acid, and there was no detectable change in lag time (Figure S3). It is therefore likely that much of the toxic effect on P. putida is due to the methoxyl group of the vanillic acid, either directly, or due to the formaldehyde that can be generated from it.
We also measured the effect of formaldehyde on the consortium members, by assessing growth in liquid medium, and by measuring the frequency distribution of formaldehyde-tolerant individuals by counting colony-forming units on formaldehyde agar [43]. In both media, we found that C. fimi showed no growth at concentrations of 0.5 mM and higher, establishing it as the most formaldehyde-sensitive of the organisms in our consortium. In contrast, 100% of M. extorquens cells are able to grow in the presence of 1 mM formaldehyde, and both P. putida and M. extorquens showed some growth at concentrations of 3 mM or higher (Figure 3).
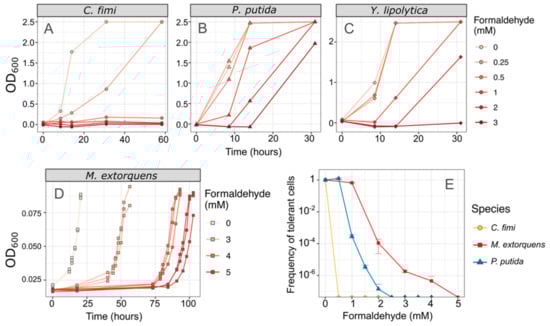
Figure 3.
C. fimi is the most formaldehyde-sensitive member of the consortium. (A–D) Each species was grown in pure culture in minimal medium with varying concentrations of formaldehyde, and growth monitored by OD600. No growth was observed in C. fimi at concentrations of 0.5 mM or higher, whereas Y. lipolytica grew at up to 2 mM formaldehyde and P. putida at up to 3 mM within 30 h. Note that OD is shown here on a linear scale for ease of interpretability; note also that the color scale for formaldehyde concentrations is different between panels (A–C) and panel (D). Data from panel (D) are reproduced from [43]. (E) An alternative method of understanding formaldehyde tolerance is the enumeration of cells that are able to form colonies on agar medium containing formaldehyde. In M. extorquens, 100% of the plated population formed colonies at 1 mM and 1/10,000 formed colonies at 2 mM. P. putida cells also formed colonies at those concentrations but at a lower frequency. In C. fimi, no colonies were observed at 0.5 mM formaldehyde or higher. Error bars show the standard deviation of three replicate platings.
In our experiments with P. putida growing on vanillic acid as the sole carbon source, formaldehyde levels in the medium increased throughout the period of growth and decreased only when vanillic acid was depleted and the culture entered stationary phase (Figure 4). Regardless of the initial concentration of vanillic acid, the formaldehyde concentration uniformly reached a peak of between 0.6 and 0.8 mM; however, because higher concentrations cause P. putida to grow more slowly, formaldehyde remained present in the medium for a longer time. In contrast, growth on PCA resulted in faster growth than on vanillic acid and no formaldehyde production (Figure 4). Notably, because C. fimi growth is inhibited at concentrations of 0.5 mM and higher, these results pointed to the potential for lignin degradation to interfere with cellulose degradation, unless a detoxification mechanism for formaldehyde could be introduced. Furthermore, while P. putida showed very little inhibition from formaldehyde concentrations lower than 1 mM in our single-species experiments, we reasoned that removal of formaldehyde in the medium might also help relieve some of the burden of intracellular detoxification from P. putida.
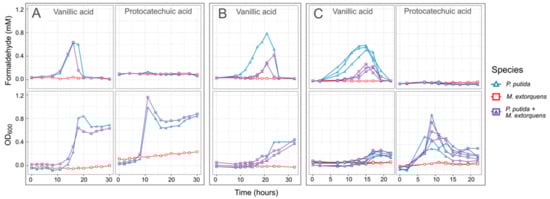
Figure 4.
When P. putida grows on vanillic acid as a sole carbon substrate, formaldehyde accumulates in the medium to levels potentially toxic to C. fimi. When grown in coculture with P. putida, M. extorquens reduces formaldehyde accumulation. Shown here are the formaldehyde in the medium (top row) and total growth of the community (bottom row) from three separate experiments in which M. extorquens and P. putida were grown separately or together in minimal medium with vanillic acid as the sole carbon source: (A,B) 4 mM vanillic acid or protocatechuic acid; (C) 10 mM. Individual lines represent independent culture vessels. As M. extorquens cannot grow on vanillic acid, no activity was observed in the M. extorquens–only cultures. In cultures containing P. putida, formaldehyde was generated on vanillic acid during the exponential growth phase, and the duration and peak of the formaldehyde was lower in cultures containing M. extorquens. The data in panel (B) are from a larger experiment testing M. extorquens cultures from different pre-growth conditions and inoculation ratios; full results for that experiment are shown in Figure S4. All data shown here are from cultures initiated in stationary phase, and from M. extorquens pre-grown on methanol.
3.2. M. extorquens Reduces the Formaldehyde Concentrations in Cocultures Growing on Vanillic Acid
We therefore tested the hypothesis that co-culturing M. extorquens with P. putida growing on vanillic acid could lower the formaldehyde concentrations in the medium, as M. extorquens can use formaldehyde as a growth substrate. We conducted a number of experiments at different vanillic acid concentrations and adding the two organisms at different ratios. We consistently found that including M. extorquens did indeed result in lower concentrations of measurable formaldehyde (Figure 4). While preliminary experiments indicated that the amount of formaldehyde reduction could be influenced by the conditions in which M. extorquens was grown prior to being added to the coculture (Figure S4), in the spirit of creating a robust and sustainable community that might withstand serial culture, we ultimately proceeded with experiments in which all organisms were grown to stationary phase in similar conditions before being combined.
The modest change in formaldehyde concentrations did not noticeably alter the overall growth rate or yield of the P. putida + M. extorquens coculture (Figure 4). We next needed to test whether it would have an effect on C. fimi, the most formaldehyde-sensitive member of the consortium. To do so required developing a set of culture conditions that would support growth of all community members together.
3.3. A Minimal Growth Medium Can Support All Members and Facilitates Metabolomic Analysis, with Modest Amino Acid and Vitamin Supplements and Reduced Buffer Concentrations
For experiments in the community dynamics of the consortium, we needed to develop a new culture medium that would not only support the growth of each consortium member individually, but also facilitate full chemical characterization of their interactions, and enable reproducible experiments. Because a defined mineral medium can simplify metabolomics analysis and avoid the batch effects sometimes observed in complex media, we began with a PIPES-buffered mineral medium (MP) that had originally been optimized for M. extorquens [26]. We found that it supported P. putida growth well, on multiple carbon substrates. However, C. fimi showed no measurable growth on MP on any carbon source. The addition of yeast extract or peptone did aid growth, leading us to test the possibility of an amino acid or vitamin auxotrophy. As most published media for Cellulomonas species contain undefined media or supplemental vitamins (e.g., [44,45]), we conducted set of trials using different combinations of amino acids and vitamins to deduce that C. fimi required supplementation by methionine and thiamine in order to grow on MP (Figure S5). Biotin was also added to the medium, due to an indication early in experimentation that it might help C. fimi growth, and from literature mentioning that it might be necessary for Y. lipolytica [46,47] and C. fimi [45], although in many cases its addition did not noticeably affect growth of any of the organisms (Figure 5). The addition of these supplements had no measurable effect on the growth of M. extorquens and only a very small effect on P. putida (Figure 5).
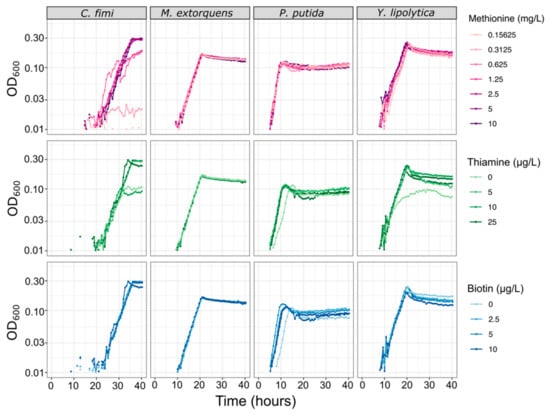
Figure 5.
Vitamin and amino acid supplements have minimal effect on growth rates of each of the consortium members, except for C. fimi. Each species was grown in pure culture in minimal medium with a range of concentrations of methionine, thiamine, or biotin. For the methionine experiment, all cultures contained 25 µg/L thiamine and 10 µg/L biotin; for the thiamine experiment, 10 mg/L methionine and 10 µg/L biotin; for the biotin experiment, 10 mg/L methionine and 25 µg/L thiamine.
During the single-species growth assays we also measured growth rates of each of the organisms alone in MP medium, in optimal growth conditions (Figure S6, Table S1). Growth rates differed markedly among organisms: P. putida grew most rapidly by far (r = 0.40), C. fimi the slowest (r = 0.21), and M. extorquens and Y. lipolytica with similarly moderate growth rates (r = 0.24 and 0.25, respectively). While these differences posed a challenge in terms of our understanding of metabolic interactions among consortium members, it ultimately made it relatively easy to interpret growth curves of mixed cultures (as described further below).
A final amendment to the growth medium recipe resulted from some preliminary work we conducted testing the feasibility of untargeted metabolomics analysis on the community. It was found that the 30 mM PIPES buffer in the medium interfered with sample processing for LCMS and GC-MS analysis. To remedy this problem, we explored the possibility of lowering the buffer concentration and explored the effect of this on the growth of the consortium members. We found that lowering the PIPES concentration had very little effect on the growth of most organisms, but P. putida proved the exception. However, it was still able to maintain reasonable growth at a PIPES concentration of 3 mM (tenfold lower than the original) (Figure S7). Supplementation of extra phosphate aided growth as well, though phosphate also interferes with metabolomics analysis, so some experiments were conducted with 5× the original phosphate concentration, but not all.
As mentioned above, we chose as carbon substrates a set of relatively simple compounds with chemical similarity to the key components of lignocellulose: cellobiose, xylose, and vanillic acid (Figure 1, Table 1). When necessary, we used 15 mM methanol or 3.5 mM succinate to support the growth of M. extorquens, though in many experiments we chose not to supplement M. extorquens growth beyond the formaldehyde and organic acid generated by the other consortium members. To decide upon the concentration of each lignocellulose-derived compound to include, we considered the typical balance among lignin, cellulose, and 5-carbon sugar components found in plant-based feedstock [48] and chose a concentration high enough to support measurable microbial growth within an experiment lasting 1–3 days, while being low enough to mitigate the effects of vanillic acid toxicity. We began with the 4:5:4 molar ratio of cellobiose:xylose:vanillic acid listed in Table 1, which translates to a 46:24:30 ratio by C molarity or a 49:27:24 ratio by mass. We then tested different concentrations. C. fimi grew fastest on the most dilute medium; at the intermediate concentration it would likely have achieved a higher final yield but did not do so within the length of the experiment (60 h); at the highest concentration it showed no growth at all. P. putida also showed earlier growth at the lower carbon concentrations (time to reach OD ~0.6 on 1× C was approximately 2 h earlier than on 3×), but due to its faster growth rate and moderate tolerance to vanillic acid, it recovered rapidly from the toxic effects of the concentrated medium and ultimately achieved the highest final optical density in the medium with the most carbon (Figure 6). The final recipe for our basal growth medium, which we called Model Lignocellulose, is given in Table 1. Details on the individual growth conditions of each experiment described in this manuscript are given in Table S1.
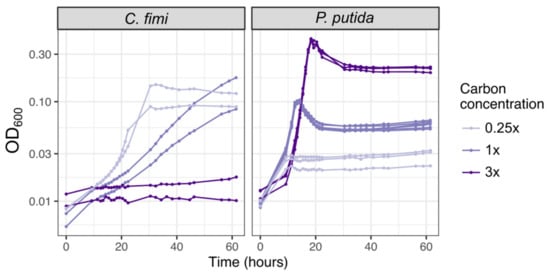
Figure 6.
Higher carbon concentrations in model lignocellulose medium result in slower growth and higher final yield; C. fimi is more strongly inhibited than P. putida. Each species was grown in pure culture in Model Lignocellulose medium (Table 1) with either 1× carbon (4 mM cellobiose, 5 mM xylose, 4 mM vanillic acid), or 0.25 times or 3 times those concentrations.
We developed methods to measure the production and consumption of all the compounds of interest: a colorimetric method for formaldehyde, GC-MS for vanillic acid, and HPLC for cellobiose and xylose. We also explored ways to measure the dynamics of individual species as they grew together in liquid co-culture. While we were unable to distinguish among species using flow cytometry, they were easily distinguished by colony morphology when plated onto agar medium (Figure S1). Furthermore, because C. fimi, M. extorquens, and P. putida had such distinctive growth rates, each formed a different part of the growth curve, and it was, therefore, possible to make an initial qualitative assessment of culture dynamics based on optical density alone. In general, P. putida was recognized as the earliest, most rapid part of the growth curve, which was followed by a slight dip in OD once P. putida had exhausted its carbon substrate (likely due to accumulation we observed of P. putida cells on the walls of the culture vessel, or to change in cell shape as has been observed for M. extorquens [26]). C. fimi growth, being much slower, was recognized as the slower growth becoming prominent well after P. putida reached its maximum. With its moderate growth rate, M. extorquens was recognizable as any increase in the growth curve relative to the C. fimi growth alone—though some of that increase in OD may also have been attributable to a stimulation of C. fimi growth by M. extorquens. An example of these dynamics is visible in Figure 7.
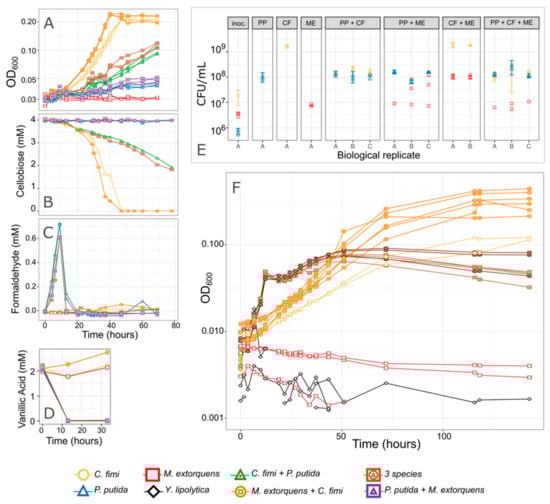
Figure 7.
P. putida inhibits C. fimi growth. (A–E) Results from an experiment in which each organism was grown in pure culture and in combinations, in minimal medium containing cellobiose and a low concentration of vanillic acid. The combination of species in each culture tube is indicated by the color and shape of the points. (A) Growth of the entire community as measured by optical density. Cultures without P. putida grew most rapidly and reached the highest final OD. No increase in OD was attributed to P. putida because 2 mM vanillic acid supports very little growth. (B) Cellobiose concentrations over time. C. fimi is the only organism capable of consuming cellobiose, and consumption was most rapid in cultures lacking P. putida. (C) Formaldehyde concentrations and (D) Vanillic acid concentrations over time. Formaldehyde peaked and disappeared, and vanillic acid was consumed, within 12 h, indicating activity by P. putida despite fact that the change in OD was not measurable. (E) Viable cells from each species, as measured by colony counts, at the beginning of the experiment (“inoc.” = inoculum), and at the end (78 h; each panel is titled with the species present in that culture tube). While no growth substrate was explicitly included to support M. extorquens, it increased slightly in abundance by the end of the experiment and the greatest increase was in the presence of C. fimi and absence of P. putida. Replicate culture tubes are shown along the x-axis; points indicate replicate measurements from each tube. (F) Results from a similar experiment, testing only a subset of the species combinations in Model Lignocellulose medium. Only optical density is shown here.
3.4. P. putida Inhibits Growth of C. fimi in Model Lignocellulose Medium, and C. fimi Supports the Growth of M. extorquens
Having developed a medium in which we could grow all organisms in coculture, we next set out to measure the dynamics of formaldehyde production and consumption on the microbial community, specifically to address the question of whether formaldehyde production by P. putida had an adverse effect on the activity of C. fimi (the most formaldehyde-sensitive of the organisms), and whether the presence of M. extorquens could modulate that effect. While the pulse of formaldehyde produced by P. putida during growth on vanillic acid was above the maximum inhibitory concentration (MIC) of C. fimi, it was transient and, therefore, we did not know how to predict its effects.
We conducted several experiments in which we observed members of the consortium alone or in different combinations, growing in Model Lignocellulose medium or similar conditions (Figure 7 and Figure S8). We consistently found that while C. fimi (with or without M. extorquens) was able to reach a high OD after 60–80 h of growth, when we added P. putida to the culture, that high OD was never reached. This was true in medium with 4 mM vanillic acid, in which we observed an early peak in OD at <20 h due to P. putida growth, and in medium with only 2 mM vanillic acid, in which much less P. putida growth was supported and yet C. fimi growth was still inhibited. The inhibited growth was also reflected in slower cellobiose consumption by C. fimi and in reduced final colony counts (Figure 7).
From the colony counts, we also observed that the presence of C. fimi supported the growth of M. extorquens, even when no carbon substrate was provided for M. extorquens, in agreement with our initial hypothesis that C. fimi might produce substrates upon which M. extorquens could cross-feed. Yet when P. putida was present, M. extorquens abundance was depressed; this may have been an indirect effect due to the reduced activity by C. fimi, or a direct interaction between P. putida and M. extorquens (Figure 7).
In cultures with P. putida, we observed the expected peak in formaldehyde production between 10 and 20 h of growth; as observed previously, the addition of M. extorquens to the coculture reduced the magnitude and duration of this peak (Figure 7 and Figure S8). Furthermore, the addition of M. extorquens resulted in a slight increase in OD relative to a coculture with only P. putida and C. fimi. However, M. extorquens was not able to completely ameliorate either the formaldehyde production or the growth inhibition. This observation led us to investigate whether the production of formaldehyde was in fact the primary reason for the effect of P. putida on C. fimi. If it was, then improving the performance of M. extorquens could dramatically improve the efficacy of the consortium in degrading our model lignocellulose compounds.
3.5. P. putida Inhibition of C. fimi Growth May Be due to Multiple Mechanisms
To test our hypothesis that formaldehyde production was the reason for the effect of P. putida on C. fimi growth, we tested growth on a modified lignocellulose medium, in which we replaced vanillic acid with protocatechuic acid (PCA). PCA is the immediate product of vanillic acid demethoxylation, and, therefore, can serve as a control for P. putida growth on aromatic compounds without formaldehyde production. We found that P. putida also inhibited C. fimi in these formaldehyde-free growth conditions, in a manner consistent with our observations on vanillic acid and independent of the addition of M. extorquens, leading us to conclude that formaldehyde production was not the most important aspect of the interaction between C. fimi and P. putida (Figure 8A).
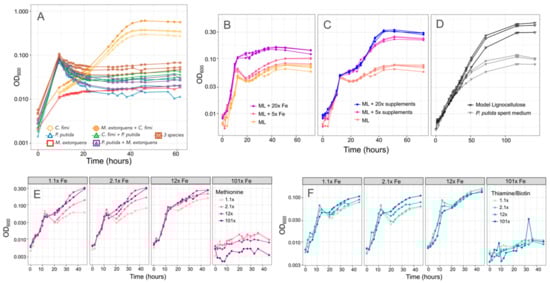
Figure 8.
There are multiple potential explanations for the inhibitory effect of P. putida on C. fimi growth. (A) Growth of individual species and combinations (denoted by color and shape of plot symbol) on Model Lignocellulose medium in which vanillic acid is replaced by protocatechuic acid, which does not result in formaldehyde production. Cultures with P. putida still show slower growth than those without. (B,C) Effect of increasing the iron or supplements (methionine, thiamine, and biotin) in the medium. In both cases, higher concentrations support more growth. (D) Growth of C. fimi alone on either Model Lignocellulose or P. putida spent medium: a lower final yield is reached on spent medium. (E,F) Growth of the model community (P. putida, C. fimi, M. extorquens) on combinations of different iron (panels), methionine (color scale), and thiamine + biotin (color scale) concentrations.
We next explored several other hypotheses to explain the inhibitory effect of P. putida on C. fimi. To assess whether P. putida was competing with C. fimi for important compounds in the medium, we tested higher concentrations of methionine, thiamine and biotin, or iron. In case the inhibition was due to an excreted compound, we also tested whether spent medium from P. putida could inhibit C. fimi growth. We found evidence supporting all three potential mechanisms. Addition of iron and vitamin/amino acid supplements, both alone and in combination, improved growth of the coculture (Figure 8). This was true only to a point; the highest iron concentrations tested resulted in no growth, likely due to toxic effects. Whereas the addition of iron resulted in an increase in the growth rate during the time <15 h, indicating an effect on P. putida growth, the effect of methionine, biotin, and thiamine was seen primarily in the second portion of the growth curve (C. fimi and M. extorquens). Thus, although our observations from pure culture indicate that thiamine and biotin provide P. putida with only a slight improvement in growth and methionine has no measurable effect, the species might still be actively removing these compounds from the medium.
Moreover, while the addition of P. putida spent medium did not affect the initial growth rate of a C. fimi-M. extorquens coculture, it did reduce the final yield (Figure 8). This could indicate either the effect of a soluble compound produced by P. putida, or the depletion by P. putida of important medium components, or both. One possibility might be siderophores, as P. putida produces siderophores that can inhibit the growth of competitors, and has been observed to accelerate their production in response to the availability of aromatic growth substrates [49,50].
Because increasing the iron concentration in the medium benefitted the growth of the consortium, we considered changing the base recipe for our model lignocellulose medium. However, we found that adding high concentrations of iron was in fact inhibitory to C. fimi growth when P. putida was not present to consume it (Figure S9). Clearly, the ideal growth medium to support interactions among the members of the consortium was not the same as the medium that best supported each organism individually.
3.6. Methionine-Overproducing M. extorquens Can Support the Growth of C. fimi
Given our observation that adding supplements to the medium could create unintended consequences, we opted to explore the possibility of including a consortium member with the ability to provide the methionine required by C. fimi for growth. This would not only eliminate the necessity for us to add it to the medium, but also create the opportunity for positive feedback between C. fimi and M. extorquens, given our data suggesting that C. fimi could support M. extorquens growth.
We used a previously published method to generate a methionine-overproducing strain of M. extorquens by selecting on medium containing ethionine [38,39]. When we cultured this M. extorquens strain with C. fimi, or both C. fimi and P. putida, in medium without added methionine, we found that it was able to support the growth of C. fimi to abundances similar to or better than those supported by 20 mg/L methionine (Figure 9). This effect was unique to the overproducing strain: wild-type M. extorquens did not promote C. fimi growth. Moreover, the effect was dependent upon the presence of either methanol or succinate to support the growth of the methionine producer (Figure 9), indicating that the benefit required having a high abundance of growing M. extorquens cells. The inclusion of a methionine-overproducing strain in the consortium might therefore prove to be a remedy to resolve one of the several interactions between C. fimi and P. putida—the competition for methionine.
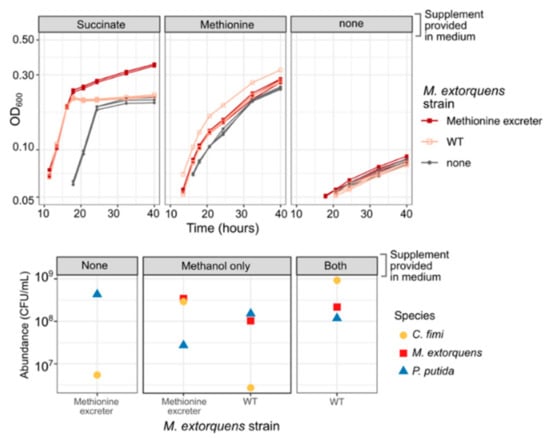
Figure 9.
A methionine-overproducing strain of M. extorquens can support the growth of C. fimi without the addition of methionine to the medium. Top: growth curves of C. fimi with different strains of M. extorquens (symbols), on MP medium with glucose and supplements (panels). Without succinate, M. extorquens growth is negligible. For C. fimi alone, growth with methionine is much greater than without. However, when succinate is present to enable M. extorquens growth, the culture of C. fimi + the methionine excreter reaches substantially higher growth than by C. fimi + WT M. extorquens, suggesting a benefit to C. fimi from the methionine. Bottom: colony counts of each species (symbols) from the endpoint of an experiment in which the three-species consortium was grown on Model Lignocellulose medium with either of the two strains of M. extorquens (x-axis), and supplemented with either nothing, methanol to support M. extorquens growth, or both methanol and methionine (panels). C. fimi grows only when methionine is present or when both methanol and the methionine-excreting M. extorquens strain are present. P. putida does not show the same reliance on methionine or M. extorquens.
4. Discussion
We have established a system for studying microbial lignocellulose degradation that uses tractable, well-characterized microbial species in ecological roles that take advantage of their evolved metabolic capabilities, and have developed a simple defined Model Lignocellulose medium with which to investigate interspecies interactions. This groundwork will enable future investigations involving metabolomic analysis and modeling for a more complete understanding of metabolic exchange within the community, and further work using engineering and laboratory evolution to optimize the efficiency and yield of the biomass transformation. While much remains to be learned about the mechanisms of the dynamics observed in this microbial community, the methods and initial findings described here comprise the first step toward using this promising model consortium for studying the microbial transformation of lignocellulosic biomass.
A valuable lesson learned from this study relates to the prevalence of unexpected ecological interactions that may be discovered even in a simple three-species community (Figure 10). Dynamics we discovered that were not originally predicted included the dramatic interspecies differences in nutritional needs, individual growth rates, pH sensitivity, and tolerance to toxins such as formaldehyde and vanillic acid. Some of these differences may provide clues about the organisms’ ecological niches. For example, formaldehyde tolerance shows a link to species’ metabolic capabilities: in M. extorquens, a methylotroph, formaldehyde is detoxified by the dephospho-tetrahydromethanopterin pathway [51,52], and vanillic-acid-consuming P. putida carries a set of redundant glutathione-dependent formaldehyde dehydrogenases [30]. However, in C. fimi, to our knowledge, formaldehyde detoxification has not been characterized. Another complication in our understanding of the community’s dynamics was the consumption by P. putida of compounds (iron and methionine) seemingly in excess of what was limiting for its growth. Critically, very little about these findings would be captured by genome-scale metabolic modeling, a method often based on the assumption that each member achieves optimal metabolism on the available substrates [53]. Our results point to the importance of taking into account traits outside of metabolism for their roles in interspecies interactions. As many model experimental systems in microbial ecology focus primarily on metabolite exchange and chemical warfare (e.g., [38,54,55,56]), our microbial consortium could prove a useful model for the study of alternative modes of ecological interactions.
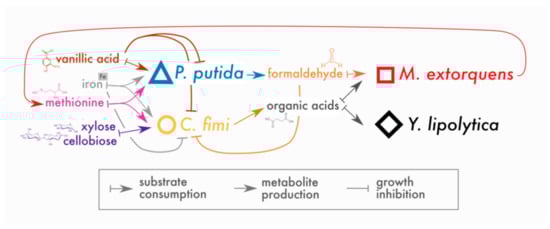
Figure 10.
Revised conceptual model of interactions in model lignocellulose-degrading microbial consortium. To our original model, we have added competition between P. putida and C. fimi for iron and methionine, and inhibitory effects of vanillic acid on C. fimi and P. putida and high concentrations of iron on C. fimi. We have found little evidence for inhibitory effects of formaldehyde (at the concentrations produced here) on any of the members besides C. fimi; there is evidence that C. fimi, but not P. putida, supports M. extorquens growth, likely through organic acid production. In addition, we have added the ability for M. extorquens to support C. fimi through the production of methionine.
The discovery of C. fimi’s dependence on methionine for growth provided a fortuitous opportunity to enrich the existing interspecies interactions though the development of a methionine-excreting strain of M. extorquens (Figure 9). This is especially promising, as we have observed C. fimi already has the capacity to promote M. extorquens growth (Figure 7), likely through the generation of carbon substrates. Prior work using exometabolomic analysis of C. fimi growing on cellulose and galactomannan has shown it to produce several organic acids (e.g., alpha-ketoglutaric acid, 3-hydroxypropionic acid, D-malic acid, citric acid, and amino acids) that are among those known to support the growth of M. extorquens [33]. The exchange of methionine for carbon substrates by cross-feeding is, in fact, the basis of another well-characterized model microbial consortium, which was developed through laboratory evolution and has been studied extensively as an example of a stable bidirectional costly mutualism [38,57,58]. It is likely that the growth promotion observed here could in the future be similarly developed through laboratory evolution into a true codependence.
A central goal of our work was to address the issue of formaldehyde production during lignin degradation and to test the hypothesis that a methylotrophic organism could improve the efficiency of lignocellulose degradation by removing a toxic burden. We made significant contributions in that area, by documenting formaldehyde accumulation due to P. putida growth on vanillic acid over time and the effect of formaldehyde consumption by M. extorquens. However, much remains still to be investigated. Because formaldehyde concentrations in the consortium are dynamic, their effect may be dramatically different in different growth conditions. Formaldehyde-induced cell damage occurs over time [43], and as formaldehyde remains in the medium as long as P. putida is actively consuming vanillic acid, a continuous-culture growth environment might induce a more substantial effect of formaldehyde on C. fimi viability. Yet it was clear in the present study that other interspecies interactions had a stronger effect on the community than formaldehyde, and those interactions must be resolved first before the role of formaldehyde can be accurately explored and quantified.
Supplementary Materials
The Supplementary Materials are available online at https://www.mdpi.com/2076-2607/9/2/321/s1.
Author Contributions
Author contributions were as follows. Conceptualization, J.A.L. and C.J.M.; formal analysis, J.A.L.; funding acquisition, C.J.M.; investigation, J.A.L., A.C.B., N.J.S. and B.S.; methodology, J.A.L. and S.S.; project administration, C.J.M.; resources, S.S. and C.J.M.; supervision, C.J.M.; visualization, J.A.L.; writing—original draft, J.A.L. and A.C.B.; writing—review and editing, S.S. and C.J.M. All authors have read and agreed to the published version of the manuscript.
Funding
This work was funded by grants from the US Department of Energy Genomic Science Program in Systems Biology for Energy and Environment, awards DE-SC0012627 and DE-SC0019436.
Institutional Review Board Statement
Not applicable.
Informed Consent Statement
Not applicable.
Data Availability Statement
All data presented in this study are available in Supplemental Data Files S1 and S2.
Acknowledgments
We thank Daniel Segrè, Meghan Thommes, Trent Northen, and Andrea Lubbe for their contributions to the conceptualization and development of this model system, and Tomislav Ticak for his engagement in discussions of the methods and data. We are grateful to Armando McDonald for his assistance in troubleshooting chemical analysis methods.
Conflicts of Interest
The authors declare no conflict of interest.
References
- Raud, M.; Kikas, T.; Sippula, O.; Shurpali, N.J. Potentials and challenges in lignocellulosic biofuel production technology. Renew. Sustain. Energy Rev. 2019, 111, 44–56. [Google Scholar] [CrossRef]
- Brodin, M.; Vallejos, M.; Opedal, M.T.; Area, M.C.; Chinga-Carrasco, G. Lignocellulosics as sustainable resources for production of bioplastics—A review. J. Clean. Prod. 2017, 162, 646–664. [Google Scholar] [CrossRef]
- Zakzeski, J.; Bruijnincx, P.C.A.; Jongerius, A.L.; Weckhuysen, B.M. The catalytic valorization of lignin for the production of renewable chemicals. Chem. Rev. 2010, 110, 3552–3599. [Google Scholar] [CrossRef] [PubMed]
- Beckham, G.T.; Johnson, C.W.; Karp, E.M.; Salvachúa, D.; Vardon, D.R. Opportunities and challenges in biological lignin valorization. Curr. Opin. Biotechnol. 2016, 42, 40–53. [Google Scholar] [CrossRef]
- Ragauskas, A.J.; Beckham, G.T.; Biddy, M.J.; Chandra, R.; Chen, F.; Davis, M.F.; Davison, B.H.; Dixon, R.A.; Gilna, P.; Keller, M.; et al. Lignin valorization: Improving lignin processing in the biorefinery. Science 2014, 344, 1246843. [Google Scholar] [CrossRef]
- Vanholme, R.; Demedts, B.; Morreel, K.; Ralph, J.; Boerjan, W. Lignin biosynthesis and structure. Plant Physiol. 2010, 153, 895–905. [Google Scholar] [CrossRef] [PubMed]
- Brunel, F.; Davison, J. Cloning and sequencing of Pseudomonas genes encoding vanillate demethylase. J. Bacteriol. 1988, 170, 4924–4930. [Google Scholar] [CrossRef]
- Mitsui, R.; Kusano, Y.; Yurimoto, H.; Sakai, Y.; Kato, N.; Tanaka, M. Formaldehyde fixation contributes to detoxification for growth of a nonmethylotroph, Burkholderia cepacia TM1, on vanillic acid. Appl. Environ. Microbiol. 2003, 69, 6128–6132. [Google Scholar] [CrossRef]
- Sudtachat, N.; Ito, N.; Itakura, M.; Masuda, S.; Eda, S.; Mitsui, H.; Kawaharada, Y.; Minamisawa, K. Aerobic vanillate degradation and C1 compound metabolism in Bradyrhizobium japonicum. Appl. Environ. Microbiol. 2009, 75, 5012–5017. [Google Scholar] [CrossRef]
- Merkens, H.; Beckers, G.; Wirtz, A.; Burkovski, A. Vanillate metabolism in Corynebacterium glutamicum. Curr. Microbiol. 2005, 51, 59–65. [Google Scholar] [CrossRef]
- Chen, H.-P.; Chow, M.; Liu, C.-C.; Lau, A.; Liu, J.; Eltis, L.D. Vanillin catabolism in Rhodococcus jostii RHA1. Appl. Environ. Microbiol. 2012, 78, 586–588. [Google Scholar] [CrossRef]
- Daims, H.; Taylor, M.W.; Wagner, M. Wastewater treatment: A model system for microbial ecology. Trends Biotechnol. 2006, 24, 483–489. [Google Scholar] [CrossRef] [PubMed]
- Wen, M.; Bond-Watts, B.B.; Chang, M.C. Production of advanced biofuels in engineered E. coli. Curr. Opin. Chem. Biol. 2013, 17, 472–479. [Google Scholar] [CrossRef] [PubMed]
- Zuroff, T.R.; Curtis, W.R. Developing symbiotic consortia for lignocellulosic biofuel production. Appl. Microbiol. Biotechnol. 2012, 93, 1423–1435. [Google Scholar] [CrossRef] [PubMed]
- Ortiz-Marquez, J.C.F.; Do Nascimento, M.; Zehr, J.P.; Curatti, L. Genetic engineering of multispecies microbial cell factories as an alternative for bioenergy production. Trends Biotechnol. 2013, 31, 521–529. [Google Scholar] [CrossRef] [PubMed]
- Minty, J.J.; Singer, M.E.; Scholz, S.A.; Bae, C.-H.; Ahn, J.-H.; Foster, C.E.; Liao, J.C.; Lin, X.N. Design and characterization of synthetic fungal-bacterial consortia for direct production of isobutanol from cellulosic biomass. Proc. Natl. Acad. Sci. USA 2013, 110, 14592–14597. [Google Scholar] [CrossRef]
- Khazaei, T.; Williams, R.L.; Bogatyrev, S.R.; Doyle, J.C.; Henry, C.S.; Ismagilov, R.F. Metabolic multistability and hysteresis in a model aerobe-anaerobe microbiome community. Sci. Adv. 2020, 6, eaba0353. [Google Scholar] [CrossRef]
- Cavka, A.; Stagge, S.; Jönsson, L.J. Identification of small aliphatic aldehydes in pretreated lignocellulosic feedstocks and evaluation of their inhibitory effects on yeast. J. Agric. Food Chem. 2015, 63, 9747–9754. [Google Scholar] [CrossRef]
- Brandt, B.A.; Jansen, T.; Görgens, J.F.; van Zyl, W.H. Overcoming lignocellulose-derived microbial inhibitors: Advancing the Saccharomyces cerevisiae resistance toolbox. Biofuels Bioprod. Biorefin. 2019, 13, 1520–1536. [Google Scholar] [CrossRef]
- Hibi, M.; Sonoki, T.; Mori, H. Functional coupling between vanillate-o-demethylase and formaldehyde detoxification pathway. FEMS Microbiol. Lett. 2005, 253, 237–242. [Google Scholar] [CrossRef]
- Nayak, D.D.; Marx, C.J. Genetic and phenotypic comparison of facultative methylotrophy between Methylobacterium extorquens Strains PA1 and AM1. PLoS ONE 2014, 9, e107887. [Google Scholar] [CrossRef] [PubMed]
- Chistoserdova, L.; Lidstrom, P.M.E. Aerobic methylotrophic prokaryotes. In The Prokaryotes; Rosenberg, E., DeLong, E.F., Lory, S., Stackebrandt, E., Thompson, F., Eds.; Springer: Berlin/Heidelberg, Germany, 2013; pp. 267–285. ISBN 978-3-642-30140-7. [Google Scholar]
- Lee, J.A.; Stolyar, S.; Marx, C.J. An aerobic link between lignin degradation and C1 metabolism: Growth on methoxylated aromatic compounds by members of the genus Methylobacterium. bioRxiv 2019, 712836. [Google Scholar] [CrossRef]
- Chubiz, L.M.; Purswani, J.; Carroll, S.; Marx, C.J. A novel pair of inducible expression vectors for use in Methylobacterium extorquens. BMC Res. Notes 2013, 6, 183. [Google Scholar] [CrossRef] [PubMed]
- Peyraud, R.; Schneider, K.; Kiefer, P.; Massou, S.; Vorholt, J.A.; Portais, J.-C. Genome-scale reconstruction and system level investigation of the metabolic network of Methylobacterium extorquens AM1. BMC Syst. Biol. 2011, 5, 189. [Google Scholar] [CrossRef]
- Delaney, N.F.; Kaczmarek, M.E.; Ward, L.M.; Swanson, P.K.; Lee, M.-C.; Marx, C.J. Development of an optimized medium, strain and high-throughput culturing methods for Methylobacterium extorquens. PLoS ONE 2013, 8, e62957. [Google Scholar] [CrossRef]
- Ravi, K.; García-Hidalgo, J.; Gorwa-Grauslund, M.F.; Lidén, G. Conversion of lignin model compounds by Pseudomonas putida KT2440 and isolates from compost. Appl. Microbiol. Biotechnol. 2017, 101, 5059–5070. [Google Scholar] [CrossRef]
- Belda, E.; van Heck, R.G.A.; José Lopez-Sanchez, M.; Cruveiller, S.; Barbe, V.; Fraser, C.; Klenk, H.-P.; Petersen, J.; Morgat, A.; Nikel, P.I.; et al. The revisited genome of Pseudomonas putida KT2440 enlightens its value as a robust metabolic chassis. Environ. Microbiol. 2016. [Google Scholar] [CrossRef]
- Simon, O.; Klaiber, I.; Huber, A.; Pfannstiel, J. Comprehensive proteome analysis of the response of Pseudomonas putida KT2440 to the flavor compound vanillin. J. Proteomics 2014, 109, 212–227. [Google Scholar] [CrossRef]
- Roca, A.; Rodríguez-Herva, J.J.; Ramos, J.L. Redundancy of enzymes for formaldehyde detoxification in Pseudomonas putida. J. Bacteriol. 2009, 191, 3367–3374. [Google Scholar] [CrossRef]
- Takeuchi, Y.; Khawdas, W.; Aso, Y.; Ohara, H. Microbial fuel cells using Cellulomonas spp. with cellulose as fuel. J. Biosci. Bioeng. 2017, 123, 358–363. [Google Scholar] [CrossRef]
- Christopherson, M.R.; Suen, G.; Bramhacharya, S.; Jewell, K.A.; Aylward, F.O.; Mead, D.; Brumm, P.J. The genome sequences of Cellulomonas fimi and “Cellvibrio gilvus” reveal the cellulolytic strategies of two facultative anaerobes, transfer of “Cellvibrio gilvus” to the genus Cellulomonas, and proposal of Cellulomonas gilvus sp. nov. PLoS ONE 2013, 8, e53954. [Google Scholar] [CrossRef] [PubMed]
- Lubbe, A.; Bowen, B.P.; Northen, T. Exometabolomic analysis of cross-feeding metabolites. Metabolites 2017, 7, 50. [Google Scholar] [CrossRef] [PubMed]
- Blazeck, J.; Hill, A.; Liu, L.; Knight, R.; Miller, J.; Pan, A.; Otoupal, P.; Alper, H.S. Harnessing Yarrowia lipolytica lipogenesis to create a platform for lipid and biofuel production. Nat. Commun. 2014, 5, 3131. [Google Scholar] [CrossRef] [PubMed]
- Bredeweg, E.L.; Pomraning, K.R.; Dai, Z.; Nielsen, J.; Kerkhoven, E.J.; Baker, S.E. A Molecular genetic toolbox for Yarrowia lipolytica. Biotechnol. Biofuels 2017, 10, 2. [Google Scholar] [CrossRef]
- Zomorrodi, A.R.; Segrè, D. Synthetic ecology of microbes: Mathematical models and applications. J. Mol. Biol. 2016, 428, 837–861. [Google Scholar] [CrossRef]
- Bazurto, J.; Nayak, D.D.; Ticak, T.; Davlieva, M.; Lee, J.A.; Lambert, L.B.; Benski, O.J.; Quates, C.J.; Johnson, J.L.; Patel, J.S.; et al. EfgA is a conserved formaldehyde sensor that halts bacterial translation in response to elevated formaldehyde. bioRxiv 2020. [Google Scholar] [CrossRef]
- Harcombe, W. Novel cooperation experimentally evolved between species. Evol. Int. J. Org. Evol. 2010, 64, 2166–2172. [Google Scholar] [CrossRef]
- Lawrence, D.A.; Smith, D.A.; Rowbury, R.J. Regulation of methionine synthesis in Salmonella typhimurium: Mutants resistant to inhibition by analogues of methionine. Genetics 1968, 58, 473–492. [Google Scholar] [CrossRef]
- Atlas, R.M. Handbook of Media for Environmental Microbiology, 2nd ed.; CRC Press: Boca Raton, FL, USA, 2005; ISBN 978-1-4200-3748-7. [Google Scholar]
- Nash, T. The colorimetric estimation of formaldehyde by means of the hantzsch reaction. Biochem. J. 1953, 55, 416–421. [Google Scholar] [CrossRef]
- Stalikas, C.D. Extraction, separation, and detection methods for phenolic acids and flavonoids. J. Sep. Sci. 2007, 30, 3268–3295. [Google Scholar] [CrossRef]
- Lee, J.A.; Riazi, S.; Nemati, S.; Bazurto, J.V.; Vasdekis, A.E.; Ridenhour, B.J.; Remien, C.H.; Marx, C.J. Microbial phenotypic heterogeneity in response to a metabolic toxin: Continuous, dynamically shifting distribution of formaldehyde tolerance in Methylobacterium extorquens populations. PLoS Genet. 2019, 15, e1008458. [Google Scholar] [CrossRef]
- Whittle, D.J.; Kilburn, D.G.; Warren, R.A.J.; Miller, R.C. Molecular cloning of a Cellulomonas fimi cellulase gene in Escherichia coli: Recombinant DNA; plasmid PBR322; immunoassay. Gene 1982, 17, 139–145. [Google Scholar] [CrossRef]
- Summers, R.J.; Boudreaux, D.P.; Srinivasan, V.R. Continuous cultivation for apparent optimization of defined media for Cellulomonas sp. and Bacillus cereus. Appl. Environ. Microbiol. 1979, 38, 66–71. [Google Scholar] [CrossRef]
- Gasmi, N.; Ayed, A.; Nicaud, J.-M.; Kallel, H. Design of an efficient medium for heterologous protein production in Yarrowia lipolytica: Case of human interferon alpha 2b. Microb. Cell Factories 2011, 10, 38. [Google Scholar] [CrossRef]
- Kebabci, Ö.; Cihangir, N. Comparison of three Yarrowia lipolytica strains for lipase production: NBRC 1658, IFO 1195, and a local strain. Turk. J. Biol. 2012, 36, 15–24. [Google Scholar]
- Han, J.S.; Rowell, J.S. Chemical composition of fibers, chapter 5. In Paper and Composites from Agro-Based Resources; Rowell, R.M., Young, R.A., Rowell, J.K., Eds.; CRC Press: Boca Raton, FL, USA, 1997; pp. 83–134. [Google Scholar]
- Buyer, J.S.; Sikora, L.J. Rhizosphere interactions and siderophores. Plant Soil 1990, 129, 101–107. [Google Scholar] [CrossRef]
- Joshi, H.; Dave, R.; Venugopalan, V.P. Pumping iron to keep fit: Modulation of siderophore secretion helps efficient aromatic utilization in Pseudomonas putida KT2440. Microbiology 2014, 160, 1393–1400. [Google Scholar] [CrossRef]
- Vorholt, J.A.; Chistoserdova, L.; Lidstrom, M.E.; Thauer, R.K. The NADP-dependent methylene tetrahydromethanopterin dehydrogenase in Methylobacterium extorquens AM1. J. Bacteriol. 1998, 180, 5351–5356. [Google Scholar] [CrossRef] [PubMed]
- Marx, C.J.; Chistoserdova, L.; Lidstrom, M.E. Formaldehyde-detoxifying role of the tetrahydromethanopterin-linked pathway in Methylobacterium extorquens AM1. J. Bacteriol. 2003, 185, 7160–7168. [Google Scholar] [CrossRef] [PubMed]
- Harcombe, W.R.; Riehl, W.J.; Dukovski, I.; Granger, B.R.; Betts, A.; Lang, A.H.; Bonilla, G.; Kar, A.; Leiby, N.; Mehta, P.; et al. Metabolic resource allocation in individual microbes determines ecosystem interactions and spatial dynamics. Cell Rep. 2014, 7, 1104–1115. [Google Scholar] [CrossRef] [PubMed]
- Granato, E.T.; Foster, K.R. The evolution of mass cell suicide in bacterial warfare. Curr. Biol. 2020, 30, 2836–2843.e3. [Google Scholar] [CrossRef]
- LaSarre, B.; McCully, A.L.; Lennon, J.T.; McKinlay, J.B. Microbial mutualism dynamics governed by dose-dependent toxicity of cross-fed nutrients. ISME J. 2017, 11, 337–348. [Google Scholar] [CrossRef]
- Gonzalez, D.; Sabnis, A.; Foster, K.R.; Mavridou, D.A.I. Costs and benefits of provocation in bacterial warfare. Proc. Natl. Acad. Sci. USA 2018, 115, 7593–7598. [Google Scholar] [CrossRef] [PubMed]
- Harcombe, W.R.; Chacón, J.M.; Adamowicz, E.M.; Chubiz, L.M.; Marx, C.J. Evolution of bidirectional costly mutualism from byproduct consumption. Proc. Natl. Acad. Sci. USA 2018, 115, 12000–12004. [Google Scholar] [CrossRef] [PubMed]
- Douglas, S.M.; Chubiz, L.M.; Harcombe, W.R.; Marx, C.J. Identification of the potentiating mutations and synergistic epistasis that enabled the evolution of inter-species cooperation. PLoS ONE 2017, 12, e0174345. [Google Scholar] [CrossRef] [PubMed]


Publisher’s Note: MDPI stays neutral with regard to jurisdictional claims in published maps and institutional affiliations. |
© 2021 by the authors. Licensee MDPI, Basel, Switzerland. This article is an open access article distributed under the terms and conditions of the Creative Commons Attribution (CC BY) license (http://creativecommons.org/licenses/by/4.0/).