Article

Effect of Operational Conditions on Ammonia Recovery from Simulated Livestock Wastewater Using Gas-Permeable Membrane Technology

by
Berta Riaño
1,*,
Beatriz Molinuevo-Salces
1,
Matías B. Vanotti
2 and
María Cruz García-González
1
1
Agricultural Technological Institute of Castilla y León, Ctra. Burgos, km. 119, 47071 Valladolid, Spain
2
Agricultural Research Service, Coastal Plains Soil, Water and Plant Research Center, United States Department of Agriculture, 2611 W. Lucas St., Florence, SC 29501, USA
*
Author to whom correspondence should be addressed.
Environments 2022, 9(6), 70; https://doi.org/10.3390/environments9060070
Submission received: 9 May 2022 / Revised: 31 May 2022 / Accepted: 1 June 2022 / Published: 6 June 2022

Abstract

:
Gas-permeable membrane (GPM) technology is a novel alternative to reduce N content in wastewater while recovering N in the form of an ammonium salt solution that can be used as fertilizer. This work aims to elucidate the effects of three operational conditions on the performance of GPM technology for ammonia recovery in batch conditions using synthetic wastewater that simulates livestock wastewater. Firstly, the effect of the ratio of the initial mass of total ammonia nitrogen (TAN) per membrane surface from 197 to 936 g N per m2 of membrane was investigated. The highest ratio presented the highest TAN recovery rate (90 g N m−2 d−1). Secondly, the influence of the ratio of the volume of wastewater per volume of acidic trapping solution in the range from 7.8 to 33.3 L L−1 was studied. In this case, the higher the ratio, the higher the N concentration in the trapping solution, achieving a N concentration of 43,773 mg N L−1 with a ratio of 33.3 L L−1. Finally, two different TAN concentrations (<0.1 and 30 g N L−1) in the acidic trapping solution were evaluated. The use of a trapping solution with a TAN concentration of 30 g N L−1 led to a reduction in the TAN recovery rate, which meant that the diffusion of ammonia through the membrane was more difficult as the trapping solution became saturated with TAN. Overall, the tested conditions highly influence the performance of GPM technology, and therefore, these conditions should be set to optimize the ammonia recovery and reduce nitrogen losses.

1. Introduction

Ammonia (NH3) emissions contribute to the eutrophication of surface water bodies, soil acidification, and particulate matter (PM) formation, with negative impacts on vegetation, water quality, biodiversity, and human health [1,2,3]. Nowadays, about 93% of NH3 emissions in Europe are related to agriculture, with the livestock sector being the largest source [1]. European environmental legislation has become increasingly strict in order to reduce NH3 emissions. Different technologies have been developed in the last few decades to mitigate the harmful effects of ammonia emissions, with a special focus on nitrogen recovery. The recovery of nitrogen from wastewater could partially offset the demand for nitrogen-based fertilizers produced via the energy intensive Haber–Bosch process while complying with the aim of reducing ammonia emissions [4].
Current technologies for recovering nitrogen from wastewater include air stripping, zeolite adsorption through ion exchange, struvite precipitation, electrodialysis and reverse osmosis, and gas-permeable membrane (GPM) technology [5,6,7,8,9]. Munasinghe-Arachchige and Nirmalakhandan [10] undertook a multi-criteria analysis to rank these five N-recovery processes taking into account ten performance criteria including pretreatment, operating conditions, recovery performance, chemical and energy demands, and post-treatment. They concluded that GPM technology was the preferred option followed by struvite precipitation. In GPM technology, the membranes are submerged in the wastewater. Gaseous NH3 contained in the wastewater diffuses through the membrane pores and is captured and concentrated in an acidic trapping solution that is circulating inside the membrane. As a result, a concentrated stable ammonium salt solution is obtained. The efficiency of this novel technology to recover nitrogen is strongly linked with the presence of NH3 in the wastewater, where the total ammonia nitrogen species (TAN) NH3 and NH4+ are in equilibrium [11,12].
GPM technology has been investigated with great success to recover nitrogen from ammonia-rich wastewater, such as livestock waste and anaerobic digestate, at laboratory scale [13,14,15,16,17]. Some of these previous works have studied the influence of such operational conditions as pH control [9,15] and the flow rate of the acidic solution on ammonia recovery efficiency [9,18]. Other works have focused on the effect of wastewater characteristics (such as TAN, inorganic carbon, and organic matter content) on ammonia recovery using gas-permeable membranes [15,19]. More recently, a pilot-scale plant used a GPM system to recover nitrogen from swine manure and digestate was successfully demonstrated [20,21]. From the experience gained in the evaluation of this technology at a pilot scale, the need to further optimize the following parameters to improve ammonia recovery efficiency has emerged: (1) the ratio of the initial mass of TAN in wastewater per unit of membrane surface, (2) the ratio of wastewater volume to trapping solution volume, and (3) the effect of the TAN concentration of the acidic trapping solution. The establishment of optimal operating conditions is critical in order to maximize the recovery of nitrogen in the form of an ammonium salt solution and to reduce ammonia losses to the environment. Although some recent studies have partially addressed these issues [4,22], there still remains a need to determine how they affect the ammonia recovery process and the production of the ammonium salt solution.
In view of the aforementioned, the objective of this work was to investigate the performance of GPM technology under different operational parameters to maximize ammonia recovery efficiency. The parameters herein evaluated were: the ratio of the initial mass of TAN in wastewater per membrane surface, the ratio of wastewater volume to acidic trapping solution volume, and the TAN concentration of the acidic trapping solution.

2. Materials and Methods

2.1. Experimental Set-Up

Batch experiments were conducted in 1.5 L reactors (17 cm diameter, 7 cm height) or 5 L reactors (17 cm diameter, 21 cm height) containing a variable volume of synthetic wastewater (0.6–3.0 L) equipped with a submerged tubular gas-permeable membrane connected to a N concentration tank containing an acidic trapping solution (Figure 1). This acidic trapping solution was recirculated using a peristaltic pump (Pumpdrive 5001, Heidolph, USA) at a constant rate of 12 L d−1. The acidic trapping solution consisted of H2SO4 1N or (NH4)2SO4 (Panreac) diluted in H2SO4 1N with an approximate concentration of 30.1–31.0 g N L−1, a variable volume of 0.077–0.384 L, and flowing inside the tubular membranes and returning to the N concentration tank to complete a closed loop. The gas-permeable membrane was made of expanded polytetrafluoroethylene (e-PTFE) (ZEUS Industrial Products Inc., Orangeburg, SC, USA) with a length of 61 cm, an outer diameter of 5.2 mm, and a wall thickness of 0.64 mm. It had an average pore size of 2.5 µm, a bubble point of 207 kPa, and a density of 0.95 g cm−3. Low-rate aeration was supplied to increase the wastewater pH using an aquarium air pump (Hailea, Aco-2201) from the bottom of the reactors through a porous stone, thus, avoiding the use of alkali chemicals according to a previous work [14]. An airflow meter (Aalborg, Orangeburg, NY, USA) was used to regulate the airflow rate at 0.24 L-air L wastewater−1 min−1. The reactors were not hermetic, having one port that allowed air to escape. The wastewater was continuously agitated using magnetic stirrers.
Synthetic wastewater was prepared to simulate livestock wastewater with a TAN concentration of approximately 3400 mg N L−1 and a carbonate alkalinity of 18 g CaCO3 L−1 [18]. To do so, amounts of 66.8 g of NH4Cl and 122 g of NaHCO3 were added per litre. The resulting average TAN and carbonate alkalinity concentrations were 3392 ± 231 mg N L−1 and 17.9 ± 1.4 g CaCO3 L−1, respectively. A nitrification inhibitor (allythiourea) was added at a concentration of 10 mg L−1 to avoid NH4+ oxidation. As the TAN was captured by the acidic trapping solution, its pH increased. Therefore, whenever the pH of the acidic solution increased up to 2, concentrated H2SO4 (96–98%, Panreac) was added to the acidic trapping solution to an endpoint of pH < 1. An ambient temperature of 23.2 ± 1.9 °C was kept throughout all the batch runs.

2.2. Experimental Design

Nine batch runs were performed under different operating conditions (Table 1) to study the influence of the following parameters on the performance of GPM technology: (1) the ratio of the initial mass of TAN in wastewater per membrane surface, (2) the ratio of wastewater volume per acidic trapping solution volume (from now on, Vww/VAS ratio), and (3) the TAN concentration of the acidic trapping solution.
First, the effect of the ratio of the initial mass of TAN in wastewater per membrane surface was investigated in Runs 1–4. Four different ratios from 197 to 936 g N m−2 were evaluated maintaining a Vww/VAS ratio constant of 7.8 and using H2SO4 1N (Merck kGaA) as the acidic trapping solution (i.e., with a TAN concentration of <0.1 g N L−1). The membrane surface was maintained constant in Runs 1–4 (0.01 m2), but a variable volume of synthetic wastewater from 0.6 to 3.0 L was used to achieve the different ratios of the initial mass of TAN wastewater per membrane surface. The volume of the acidic trapping solution was varied accordingly from 77 mL to 384 mL in order to keep the Vww/VAS ratio constant.
Secondly, the effect of the Vww/VAS ratio was studied by comparing the results obtained in Runs 1, 5, and 6. Specifically, the ratio of the initial mass of TAN in wastewater per membrane surface was kept constant while changing the Vww/VAS ratio to 7.8, 20.0, and 33.3 L L−1 in Runs 1, 5, and 6, respectively (Table 1). The TAN concentration of the acidic trapping solution was established at <0.1 g N L−1 by using H2SO4 1N. In these runs, the volume of wastewater was kept constant at 3.0 L, while varying the volume of the trapping solution from 384 mL in Run 1 to 90 mL in Run 6.
Finally, the effect of the TAN concentration of the acidic trapping solution was evaluated. Two solutions were used, a solution of H2SO4 1N (i.e., <0.1 g N L−1) in Runs 1, 2, and 3, and a solution of (NH4)2SO4 (Panreac) diluted in H2SO4 1N with an approximate concentration of 30.1–31.0 g N L−1 in Runs 7, 8, and 9. The performance of the GPM system using these two acidic trapping solutions was compared under three different ratios of the initial mass of TAN per membrane surface: high in Runs 1 and 7, medium in Runs 2 and 8, and low in Runs 3 and 9 (Table 1). In all these runs, the Vww/VAS ratio was 7.8 L L−1.
The duration of each experimental run was 7 days. In each trial, samples of 10 mL of wastewater and 3 mL of acidic trapping solution were taken daily for pH and TAN determination. The volume of acidic trapping solution was measured daily to determine the amount of water transferred through the membrane by osmotic distillation [17] for performing mass balances. Each trial was conducted in duplicate and the results were expressed as mean and standard deviations.

2.3. Analytical Method and Statistical Analysis

The pH was monitored using a pH meter Crison Basic 20 (Crison Instruments S.A., Barcelona, Spain). Analyses of TAN were conducted according to method 4500-NH3 E for TAN of Standard Methods [23].
TAN removal from the wastewater was calculated following Equation (1):
TAN removal = (TANo − TANfinal)/TANo*100
where TANo and TANfinal are the initial and final TAN concentrations in the wastewater, respectively.
The TAN recovery efficiency was equal to the TAN recovered in the acidic trapping solution divided by the TAN removed from the wastewater and multiplied by 100.
The results obtained were analyzed using one-way analysis of the variance (ANOVA) with significance at p < 0.05.

3. Results

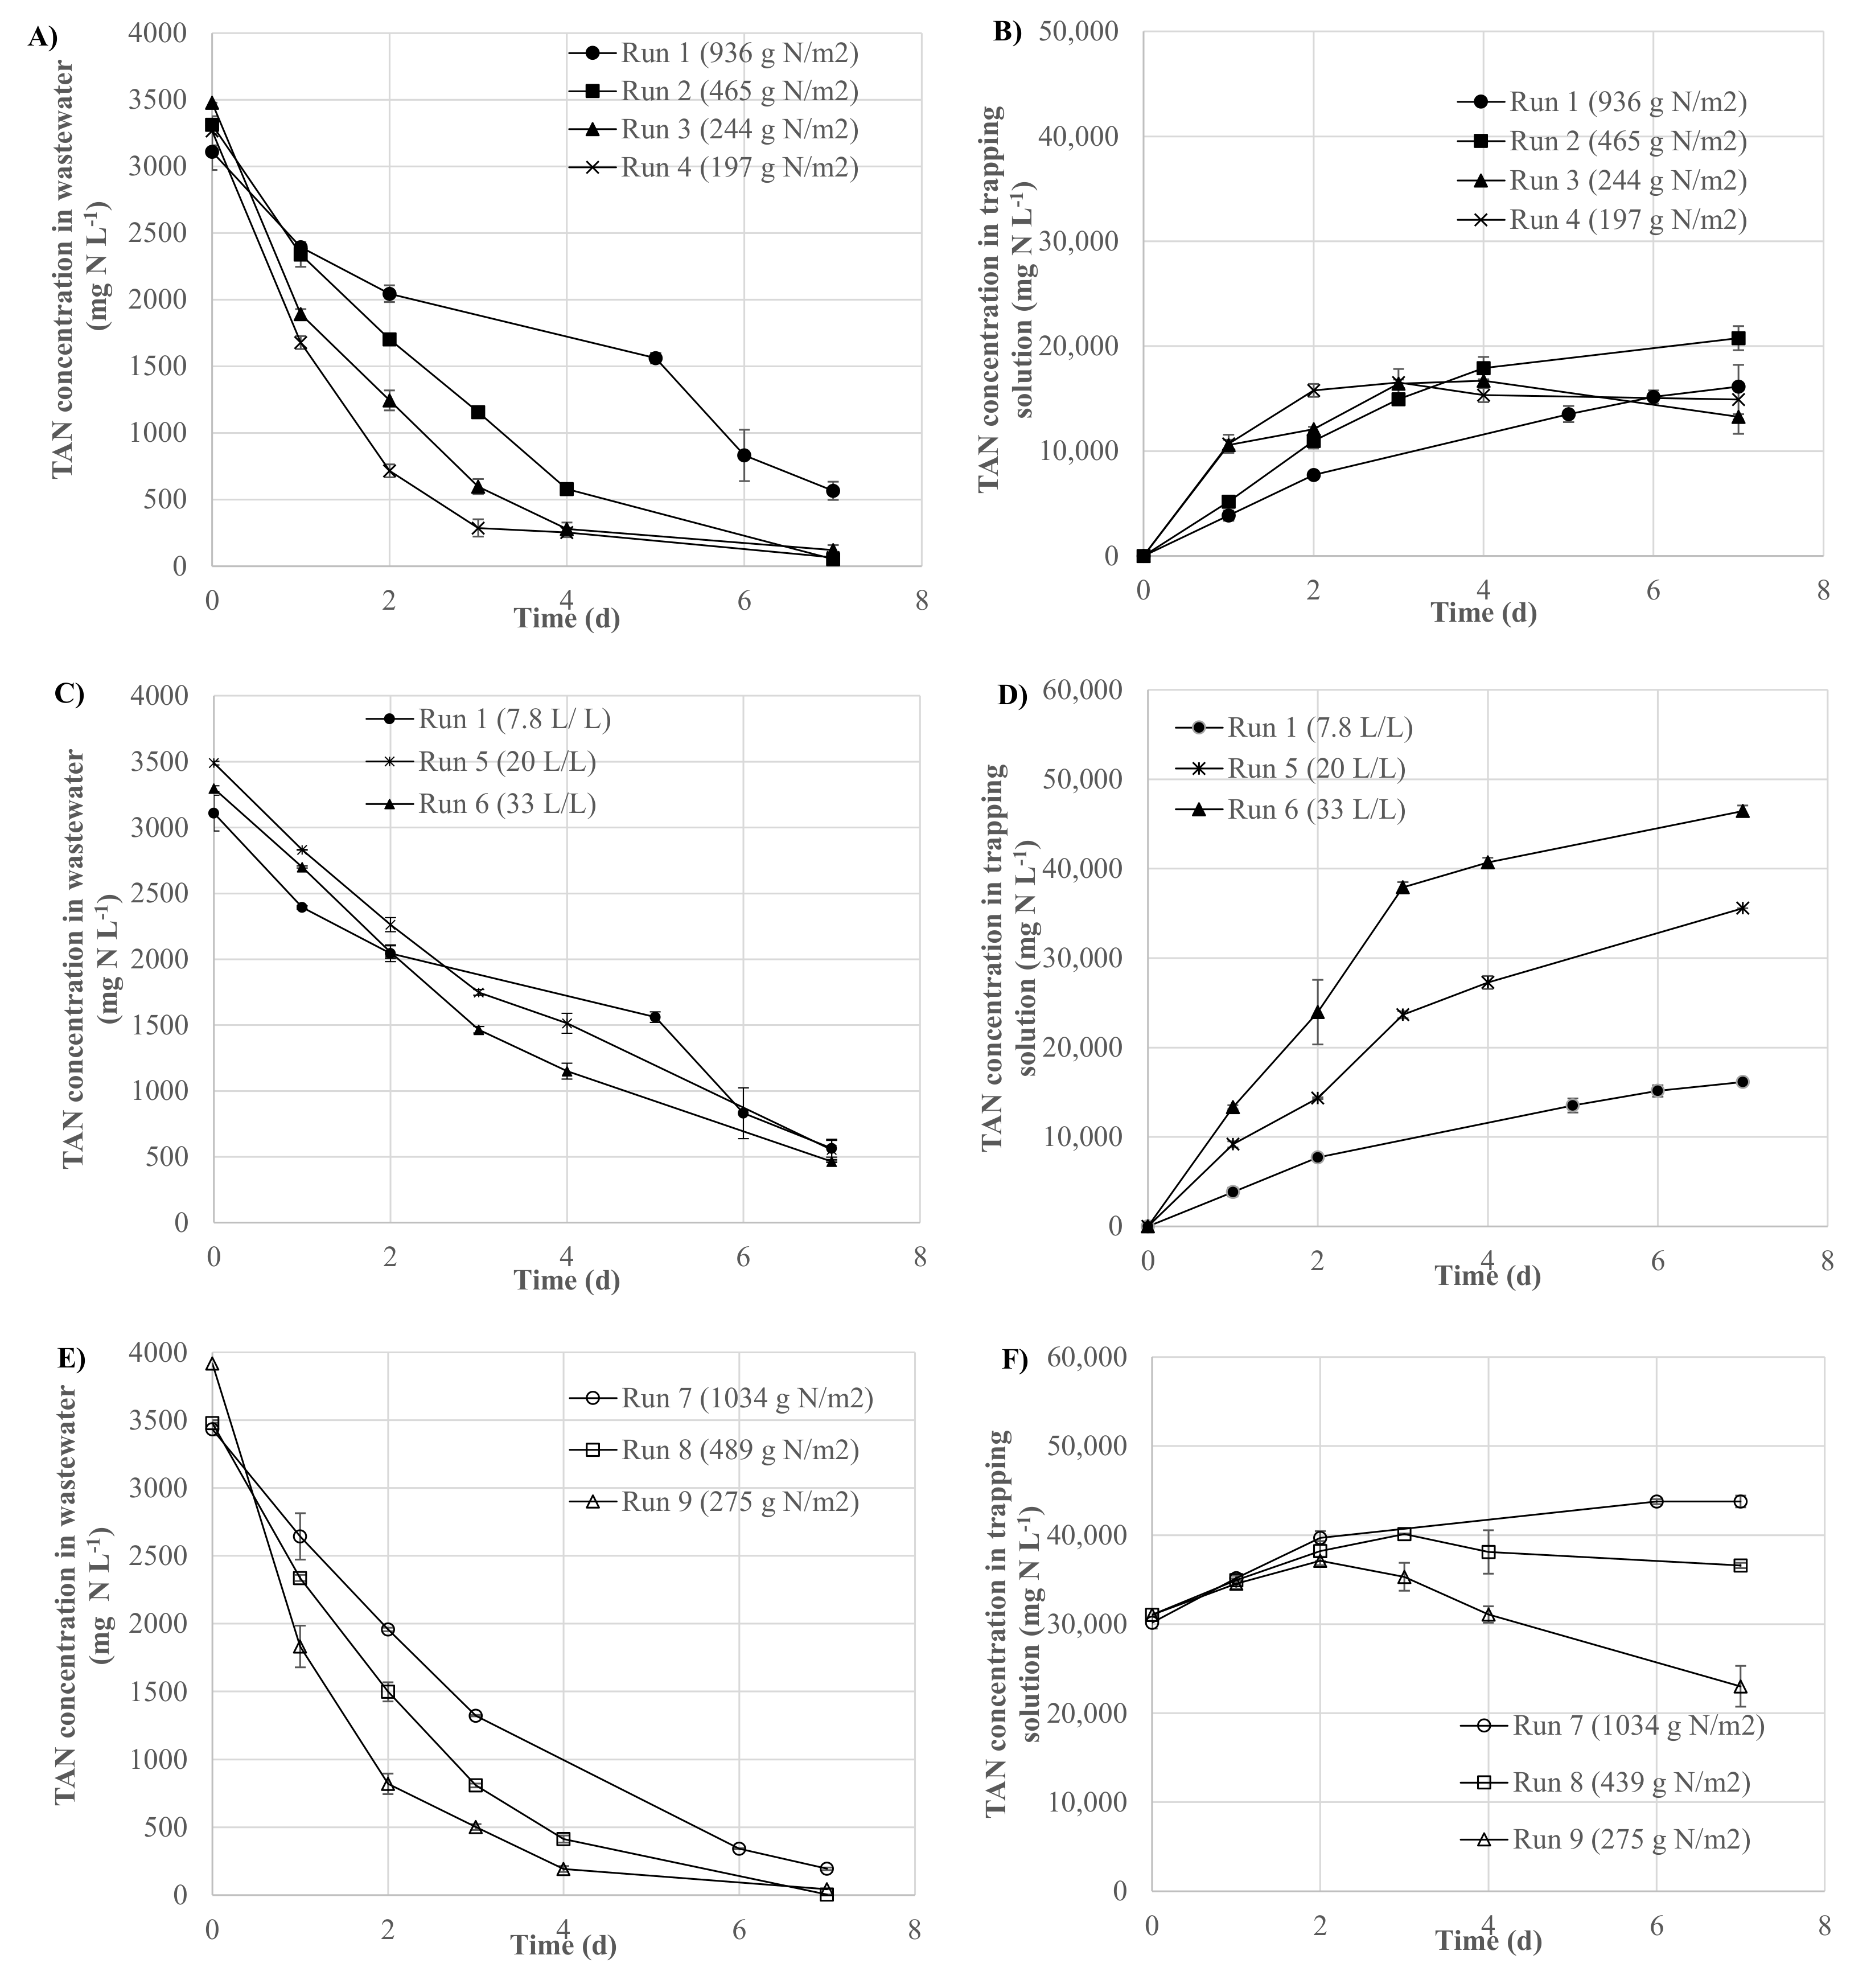
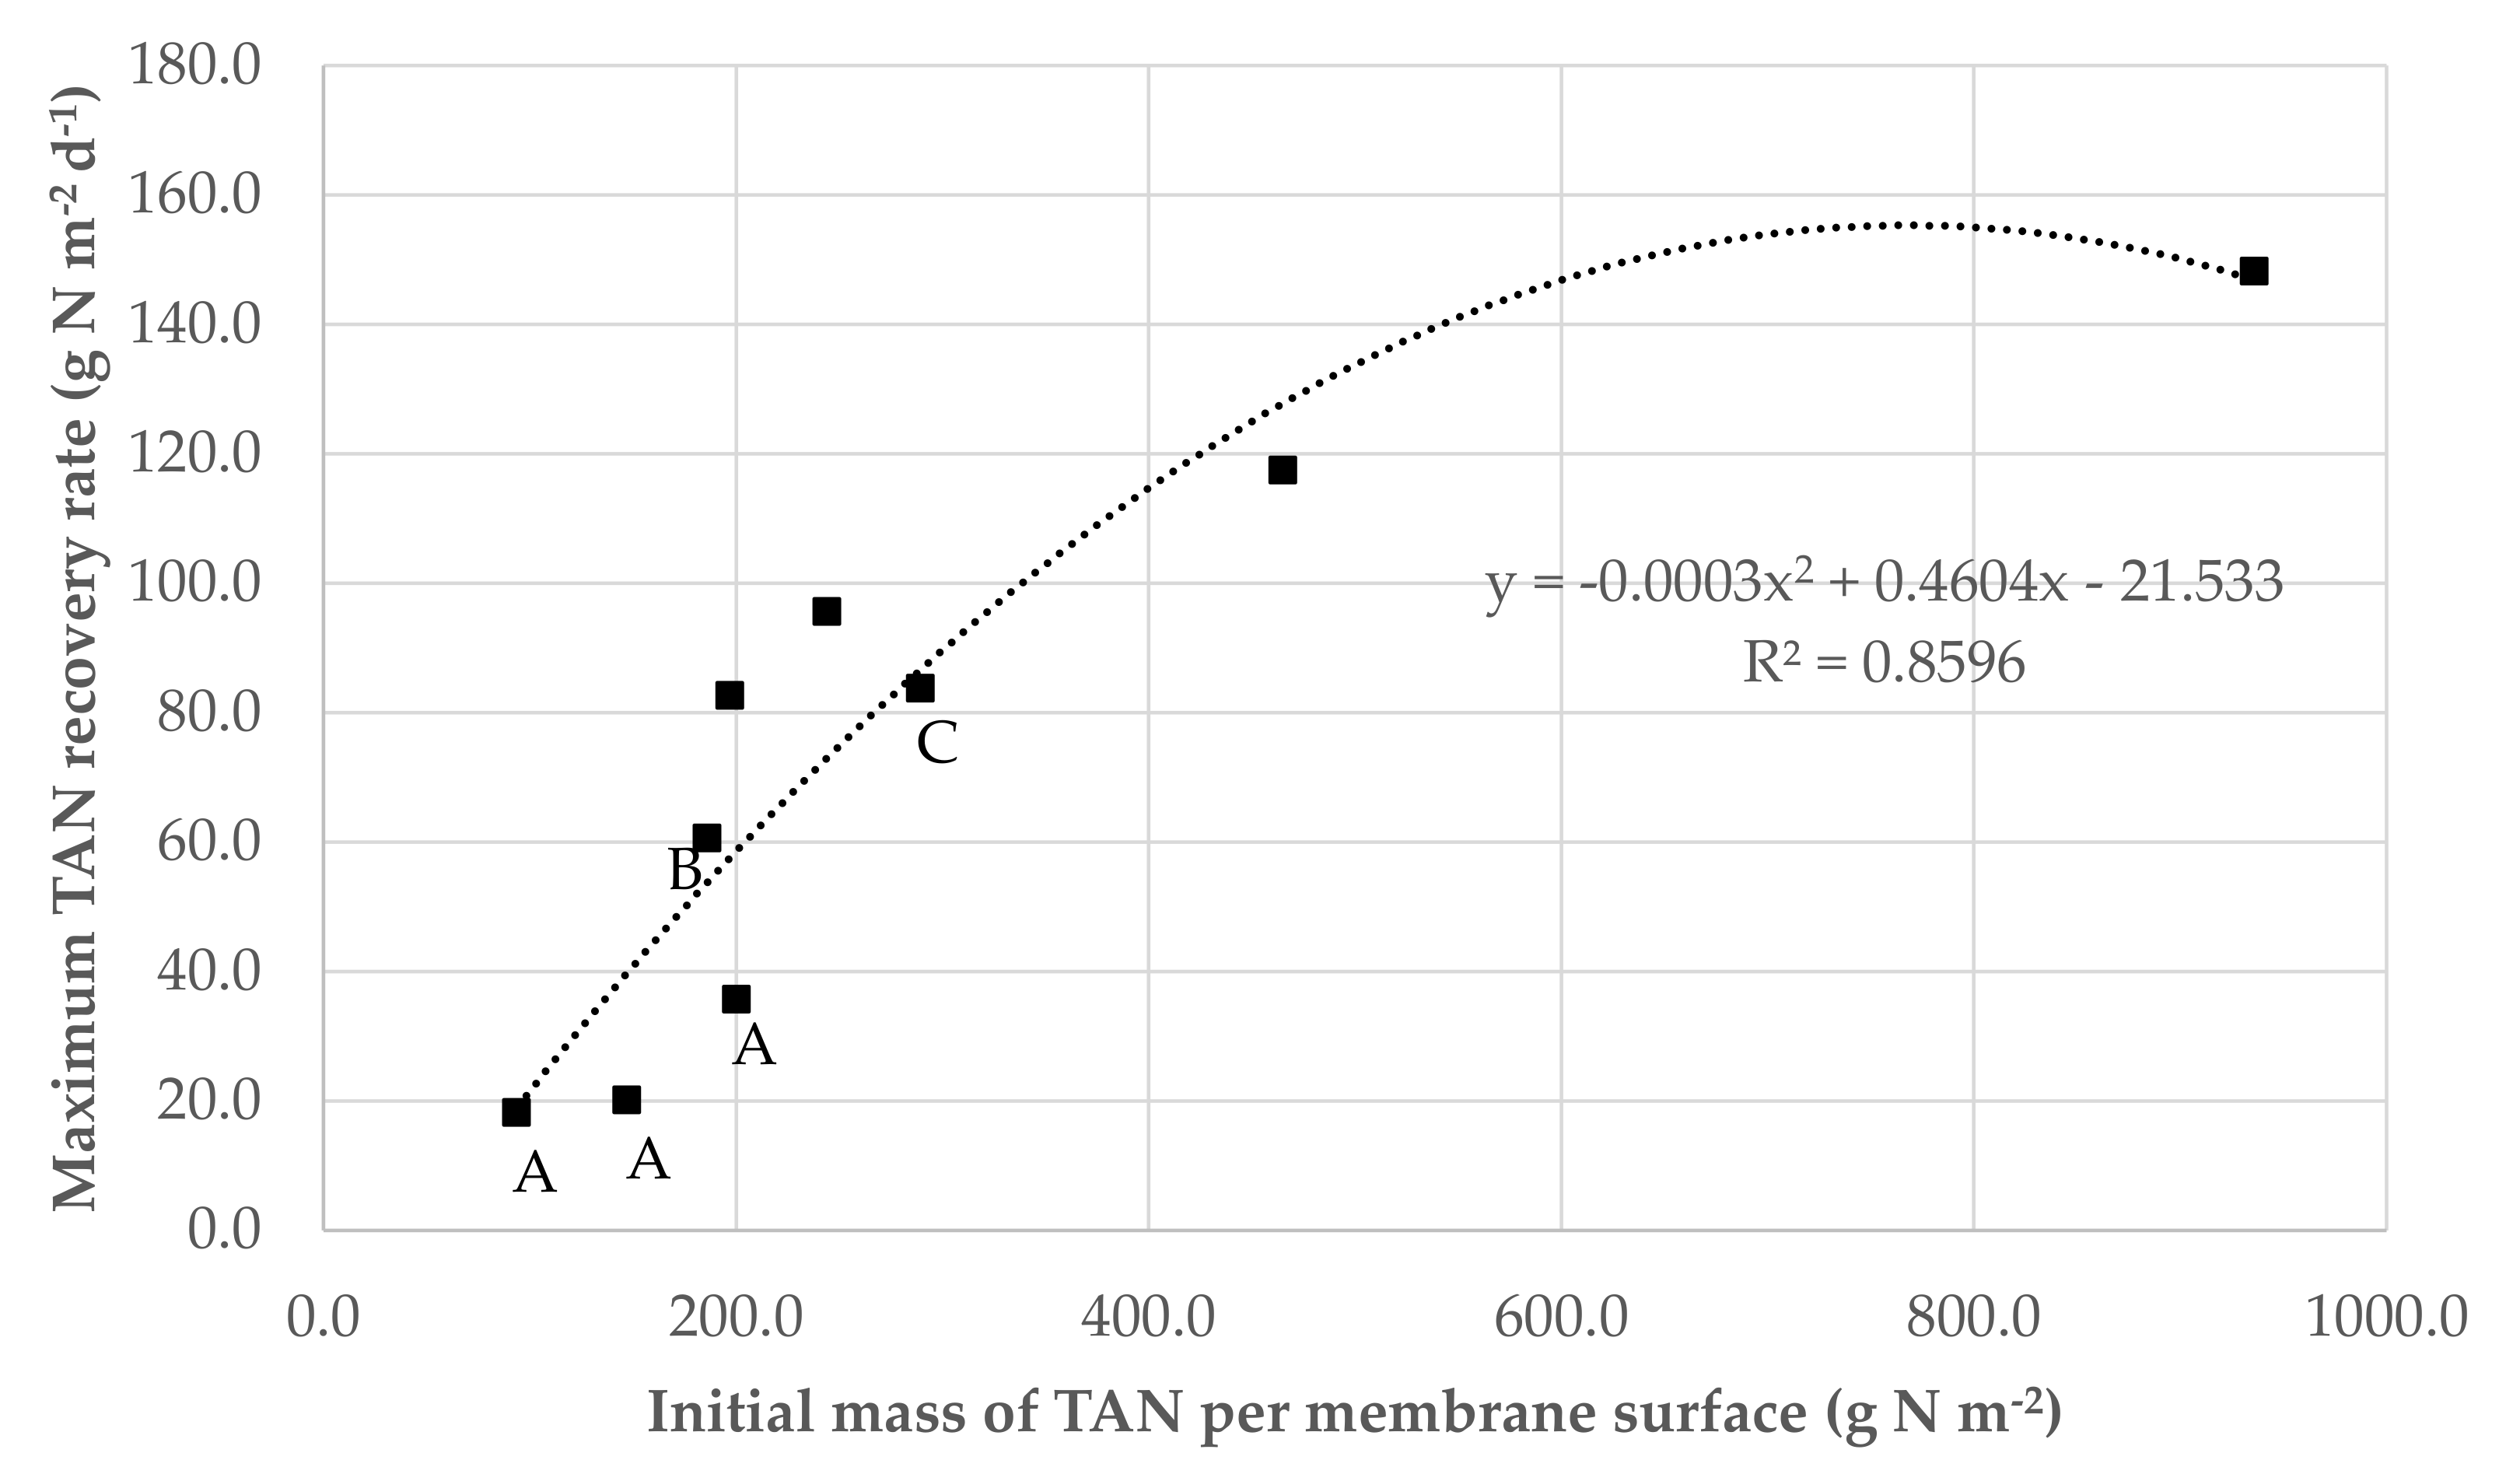
3.1. Effect of the Ratio of the Initial Mass of TAN in Wastewater Per Membrane Surface on GPM Performance

Four ratios of the initial mass of TAN in wastewater per membrane surface were evaluated in Runs 1–4 (936, 465, 244, and 197 g N m−2), as shown in Table 1. The TAN concentration in wastewater decreased from initial values of 3312, 3479, and 3267 mg N L−1 to final values of 54, 122, and 65 mg N L−1 for the ratios of 465, 244, and 197 g N m−2 in the 7 days of the experimental run, respectively (Figure 2A). Most of the TAN removal took place on the first 4 days of operation. The final TAN concentration in wastewater was higher (565 mg N L−1) for Run 1, with a ratio of the initial mass of TAN in wastewater per membrane surface of 936 g N m−2. Thus, the TAN removal efficiency in 7 days was lower when operating with the highest mass of TAN per membrane surface ratio (81.8% vs. 96.5–98.4% for the other ratios, Table 2). Therefore, a much higher surface area and/or contact time between the wastewater and the acidic trapping solution would be required for the ammonia removal in high strength wastewaters, as also concluded by Ahn et al. [11], who studied the feasibility of a membrane contactor system for ammonia removal at different initial ammonia concentrations keeping the effective surface area constant.
Regarding the recovery of ammonia in the trapping solution, the total mass of TAN recovered was more than four times higher when operating at a ratio for the mass of TAN per membrane surface of 936 g N m−2 as compared with operating at a ratio of 197 g N m−2 (Table 2). As a result, when the ratio of the initial mass of TAN in wastewater per membrane surface increased, the average TAN recovery rate, measured as the mass of TAN recovered per m2 of membrane surface per day, also increased, achieving a value of 90.5 g N m−2 d−1 for the highest ratio tested (936 g N m−2). In spite of this, a clear effect of the initial mass of TAN in wastewater per membrane surface on the final TAN concentration in the acidic trapping solution was not evidenced (Figure 2B). The maximum TAN recovery rates in each run (Table 2) are compared in Figure 3 with those reported in the literature using livestock wastewater or anaerobic digestates [14,15,24]. All used e-PTFE membranes in their experiments at batch conditions. The maximum TAN recovery rate values reported in these works are used in Figure 3 for the comparison due to the different lengths of the experiments carried out. As can be seen from Figure 3, the maximum TAN recovery rate and the ratio of the initial mass of TAN recovery per membrane surface are highly correlated (R2 = 0.8596).
Consequently, the mass balance revealed that the lowest net amount of TAN lost by volatilization was achieved when operating at the lowest ratio of the initial mass of TAN in wastewater per membrane surface (Table 2). The TAN lost was calculated by subtracting the amount of TAN recovered to the TAN removed by the GPM system. Reducing the ratio of the initial mass of TAN in wastewater per membrane surface would reduce the ammonia lost to the atmosphere, thus, improving the overall environmental performance of the GPM system. Similar findings were obtained by González-García et al. [25], who conducted a life cycle assessment of this technology. In summary, high ratios of the initial mass of TAN in wastewater per membrane surface enhanced the TAN recovery rate as a function of time. However, a higher loss of TAN per volatilization was also reported, thus, limiting the environmental performance of the GPM technology.

3.2. Effect of the Volume of Wastewater Per Volume of Acidic Trapping Solution Ratio on GPM Performance

Three different conditions were evaluated, corresponding to the volume of wastewater per volume of acidic trapping solution (Vww/VAS) ratios of 7.8, 20.0, and 33.3 L L−1, in Runs 1, 5, and 6, respectively (Table 1). As shown in Table 3, an increase in TAN removal efficiency was observed when increasing the Vww/VAS ratio from 7.8 to 33.3 L L−1. More specifically, the TAN removal efficiency increased from 81.8 to 85.9%. Similarly, the average TAN recovery rate significantly increased from 90.5 to 103.1 g N m−2 d−1. It led to an increment in the TAN recovery rate of 14% when operating with a Vww/VAS ratio of 33.3 L L−1 as compared with 7.8 L L−1. Simultaneously, the acidic trapping solution obtained after the treatment was three times more concentrated when using a ratio of 33.3 L L−1 as compared with a ratio of 7.8 L L−1 (Figure 2D). This has a positive impact on the economy of this technology, as a result of the reduction in the transportation cost of the recovered N product outside the farm. According to this result, operating with high Vww/VAS ratios is preferable to achieve an acidic trapping solution with a higher TAN concentration in a shorter operational time. This finding was in accordance with that reported by Vecino et al. [22], who used a liquid-liquid membrane contactor for ammonia recovery from an alkaline ammonia stream (pH about 12). They found that the initial volume ratio between the feed and the acidic trapping solution played an important role for ammonium salt production by membrane contactors. These authors worked with a feed tank/acid trapping tank volume ratio of 120, which was much higher than those used in the present study, obtaining an ammonium salt with up to 10% (w/w) of N.

3.3. Effect of the Initial TAN Concentration of the Acidic Trapping Solution on GPM Performance

The effect of the two initial TAN concentrations of the acidic trapping solution was evaluated: H2SO4 1N (i.e., <0.1 g N L1) and a solution of (NH4)2SO4 with a TAN concentration of 30–31 g N L1. The performance of the GPM system with these two acidic trapping solutions was compared (Table 2) using three initial masses of TAN in wastewater per membrane surface ratios: high (936 g N m2 in Run 1 and 1034 g N m2 in Run 7), medium (465 g N m2 in Run 2 and 489 g N m2 in Run 8), and low (244 g N m2 in Run 3 and 275 g N m2 in Run 9).
Different behaviors in the performance of the GPM system were observed for the different ratios of the initial mass of TAN per membrane surface tested, as shown in Table 2. For the highest ratio of the initial mass of TAN in wastewater per membrane surface, over a period of 7 days, the TAN recovery rate was the same (90.5 g N m2 day1) for Runs 1 and 7, therefore, no difference was observed when using different acidic trapping solutions. On the contrary, when operating with lower ratios of the initial mass of TAN in wastewater per membrane surface, a better performance of the GPM system in terms of TAN recovery efficiency and rate was evidenced using H2SO4 1N as an acidic trapping solution (i.e., <0.1 g N L1) as compared with the use of a solution of (NH4)2SO4 with a concentration of 31 g N L1. Specifically, for a ratio of the initial mass of TAN in wastewater per membrane surface of 489 g N m2 (Run 8), the TAN recovery efficiency was 68.7% using an acidic trapping solution with an initial TAN concentration of 31 g N L−1 as compared with the 95.5% achieved when using H2SO4 1N (Run 2). This resulted in a reduction in the TAN recovery rate of 23% (62.4 g N m2 day1 in Run 2 vs. 47.9 g N m2 day−1 in Run 8). Furthermore, for a ratio of initial mass of TAN in wastewater per membrane surface of 275 g N m2 (Run 9), the TAN recovery efficiency was drastically reduced to 25.5% as compared with 78.8% achieved when using H2SO4 1N (Run 3). This resulted in a reduction in the TAN recovery rate of 45.5% (26.5 g N m2 day1 in Run 3 vs. 9.9 g N m2 day1 in Run 9). In this manner, the results suggested a relationship between the TAN recovery rate and the TAN concentration of the acidic trapping solution, specifically when operating at medium and low ratios of mass of TAN per membrane surface. This finding concurred with those reported by Daguerre-Martini et al. [19], who studied ammonia capture from swine manure using gas-permeable membranes. After 4 days of treatment, the TAN concentration of the acidic trapping solution was up to 37,000 mg L−1. From Day 3 to Day 4, with a remaining TAN concentration in the manure of 2000 mg L−1, the ammonia removal was almost negligible and the increment in the TAN concentration in the the acidic trapping solution was also very low. Molinuevo-Salces et al. [20] evaluated the performance of a GPM system at pilot scale in a pig farm; they found a decrease in the TAN recovery rate over time as the concentration of TAN in the trapping solution increased, even with high remaining TAN concentrations (average final TAN concentration of 1.8 g N L−1) in swine manure. On the contrary, Vanotti and Szogi [9] evaluated the concentration of ammonia in the acidic trapping solution by using the same trapping solution in ten consecutive batches, treating raw swine manure with a TAN concentration of 1400 mg L−1. These authors used alkali to increase the pH to the range of 9–12, higher than that used in the present study (up to 9.2). As a result, the ammonia was recovered and concentrated in a clear solution containing 53,000 mg NH3–N L−1. This factor could significantly affect the process, as it determined that a higher TAN content in wastewater was present in the form of NH3 gas.
A reduction in the TAN recovery efficiencies concurrently with an increase in the TAN concentration of the acidic trapping solution, could have a significant effect on the process economy. In this manner, the performance of GPM technologies in batches of 4–5 days with new acidic trapping solutions would be recommended to maximize the TAN recovery rate. Therefore, a further processing phase will be needed to concentrate the ammonium sulphate if higher concentrations are desired, and therefore, to decrease the transportation cost of exporting this fertilizer over long distances.

4. Conclusions

The present study highlights the importance of adjusting the surface of the membrane to the initial TAN concentration in wastewater in order to maximize the N recovery and to reduce the NH3 losses by volatilization in GPM technology. This work demonstrates that operating with a ratio of 197 g TAN per m2 of membrane surface allows N losses to be reduced by 71% as compared with the operating at 936 g TAN per m2. In addition, the ratio of the volume of wastewater per volume of acidic trapping solution also plays an important role in the performance of GPM technology. High ratios of the volume of wastewater per volume of acidic trapping solution lead to higher N concentrations in the produced ammonium salt solution, which would further reduce the transport and processing operation for land application. Finally, the initial TAN concentration of the acidic trapping solution determines the achieved TAN recovery rates, especially at lower ratios of the initial mass of TAN in wastewater per membrane surface. In this vein, frequent changes in acidic solution are recommended to maximize the TAN recovery rate using a GPM system.

Author Contributions

Conceptualization, B.R.; methodology, B.R.; formal analysis, B.R.; investigation, B.R. and B.M.-S.; data curation, B.R. and B.M.-S.; writing—original draft preparation, B.R.; writing—review and editing, B.M.-S., M.B.V. and M.C.G.-G.; project administration, M.C.G.-G.; funding acquisition, M.C.G.-G. All authors have read and agreed to the published version of the manuscript.

Funding

This research was funded by the Spanish National Institute for Agricultural and Food Research and Technology (INIA) and co-financed with FEDER funds (Project PID2019-106148RR-C41) and the EU Program INTERREG V-A Spain—Portugal (POCTEP) 2014–2020 (Project 0745_SYMBIOSIS_II_3_E). B. Molinuevo-Salces thanks the AEI for the financial support through the grant RYC-2020-029030-I/AEI/10.13039/501100011033. Mention of trade names or commercial products in this article is solely for the purpose of providing specific information and does not imply recommendation or endorsement by the U.S. Department of Agriculture.

Institutional Review Board Statement

Not applicable.

Informed Consent Statement

Not applicable.

Conflicts of Interest

The authors declare no conflict of interest.

References

  1. European Environment Agency (EEA). Agriculture, Ammonia Emissions Statistics—Data Extracted in June 2015. Available online: http://ec.europa.eu/eurostat/statistics-explained/index.php/Agriculture_-_ammonia_emission_statistics (accessed on 30 June 2017).
  2. Webb, J.; Menzi, H.; Pain, B.F.; Misselbrook, T.H.; Dämmgen, U.; Hendriks, H.; Döhler, H. Managing ammonia emissions from livestock production in Europe. Environ. Pollut. 2005, 135, 399–406. [Google Scholar] [CrossRef]
  3. Wing, S.; Wolf, S. Intensive livestock operations, health, and quality of life among eastern North Carolina residents. Environ. Health. Perspect. 2000, 108, 233–238. [Google Scholar] [CrossRef]
  4. Munasinghe-Arachchige, S.P.; Cooke, P.; Nirmalakhandan, N. Recovery of nitrogen-fertilizer from centrate of anaerobically digested sewage sludge via gas-permeable membrane. J. Water Process Eng. 2020, 38, 101630. [Google Scholar] [CrossRef]
  5. Bonmatí, A.; Flotats, X. Air stripping of ammonia from pig slurry: Characterization and feasibility as a pre-or post-treatment to mesophilic anaerobic digestion. Waste Manag. 2003, 23, 261–272. [Google Scholar] [CrossRef]
  6. Masse, L.; Massé, D.I.; Pellerin, Y.; Dubreuil, J. Osmotic pressure and substrate resistance during the concentration of manure nutrients by reverse osmosis membranes. J. Membr. Sci. 2010, 348, 28–33. [Google Scholar] [CrossRef]
  7. Milan, Z.; Sánchez, E.; Weiland, P.; de Las Pozas, C.; Borja, R.; Mayari, R.; Rovirosa, N. Ammonia removal from anaerobically treated piggery manure by ion exchange in columns packed with homoionic zeolites. Chem. Eng. J. 1997, 66, 65–71. [Google Scholar] [CrossRef]
  8. Uludag-Demirer, S.; Demirer, G.N.; Chen, S. Ammonia removal from anaerobically digested dairy manure by struvite precipitation. Process Biochem. 2005, 40, 3667–3674. [Google Scholar] [CrossRef]
  9. Vanotti, M.B.; Szogi, A.A. Systems and Methods for Reducing Ammonia Emissions from Liquid Effluents and for Recovering the Ammonia. U.S. Patent 9,005,333 B1, 14 April 2015. [Google Scholar]
  10. Munasinghe-Arachchige, S.P.; Nirmalakhandan, N. Nitrogen-fertilizer recovery from the centrate of anaerobically digested sludge. Environ. Sci. Technol. Lett. 2020, 7, 450–459. [Google Scholar] [CrossRef]
  11. Ahn, Y.T.; Hwang, Y.H.; Shin, H.S. Application of PTFE membrane for ammonia removal in a membrane contactor. Water Sci. Technol. 2011, 63, 2944–2948. [Google Scholar] [CrossRef]
  12. Samani Majd, A.M.; Mukhtar, S. Ammonia diffusion and capture into a tubular gas-permeable membrane using diluted acids. Trans. ASABE 2013, 56, 1943–1950. [Google Scholar]
  13. Dube, P.J.; Vanotti, M.B.; Szogi, A.A.; Garcia-González, M.C. Enhancing recovery of ammonia from swine manure anaerobic digester effluent using gas-permeable membrane technology. Waste Manag. 2016, 49, 372–377. [Google Scholar] [CrossRef] [PubMed] [Green Version]
  14. García-González, M.C.; Vanotti, M.B.; Szogi, A.A. Recovery of ammonia from swine manure using gas-permeable membranes: Effect of aeration. J. Environ. Manag. 2015, 152, 19–26. [Google Scholar] [CrossRef] [PubMed]
  15. García-González, M.C.; Vanotti, M.B. Recovery of ammonia from swine manure using gas-permeable membranes: Effect of waste strength and pH. Waste Manag. 2015, 38, 455–461. [Google Scholar] [CrossRef]
  16. Oliveira Filho, J.D.S.; Daguerre-Martini, S.; Vanotti, M.B.; Saez-Tovar, J.; Rosal, A.; Pérez-Murcia, M.D.; Bustamante, M.A.; Moral, R. Recovery of ammonia in raw and co-digested swine manure using gas-permeable membrane technology. Front. Sustain. Food Syst. 2018, 2, 30. [Google Scholar] [CrossRef] [Green Version]
  17. Riaño, B.; Molinuevo-Salces, B.; Vanotti, M.; García-González, M.C. Application of gas-permeable membranes for-semi- continuous ammonia recovery from swine manure. Environments 2019, 6, 32. [Google Scholar] [CrossRef] [Green Version]
  18. García-González, M.C.; Riaño-Irazábal, B.; Molinuevo-Salces, B.; Hernández-González, D. Influencia del caudal de recirculación de la solución ácida en la captura de NH3 mediante la tecnología de membranas permeables a los gases. In Proceedings of the VI Jornadas de la Red Española de Compostaje, Valencia, Spain, 14–16 November 2018. [Google Scholar]
  19. Daguerre-Martini, S.; Vanotti, M.B.; Rodriguez-Pastor, M.; Rosal, A.; Moral, R. Nitrogen recovery from wastewater using gas-permeable membranes: Impact of inorganic carbon content and natural organic matter. Water Res. 2018, 137, 201–210. [Google Scholar] [CrossRef] [PubMed] [Green Version]
  20. Molinuevo-Salces, B.; Riaño, B.; Vanotti, M.B.; Hernández-González, D.; García–González, M.C. Pilot-scale demonstration of membrane-based nitrogen recovery from swine manure. Membranes 2020, 10, 270. [Google Scholar] [CrossRef]
  21. Riaño, B.; Molinuevo-Salces, B.; Vanotti, M.B.; García-González, M.C. Ammonia recovery from digestate using gas-permeable membranes: A pilot-scale study. Environments 2021, 8, 133. [Google Scholar] [CrossRef]
  22. Vecino, X.; Reig, M.; Gibert, O.; Valderrama, C.; Cortina, J.L. Integration of liquid-liquid membrane contactors and electrodialysis for ammonium recovery and concentration as liquid fertilizer. Chemosphere 2020, 245, 125606. [Google Scholar] [CrossRef]
  23. American Public Health Association. Standard Methods for the Examination of Water, Waste Water APHA, 21st ed.; American Water Works Association and Water Environment Federation: Denver, CO, USA; American Public Health Association: Washington, DC, USA, 2005. [Google Scholar]
  24. García-González, M.C.; Vanotti, M.B.; Szogi, A.A. Recovery of ammonia from anaerobically digested manure using gas-permeable membranes. Sci. Agric. 2016, 73, 434–438. [Google Scholar] [CrossRef] [Green Version]
  25. González-García, I.; Riaño, B.; Cuéllar-Franca, R.M.; Molinuevo-Salces, B.; García-González, M.C. Environmental sustainability performance of a membrane-based technology for livestock wastewater treatment with nutrient recovery. J. Environ. Chem. Eng. 2022, 10, 107246. [Google Scholar] [CrossRef]
Figure 1. Schematic showing the experimental set-up.
Environments 09 00070 g001
Figure 2. Variation of TAN concentrations in the synthetic wastewater and in the acidic trapping solution for the nine experiments performed: (A) Evolution of TAN concentration in wastewater for Runs 1–4; (B) Evolution of TAN concentration in the acidic trapping solution in Runs 1–4; (C) Evolution of TAN concentration in wastewater for Runs 1, 5 and 6; (D) Evolution of TAN concentration in the acidic trapping solution in Runs 1, 5 and 6; (E) Evolution of TAN concentration in wastewater for Runs 7–9 and (F) Evolution of TAN concentration in the acidic trapping solution in Runs 7–9.
Environments 09 00070 g002
Figure 3. Maximum recovery rates in the literature studies and in the present study using GPM technology for N recovery vs. the ratio of initial mass of TAN in wastewater per membrane surface. A second order equation and R2 are represented: (A) García-González and Vanotti [15]; (B) García-González et al. [14]; (C) García-González et al. [24]. Values of the present study are presented as symbols without letters.
Environments 09 00070 g003
Table 1. Operating conditions for the batch runs carried out.
Runs *Volume of Wastewater (L)Volume of Acidic Trapping Solution (L)Initial Mass of TAN in Wastewater Per Membrane Surface
(g N m−2)
Volume of wastewater Per Volume of Acidic Trapping Solution
(L L−1)
Initial TAN Concentration in the Trapping Solution
(g N L−1)
13.00.384936 ± 827.8<0.1
21.40.180465 ± 77.8<0.1
30.70.090244 ± 07.8<0.1
40.60.077197 ± 137.8<0.1
53.00.1501051 ± 920.0<0.1
63.00.090992 ± 1333.3<0.1
73.00.3841034 ± 287.830.2 ± 0.6
81.40.180489 ± 67.831.0 ± 0.0
90.70.090275 ± 07.831.0 ± 0.0
* Membrane surface was 0.01 m2 in all runs. TAN concentration in wastewater was 3392 ± 231 mg N L−1 in all runs.
Table 2. Mass balance of the recovery of ammonia using gas-permeable membrane for Runs 1–4 (effect of initial mass of TAN in wastewater per membrane surface) and Runs 7–8 (effect of TAN concentration in the acidic trapping solution).
Run *Initial Mass of TAN in Wastewater per Membrane Surface (g N m−2)TAN Concentration in the Trapping Solution
(g N L−1)
Initial TAN (mg)TAN Removed (mg)TAN Recovered in the Trapping Solution (mg) **TAN Lost by Volatilization (mg)TAN Removal Efficiency (%)TAN Recovery Efficiency (%)Maximum TAN Recovery Rate (g N m−2 d−1)Average TAN Recovery Rate
(g N m−2 d−1)
1936 ± 82<0.19329 ± 8217634 ± 2056315 ± 451319 ± 45681.8 ± 2.882.7 ± 5.1148.5 ± 18.890.5 ± 0.7
2465 ± 7<0.14637 ± 684562 ± 244356 ± 297206 ± 20998.4 ± 0.595.5 ± 4.7117.5 ± 12.662.4 ± 4.3
3244 ± 0<0.12435 ± 02350 ± 521851 ± 51499 ± 10396.5 ± 2.178.8 ± 3.995.6 ± 4.526.5 ± 0.7
4197 ± 13<0.11960 ± 1311921 ± 451534 ± 32387 ± 12298.0 ± 1.979.9 ± 5.482.6 ± 6.722.0 ± 0.5
71034 ± 2830.2 ± 0.610,101 ± 2809719 ± 1116314 ± 2073404 ± 13094.3 ± 0.765.0 ± 0.1210.0 ± 35.190.5 ± 3.0
8489 ± 631.0 ± 0.04869 ± 594864 ± 303339 ± 41524 ± 6399.9 ± 0.068.7 ± 0.9121.2 ± 41.947.9 ± 0.1
9275 ± 031.0 ± 0.02742 ± 02711 ± 0691± 5692020 ± 56998.9 ± 0.025.5 ± 21.041.9 ± 19.29.9 ± 8.2
* Membrane surface was 0.01 m2 in all runs. TAN concentration in wastewater (3392 ± 231 mg N L−1) and the volume of wastewater per volume of trapping solution (7.8 L L−1) was the same in all runs. ** TAN recovered did not include the initial amount of TAN in the acidic trapping solution.
Table 3. Mass balance of the recovery of ammonia using gas-permeable membrane for Runs 1, 5, and 6 (effect of the volume of wastewater per volume of acidic trapping solution).
Run *Volume of Wastewater per Volume of Acidic Trapping Solution (L L−1)Initial TAN (mg)TAN Removed (mg)TAN Recovered in the Trapping Solution (mg)TAN Lost by Volatilization (mg)TAN Removal Efficiency (%)TAN Recovery Efficiency (%)Maximum TAN Recovery Rate
(g N m−2 d−1)
Average TAN Recovery Rate
(g N m−2 d−1)
17.89329 ± 8217634 ± 2056315 ± 451319 ± 45681.8 ± 2.882.7 ± 5.1148.5 ± 18.890.5 ± 0.7
520.010,469 ± 88811 ± 316724 ± 1532087 ± 37384.2 ± 4.376.3 ± 2.8163.6 ± 10.896.4 ± 1.1
633.39887 ± 1298497 ± 227193 ± 581305 ± 4385.9 ± 0.184.6 ± 0.3185.4 ± 89.3103.1 ± 0.8
* Membrane surface was 0.01 m2 in all runs. TAN concentration in wastewater (3392 ± 231 mg N L−1) and the volume of wastewater (3.0 L) was constant for all runs. The initial mass of TAN in wastewater per membrane surface ratio was in the same range for all runs (936 g N m−2 in Run 1, 992 g N m−2 in Run 5, and 1034 g N m−2 in Run 6).
Publisher’s Note: MDPI stays neutral with regard to jurisdictional claims in published maps and institutional affiliations.

