Abstract
The extracellular matrix (ECM) is a highly complex macromolecular network present in all tissues and organs. The ECM is continuously remodelling under an orchestrated process facilitated by many matrix-degrading and matrix-synthesising enzymes in both health and disease. Disturbance of this balance can be the result of or can lead to various diseases. In cardiovascular diseases (CVDs), changes to the ECM are evident in conditions including: atherosclerosis, myocardial infarction (MI), venous thromboembolism (VTE) and abdominal aortic aneurysm (AAA). ECM proteins and ECM regulating enzymes are differently expressed in various CVDs. Most importantly, the altered deposition, macromolecule arrangement and activity of the ECM makes it an attractive marker of disease onset, pathogenesis and progression. Many medical imaging modalities allow disease assessment by exploiting native image contrast, by using non-targeted or by using protein or cell specific (targeted) imaging probes. However, the ability to directly visualise and quantify changes in specific ECM proteins enhances our understanding of the biological role of these proteins, enables monitoring of disease progression and response to treatment and may improve patient diagnosis and allocation of personalised therapies. This review focuses on the biochemistry of the major extracellular matrix proteins and advancements in the development of ECM-targeted probes for molecular imaging of CVD, particularly for applications of molecular magnetic resonance imaging (MRI) and position emission tomography (PET) imaging.
1. Introduction
The extracellular matrix (ECM) plays a key role in multicellular organism development [1]. Previously, it was believed that the ECM was an inert component that solely served to provide mechanical stability, but today, it is viewed as a highly dynamic system that undergoes constant remodelling with post-translational modifications of its molecular components [2,3]. The ECM is found within all tissues and organs and acts not only as a framework for cellular organelles but also has a crucial signal transduction role in both healthy and diseased tissues [2,4]. The composition of the ECM is tissue specific and heterogeneous and its unique structure is formed early during tissue development. The ECM is comprised of many macromolecules that can be categorised into two key groups: fibre-forming and non-fibre-forming molecules. As the ECM is a highly organised ensemble of different macromolecules, even small changes to each subunit can have detrimental effects on the macromolecules’ physiochemical properties and thus the properties of the tissue and the cellular phenotypes, ultimately resulting in functional changes [3].
It is possible to identify changes in the ECM during disease. However, it is vital to distinguish between ECM changes causing disease and ECM changes that occur as a result of disease progression [3]. During the early stages of development and in response to injury, the remodelling rate of the ECM is increased and involves various molecules, including but not exclusively limited to, integrins and matrix metalloproteins (MMPs) [5] and also changes of intra- or extracellular tension forces [5]. There is an extensive list of diseases that involve disturbances of the ECM including: connective tissue disorders, genetic disorders, liver cirrhosis, inflammatory bowel disease, chronic kidney disease and several cardiovascular diseases [3,6]. In cardiovascular diseases, preserving ECM integrity by reducing excess fibrosis or inhibiting degradation is a critical target of both treatment and prevention strategies [7]. Given the critical role of the extracellular matrix in both physiological homeostasis and pathological compensatory processes, the ECM has become an attractive new target for molecular imaging with applications in numerous diseases.
The ECM can be imaged using both invasive (including tissue staining methods, nonlinear optic microscopy, electron microscopy and fluorescence life time imaging [8,9,10]) and non-invasive including [MRI (magnetic resonance imaging), PET (positron emission tomography) and CT (computed tomography)] imaging methods. There are several review articles that provide extensive coverage of the use of these imaging modalities in the context of imaging cardiac ECM [11,12]. The major limitation with invasive imaging methods is that clinical translation can be limited due to the general use of ex vivo tissue specimens requiring biopsies obtained by specialised surgical procedures and are therefore not readily available. Non-invasive imaging methods overcome this limitation as they provide in vivo imaging which can be applied safely to the patient. This review aims to address the latest developments in the field of non-invasive imaging of ECM changes that are associated with CVD. Whilst we briefly mention other imaging modalities, the scope and focus of this review is on MRI and PET applications. The review also provides a summary of the basic components that comprise the ECM and their biosynthetic pathways that enable a better understanding of the development of targeted probes for imaging of the ECM.
2. Understanding the Key Extracellular Matrix Proteins
2.1. ECM Synthesis
The ECM is a complex, heterogenous collection of different molecules. Over the last two decades intensive research into ECM proteins has generated new insights into ECM composition and function in both healthy and diseased tissues [13]. The exact number of ECM proteins remains an open question and is an active area of research; however, it is estimated that there are between 300–400 ECM genes, with a third of them still to be identified [14]. ECM components are commonly categorised into two groups: fibre-forming and non-fibre-forming molecules [3]. The typical fibre-forming molecules include specific classes of collagen and elastin and the non-fibre-forming molecules include proteoglycans and glycoproteins (Figure 1). It is paramount to have a tight regulation between the molecules signalling ECM synthesis and degradation as this is essential for maintaining the structural integrity and thereby the tissue and organ functions.
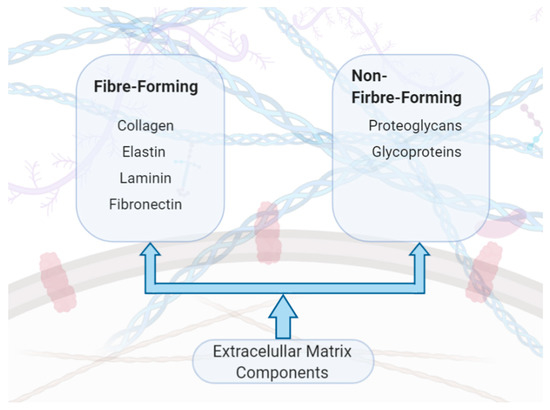
Figure 1.
Components of the extracellular matrix (ECM).
ECM proteins are located within these two basic compartments (Figure 2): (i) interstitial connective tissue, that surrounds cells providing a structural matrix for the tissues and (ii) specialised basement membrane that separates the epithelium and the stroma and is involved in the matrix-cell interactions [15]. These two compartments of the ECM are characterised by different components with the interstitial matrix comprised of molecules, including type I collagen, fibronectin, proteoglycans (PGs), glycosaminoglycans (GAGs), tenascin C and elastin, whereas the basement membrane is comprised of type IV collagen, laminins and nidogen. Dysregulated ECM composition either because of excessive ECM production and/or increased degradation is observed in various diseases including cardiac, lung, liver, cancer, deep vein thrombosis and osteoarthritis [15]. A summary of these common ECM components with respective functions are provided in Table 1.
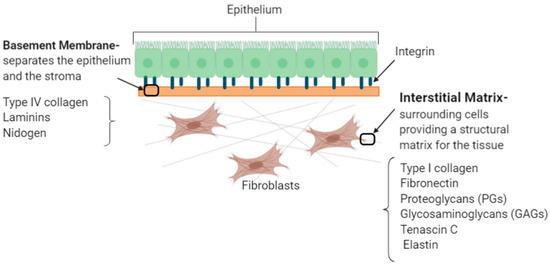
Figure 2.
The two basic compartments of the extracellular matrix.

Table 1.
Summary of common ECM components with their respective functions. The components have been categorised into structural ECM proteins (green); adhesion proteins (orange); glycosaminoglycans and proteoglycans (blue).
Understanding the underlying biosynthesis and assembly of the ECM proteins is essential for various disciplines, including the development of molecular imaging probes and drugs, tissue engineering and regenerative medicine. The turnover of ECM proteins is regulated by various cell types, including fibroblasts, mast cells and macrophages, growth factors such as the transforming growth factor-βs (TGF-βs) and enzymes including matrix metalloproteases (MMPs). In the late 1980s, it was first shown that TGF-β has the ability to control synthesis of ECM proteins [24,25]. Subsequently, in 1986, Robert et al. demonstrated that injecting TGF-β in new-born mice activated the rough endoplasmic reticulum (RER) of fibroblasts stimulating the production of extracellular collagen fibres [24,25]. The pro-fibrotic effect of TGF-β is complemented with its ability to inhibit the proteolytic degradation of ECM proteins [25] by increasing the production of tissue inhibitors of matrix metalloproteases (TIMPs) [26]. MMPs are a class of enzymes that have been studied since 1962 with 23 human MMPs identified to date [15]. MMPs are categorised into six groups including collagenases and gelatinases, based on their structure and enzymatic substrates [27]. MMPs are secreted as inactive pro-enzymes, pro-MMPs, and are activated by proteolytic degradation of the amino terminals exposing the Zinc ion (Zn2+) binding pocket of the catalytic domain [28]. Activated MMPs cleave at specific sites, and therefore, breakdown the ECM scaffold or they can modify bioactive molecules that exist within the ECM proteins [27]. The activity of MMPs is counterbalanced by TIMPs that block the activation pathway and hence inhibit MMPs binding to ECM substrates. There are four members in the TIMPs family, TIMP1-4. The ratio of MMP to TIMP determines the overall ECM degradation. A disease example that illustrates the importance of ECM homeostasis is cardiomyopathy, where increased levels of MMP-1 reduce collagen content and thus reduced cardiac contractility [29]. The increased overexpression of MMP-1 is associated with an increased ratio of MMP-1/TIPM-1 in dilated cardiomyopathy [30]. In vessel wall development and remodelling, MMPs also have an inflammatory mediated function, similar to cytokines, as they are actively expressed in diseased tissue but absent or expressed at very low levels in healthy tissue [27]. In vascular tissues inflammatory cells, including macrophages and neutrophils, are important sources of MMPs [27]. Tissue injury or pathologic conditions can also lead to excessive production and accumulation of ECM proteins, ultimately leading to fibrosis [15]. Fibrosis is the body’s natural response mechanism to injury whereby a scar is formed as part of the wound healing process. However, if the tissue properties within the scar region are not the same as the native surrounding tissue, it can lead to organ failure, such as liver cirrhosis [1] and heart failure [31]. The fibrotic response is driven by a variety of cell types, growth factors and cytokines and can be inhibited by signalling mediators such as interferon- γ (IFN-γ), an antagonist to TGFβ [15].
2.2. Collagen
Collagen comprises about one third of the total protein content in the human body [1]. Collagen is a large family of molecules with more than 28 different types of collagen identified to date [32]. All collagens have the same fundamental characteristic; a protein comprised of three polypeptide chains that has at least one repeating amino acid sequence [32]. The most abundant fibrillar collagen, type I, is composed of well organised fibrils that provide tensile strength and resistance to deformation and stress to the ECM and is found in various tissues including the skin, the vasculature, the heart tissue and bones [33]. Type I collagen is formed by two types of α helices; specifically, [α1(I)]2α2(I), thus forming a triple helix consisting of two α1(I) and one α2(I) helix [34]. Other types of collagen include; type II found mainly in cartilage; type III found in the skin, muscle and blood vessels and type IV found in all basement membranes [35].
All collagens are characterised by the repeat sequence of: GLY-X-Y, where GLY is glycine, X is often proline and Y is often hydroxyproline [36,37]. The precursor molecule of collagen is procollagen, a glycoprotein that consists of three extended polypeptide chains and is believed to have a stiff structure with flexible short end regions [37]. The synthesis of collagen initiates in the nucleus where the DNA is transcribed into mRNA that is then translated in the rough endoplasmic reticulum (RER), synthesising collagen α-chains (Figure 3). These molecules are transported to the Golgi apparatus where post-translational modifications generate the self-assembled triple helical procollagen structure that is then secreted to the extracellular space [37]. During this exocytosis, procollagen is converted into tropocollagen, by the proteolytic cleavage of the C- and N-terminus propeptides of the procollagen molecule [38]. Collagen fibres are assembled by a process called fibrillogenesis [32] through a variety of cross-linking mechanisms. Three key cross-liking mechanisms occur in vivo: lysyl oxidase crosslinking, sugar mediated and transglutaminase crosslinking [38]. Lysyl Oxidase (LOX), a copper-dependent enzyme, specifically crosslinks collagen and elastin [39] creating intramolecular bonds by catalysing the deamination of lysine to allysine and hydroxylysine to hydroxyallysine (Figure 3). The allysine aldehyde product subsequently undergoes spontaneous aldol condensation resulting in crosslinks between the fibrils. Alternatively, Schiff base crosslinks are formed as the aldehyde groups react with the amino groups of lysine and hydroxylysine residues on adjacent molecules [39]. The hydroxylysine pathway results in two cross linked molecules: ketoimine and aldimine, which connect individual collagen triple helices [38]. Sugar-mediated crosslinking is characterised by a Maillard reaction, also known as a non-enzymatic browning reaction, which increase the turnover of collagen linearly. In diabetic patients studies have shown that there is an acceleration of the browning reaction [40]. Finally, transglutaminases (TGase), that are thiol- and calcium dependent multifunctional enzymes [31,41], also induce collagen crosslinking. However, not a lot is currently known about their activity. To date, we know that Tgase catalyses the formation of covalent bonds between the γ-carboxamide group of the peptide-bound glutamine residue and the ε-amino group of lysine of the collagen molecules [31].
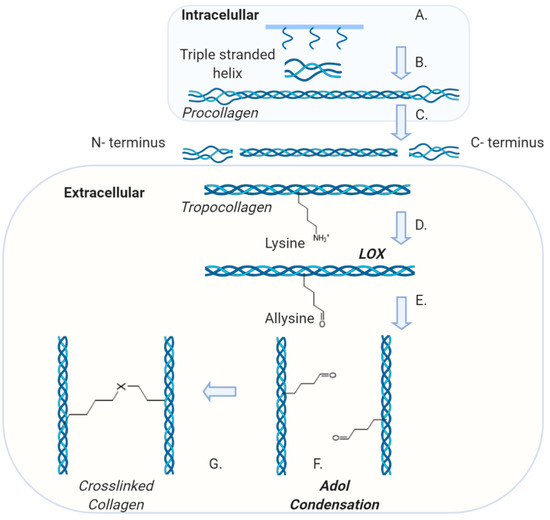
Figure 3.
Collagen Synthesis pathway and demonstration of LOX-medicated crosslinks: A. Triple stranded helix is formed in the endoplasmic reticulum (ER) followed by post-translational modification in the Golgi apparatus. B. Procollagen is processed and assembled intracellularly before being secreted to the extracellular space. C. The N and C terminus are removed to form tropocollagen. D. Lysyl Oxidase (LOX) catalyses the deamination of the lysine. E. Conversion of a lysine residue into a reactive aldehyde. F. Aldol condensation reaction between neighbouring aldehyde groups. G. Crosslinks both within and between triple-helical molecules [where X is C=C(CHO)].
2.3. Elastin
The mechanism of elastin synthesis is much better understood compared with collagen. The elastic and resilient properties of the ECM are provided by elastin and microfibrils [42]. Elastin itself is the second most abundant macromolecule in the ECM and serves an important role in the regulation of the biomechanical properties of cells and tissues [36] such as blood vessels, lungs and skin [17]. Elastin is an insoluble molecule with a finite turnover in healthy tissue. The appearance of elastin was first reported in 1958, but the interest in understanding elastin biochemistry further sparked in 1963 when the relationship between elastin structure and function was first reported [17]. The most abundant amino acids present in elastin are glycine followed by alanine, valine and a low level of hydroxyproline [43]. It has been shown that elastin and collagen are the only animal proteins that contain hydroxyproline, with an abundance of 2–4% and 13%, respectively [44]. Elastin, just like collagen, is an insoluble protein synthesised from intracellularly soluble monomers called tropoelastin (TE) that are assembled extracellularly by crosslinking (Figure 4). After the tropoelastin mRNA is translated in the RER, the protein migrates to the Golgi apparatus where it binds to the elastin-binding protein (EBP) to inhibit self-aggregation and avoid early degradation [36]. The TE-EBP complex is then exocytosed and the EBP releases the tropoelastin to the ECM environment. Extracellularly, the tropoelastin monomers align and interact with the microfibrillar scaffold and acquire the correct orientation to form the polymeric elastic fibres [36]. Tropoelastin has an intrinsic ability to undergo coacervation which is an endothermic process driven by entropy [45]. The process is believed to be largely due to the hydrophobic domains of tropoelastin [45]. With increasing temperature to physiological conditions, the tropoelastin molecules are correctly aligned for the subsequent enzymatic crosslinking of the molecules [45]. Lysyl oxidase (LOX) catalyses this reaction [36] in a similar way as for collagen. The structure of elastin is reported to be highly elastic and amorphous when compared to inextensible collagen [17].
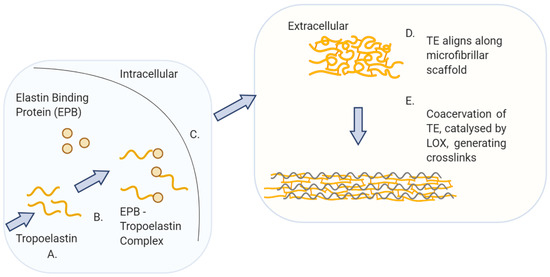
Figure 4.
Elastin biosynthesis pathway: A. Tropoelastin (TE), precursor of elastin, is translated from mRNA in the rough endoplasmic reticulum. B. TE and elastin binding protein (EBP) form a complex in the Golgi apparatus. C. The TE–EBP complex is secreted to the extracellular space. D. The EBP detaches from TE, allowing TE to interact and align along the microfibrillar scaffold. E. Coacervation of TE together with the enzymatic reaction, catalysed by lysyl oxidase (LOX), result in the crosslinking of the TE molecules into the polymeric elastin fibre.
2.4. Fibrin
The precursor of fibrin is the glycoprotein fibrinogen. Each unit of fibrinogen comprises of two copies of three polypeptide chains; Aα, Bβ and γ. These polypeptide chains are connected by 29 disulphide bonds and each fibrinogen molecule has outer D domains that are connected via a coiled central E domain [46,47]. The N-termini of all six chains are contained within the E domains, while the carboxyl termini of both Bβ and γ are located within the D domain [48]. The overview of the synthesis of fibrin is illustrated in (Figure 5). If the vessel wall sustains an injury, a series of local events ultimately lead to production of thrombin, a protease, that convers fibrinogen to fibrin [48]. It does so by cleaving peptides at the N-terminus of fibrinogen, causing the release of fibrinopeptides generating fibrin monomers [48]. Fibrin monomers then undergo polymerisation to effectively produce fibres to stabilise the clot.
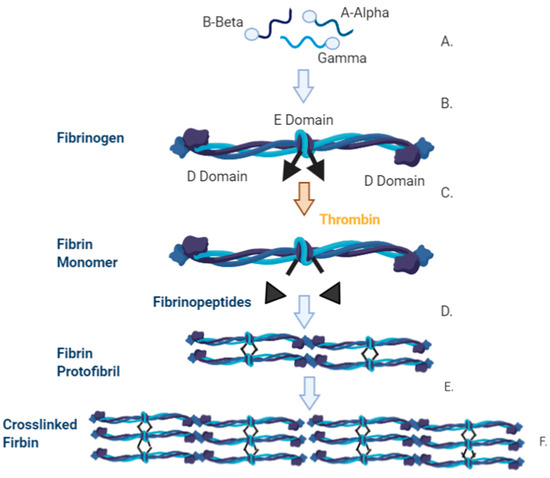
Figure 5.
Synthesis of fibrinogen and the conversion pathway into fibrin. A. The three polypeptide chains that make up fibrinogen are A-Alpha (Aα), B-Beta (Bβ) and Gamma (γ) B. Each of the polypeptide chains are translated and independently translocated to the endoplasmic reticulum with the signal protein cleaved from each chain. It is then processed and assembled in the Golgi apparatus. Disulphide bridges are formed between two of the AαBβγ units and post translation occurs before the fibrinogen molecule is excreted. C. The fibrinogen unit is comprised of two sets of the polypeptides, (AαBβγ)2, and is characterised by a D Domain, on the outer regions, and an E domain in the central region. D. When thrombin cleaves the fibrinogen molecule a fibrin monomer and two fibrinopeptides are removed leaving the knobs exposed. These knobs are complementary to the holes that are on the surface of the interacting fibrin molecule. E. The knob-hole interaction occurs which generates the protofibril. F. Protofibrils aggregate laterally resulting in fibrin formation.
3. Cardiovascular Disease
3.1. Clinical Relevance
Cardiovascular disease (CVD) is a collective term to characterise various conditions of the heart and blood vessels. CVD can occur from genetic and acquired diseases. CVD itself includes, but is not limited to, diseases such as coronary artery disease, cerebrovascular disease, aortic disease and Marfan syndrome, deep vein thrombosis, heart attacks, heart failure, cardiomyopathy, inflammatory diseases and atrial fibrillation. CVD is the primary cause of death worldwide, and it is reported by the World Health Organisation (WHO) that around 17.9 million people died from CVD in 2016, representing 31% of deaths globally [49]. Even with improved patient management it is projected that CVD will account for 10 million deaths globally by 2030 [50]. Section 3.1, Section 3.2, Section 3.3 and Section 3.4 will focus on the latest developments in non-invasive MRI and PET imaging of four prevalent CVDs: atherosclerosis, myocardial infarction, deep vein thrombosis and abdominal aortic aneurysms. A summary of the various targeting probes and their respective applications in imaging the ECM are presented in Table 2.
Table 2.
Summary of recent probe development in the field of cardiovascular disease (CVD) with indication to the ECM structure that they target.
3.2. Atherosclerotic Arterial Disease
3.2.1. Clinical Need
Atherosclerosis is a disease of the vessels and is characterised by build-up of atheromatous plaques [51]. The plaques are formed by the deposition of fatty substrates, cells and other molecules within the vessel wall [52]. This accumulation of plaque eventually causes partial or total obstruction of the vessel [52]. Atherosclerosis is a major contributor to overall cardiovascular morbidity and mortality [53]. Clinical manifestations include ischaemic heart disease, stroke and peripheral arterial disease [53].
3.2.2. ECM in Atherosclerosis
ECM changes are observed in various CVD conditions with MMPs playing a key role in remodelling of the ECM. In atherosclerosis, excessive activation of MMPs contributes to disease progression and plaque destabilisation. In atherosclerotic vessels MMPs act as inflammatory mediators linking inflammation with vascular remodelling. In disease vessels MMPs function as inflammatory cytokines and their expression and activity increases. However, MMPs are only present in low concentration and activity in healthy vessels. An important cell type in atherosclerosis is vascular smooth muscle cells (VSMCs). VSMCs are present in a quiescent/contractile state in healthy arteries and switch to a proliferative/synthetic state in atherosclerosis [54] rendering atherosclerotic plaques rich in collagen [54]. VSMC proliferation is dependent on type I collagen and results in plaque progression [54]. Adhesion of the ECM to cells is largely regulated by integrins, a large family of heterodimeric cell adhesion molecules that anchor cells to ECM and neighbouring cells. In this regard, integrin β1 is the most predominant integrin expressed on the surface of VSMCs and all collagen-binding integrins share the common β1 subunit [55,56]. Important extracellular matrix components and imaging targets in atherosclerosis include elastin, collagen, fibrin and metalloproteinases.
3.2.3. Imaging Atherosclerosis
Elastin
Taking advantage of the increased abundance of elastin within the extracellular matrix of atherosclerotic plaque compared to the normal arterial wall, a novel elastin-specific magnetic resonance contrast agent (ESMA, BMS753951) was used for the non-invasive quantification of plaque burden and arterial remodelling in a mouse and swine model of atherosclerosis [57,58]. ESMA is a paramagnetic Gd-labelled C32H40N7O11Gd low-molecular-weight contrast agent (855.95 Da), which has high vessel wall and plaque uptake (peaking at 30 min post injection in an apolipoprotein E-deficient ApoE−/− mouse) and relatively low uptake within other tissues (e.g., heart, liver, lung and muscle). ApoE−/− mice fed a high fat diet have become a popular animal model of atherosclerosis because they reproducibly develop plaques in the aorta, aortic root and brachiocephalic arteries with little variability between animals. It is also the quickest animal model that can achieve advanced atherosclerosis within 3 months of high-fat feeding in comparison, for example, to LDLR−/− mice that require around an additional month to display the same plaque burden and features as Apoe−/− mice [59]. In an ApoE−/− mouse model fed a high fat diet (HFD), the plaque contrast to noise ratio (CNR) post ESMA injection was significantly higher at 8 weeks and 12 weeks compared with control mice. Furthermore, there was a significant reduction in the post ESMA CNR at 12 weeks in mice who were treated with pravastatin compared with mice on a high fat diet alone; demonstrating the potential for non-invasive quantitative detection of plaque elastin content and size after therapeutic treatment (Figure 6) [57].
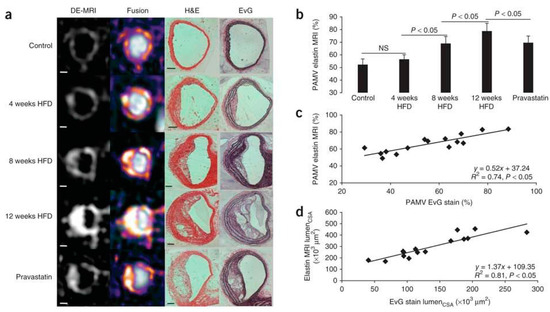
Figure 6.
In vivo assessment of plaque burden by morphometric measurements. (a) Cross-sectional views of brachiocephalic arteries by MRI of control and ApoE−/− mice 4, 8 and 12 weeks after the onset of HFD (n = 8 per group). High-resolution delayed-enhancement images overlaid on TOF images with corresponding sections from histology (H&E and EvG stain). (b) Comparison of average PAMV, calculated from morphometric measurement on high-resolution DE images after the injection of ESMA (n = 8 per group). (c,d) Scatter plots showing significant (p < 0.05) correlation between morphometric PAMV measurements (c) and lumen CSA measurements (d) on high-resolution DE-MRI (Delayed enhancement magnetic resonance imaging) images and on corresponding EvG-stained histological sections (n = 15). Scale bars: white, 250 µm; black, 100 µm. Values are expressed as means ± s.d. MRI—magnetic resonance imaging, HFD—high fat diet, TOF—time of flight, PAMV—percentage atheroma/media volume, CSA—cross-sectional area. Reproduced with permission from Makowski et al., 2011 [57].
In a swine model of arterial remodelling post stenting, significantly increased CNR was observed within the coronary arteries post ESMA injection compared with a non-targeted gadolinium agent [58]. Furthermore in a rabbit model of plaque rupture, ESMA enabled a more accurate assessment of vascular remodelling and identification of unstable plaque that rupture and form thrombus compared with gold-standard native T1 weighted black blood imaging (Figure 7) [60].
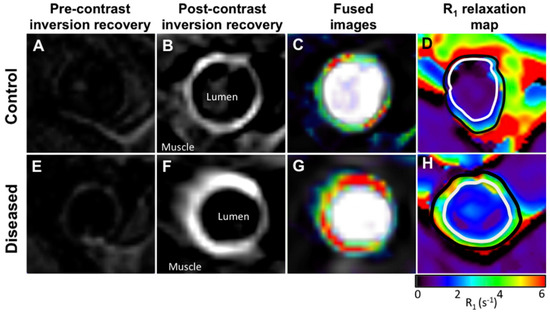
Figure 7.
(A,E), Cross-sectional pre-contrast MR images. (B,F), Corresponding DE MR images obtained after administration of elastin-specific contrast agent. (C,G), DE MR images fused with angiographic images. (D,H), Corresponding R1 maps obtained after administration of elastin-specific contrast agent. Uptake of elastin-specific contrast agent and R1 values are higher in diseased compared with control aortas. Reproduced with permission from Phinikaridou et al., 2014 [60].
More recently, Phinikaridou et al. introduced tropoelastin as a new and attractive biomarker for plaque progression and instability [61]. As elastogenesis and elastolysis favour the accumulation of tropoelastin, rather than mature cross-linked elastin, tropoelastin may serve as a more sensitive imaging biomarker of active, yet incomplete, elastogenesis to detect plaque progression and instability. MRI imaging of tropoelastin using a gadolinium labelled tropoelastin-binding contrast agent (TESMA) detected increased pathologic elastogenesis during atherosclerosis progression in ApoE−/− mice that was reduced with statin treatment. Moreover, tropoelastin MRI was more sensitive at detecting unstable plaque in a rabbit model of plaque rupture compared with ESMA [61]. This is because TESMA binds only to tropoelastin that accumulates in higher proportion in unstable plaques as a result of a dysfunctional cross-linking or elastolysis in the presence of disease, whereas ESMA binds equally to both tropoelastin and endogenously present polymeric elastin. Thus, ESMA could be used as an imaging probe to assess the net elastin increase and plaque burden, whilst TESMA could be used to selectively visualise dysfunctional elastogenesis or elastolysis (Figure 8) [61].
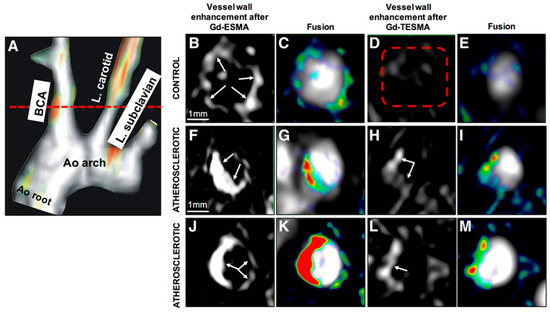
Figure 8.
In vivo magnetic resonance imaging (MRI) comparison of vessel wall enhancement using the elastin (elastin-specific magnetic resonance contrast agent [ESMA]) and tropoelastin (TESMA) binding contrast agents in mice. (A), Fused maximum intensity projection (MIP) reconstructed magnetic resonance angiography and delayed-enhanced-MRI after administration of Gd-TESMA show focal uptake of Gd-TESMA in the brachiocephalic artery (BCA) of an atherosclerotic apolipoprotein E–deficient mouse. (B–E), MRI of the BCA acquired from a control animal, scanned 24 h apart, showed vessel wall uptake of Gd-ESMA (B,C), but no uptake of Gd-TESMA (D,E) because of the lack of tropoelastin in the absence of disease. (F–M), MRI of the BCA acquired from 2 different diseased animals showed enhancement of the vessel wall after administration of both agents because of the presence of both cross-linked elastin and tropoelastin in the atherosclerotic lesion. Ao indicates aortic; and L., left. Reproduced with permission from Phinikaridou et al., 2018 [61].
Collagen
The differential expression of various collagen sub-types within atherosclerotic plaque and at different stages of plaque progression makes it an attractive target for atherosclerosis imaging. Type I collagen is the most abundant sub-type and accounts for up to two thirds of all collagen [62]. In an ex vivo immunoblotting study, Chung et al. investigated the abundance of different subtypes of collagen in atherosclerotic carotid arteries in patients presenting with diabetes. They demonstrated significant accumulation of type III collagen in diabetic vessels and found that type III collagen was more predominant than type I [63]. Caravan et al. developed a Gd-DTPA-based MRI probe that binds to type I collagen (EP-3533) for molecular imaging of fibrosis [64]. More recently, Chen et al. extended this approach by conjugating high density lipoprotein (HDL) based nanoparticles with EP-3533 and used it to image collagen in atherosclerotic plaque progression and regression in mice in vivo (Figure 9) [65]. Molecular imaging of collagen using EP-3533 has been extensively discussed in a review article by Haas et al. [12]. Using a different approach, a collagen binding adhesion protein found in Staphylococcus aureus, called CNA35, was shown to selectively bind to type I and type II collagen [66,67]. Healthy and atherosclerotic arteries have been imaged with both gadolinium and fluorescently labelled liposomes conjugated with CNA35 [68,69]. Using positron emission tomography (PET), Schulz et al. demonstrated the feasibility of a novel platelet-collagen-receptor-glycoprotein (GP) VI radiotracer to target and selectively visualise collagen type I and III ex vivo in human carotid atherosclerotic plaques and in vivo in an ApoE−/− mouse model [70].
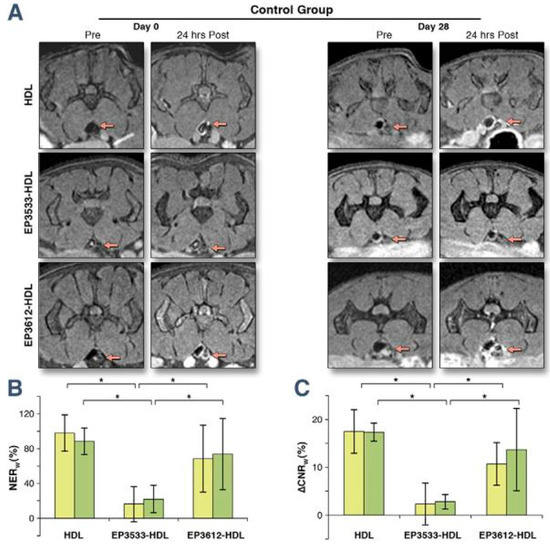
Figure 9.
(A) Typical MR images, (B) normalised enhancement ratio of the aortic wall to muscle (NERw) and (C) the difference between the contrast-to-noise ratio from the aortic wall to muscle pre- and post-contrast injection of abdominal atherosclerotic plaques for pre- and 24 h post-injection (∆CNRw) of HDL, EP3533-HDL, and EP3612-HDL at day 0 (yellow bars) and day 28 (green bars) of Reversa mice in the regression group. The red arrows point to the aortas. Error bars are representing mean ± SD. Statistical significance at p < 0.05 (n = 25) is indicated by the asterisks (*). HDL—high density lipoprotein. Reproduced with permission from Chen et al., 2013 [65].
Fibrin
Fibrin plays a crucial role during plaque progression, development of intraplaque haemorrhage and formation of thrombus following plaque rupture [71,72]. It is therefore an important target for molecular imaging of atherosclerotic plaque. Yu et al. demonstrated the feasibility of molecular MRI of fibrin clots ex vivo using a novel fibrin-targeted contrast agent with a lipid-encapsulated perfluorocarbon nanoparticle incorporating numerous Gd-DTPA complexes into its outer surface [73]. The ability to visualise human clots of variable sizes (0.5–7.0 mm) ex vivo was significantly improved after administration of this contrast agent compared to non-contrast T1 weighted imaging. In another study, the use of fibrin-specific paramagnetic nanoparticles enabled efficient targeting and signal enhancement of thrombi in the external jugular vein of a canine model in vivo [74]. Instead of nanoparticles, Sirol et al. used a gadolinium-based, small molecular weight, fibrin-binding MRI agent (EP-1242; EPIX Pharmaceutical) to image acute carotid plaque thrombus in guinea pigs [75]. Later on, Botnar et al. demonstrated the feasibility of in vivo molecular MRI of acute and subacute plaque thrombosis following plaque rupture using the gadolinium-based fibrin-binding MRI contrast agent (EP-1873) in a rabbit model of plaque rupture and thrombosis [76] (Figure 10). The same group also demonstrated the feasibility of acute coronary thrombus detection using a similar gadolinium based fibrin-binding contrast agent, EP-2104R, in a swine model [77] (Figure 11). EP-2104R was subsequently successfully translated into humans, demonstrating the in vivo potential of this fibrin-specific MRI contrast agent for the detection of acute venous and arterial thrombus in patients for the first time [78,79] (Figure 12).
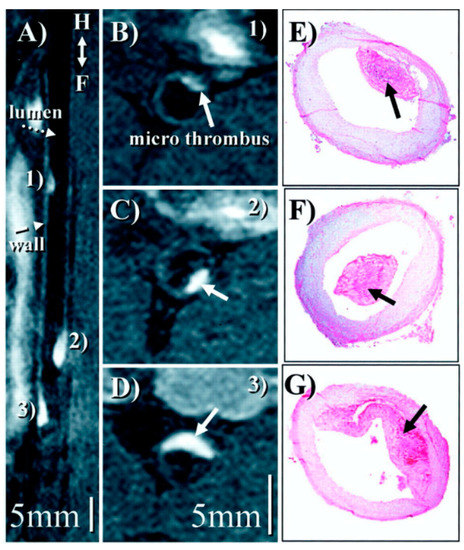
Figure 10.
(A), Reformatted view of a coronal 3D data set shows sub-renal aorta ≈20 h after EP-1873 administration. Three well-delineated mural thrombi (arrows) can be observed, with good contrast between thrombus (numbered), arterial blood (dotted arrow), and vessel wall (dashed arrow). The in-plane view of the aorta allows simultaneous display of all thrombi, showing head, tail, length, and relative location. (B–D), Corresponding cross-sectional views show good agreement with histopathology (E–G). Reproduced with permission from Botnar et al., 2004 [76].
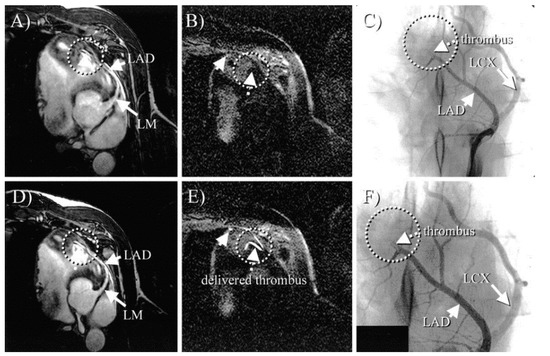
Figure 11.
In vivo MRI of Gd-labelled fibrinogen clots. (A) and (D), Coronary MRA before (A) and after (D) thrombus delivery. On both scans, no apparent thrombus is visible (circle). (B) and (E), Black-blood inversion recovery TFE scans before (B) and after (E) clot delivery (same view as (A) and (D). After thrombus delivery (E), three bright areas are readily visible (arrows and circle), consistent with location of thrombus. No apparent thrombus was visible on prethrombus (B) images (arrow and circle). (C), X-ray angiogram confirming MR finding of thrombus in mid-LAD (circle). (F), Magnified view of (C). LM indicates left main; LAD indicates left anterior descending artery; LCX indicates left circumflex artery. Reproduced with permission from Botnar et al., 2004 [77].
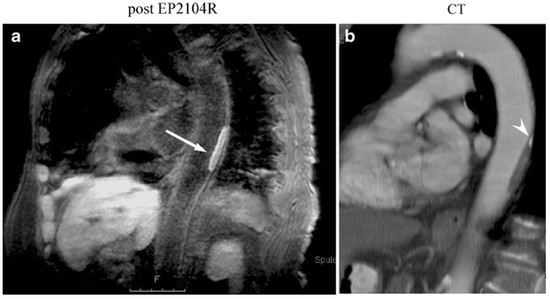
Figure 12.
(a) Molecular MR imaging of thrombus in the descending thoracic aorta in an 82-year-old female patient using inversion recovery black-blood gradient-echo imaging (IR). In this patient, parasagittal IR post-contrast imaging was also performed to demonstrate the extent of the clot. The high local signal amplification allows for white spot imaging of the clot (arrow). (b) Corresponding multiplanar reconstruction from contrast-enhanced multislice CT demonstrating corresponding plaque in the aortic wall. At the cranial end of the plaque a small calcification is also visible (arrowhead). Reproduced with permission from Spuentrup et al., 2008 [78].
Matrix Metalloproteinases
Matrix metalloproteinases (MMPs) have an important role in extracellular matrix and plaque remodelling and are associated with the thinning of the fibrous cap and the destabilization of atherosclerotic plaques [80,81]. Lancelot et al. introduced a novel gadolinium-based MRI contrast agent (P947) to target MMPs in atherosclerotic plaques [82]. P947 was evaluated in vivo using ApoE−/− mice and ex vivo in hyperlipidaemic rabbits and human carotid artery endarterectomy specimens. This study demonstrated the preferential accumulation of P947 in atherosclerotic lesions compared with non-targeted Gd-DOTA (Figure 13). This contrast agent has also been shown to distinguish dietary-induced variations in MMP-related enzymatic activity within plaques in an atherosclerotic model, supporting its utility as a clinical imaging tool for in vivo detection of arterial wall remodelling [83]. Haas et al. have systematically reviewed alternative applications of the P947 probe for imaging the ECM [12].
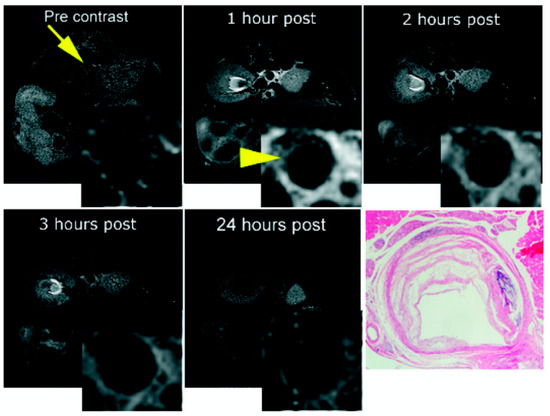
Figure 13.
In vivo MRI of an ApoE−/− mouse before (arrow) and after P947 injection (arrowhead). After injection, significant contrast-enhancement appears in the atherosclerotic aortic wall as shown on the inset images of the aorta. Delineation of plaque morphology after contrast-enhancement is clearly improved (arrowhead). The bottom-right panel is the matched pathologic section. Reproduced with permission from Lancelot et al., 2008 [82].
In a more recent study, fluorescent-labelled activatable cell penetrating peptides (ACPPs) designed to target MMPs were tested in a rabbit model of plaque rupture [84]. Fluorescence enhancement was significantly higher in ruptured plaques ex vivo, suggesting that ACPP probes can selectively differentiate unstable from stable plaques (Figure 14). Taking advantage of the higher sensitivity of single photon emission computed tomography (SPECT), Kuge et al. proposed a technetium-99m-labelled monoclonal antibody targeted to MMP-1, for imaging atherosclerosis in a rabbit model [85]. Probe uptake was significantly higher in atherosclerotic arteries compared with control arteries, with further increased uptake in grade IV atheroma in comparison with neointimal or more stable lesions. In another study, technetium-99m-labelling of the broad MMP inhibitor (MPI) enabled ex vivo quantification of the reduction of MMP after dietary modification or statin therapy in atherosclerotic rabbit aortas [86]. In a further study, Zhang et al. used a novel indium 111In-labelled tracer (RP782) with specificity for activated MMPs for molecular imaging of MMP activation in injury-induced vascular remodelling in ApoE−/− mice [87] using micro SPECT/CT.
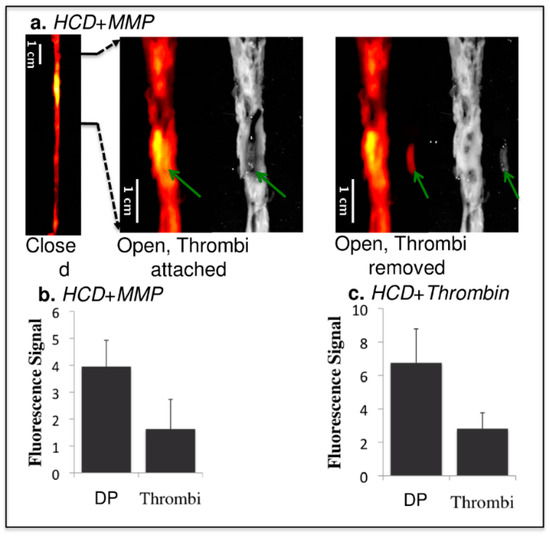
Figure 14.
Comparison of fluorescence signals from thrombi and the surrounding atherosclerotic plaque in the experimental group. HCD + MMP-ACPP (a,b) and HCD + Thrombin-ACPP(c). The images from left to right in (a) are: closed view fluorescence image, opened and zoomed-in fluorescence/reflected images with the thrombus (green arrows) attached at its original site, opened and zoomed-in fluorescence/reflected images with the thrombus removed. The dark signal of the aorta on the reflected image comes from clotted blood and relatively healthy vessel wall (without obvious fatty streaks). Plaques appeared as brighter (grey) signal. The bar graphs (b,c) give the statistical analysis of fluorescence signal for the underlying disrupted plaques (DP) and the overlaying thrombi (p < 0.001). HCD—high cholesterol diet; ACPP—activatable cell penetrating Peptides. Reproduced with permission from Hua et al., 2015 [84].
3.3. Myocardial Infarction
3.3.1. Clinical Need
Myocardial infarction (MI) followed by permanent structural damages and adverse cardiac remodelling can gradually lead to heart failure (HF). HF is an increasingly prevalent clinical condition, accounting for 1–2% of morbidity in the adult population in developed countries, rising to ≥10% among people >70 years of age. The lifetime risk of developing heart failure at age 55 years is 33% for men and 28% for women [88,89,90]. Ischaemic heart disease and myocardial infarction account for the vast majority of all cases of heart failure [91] and therefore pose a significant health burden on patients and an economic burden on healthcare systems.
3.3.2. Biology of Myocardial of Infarction
Myocardial infarction involves a sudden and transient occlusion of the coronary arteries (either following acute atherosclerotic plaque rupture or a thrombo-embolic event), depriving the cardiomyocytes of vital nutrients and oxygen. The myocardial matrix network is primarily fibrillar collagen and is organised into three distinct interconnected structures: endomysium (surrounding cardiomyocytes), perimysium (surrounding major bundles) and the epimysium (encasing the whole cardiac muscle). Within these interconnected myocardial structures, there are different types of collagen, with the epimysium and perimysium containing approximately 85–90% type I and 6–11% type III collagen in the endomysium of the total collagen content [92]. The cardiac ECM has the structural role to preserve the shape of the ventricles, facilitate the translation of force and transduce signals [93]. Cardiomyocytes have no ability to regenerate and therefore, depending on the extent of the injury, the myocardial structural integrity can be severely disrupted with necrosed cardiomyocytes replaced with fibrotic tissue leading to life-threatening arrhythmias and development of heart failure. After myocardial infarction (MI), MMPs are important in myocardial repair and scar formation, however if MMPs become excessively activated leading to an imbalance in MMP:TIMP ratio it can cause LV dysfunction and eventually lead to HF. The resulting insult subsequently triggers a cascade of molecular and cellular compensatory or damaging inflammatory, proliferative and maturation responses. The inflammatory phase is triggered by the death of cardiomyocyte cells that consequentially activates pro-inflammatory cytokines, enhancing the activity of MMPs promoting ECM degradation and also activates chemokines and other cell adhesion molecules. Neutrophils, leukocytes and macrophages are recruited into the infarcted area and as the debris is cleared from the area, the initial pro-inflammatory stimulus is suppressed by signals from mediators like interleukin-10 (IL-10) and transforming growth factor- β (TGF-β). These molecules, activate TIMPs that help preserve the ECM by inhibiting MMPs activity and initiate the proliferative phase [94]. During the proliferative phase, fibroblasts proliferate and transform/differentiate into myofibroblasts and secrete ECM proteins. The ECM subsequently undergoes extensive remodelling and cross-linking during the maturation phase leading to the formation of a fibrous scar. Fibroblasts are quiescent and along with endothelial cells they are also subjected to apoptosis at this stage [94]. Throughout the myocardial remodelling process, the ECM plays a crucial role and molecular imaging of specific ECM components could offer a wealth of diagnostic and therapeutic insights into heart failure post myocardial infarction that is an incredibly challenging clinical syndrome.
3.3.3. Imaging Myocardial Infarction
Non-Contrast Imaging
Cardiovascular magnetic resonance (CMR) is clinically established as the gold standard non-invasive imaging modality for the assessment of myocardial injury in the context of ischaemic heart disease and heart failure. In addition to highly reproducible 3D volumetric assessment of biventricular dimensions and function, CMR offers a spectrum of non-contrast and contrast enhanced myocardial tissue characterisation functions. Simonetti et al. proposed a short-inversion-time inversion-recovery (STIR) magnetic resonance imaging sequence with preparatory radio-frequency pulses to eliminate signal from flowing blood to distinguish between normal and abnormal myocardial tissues and image focal high signal intensity consistent with myocardial oedema following an acute myocardial infarction [95]. Here, a segmented rapid acquisition with relaxation enhancement (turbo spin echo) readout is used, with the inversion-recovery delay adjusted to null fat. To enable a more quantifiable and reproducible assessment of myocardial oedema and inflammation post-MI, 2D and more recently free breathing 3D whole heart myocardial T2 mapping sequences have been proposed [96,97]. It is also possible to take advantage of native myocardial T1 values to differentiate between normal and pathological myocardium including myocardial fibrosis, oedema, inflammation and infiltrative processes such as Fabry disease, amyloidosis and hemosiderosis [98,99,100,101]. Furthermore, recent pre and post contrast myocardial T1 mapping techniques have enabled a non-invasive and quantifiable assessment of the myocardial extracellular volume (ECV), a technique that was previously only feasible through invasive histopathological analysis [102]. This is particularly important in assessing pathological remodelling within the myocardial extracellular matrix, such as extracellular volume expansion caused by oedema, inflammation, infiltrative processes and diffuse and focal fibrosis [102].
Contrast-Enhanced Imaging
Leveraging the differential washout time of gadolinium-based contrast agents within normal and pathological myocardial tissue (e.g., fibrotic scar tissue), T1-weighted inversion recovery prepared late gadolinium enhancement (LGE) CMR is able to directly visualise the transmural extent and pattern of myocardial scar (e.g., following acute myocardial infarction) with a high degree of accuracy, offering both prognostic and therapeutic guidance to clinicians [103].
Collagen
Recent studies have demonstrated that early gadolinium enhancement (EGE) myocardial imaging identifies both reversibly and irreversibly injured myocardium following an acute MI, thus detecting and quantifying potential areas at risk [104,105,106]. However, none of these techniques are able to directly visualise and assess individual components of the extracellular matrix and its underlying biological processes. To overcome this limitation, targeted molecular imaging of individual extracellular matrix components is required. One example is EP-3533, the same collagen-binding agent used for atherosclerotic imaging [107]. In a mouse model of myocardial infarction, Helm et al. demonstrated significantly longer washout time for EP-3533 compared to gadopentetate dimeglumine in regions of post-MI scarring and in normal myocardium, with good correlation on histologic sections stained for collagen and EP-3533 enhanced areas seen on inversion-recovery CMR images (Figure 15) [107]. Furthermore, there was a two-fold higher concentration of EP-3533 within post infarction tissues compared to normal myocardium.
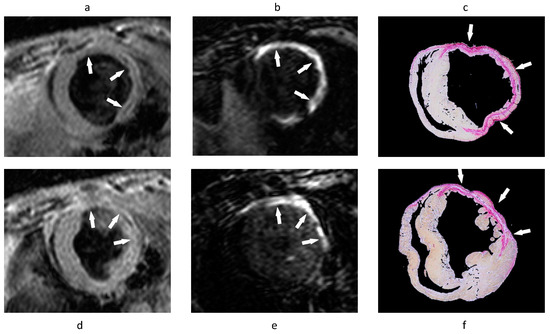
Figure 15.
(a,b,d,e) Gradient-echo IR MR images and (c,f) corresponding picrosirius red–stained histologic sections of the LV. Arrows point to area of scarring. (a,d) Standard anatomic MR images acquired by using a double IR gradient-echo sequence (8.0/3.7/R-R interval). (b,e) Regions of contrast enhancement on midventricular short-axis MR images (7.1/3.0/430) of the LV at two section locations obtained 40 min after EP-3533 injection correlate closely with (c,f) photomicrographs of picrosirius red–stained tissue sections shown at nine times their original size. LV—left ventricle. Reproduced with permission from Helm et al., 2008 [107].
Elastin
In a separate approach, Wildgruber et al. used ESMA to image elastin fibres for in vivo assessment of extracellular matrix remodelling in a mouse model of myocardial infarction [108]. Despite the final measured area of infarction being similar to that measured with a conventional Gd-based contrast agent, the authors observed progressively increased ESMA uptake within the infarcted area, peaking at day 21 post-MI, which correlated with increased synthesis of tropoelastin and improvement in ejection fraction, suggesting some compensatory properties of elastin post myocardial injury in a mouse of permanent occlusion (Figure 16) [108,109].
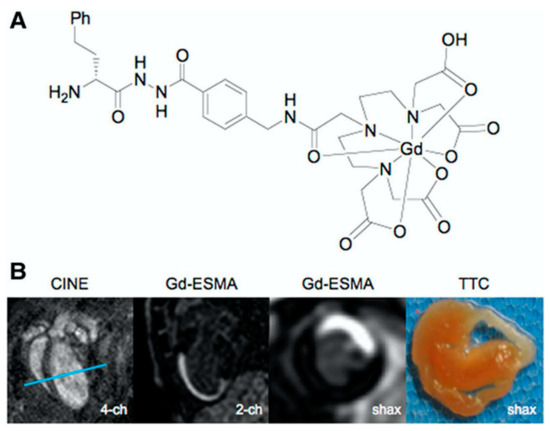
Figure 16.
Gadolinium-based elastin-specific MR contrast agent (Gd-ESMA) for imaging of myocardial scar. (A), Chemical structure of Gd-ESMA. (B), Cross-sectional cardiac MR images of C57BL/6J mouse on postoperative day 7 after myocardial infarction. Two-chamber view and short-axis view obtained at the level of the blue lines in first 4-chamber (image) show accumulation of Gd-ESMA (second and third image) in the myocardial scar, corresponding to the infarct area on triphenyltetrazolium chloride (TTC) staining (last image). Reproduced with permission from Wildgruber et al., 2014 [108].
In an alternative approach, perfluorocarbons were combined with elastin MRI to enable simultaneous assessment of inflammation and elastin remodelling in a murine model of myocardial infarction using a single loop multinuclear 1H/19F send receive coil [110]. This confirmed an early inflammatory response (peaking at day 7 post infarction) followed by elevated elastin remodelling (peaking at day 21 post MI) (Figure 17) [110].
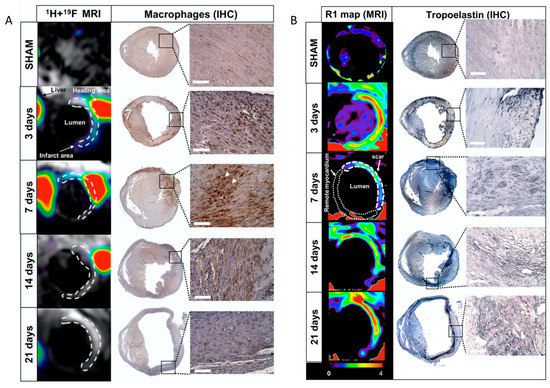
Figure 17.
(A): Assessment of inflammatory response after myocardial infarction in mice at 3T magnetic resonance imaging (MRI) using 19F perfluorocarbons. Representative short-axis views of co-registered 1H + 19F images (left column; N = 8 MI animals/time-point; N = 6 SHAM-operated animals/time-point) and macrophage immunohistochemistry (IHC; macrophages identified as MAC-3 positive, brown; N = 4 MI animals/time-point; N = 3 SHAM-operated animals/time-point) from the heart at 3, 7, 14, and 21 days after MI. (B): In vivo imaging of extracellular matrix remodelling after myocardial infarction with a gadolinium-based elastin/tropoelastin-specific contrast agent Representative short-axis images of relaxation rate (R1, left columns) maps and tropoelastin immunohistochemistry (IHC; right columns) of the hearts sections at 7, 14, and 21 days post-myocardial infarction (MI) at 3T magnetic resonance imaging (MRI). Tropoelastin fibres were identified as black fine fibre network. Reproduced with permission from Ramos et al., 2018 [110].
Matrix Metalloproteinases
Targeting the extensive role of MMPs in post-MI remodelling, Su et al. proposed a novel and highly sensitive MMP-targeted imaging approach in a murine model [111]. This study used an MMP-targeted 99mTc-labelled compound (99mTc-RP805), which acted on the activated catalytic domain and therefore exhibit enzyme inhibitory effects. Using SPECT imaging, 99mTc-RP805 uptake was increased threefold and twofold within the infarcted and remote myocardium regions, respectively, compared with control mice; confirming the significant role of MMPs within both the infarcted and remote myocardium following an ischaemic insult. In a review article by Haas et al., further applications of the RP805 probe for imaging the ECM in CVD are discussed [12].
3.4. Venous Thromboembolism
3.4.1. Clinical Need
Venous thromboembolism (VTE) predominantly manifests as deep vein thrombosis (DVT) in the veins of the pelvis or lower limb [112], with or without pulmonary embolism (PE), and annual incidence and mortality of up to 600,000 and 100,000, respectively in the United States [113,114]. Approximately 30% of patients with DVT develop pulmonary embolism (PE), of which 10% die; while 50% of patients with DVT develop post-thrombotic syndrome (PTS) characterised by pain, swelling and chronic ulceration [113,115]. PTS is associated with a reduced quality of life [116]. VTE causes a substantial financial burden to health systems in Europe with the range of costs for in Europe ranging from 1.5 to 13.2 billion euros [117]. Given the burden of the disease early diagnosis and treatment are essential to improve patient prognosis, quality of life and management is needed [112]. Venous thrombi mainly contain erythrocytes, fibrin and collagen [118].
3.4.2. Biology of Venous Thromboembolism
The factors contributing to the formation of DVT were first described in 1856 as stasis in the venous system, injury to vasculature and hypercoagulability that collectively increase the risk of clot formation [119]. The initiation of this coagulation cascade along with fibrin deposition in the vessel leads to the formation of the venous thrombus. Thrombus resolution occurs slowly through a natural process of organisation involving the replacement of fibrin with collagen and recanalisation of the vein [115,120,121]. Inflammation has been strongly associated with DVT thrombus resolution as the inflammatory response causes the activation of pro-inflammatory cytokines (including IL-6 and IL-8) and growth factors (including transforming growth factor beta-1 (TGF-β1) and -2 tumour growth factor (TGF-β2) [122,123,124]. Consequently, macrophages, neutrophils and monocytes are recruited within the thrombus further enhancing the inflammatory response by producing more inflammatory cytokines, amalgamating the inflammation and growth factors [125]. With time, this existing fibrin fibre network thickens or is replaced by other structural proteins, such as collagen [126]. An important factor of MMP activation in DVT is that MMP are activated proximally by serine proteases; in particular plasmin that is the main mediator of fibrinolysis [125]. Fibrinolysis, breakdown of fibrin, along with collagen remodelling are essential for the resolution of the thrombus [127]. Fibrinolysis occurs at an increased rate at the early phases and as the thrombus matures, fibrin is replaced by collagen [127]. Only acute thrombi are considered for thrombolytic treatment, as they are more fibrin-rich, while older thrombi are more collagenous and therefore resistant to plasmin-mediated degradation [128,129,130,131,132].
3.4.3. Imaging Venous Thromboembolisms
Direct MRI Thrombus Imaging
Moody et al. [133] demonstrated that it is possible exploit the intrinsic T1 properties of tissues to image thrombus with MRI. Proton binding to Fe3+ within accumulating methemoglobin in thrombi produces T1 shortening leading to high signal intensity on T1-weighted images of thrombi such as in DVT. In a murine model of DVT, Saha et al. assessed the longitudinal relaxation time (T1) of thrombus over a 28 day evolutionary phase of the thrombus [134]. They demonstrated that the T1 relaxation time of thrombus was shortest at 7 days following thrombus induction and returned to that of blood as the thrombus resolved (Figure 18). T1 relaxation time was related to thrombus methemoglobin formation and was a good predictor of successful thrombolysis with a cut-off point of <747 ms; with a sensitivity and specificity to predict successful lysis of 83% and 94%, respectively.
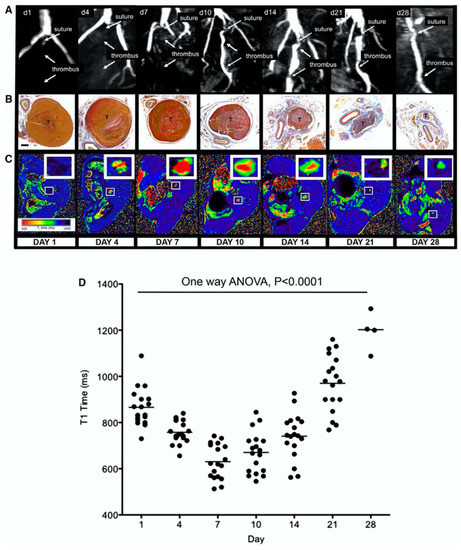
Figure 18.
Magnetic resonance T1 mapping of experimental venous thrombi. (A), MRI venography demonstrates the presence of thrombus in the murine inferior vena cava, which recanalizes over 28 days. (B), MSB sections of venous thrombus (T) during its resolution (yellow = red cells, red = fibrin, blue = collagen; ×200; bar, 200 μm). (C), Corresponding T1 maps were generated by the use of a customised program (MATLAB software, MathWorks) before importation into OSIRIX as shown. Short T1relaxation times (ms) appear red and revert back to blood (black) as thrombus ages. (D), Mean T1 relaxation times (ms) of the thrombus change during its resolution (scatter plot and mean of thrombus T1 relaxation time [ms] is shown, n = 88 mice, p < 0.0001, 1-way ANOVA). Mouse procedures were performed under the Animals (Scientific Procedures) Act, 1986, UK. ANOVA indicates analysis of variance; d—day; and MSB—Martius Scarlet Blue. Reproduced with permission from Saha et al., 2013 [134].
In a similar experimental murine model of DVT, Phinikaridou et al. assessed the feasibility of in vivo magnetization transfer contrast (MTC) and diffusion-weighted (DW) MRI for thrombus imaging [135]. They demonstrated that quantitative MTC imaging is able to differentiate between young (days 1 and 7) and old (>day 14) thrombus, while the combination of quantitative MTC and DW imaging can successfully identity thrombus between days 7 and 14 (Figure 19).
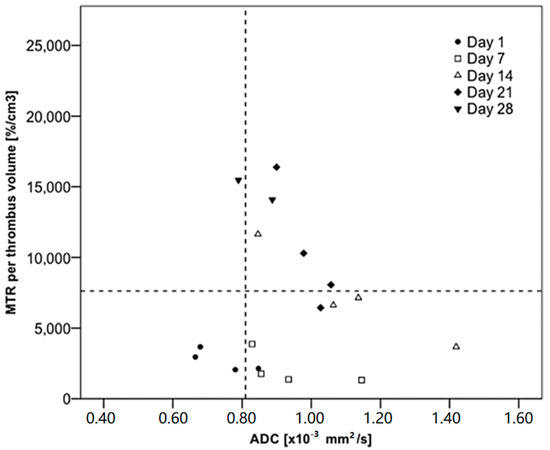
Figure 19.
Percentage of magnetization transfer rate (MTR) and apparent diffusion coefficient (ADC) values measured at different time points of venous thrombosis organization. The combination of the percentage of MTR (<7620%/cm3) and ADC (>0.81 × 10 − 3 mm2/s) had a sensitivity of 87.5% (95% confidence interval [CI], 47–99) and specificity of 83.3% (95% CI, 51–97) to identify thrombus between 7 and 14 days old, when the fibrin content would be larger. Reproduced with permission from Phinikaridou et al., 2013 [135].
Recently, Wu et al. demonstrated the feasibility of non-contrast diffusion weighted MRI for in vivo discrimination of acute (<14 days) from non-acute (>14 days) DVT [136]. In this study, 85 patients with lower limb DVT who underwent diffusion weighted MRI could be successfully differentiated based on their apparent diffusion coefficient (ADC) images. The mean ADC was higher in acute DVT than non-acute DVT (0.56 ± 0.17 × 10⁻³ vs. 0.22 ± 0.12 × 10⁻³ mm2/s, p < 0.001). Using 0.32 × 10⁻³ mm2/s as the cut-off, the sensitivity and specificity of ADC to discriminate acute from non-acute DVT were 93% and 90%, respectively (Figure 20).
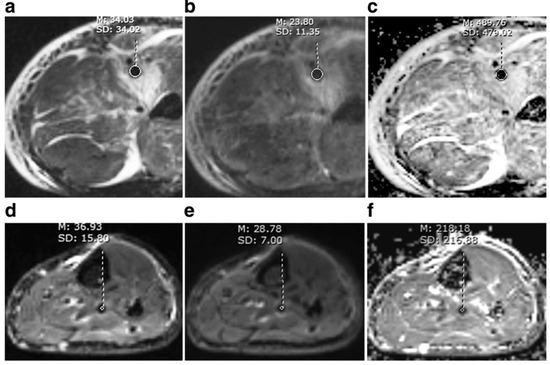
Figure 20.
A comparison between acute and non-acute DVT. Acute thrombus (first line) and non-acute thrombus (second line) were hypointense on b = 0 (a,d), b = 800 s/mm2 (b,e) image. The signal intensity was about the same for acute and non-acute thrombus, while ADC values differed greatly (c,f). Mean ADC of this acute thrombus was above the cut-off of 0.32 × 10⁻³ mm2/s, while that of non-acute thrombus was below the cut-off. Reproduced with permission from We et al., 2019 [136].
In a different study, Chen et al. demonstrated the potential of black blood non-contrast direct thrombus imaging in a cohort of 15 healthy volunteers and 30 patients with acute DVT. Thrombus appeared either iso- or hyperintense in the acute phase with comparable diagnostic confidence to contrast enhanced CMR venography: sensitivity (95%), specificity (99%), positive predictive value (96%), negative predictive value (98%), and accuracy (98%) (Figure 21) [137].
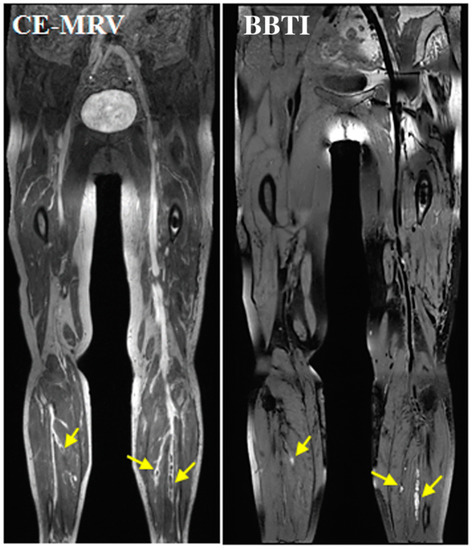
Figure 21.
Representative images obtained by CE-CMRV and BBTI from a patient with DVT symptom onset at 10 days. The small thrombus can also be detected by BBTI and matched well with that seen with CE-CMRV (yellow arrows). BBTI—black-blood thrombus imaging; CE-CMRV—contrast-enhanced CMR venography. Reproduced with permission from Chen et al., 2018 [137].
Molecular Thrombus Imaging
Fibrin
Fibrin is heavily involved in thrombus formation [71,72] and is therefore an important molecular target for imaging of DVT. In a pre-clinical murine model of DVT, Andia et al. investigated the fibrin-specific MRI contrast agent (EP-2104R) for the in vivo quantification of thrombus fibrin content the identification of thrombus suitable for thrombolysis [138] (Figure 22). Contrast uptake positively correlated with the fibrin content of the thrombus measured by Western blotting (R2 = 0.889; p < 0.001). Furthermore, thrombus relaxation rate post contrast and the change in visualised thrombus size pre and post EP-2104R injection were the best predictors for successful thrombolysis.
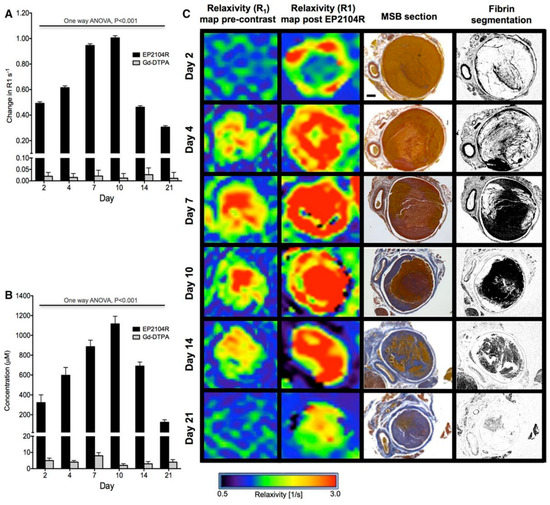
Figure 22.
(A), Changes in thrombus relaxation rate ΔR1 (s-1) pre–EP-2104R and post–EP-2104R administration at different time point during thrombus organization. Greatest differences in ΔR1 pre and post contrast are observed at days 7 and 10. (B), Thrombus gadolinium concentration (μmol/L) mirrored the changes in R1 over time. (C), R1mapping images pre EP-2104R and post EP-2104R injection and Martius Scarlet Blue (MSB) histology sections at the corresponding levels and fibrin selective segmentation. Gd-DTPA indicates gadolinium with diethylenetriaminepentacetate (Magnevist, Schering AG, Berlin, Germany). Reproduced with permission from Andia et al., 2014 [138].
In another study, Spuentrup et al. demonstrated the successful imaging of thrombus (both freshly engineered thrombi and human thrombus removed from patients) by using EP-2104R in a swine model of pulmonary embolism [139]. In a clinical translational study, Vymazal et al. assessed the use of EP-2104R in patients with confirmed PE or DVT [79]. Use of the agent enhanced the signal of the thrombus and enabled visualisation of additional thrombus features, not visible on the pre-contrast images (Figure 23). In a different approach, Hara et al. combined a novel fibrin-targeted probe (FTP 11-Cy7) with near-infrared fluorescence (NIRF) in a mouse model of DVT [140]. In vitro human clot-binding analyses showed a 6-fold higher NIRF signal for the clot target-to-background ratio (TBR) using the FTP11-Cy7 probes compared to the free Cy7. Moreover, the thrombus TBR of acute and sub-acute femoral DVT with FTP11-Cy7 obtained by intravital fluorescence microscopy was 4-fold higher than control free Cy7. Indeed, in vivo imaging of fibrin in jugular DVT via fluorescence molecular computed tomography demonstrated strong NIRF signal in thrombi compared to sham-operated jugular veins using FTP11-Cy7. Recently, Blasi et al. combined whole-body PET/MRI with the fibrin-binding probe 64Cu-FBP8 in a rodent model of carotid artery and femoral vein thrombosis [141]. A single whole-body PET/MRI scan revealed the location of both arterial and venous thrombi after the administration of 64Cu-FBP8. PET imaging showed that probe uptake was greater in younger, fibrin-rich clots compared with older collagen-rich clots in both arterial and venous thrombosis (p < 0.0001), which was also confirmed on quantitative histopathology analysis.
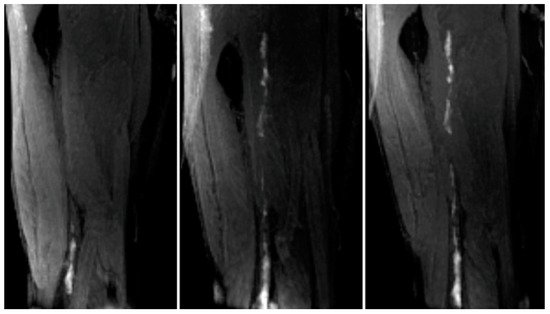
Figure 23.
Left panel, met-Hb enhanced thrombus in the lower femoral/popliteal (knee) veins. Centre panel, Additional thrombus apparent in the mid and upper femoral vein when image acquired 2 h post EP-2104R injection. Right panel, 20 h postcontrast agent image demonstrates persistent enhancement of the thrombus. Reproduced with permission from Vymazal et al., 2009 [79].
3.5. Abdominal Aortic Aneurysms
3.5.1. Clinical Relevance of AAA
Abdominal aortic aneurysms (AAA or triple A) are a localized enlargement of the abdominal aorta such that the diameter is greater than 3 cm or more than 50% larger than normal. AAA’s are becoming increasingly more prevalent with rupture of an AAA having devastating clinical consequences, with up to 90% mortality [142,143]. This rise is driven by a maelstrom of risk factors including connective tissue disorders (e.g., Marfan syndrome, Ehler Danlos syndrome), autoimmune and inflammatory disorders (e.g., Takayasu disease, Kawasaki disease), infective disorders (e.g., brucellosis, salmonellosis and tuberculosis), modifiable factors (e.g., smoking, hyperlipidaemia, obesity, hypertension) and non-modifiable factors (increasing age and male sex) [144,145]. The size and rate of progression of AAA has important prognostic implications and it currently serves as the screening marker for monitoring disease progression and for following up treatments prior to pre-emptive surgical intervention [146]. However, anatomical assessment alone is highly unreliable as the rate of disease progression and aortic dilatation varies significantly between affected individuals [147]. ECM components could potentially offer a complementary tool to that of anatomical imaging, for improved and early diagnosis and therapeutic targeting of AAA at a biological and molecular level [148].
3.5.2. Biology of AAA
Components of the extracellular matrix play significant roles in the remodelling and dilatation of the abdominal aorta. Based on ex vivo tissue studies there is strong evidence that the breakdown of two major ECM fibre components, elastin and collagen, is what primarily weakens the aortic wall resulting in gradual enlargement and formation of a balloon-like swelling, called an aneurysm [149]. With the continuous enlargement of the aneurysm, the media and adventitial layers of the vessel wall might separate, and an intramural hematoma might be formed which is frequently rich in fibrin. Through time the aneurysm tissue matures and the hematoma composition changes from fibrin-rich to collagen and elastin rich, ultimately improving the hematomas’ stability [149]. Acute aortic dissection (AAD) is characterised by the formation of an intimal flap separating the true (normal pathway for blood) and false (newly created pathway for blood) lumens [150]. The false lumen is located in the outer portion of the aorta and there are generally indications of slow flow along some, if not all, of the lumen [150].
In AAAs, the most common type of proteinases are the MMPs [151]. MMP expression is increased in comparison to normal tissue and TIMPs expression is also changed, However the MMP/TIMP equilibrium is shifted towards the degradation of proteins [151]. In healthy conditions many vascular cells secrete MMP, including both endothelial and VSMC, however in AAA additional secretion is adopted by macrophages and lymphocytes [152,153]. Aortic wall elastin can be degraded and fragmented by MMPs, leading to subsequent instability of the aortic wall [154]. Consequently, the pulsatile strength of the vessel wall is reduced and as a result there is initially compensatory production of collagen, which however, is also degraded over time [151]. When collagen degradation surpasses the production of collagen the tensile strength of the vessel wall attenuates even more resulting in vessel wall thinning and ultimately rupture [151]. Therefore, prognosis of AAA is highly determined by the synthesis and degradation of elastin and collagen proteins.
3.5.3. Imaging AAA
Elastin
Elastin underpins the structural integrity of the aortic wall and constitutes up to a third of its weight [155]. In a mouse model of aortic aneurysm, Botnar et al. demonstrated the feasibility of an elastin-specific MR agent (ESMA) to monitor the in vivo stages of aortic wall remodelling prior to and during aortic dilatation, with subsequent histopathological validation (Figure 24) [156].
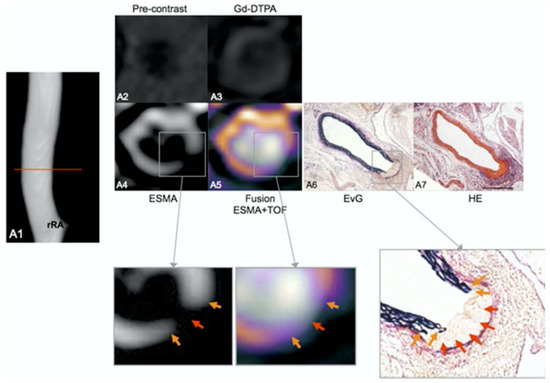
Figure 24.
In vivo assessment of the aortic rupture site prior to the dilation of the aorta. In an ApoE–/– mouse 1 week after continuous infusion of angiotensin II, the angiogram demonstrates an aortic lumen without dilatation or luminal irregularities (A1). The red line indicates the location of the corresponding transverse images. On elastin-specific magnetic resonance molecular imaging agent (ESMA)-MRI, the rupture of elastic laminae could be clearly visualized in vivo (A4,A5). Corresponding ex vivo histological sections (A6,A7) confirmed the rupture of elastic laminae in this area (magnification of A6, orange arrows). On pre-contrast (A2) and gadolinium diethylenetriamine penta-acetic acid enhanced images (A3), only minor enhancement of the arterial wall was observed. aA—abdominal aorta; EvG—Elastica van Gieson; HE—hematoxylin and eosin; rRA—right renal artery; and TOF—time of flight. Reproduced with permission from Botnar et al., 2014 [156].
Similarly, in a Marfan mouse model Okamura et al. demonstrated the potential of ESMA to detect decreased aortic wall levels of elastin compared with wild-type controls [157]. Recently, Lavin et al. advanced our understanding of dysfunctional elastogenesis in AAA disease by employing a newly developed gadolinium labelled tropoelastin-binding MRI agent (TESMA). This study assessed whether quantifying regional tropoelastin turnover correlates with aortic expansion in an Angio-II-infused murine model (Figure 25) [158]. The authors demonstrated that tropoelastin overexpression and the uptake of the contrast agent were confined within aneurysmal walls. Significantly, a parallel longitudinal imaging study demonstrated a greater proportion of tropoelastin:elastin in dilating compared to non-dilating aortas, which correlated with the rate of aortic expansion. Interestingly, treatment with aspirin and statins did not affect tropoelastin turnover or aortic dilatation in a small cohort of mice. Finally, TESMA was able to identify accumulation of tropoelastin in a small number of excised human aortic aneurysmal tissue as confirmed by histology.
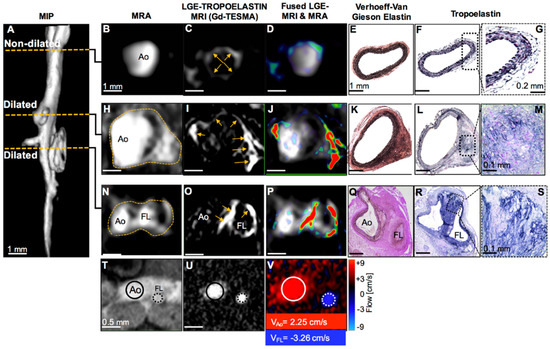
Figure 25.
MRI of tropoelastin shows enhancement at sites of aortic aneurysm or dissection. (A) A reformatted MRA of an Ang II-infused ApoE−/− mouse shows two regions of aortic dilation. (B–G) MRA, LGE-MRI, and histology of a non-dilated segment show a normal aortic size, low enhancement after administration of Gd-TESMA, and lack of tropoelastin, respectively. (H–M) At the level of the first aortic dilation, there is vascular enhancement of the aneurysm after administration of Gd-TESMA that co-localized with the accumulation of tropoelastin as verified histologically. (N–P and T–V) At the level of the second aortic dilation, MRI images show the formation of a false lumen indicative of an aortic dissection, with aortic enhancement after administration of Gd-TESMA and retrograde blood flow. (Q–S) Histology verified the formation of two lumens and the accumulation of tropoelastin in areas where vascular enhancement was observed in vivo using the tropoelastin agent. Ao, aorta; FL, false lumen. Reproduced with permission from Lavin et al., 2019 [158].
Collagen
Despite an initial compensatory increase in collagen synthesis in the early stages of AAA onset, enzymatic (e.g., MMPs and cathepsins) collagen degradation dominates the subsequent progressive stages of AAA development, paving the way for aortic dilatation [159,160]. In a mouse model of aortic aneurysm and rupture, Klink et al. assessed the feasibility of in vivo molecular MRI of collagen using paramagnetic/fluorescent micellar nanoparticles functionalized with the collagen-binding protein CNA-35 [161]. Injection of CNA-35 micelles resulted in a significantly higher MRI signal enhancement in aneurysmal walls compared with nonspecific micelles. Histological analysis demonstrated that CNA-35 colocalized with type I collagen, although it is known to bind to all fibrillar collagens and collagen type IV [161]. Furthermore, the investigators also showed that stable aneurysms were associated with increased expression of collagen in the aortic wall and high CNA-35 uptake, whilst ruptured aneurysms displayed significant collagen degradation and low CNA-35 uptake demonstrating the potential of collagen imaging in the diagnosis and risk stratification of AAA. Given the most abundant collagens in the aortic wall are type I and III collagen, Satta el al investigated whether changes of the propeptide of type III collagen (PIIINP) in serum could be associated with characteristics of AAA. PIINP measures the turnover of type III collagen [162]. Satta et al. quantified the levels of animoterminal PIIINP and carboxyterminal propeptide of type I collagen by radioimmunoassays in patient samples of AAA and reported an increase in type III collagen in the serum of patients with AAA compared with controls. These result could be attributed to increased synthesis of type III collagen, increased degradation or both in these patients [162].
Fibrin
Fibrin is a key protein in the formation of focal hematoma associated with aortic dissection and the development of larger thrombi during the progression of AAAs [154]. Botnar et al. used the fibrin-specific molecular MRI probe (EP2104R) in an angiotensin-II-infused ApoE−/− mouse model of AAA [149]. EP2104R enabled visualization of the small fibrin-rich hematoma located at the site of aortic dissection prior to aortic dilation and during the progression of AAA (Figure 26). In early thrombi, a strong in vivo signal and increased fibrin deposition was measured, which was confirmed by ex vivo analysis. In advanced thrombi, an increased remodelling of the matrix of the thrombus was observed and a relative decrease in fibrin expression was measured in vivo. This could potentially enable differentiation between early fibrin-rich and advanced remodelled aortic aneurysm thrombi.
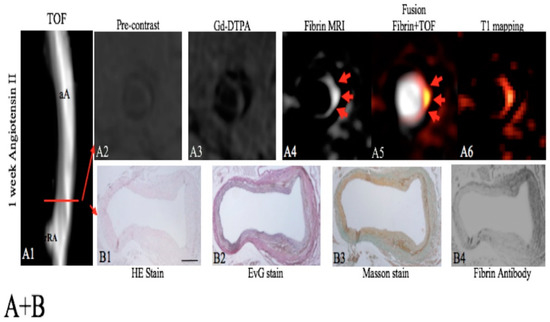
Figure 26.
Assessment of a focal fibrin-rich intramural hematoma before the dilation of the aorta by fibrin MRI. A, On the TOF angiogram (A1), a nondilated aortic lumen without luminal irregularities can be appreciated in an ApoE−/−mouse 1 week after continuous infusion of angiotensin II. The red line indicates the alignment of in vivo MRI sequences and ex vivo histology. No significant enhancement of the aorta was measured on pre-contrast scans (A2) and following the administration of the nonspecific control agent (Gd-DTPA, A3). Following the administration of the fibrin-specific molecular probe, a strong focal enhancement was measured at the dissection side (A4–A6). On the EvG stain, the dissection of elastic laminae can be clearly visualised on magnified images (B2). In between the dissection, a fibrin-rich mural hematoma can be visualised (B2–B4). It is a strong signal from the fibrin that antibody was measured at the location of the intramural hematoma (B4). No relevant formation of elastin or collagen fibres was measured in the hematoma on histologic sections (B1–B3), indicating that no remodelling of the hematoma has occurred. aA—abdominal aorta; Gd-DTPA—gadopentetate dimeglumine; MRI—magnetic resonance imaging; rRA—right renal artery; TOF—time of flight. Reproduced with permission from Botnar et al., 2018 [149].
Matrix Metalloproteinases
Similar to atherosclerotic arterial disease, MMPs play a significant role in aortic remodelling during the evolution of AAA (e.g., the degradation of elastin and collagen) [153,154]. Bazeli et al. used the MMP targeting MRI probe (P947) in an elastase-infused rat model of AAA [163]. After 5 days of elastase infusion, a significantly higher molecular signal was detected in rats injected with P947 compared with rats injected with an untargeted-scrambled agent or Gd-DOTA. Histologic analysis confirmed colocalisation of areas of contrast enhancement and the periarterial inflammatory area of the aneurysms, representing a potential non-invasive method to detect AAAs at high risk of rupture. Using SPECT imaging, Golestani et al. used a technetium-99m-labeled MMP-specific tracer (RP805) for the detection of aneurysm biology and prediction of outcome in angiotensin II-infused mice [164]. RP805 uptake was significantly higher in animals with AAA when compared with angiotensin II-infused animals without AAA or control animals. A cohort of angiotensin II-infused animals were imaged at one week and followed up for an additional three weeks. RP805 uptake at 1 week was significantly higher in mice that later developed rupture or AAA. Furthermore, tracer uptake at one week correlated with aortic diameter at four weeks, demonstrating the potential of RP805 as a risk stratification tool for future aortic expansion/rupture.
4. Clinical Relevance of Non-Invasive Imaging Probes
The ability to image the individual components of the ECM to gain an insight into the live biological processes that ultimately manifest as various CVDs is of great clinical value. The clinical translational scope is multifaceted. Patients can be identified at an earlier stage in the disease process, potentially prior to phenotypical or symptomatic presentation. This will subsequently enable the initiation of either prophylactic or therapeutic treatment at a much earlier stage, which may translate into improved clinical outcomes. The dynamic nature of ECM biology can be leveraged to monitor patients over time, including their response to treatment. Furthermore, the quantitative and targeted imaging of ECM components could be utilised as an additional tool to titrate and if needed alter therapeutic strategies. Similarly, molecular imaging of ECM components could play a significant role in therapeutic drug development both in pre-clinical and clinical trials to assess the efficacy of pharmacological interventions at both the cellular and molecular levels.
However, these probes are largely still at the developmental stage and no single probe has yet been established for routine clinical decision-making. They remain expensive to implement and are mainly used by a select group of academic and commercial institutions. In addition to large clinical efficacy trials, long-term data on the potential effect these imaging probes may have on the physiological function of the ECM is required before large-scale clinical trials take place. Nuclear imaging probes have a distinct advantage over MRI probes in the sense that a significantly lower concentration of probe is required to achieve the required threshold for detection. This lowers the developmental cost of probes and accelerates human trials as expensive and time-consuming toxicity studies in humans can often be extenuated due to micromolar dosing. However, MRI retains the advantage of superior spatial resolution, intrinsic tissue characterisation and lack of ionising radiation. Furthermore, once the initial hurdle of probe safety and efficacy has been overcome, long-term production, storage and maintenance of MRI probes is cheaper and more scalable compared to nuclear imaging probes, for instance no requirement for cyclotrons in close proximity to scanners, longer and safer storage once manufactured. Furthermore, access to MRI scanners is relatively cheaper compared to PET. Hybrid scanners (e.g., PET/MR) have been developed to take advantage of the higher sensitivity of PET whilst at the same time enjoying the benefits of MRI (e.g., higher spatial resolution). However, they are very expensive, limited to a select group of centres and ionising radiation remains a persistent drawback.
One area that is attracting interest is the idea of using ECM probes with PET in clinical proof of concept studies by taking advantage of the significantly lower dose that is required as a pragmatic bridge to full MRI only probe development. Once a clear proof of concept in man is established, resources and focus can shift towards toxicity and safety studies for MRI only probes. This strategy can streamline the pathway and significantly increase the likelihood of successful probe development.
5. Future Directions
Understanding the biosynthesis and biochemical composition of ECM components enables the design and development of targeted imaging probes for molecular imaging using modalities, such as MRI and PET. This information is of importance not only to the field of molecular imaging but also in for tissue engineering and regenerative medicine to produce biomaterials to mimic the properties of ECM proteins. Existing probes in research still require further development and clinical validation in clinical trials. Despite the considerable advantages of MRI; including high spatial resolution images and radiation free imaging; clinical translation of MRI probes is impeded because of concerns with toxicity and financial viability. There is therefore need for future studies into methods that can improve the safety of these MRI probes to bridge the gap that currently exists between probe development and clinical translation. The limitations of the use of gadolinium-based contrast agents are well documented for instance in patients with renal impairment. There is therefore a renewed interest in manganese, a biogenic compound, as a non-gadolinium MR imaging contrast which displays similar physical properties of gadolinium, however, differs by means of clearance as it is excreted via the hepatobiliary system. Targeted iron oxide nanoparticles are currently been explored as contrast agents and have shown great potential. Prospective development of MRI agents is likely to involve multi-modal approaches, integrating systems and new theranostic applications combining diagnosis and therapy in a single exam.
6. Conclusions
The ECM plays vital roles in multiple cardiovascular diseases and maintaining ECM homeostasis is a key target of effective treatment and prevention. Different CVDs share changes in common ECM proteins, e.g., fibrin, collagen and elastin and ECM-related enzymes, e.g., MMPs, LOX that have become interesting imaging and therapeutic targets. Understanding the biochemistry of the major ECM proteins is essential for the development of drugs that specifically modulate the ECM and novel imaging approaches for assessing changes in the composition of ECM proteins in disease conditions. In the past decade there have been major advancements in both non-contrast imaging of the ECM and also protein- and cell-specific imaging probe development for imaging the biology of ECM proteins. These imaging technologies could be used to improve diagnosis and guide personalised treatments for improving patient outcomes. Future studies should focus on further refinement of the imaging probes to enable safe and efficient imaging and to ultimately translate and evaluate their use in the clinical setting.
Author Contributions
Conceptualization, N.C., R.H., A.P. and R.M.B.; data curation, N.C. and R.H.; writing—original draft preparation, N.C.; writing—review and editing, N.C., R.H., A.P. and R.M.B.; visualization, N.C., R.H.; supervision, A.P. and R.M.B.; project administration, A.P. and R.M.B.; funding acquisition, A.P. and R.M.B. All authors have read and agreed to the published version of the manuscript.
Funding
This work was supported by the following grants: (1) EPSRC EP/P032311/1, EP/P001009/1 and EP/P007619/1, (2) BHF programme grant RG/20/1/34802, (3) King’s BHF Centre for Research Excellence RE/18/2/34213 (4) Wellcome EPSRC Centre for Medical Engineering (NS/A000049/1), and (5) the Department of Health via the National Institute for Health Research (NIHR) Cardiovascular Health Technology Cooperative (HTC) and comprehensive Biomedical Research Centre awarded to Guy’s & St Thomas’ NHS Foundation Trust in partnership with King’s College London and King’s College Hospital NHS Foundation Trust.
Conflicts of Interest
The authors declare no conflict of interest.
References
- Schuppan, D. Structure of the extracellular matrix in normal and fibrotic liver: Collagens and glycoproteins. Semin. Liver Dis. 1990, 10, 1–10. [Google Scholar] [CrossRef] [PubMed]
- Gullberg, D.; Ekblom, P. Extracellular matrix and its receptors during development. Int. J. Dev. Biol. 1995, 39, 845–854. [Google Scholar] [PubMed]
- Järveläinen, H.; Sainio, A.; Koulu, M.; Wight, T.N.; Penttinen, R. Extracellular matrix molecules: Potential targets in pharmacotherapy. Pharmacol. Rev. 2009, 61, 198–223. [Google Scholar] [CrossRef] [PubMed]
- Frantz, C.; Stewart, K.M.; Weaver, V.M. The extracellular matrix at a glance. J. Cell Sci. 2010, 123, 4195–4200. [Google Scholar] [CrossRef]
- Daley, W.P.; Peters, S.B.; Larsen, M. Extracellular matrix dynamics in development and regenerative medicine. J. Cell Sci. 2008, 121, 255–264. [Google Scholar] [CrossRef]
- Wallace, K.; Burt, A.D.; Wright, M.C. Liver fibrosis. Biochem. J. 2008, 411, 1–18. [Google Scholar] [CrossRef]
- Wight, T.N.; Merrilees, M.J. Proteoglycans in atherosclerosis and restenosis: Key roles for versican. Circ. Res. 2004, 94, 1158–1167. [Google Scholar] [CrossRef]
- Caorsi, V.; Toepfer, C.; Sikkel, M.B.; Lyon, A.R.; MacLeod, K.; Ferenczi, M.A. Non-Linear Optical Microscopy Sheds Light on Cardiovascular Disease. PLoS ONE 2013, 8, e56136. [Google Scholar] [CrossRef]
- Jo, J.A.; Park, J.; Pande, P.; Shrestha, S.; Serafino, M.J.; De Jesus Rico Jimenez, J.; Clubb, F.; Walton, B.; Buja, L.M.; Phipps, J.E.; et al. Simultaneous morphological and biochemical endogenous optical imaging of atherosclerosis. Eur. Heart J. Cardiovasc. Imaging 2015, 16, 910–918. [Google Scholar] [CrossRef]
- Schipke, J.; Brandenberger, C.; Rajces, A.; Manninger, M.; Alogna, A.; Post, H.; Mühlfeld, C. Assessment of cardiac fibrosis: A morphometric method comparison for collagen quantification. J. Appl. Physiol. 2017, 122, 1019–1030. [Google Scholar] [CrossRef]
- Pinkert, M.A.; Hortensius, R.A.; Ogle, B.M.; Eliceiri, K.W. Imaging the Cardiac Extracellular Matrix. In Advances in Experimental Medicine and Biology; Springer International Publishing: Berlin, Germany, 2018; Volume 1098, pp. 21–44. ISBN 978-3-319-97421-7. [Google Scholar]
- De Haas, H.J.; Arbustini, E.; Fuster, V.; Kramer, C.M.; Narula, J. Molecular imaging of the cardiac extracellular matrix. Circ. Res. 2014, 114, 903–915. [Google Scholar] [CrossRef] [PubMed]
- Skandalis, S.S.; Dobra, K.; Götte, M.; Karousou, E.; Misra, S. Impact of Extracellular Matrix on Cellular Behavior: A Source of Molecular Targets in Disease. Biomed Res. Int. 2015, 2015, 1–2. [Google Scholar] [CrossRef] [PubMed]
- Manabe, R.I.; Tsutsui, K.; Yamada, T.; Kimura, M.; Nakano, I.; Shimono, C.; Sanzen, N.; Furutani, Y.; Fukuda, T.; Oguri, Y.; et al. Transcriptome-based systematic identification of extracellular matrix proteins. Proc. Natl. Acad. Sci. USA 2008, 105, 12849–12854. [Google Scholar] [CrossRef]
- Bonnans, C.; Chou, J.; Werb, Z. Remodelling the extracellular matrix in development and disease. Nat. Rev. Mol. Cell Biol. 2014, 15, 786–801. [Google Scholar] [CrossRef]
- Rozario, T.; DeSimone, D.W. The extracellular matrix in development and morphogenesis: A dynamic view. Dev. Biol. 2010, 341, 126–140. [Google Scholar] [CrossRef]
- Bailey, A.J. Collagen and elastin fibres. J. Clin. Pathol. 1978, 31, 49–58. [Google Scholar] [CrossRef]
- Hamill, K.J.; Kligys, K.; Hopkinson, S.B.; Jones, J.C.R. Laminin deposition in the extracellular matrix: A complex picture emerges. J. Cell Sci. 2009, 122, 4409–4417. [Google Scholar] [CrossRef]
- Magnusson, M.K.; Mosher, D.F. Fibronectin: Structure, assembly, and cardiovascular implications. Arterioscler. Thromb. Vasc. Biol. 1998, 18, 1363–1370. [Google Scholar] [CrossRef]
- Jones, F.S.; Jones, P.L. The tenascin family of ECM glycoproteins: Structure, function, and regulation during embryonic development and tissue remodeling. Dev. Dyn. 2000, 218, 235–259. [Google Scholar] [CrossRef]
- Rienks, M.; Papageorgiou, A.P.; Frangogiannis, N.G.; Heymans, S. Myocardial extracellular matrix: An ever-changing and diverse entity. Circ. Res. 2014, 114, 872–888. [Google Scholar] [CrossRef]
- Hileman, R.E.; Fromm, J.R.; Weiler, J.M.; Linhardt, R.J. Glycosaminoglycan-protein interactions: Definition of consensus sites in glycosaminoglycan binding proteins. BioEssays 1998, 20, 156–167. [Google Scholar] [CrossRef]
- Yanagishita, M. Function of proteoglycans in the extracellular matrix. Pathol. Int. 1993, 43, 283–293. [Google Scholar] [CrossRef]
- Roberts, A.B.; Sporn, M.B.; Assoian, R.K.; Smith, J.M.; Roche, N.S.; Wakefield, L.M.; Heine, U.I.; Liotta, L.A.; Falanga, V.; Kehrl, J.H. Transforming growth factor type β: Rapid induction of fibrosis and angiogenesis in vivo and stimulation of collagen formation in vitro. Proc. Natl. Acad. Sci. USA 1986, 83, 4167–4171. [Google Scholar] [CrossRef]
- Roberts, A.B.; McCune, B.K.; Sporn, M.B. TGF-β: Regulation of extracellular matrix. Kidney Int. 1992, 41, 557–559. [Google Scholar] [CrossRef]
- Bujak, M.; Frangogiannis, N.G. The role of TGF-β signaling in myocardial infarction and cardiac remodeling. Cardiovasc. Res. 2007, 74, 184–195. [Google Scholar] [CrossRef]
- Chen, Q.; Jin, M.; Yang, F.; Zhu, J.; Xiao, Q.; Zhang, L. Matrix metalloproteinases: Inflammatory regulators of cell behaviors in vascular formation and remodeling. Mediators Inflamm. 2013, 2013, 1–14. [Google Scholar] [CrossRef]
- Perrine Susan Extracellular Matrix Remodeling During the Progression of Volume Overload-Induced Heart Failure. Bone 2005, 23, 1–7.
- Kim, H.E.; Dalal, S.S.; Young, E.; Legato, M.J.; Weisfeldt, M.L.; D’Armiento, J. Disruption of the myocardial extracellular matrix leads to cardiac dysfunction. J. Clin. Investig. 2000, 106, 857–866. [Google Scholar] [CrossRef]
- Picard, F.; Brehm, M.; Fassbach, M.; Pelzer, B.; Scheuring, S.; Küry, P.; Strauer, B.E.; Schwartzkopff, B. Increased cardiac mRNA expression of matrix metalloproteinase-1 (MMP-1) and its inhibitor (TIMP-1) in DCM patients. Clin. Res. Cardiol. 2006, 95, 261–269. [Google Scholar] [CrossRef]
- Rodríguez-Pascual, F.; DÍez, J. Myocardial fibrosis in response to pressure overload: Elucidating the contribution of tissue transglutaminase. Cardiovasc. Res. 2017, 113, 841–843. [Google Scholar] [CrossRef]
- Pawelec, K.M.; Best, S.M.; Cameron, R.E. Collagen: A network for regenerative medicine. J. Mater. Chem. B 2016, 4, 6484–6496. [Google Scholar] [CrossRef]
- Boraschi-Diaz, I.; Wang, J.; Mort, J.S.; Komarova, S.V. Collagen type i as a ligand for receptor-mediated signaling. Front. Phys. 2017, 5. [Google Scholar] [CrossRef]
- Baynes, J.; Dominiczak, M. Medical Biochemistry, 2nd ed.; Elsevier Mosby: Edinburgh, UK, 2004. [Google Scholar]
- Copes, F.; Pien, N.; Van Vlierberghe, S.; Boccafoschi, F.; Mantovani, D. Collagen-based tissue engineering strategies for vascular medicine. Front. Bioeng. Biotechnol. 2019, 7, 1–15. [Google Scholar] [CrossRef]
- Miranda-Nieves, D.; Chaikof, E.L. Collagen and Elastin Biomaterials for the Fabrication of Engineered Living Tissues. ACS Biomater. Sci. Eng. 2017, 3, 694–711. [Google Scholar] [CrossRef]
- Veis, A. The biochemistry of collagen. Ann. Clin. Lab. Sci. 1975, 5, 123–131. [Google Scholar]
- Sorushanova, A.; Delgado, L.M.; Wu, Z.; Shologu, N.; Kshirsagar, A.; Raghunath, R.; Mullen, A.M.; Bayon, Y.; Pandit, A.; Raghunath, M.; et al. The Collagen Suprafamily: From Biosynthesis to Advanced Biomaterial Development. Adv. Mater. 2019, 31, 1–39. [Google Scholar] [CrossRef]
- Siegel, R.C. Collagen cross linking. Synthesis of collagen cross links in vitro with highly purified lysyl oxidase. J. Biol. Chem. 1976, 251, 5786–5792. [Google Scholar]
- Monnier, V.M.; Kohn, R.R.; Cerami, A. Accelerated age-related browning of human collagen in diabetes mellitus. Proc. Natl. Acad. Sci. USA 1984, 81, 583–587. [Google Scholar] [CrossRef]
- Griffin, M.; Collighan, R.J.; Chau, D.; Edwards, V.E. Transglutaminase Crosslinked Collagen Biomaterial for Medical Implant Materials. Google Patents WO2006027622A2, 16 March 2006. [Google Scholar]
- Wise, S.G.; Weiss, A.S. Tropoelastin. Int. J. Biochem. Cell Biol. 2009, 41, 494–497. [Google Scholar] [CrossRef]
- Debelle, L.; Tamburro, A.M. Elastin: Molecular description and function. Int. J. Biochem. Cell Biol. 1999, 31, 261–272. [Google Scholar] [CrossRef]
- Bentley, J.P.; Hanson, A.N. The hydroxyproline of elastin. BBA Protein Struct. 1969, 175, 339–344. [Google Scholar] [CrossRef]
- Vrhovski, B.; Jensen, S.; Weiss, A.S. Coacervation characteristics of recombinant human tropoelastin. Eur. J. Biochem. 1997, 250, 92–98. [Google Scholar] [CrossRef]
- Henschen, A.; Lottspeich, F.; Kehl, M.; Southan, C. Covalent Structure of Fibrinogen. Ann. N. Y. Acad. Sci. 1983, 408, 28–43. [Google Scholar] [CrossRef]
- Mosesson, M.W. Fibrinogen and fibrin structure and functions. J. Thromb. Haemost. 2005, 3, 1894–1904. [Google Scholar] [CrossRef]
- Diane, E. Handy Rita Castro Joseph Loscalzo Molecular mechanisms affecting fibrin structure and stability Susan. Bone 2011, 23, 1–7. [Google Scholar]
- WHO Cardiovascular Disease—Key Facts. Available online: https://www.who.int/news-room/fact-sheets/detail/cardiovascular-diseases-(cvds) (accessed on 21 February 2020).
- Cannon, B. Cardiovascular disease: Biochemistry to behaviour. Nature 2013, 493, S2–S3. [Google Scholar] [CrossRef]
- Phinikaridou, A.; Andia, M.E.; Lacerda, S.; Lorrio, S.; Makowski, M.R.; Botnar, R.M. Molecular MRI of atherosclerosis. Molecules 2013, 18, 14042–14069. [Google Scholar] [CrossRef]
- Herrington, W.; Lacey, B.; Sherliker, P.; Armitage, J.; Lewington, S. Epidemiology of Atherosclerosis and the Potential to Reduce the Global Burden of Atherothrombotic Disease. Circ. Res. 2016, 118, 535–546. [Google Scholar] [CrossRef]
- Benjamin, E.J.; Virani, S.S.; Callaway, C.W.; Chamberlain, A.M.; Chang, A.R.; Cheng, S.; Chiuve, S.E.; Cushman, M.; Delling, F.N.; Deo, R.; et al. Heart disease and stroke statistics-2018 update: A report from the American Heart Association. Circulation 2018, 137, e67–e492. [Google Scholar] [CrossRef]
- Chistiakov, D.A.; Sobenin, I.A.; Orekhov, A.N. Vascular extracellular matrix in atherosclerosis. Cardiol. Rev. 2013, 21, 270–288. [Google Scholar] [CrossRef]
- Hillis, G.S.; Mlynski, R.A.; Simpson, J.G.; MacLeod, A.M. The expression of β1 integrins in human coronary artery. Basic Res. Cardiol. 1998, 93, 295–302. [Google Scholar] [CrossRef]
- Hong, Z.; Reeves, K.J.; Sun, Z.; Li, Z.; Brown, N.J.; Meininger, G.A. Vascular smooth muscle cell stiffness and adhesion to collagen I modified by vasoactive agonists. PLoS ONE 2015, 10, e0119533. [Google Scholar] [CrossRef]
- Makowski, M.R.; Wiethoff, A.J.; Blume, U.; Cuello, F.; Warley, A.; Jansen, C.H.P.; Nagel, E.; Razavi, R.; Onthank, D.C.; Cesati, R.R.; et al. Assessment of atherosclerotic plaque burden with an elastin-specific magnetic resonance contrast agent. Nat. Med. 2011, 17, 383–388. [Google Scholar] [CrossRef]
- von Bary, C.; Makowski, M.; Preissel, A.; Keithahn, V.; Warley, A.; Spuentrup, E.; Buecker, A.; Lazewatsky, J.; Cesati, R.; Onthank, D.; et al. MRI of coronary wall remodeling in a swine model of coronary injury using an elastin-binding contrast agent. Circ. Cardiovasc. Imaging 2011, 4, 147–155. [Google Scholar] [CrossRef]
- Rosenfeld, M.E.; Polinsky, P.; Virmani, R.; Kauser, K.; Rubanyi, G.; Schwartz, S.M. Advanced atherosclerotic lesions in the innominate artery of the apoE knockout mouse. Arterioscler. Thromb. Vasc. Biol. 2000, 20, 2587–2592. [Google Scholar] [CrossRef]
- Phinikaridou, A.; Andia, M.E.; Indermuehle, A.; Onthank, D.C.; Cesati, R.R.; Smith, A.; Robinson, S.P.; Saha, P.; Botnar, R.M. Vascular remodeling and plaque vulnerability in a rabbit model of atherosclerosis: Comparison of delayed-enhancement MR imaging with an elastin-specific contrast agent and unenhanced black-blood MR imaging. Radiology 2014, 271, 390–399. [Google Scholar] [CrossRef]
- Phinikaridou, A.; Lacerda, S.; Lavin, B.; Andia, M.E.; Smith, A.; Saha, P.; Botnar, R.M. Tropoelastin: A novel marker for plaque progression and instability. Circ. Cardiovasc. Imaging 2018, 11, e007303. [Google Scholar] [CrossRef]
- Murata, K.; Motayama, T.; Kotake, C. Collagen types in various layers of the human aorta and their changes with the atherosclerotic process. Atherosclerosis 1986, 60, 262. [Google Scholar] [CrossRef]
- Chung, A.W.Y.; Luo, H.; Tejerina, T.; van Breemen, C.; Okon, E.B. Enhanced cell cycle entry and mitogen-activated protein kinase-signaling and downregulation of matrix metalloproteinase-1 and -3 in human diabetic arterial vasculature. Atherosclerosis 2007, 195, e1–e8. [Google Scholar] [CrossRef]
- Caravan, P.; Das, B.; Dumas, S.; Epstein, F.H.; Helm, P.A.; Jacques, V.; Koerner, S.; Kolodziej, A.; Shen, L.; Sun, W.C.; et al. Collagen-targeted MRI contrast agent for molecular imaging of fibrosis. Angew. Chem. Int. Ed. 2007, 46, 8171–8173. [Google Scholar] [CrossRef]
- Chen, W.; Cormode, D.P.; Vengrenyuk, Y.; Herranz, B.; Feig, J.E.; Klink, A.; Mulder, W.J.M.; Fisher, E.A.; Fayad, Z.A. Collagen-Specific Peptide Conjugated HDL Nanoparticles as MRI Contrast Agent to Evaluate Compositional Changes in Atherosclerotic Plaque Regression. JACC Cardiovasc. Imaging 2013, 6, 373–384. [Google Scholar] [CrossRef] [PubMed]
- Patti, J.M.; Boles, J.O.; Höök, M. Identification and Biochemical Characterization of the Ligand Binding Domain of the Collagen Adhesin from Staphylococcus aureus. Biochemistry 1993, 32, 11428–11435. [Google Scholar] [CrossRef]
- Xu, Y.; Rivas, J.M.; Brown, E.L.; Liang, X.; Höök, M. Virulence Potential of the Staphylococcal Adhesin CNA in Experimental Arthritis Is Determined by Its Affinity for Collagen. J. Infect. Dis. 2004, 189, 2323. [Google Scholar] [CrossRef] [PubMed]
- Sanders, H.M.H.F.; Strijkers, G.J.; Mulder, W.J.M.; Huinink, H.P.; Erich, S.J.F.; Adan, O.C.G.; Sommerdijk, N.A.J.M.; Merkx, M.; Nicolay, K. Morphology, binding behavior and MR-properties of paramagnetic collagen-binding liposomes. Contrast Media Mol. Imaging 2009, 4, 81–88. [Google Scholar] [CrossRef]
- Megens, R.T.A.; Oude Egbrink, M.G.A.; Cleutjens, J.P.M.; Kuijpers, M.J.E.; Schiffers, P.H.M.; Merkx, M.; Slaaf, D.W.; Van Zandvoort, M.A.M.J. Imaging collagen in intact viable healthy and atherosclerotic arteries using fluorescently labeled CNA35 and two-photon laser scanning microscopy. Mol. Imaging 2007, 6, 246–260. [Google Scholar] [CrossRef]
- Schulz, C.; Penz, S.; Hoffmann, C.; Langer, H.; Gillitzer, A.; Schneider, S.; Brandl, R.; Seidl, S.; Massberg, S.; Pichler, B.; et al. Platelet GPVI binds to collagenous structures in the core region of human atheromatous plaque and is critical for atheroprogression in vivo. Basic Res. Cardiol. 2008, 103, 356–367. [Google Scholar] [CrossRef] [PubMed]
- Nörenberg, D.; Ebersberger, H.U.; Diederichs, G.; Hamm, B.; Botnar, R.M.; Makowski, M.R. Molecular magnetic resonance imaging of atherosclerotic vessel wall disease. Eur. Radiol. 2016, 26, 910–920. [Google Scholar] [CrossRef]
- Tavora, F.; Cresswell, N.; Li, L.; Ripple, M.; Burke, A. Immunolocalisation of fibrin in coronary atherosclerosis: Implications for necrotic core development. Pathology 2010, 42, 15–22. [Google Scholar] [CrossRef]
- Yu, X.; Song, S.K.; Chen, J.; Scott, M.J.; Fuhrhop, R.J.; Hall, C.S.; Gaffney, P.J.; Wickline, S.A.; Lanza, G.M. High-resolution MRI characterization of human thrombus using a novel fibrin-targeted paramagnetic nanoparticle contrast agent. Magn. Reson. Med. 2000, 44, 867–872. [Google Scholar] [CrossRef]
- Flacke, S.; Fischer, S.; Scott, M.J.; Fuhrhop, R.J.; Allen, J.S.; McLean, M.; Winter, P.; Sicard, G.A.; Gaffney, P.J.; Wickline, S.A.; et al. Novel MRI contrast agent for molecular imaging of fibrin implications for detecting vulnerable plaques. Circulation 2001, 104, 1280–1285. [Google Scholar] [CrossRef]
- Sirol, M.; Aguinaldo, J.G.S.; Graham, P.B.; Weisskoff, R.; Lauffer, R.; Mizsei, G.; Chereshnev, I.; Fallon, J.T.; Reis, E.; Fuster, V.; et al. Fibrin-targeted contrast agent for improvement of in vivo acute thrombus detection with magnetic resonance imaging. Atherosclerosis 2005, 182, 79–85. [Google Scholar] [CrossRef] [PubMed]
- Botnar, R.M.; Perez, A.S.; Witte, S.; Wiethoff, A.J.; Laredo, J.; Hamilton, J.; Quist, W.; Parsons, E.C.; Vaidya, A.; Kolodziej, A.; et al. In Vivo Molecular Imaging of Acute and Subacute Thrombosis Using a Fibrin-Binding Magnetic Resonance Imaging Contrast Agent. Circulation 2004, 109, 2023–2029. [Google Scholar] [CrossRef]
- Botnar, R.M.; Buecker, A.; Wiethoff, A.J.; Parsons, E.C.; Katoh, M.; Katsimaglis, G.; Weisskoff, R.M.; Lauffer, R.B.; Graham, P.B.; Gunther, R.W.; et al. In Vivo Magnetic Resonance Imaging of Coronary Thrombosis Using a Fibrin-Binding Molecular Magnetic Resonance Contrast Agent. Circulation 2004, 110, 1463–1466. [Google Scholar] [CrossRef] [PubMed]
- Spuentrup, E.; Botnar, R.M.; Wiethoff, A.J.; Ibrahim, T.; Kelle, S.; Katoh, M.; Özgun, M.; Nagel, E.; Vymazal, J.; Graham, P.B.; et al. MR imaging of thrombi using EP-2104R, a fibrin-specific contrast agent: Initial results in patients. Eur. Radiol. 2008, 18, 1995–2005. [Google Scholar] [CrossRef] [PubMed]
- Vymazal, J.; Spuentrup, E.; Cardenas-Molina, G.; Wiethoff, A.J.; Hartmann, M.G.; Caravan, P.; Parsons, E.C. Thrombus imaging with fibrin-specific gadolinium-based MR Contrast Agent EP-2104R Results of a Phase II Clinical Study of Feasibility. Investig. Radiol. 2009, 44, 697–704. [Google Scholar] [CrossRef] [PubMed]
- Matrisian, L.M. The matrix-degrading metalloproteinases. BioEssays 1992, 14, 455–463. [Google Scholar] [CrossRef]
- Galis, Z.S.; Khatri, J.J. Matrix metalloproteinases in vascular remodeling and atherogenesis: The good, the bad, and the ugly. Circ. Res. 2002, 90, 251–262. [Google Scholar] [CrossRef]
- Lancelot, E.; Amirbekian, V.; Brigger, I.; Raynaud, J.-S.; Ballet, S.; David, C.; Rousseaux, O.; Le Greneur, S.; Port, M.; Lijnen, H.R.; et al. Evaluation of Matrix Metalloproteinases in Atherosclerosis Using a Novel Noninvasive Imaging Approach. Arterioscler. Thromb. Vasc. Biol. 2008, 28, 425–432. [Google Scholar] [CrossRef]
- Hyafil, F.; Vucic, E.; Cornily, J.-C.; Sharma, R.; Amirbekian, V.; Blackwell, F.; Lancelot, E.; Corot, C.; Fuster, V.; Galis, Z.S.; et al. Monitoring of arterial wall remodelling in atherosclerotic rabbits with a magnetic resonance imaging contrast agent binding to matrix metalloproteinases. Eur. Heart J. 2011, 32, 1561–1571. [Google Scholar] [CrossRef]
- Hua, N.; Baik, F.; Pham, T.; Phinikaridou, A.; Giordano, N.; Friedman, B.; Whitney, M.; Nguyen, Q.T.; Tsien, R.Y.; Hamilton, J.A. Identification of high-risk plaques by MRI and fluorescence imaging in a rabbit model of atherothrombosis. PLoS ONE 2015, 10, e0139833. [Google Scholar] [CrossRef]
- Kuge, Y.; Takai, N.; Ogawa, Y.; Temma, T.; Zhao, Y.; Nishigori, K.; Ishino, S.; Kamihashi, J.; Kiyono, Y.; Shiomi, M.; et al. Imaging with radiolabelled anti-membrane type 1 matrix metalloproteinase (MT1-MMP) antibody: Potentials for characterizing atherosclerotic plaques. Eur. J. Nucl. Med. Mol. Imaging 2010, 37, 2093–2104. [Google Scholar] [CrossRef] [PubMed]
- Fujimoto, S.; Hartung, D.; Ohshima, S.; Edwards, D.S.; Zhou, J.; Yalamanchili, P.; Azure, M.; Fujimoto, A.; Isobe, S.; Matsumoto, Y.; et al. Molecular Imaging of Matrix Metalloproteinase in Atherosclerotic Lesions. Resolution With Dietary Modification and Statin Therapy. J. Am. Coll. Cardiol. 2008, 52, 1847–1857. [Google Scholar] [CrossRef]
- Zhang, J.; Nie, L.; Razavian, M.; Ahmed, M.; Dobrucki, L.W.; Asadi, A.; Edwards, D.S.; Azure, M.; Sinusas, A.J.; Sadeghi, M. Molecular imaging of activated matrix metalloproteinases in vascular remodeling. Circulation 2008, 118, 1953–1960. [Google Scholar] [CrossRef] [PubMed]
- Mosterd, A.; Hoes, A.W. Clinical epidemiology of heart failure. Heart 2007, 93, 1137–1146. [Google Scholar] [CrossRef]
- Redfield, M.M.; Jacobsen, S.J.; Burnett, J.C.; Mahoney, D.W.; Bailey, K.R.; Rodeheffer, R.J. Burden of systolic and diastolic ventricular dysfunction in the community: Appreciating the scope of the heart failure epidemic. J. Am. Med. Assoc. 2003, 289, 194–202. [Google Scholar] [CrossRef]
- Bleumink, G.S.; Knetsch, A.M.; Sturkenboom, M.C.J.M.; Straus, S.M.J.M.; Hofman, A.; Deckers, J.W.; Witteman, J.C.M.; Stricker, B.H.C. Quantifying the heart failure epidemic: Prevalence, incidence rate, lifetime risk and prognosis of heart failure—The Rotterdam Study. Eur. Heart J. 2004, 25, 1614–1619. [Google Scholar] [CrossRef]
- Ponikowski, P.; Voors, A.A.; Anker, S.D.; Bueno, H.; Cleland, J.G.F.; Coats, A.J.S.; Falk, V.; González-Juanatey, J.R.; Harjola, V.P.; Jankowska, E.A.; et al. 2016 ESC Guidelines for the diagnosis and treatment of acute and chronic heart failure: The Task Force for the diagnosis and treatment of acute and chronic heart failure of the European Society of Cardiology (ESC). Developed with the special contribution. Eur. J. Heart Fail. 2016, 37, 2129–2200. [Google Scholar] [CrossRef]
- Bashey, R.I.; Martinez-Hernandez, A.; Jimenez, S.A. Isolation, characterization, and localization of cardiac collagen type VI: Associations with other extracellular matrix components. Circ. Res. 1992, 70, 1006–1017. [Google Scholar] [CrossRef]
- Frangogiannis, N.G. The extracellular matrix in myocardial injury, repair, and remodeling. J. Clin. Investig. 2017, 127, 1600–1612. [Google Scholar] [CrossRef]
- Dobaczewski, M.; Gonzalez-Quesada, C.; Frangogiannis, N.G. The extracellular matrix as a modulator of the inflammatory and reparative response following myocardial infarction. J. Mol. Cell. Cardiol. 2010, 48, 504–511. [Google Scholar] [CrossRef]
- Simonetti, O.P.; Finn, J.P.; White, R.D.; Laub, G.; Henry, D.A. “Black blood” T2-weighted inversion-recovery MR imaging of the heart. Radiology 1996, 199, 49–57. [Google Scholar] [CrossRef]
- Verhaert, D.; Thavendiranathan, P.; Giri, S.; Mihai, G.; Rajagopalan, S.; Simonetti, O.P.; Raman, S. V Direct T2 quantification of myocardial edema in acute ischemic injury. JACC Cardiovasc. Imaging 2011, 4, 269–278. [Google Scholar] [CrossRef]
- Bustin, A.; Milotta, G.; Ismail, T.F.; Neji, R.; Botnar, R.M.; Prieto, C. Accelerated free-breathing whole-heart 3D T2 mapping with high isotropic resolution. Magn. Reson. Med. 2020, 83, 988–1002. [Google Scholar] [CrossRef]
- Bull, S.; White, S.K.; Piechnik, S.K.; Flett, A.S.; Ferreira, V.M.; Loudon, M.; Francis, J.M.; Karamitsos, T.D.; Prendergast, B.D.; Robson, M.D.; et al. Human non-contrast T1 values and correlation with histology in diffuse fibrosis. Heart 2013, 99, 932–937. [Google Scholar] [CrossRef]
- Ugander, M.; Bagi, P.S.; Oki, A.J.; Chen, B.; Hsu, L.Y.; Aletras, A.H.; Shah, S.; Greiser, A.; Kellman, P.; Arai, A.E. Myocardial edema as detected by pre-contrast T1 and T2 CMR delineates area at risk associated with acute myocardial infarction. JACC Cardiovasc. Imaging 2012, 5, 596–603. [Google Scholar] [CrossRef]
- Sado, D.M.; White, S.K.; Piechnik, S.K.; Banypersad, S.M.; Treibel, T.; Captur, G.; Fontana, M.; Maestrini, V.; Flett, A.S.; Robson, M.D.; et al. Identification and assessment of anderson-fabry disease by cardiovascular magnetic resonance noncontrast myocardial T1 mapping. Circ. Cardiovasc. Imaging 2013, 6, 392–398. [Google Scholar] [CrossRef]
- Sado, D.M.; Maestrini, V.; Piechnik, S.K.; Banypersad, S.M.; White, S.K.; Flett, A.S.; Robson, M.D.; Neubauer, S.; Ariti, C.; Arai, A.; et al. Noncontrast myocardial T1 mapping using cardiovascular magnetic resonance for iron overload. J. Magn. Reson. Imaging 2015, 41, 1505–1511. [Google Scholar] [CrossRef] [PubMed]
- Miller, C.A.; Naish, J.H.; Bishop, P.; Coutts, G.; Clark, D.; Zhao, S.; Ray, S.G.; Yonan, N.; Williams, S.G.; Flett, A.S.; et al. Comprehensive validation of cardiovascular magnetic resonance techniques for the assessment of myocardial extracellular volume. Circ. Cardiovasc. Imaging 2013, 6, 373–383. [Google Scholar] [CrossRef]
- Kim, R.J.; Wu, E.; Rafael, A.; Chen, E.-L.; Parker, M.A.; Simonetti, O.; Klocke, F.J.; Bonow, R.O.; Judd, R.M. The use of contrast-enhanced magnetic resonance imaging to identify reversible myocardial dysfunction. N. Engl. J. Med. 2000, 343, 1445–1453. [Google Scholar] [CrossRef]
- Hammer-Hansen, S.; Leung, S.W.; Hsu, L.Y.; Wilson, J.R.; Taylor, J.; Greve, A.M.; Thune, J.J.; Køber, L.; Kellman, P.; Arai, A.E. Early Gadolinium Enhancement for Determination of Area at Risk: A Preclinical Validation Study. JACC Cardiovasc. Imaging 2017, 10, 130–139. [Google Scholar] [CrossRef]
- Matsumoto, H.; Matsuda, T.; Miyamoto, K.; Shimada, T.; Mikuri, M.; Hiraoka, Y. Peri-infarct zone on early contrast-enhanced CMR imaging in patients with acute myocardial infarction. JACC Cardiovasc. Imaging 2011, 4, 610–618. [Google Scholar] [CrossRef] [PubMed]
- Matsumoto, H.; Matsuda, T.; Miyamoto, K.; Shimada, T.; Ushimaru, S.; Mikuri, M.; Yamazaki, T. Temporal change of enhancement after gadolinium injection on contrast-enhanced CMR in reperfused acute myocardial infarction. J. Cardiol. 2015, 65, 76–81. [Google Scholar] [CrossRef]
- Helm, P.A.; Caravan, P.; French, B.A.; Jacques, V.; Shen, L.; Xu, Y.; Beyers, R.J.; Roy, R.J.; Kramer, C.M.; Epstein, F.H. Postinfarction myocardial scarring in mice: Molecular MR imaging with use of a collagen-targeting contrast agent. Radiology 2008, 247, 788–796. [Google Scholar] [CrossRef] [PubMed]
- Wildgruber, M.; Bielicki, I.; Aichler, M.; Kosanke, K.; Feuchtinger, A.; Settles, M.; Onthank, D.C.; Cesati, R.R.; Robinson, S.P.; Huber, A.M.; et al. Assessment of myocardial infarction and postinfarction scar remodeling with an elastin-specific magnetic resonance agent. Circ. Cardiovasc. Imaging 2014, 7, 321–329. [Google Scholar] [CrossRef] [PubMed]
- Protti, A.; Lavin, B.; Dong, X.; Lorrio, S.; Robinson, S.; Onthank, D.; Shah, A.M.; Botnar, R.M. Assessment of Myocardial Remodeling Using an Elastin/Tropoelastin Specific Agent with High Field Magnetic Resonance Imaging (MRI). J. Am. Heart Assoc. 2015, 4, e001851. [Google Scholar] [CrossRef]
- Ramos, I.T.; Henningsson, M.; Nezafat, M.; Lavin, B.; Lorrio, S.; Gebhardt, P.; Protti, A.; Eykyn, T.R.; Andia, M.E.; Flögel, U.; et al. Simultaneous Assessment of Cardiac Inflammation and Extracellular Matrix Remodeling after Myocardial Infarction. Circ. Cardiovasc. Imaging 2018, 11, e007453. [Google Scholar] [CrossRef]
- Su, H.; Spinale, F.G.; Dobrucki, L.W.; Song, J.; Hua, J.; Sweterlitsch, S.; Dione, D.P.; Cavaliere, P.; Chow, C.; Bourke, B.N.; et al. Noninvasive targeted imaging of matrix metalloproteinase activation in a murine model of postinfarction remodeling. Circulation 2005, 112, 3157–3167. [Google Scholar] [CrossRef]
- Abas Osman, A.; Ju, W.; Sun, D.; Qi, B. Deep venous thrombosis: A literature review. Int. J. Clin. Exp. Med. 2018, 11, 1551–1561. [Google Scholar]
- Silverstein, M.D.; Heit, J.A.; Mohr, D.N.; Petterson, T.M.; O’Fallon, W.M.; Melton, L.J. Trends in the Incidence of Deep Vein Thrombosis and Pulmonary Embolism. Arch. Intern. Med. 1998, 158, 585. [Google Scholar] [CrossRef]
- Beckman, M.G.; Hooper, W.C.; Critchley, S.E.; Ortel, T.L. Venous Thromboembolism. Am. J. Prev. Med. 2010, 38, S495–S501. [Google Scholar] [CrossRef]
- Bates, S.M.; Ginsberg, J.S. Clinical practice. Treatment of deep-vein thrombosis. N. Engl. J. Med. 2004, 351, 268–277. [Google Scholar] [CrossRef]
- Kahn, S.R.; Hirsch, A.; Shrier, I. Effect of postthrombotic syndrome on health-related quality of life after deep venous thrombosis. Arch. Intern. Med. 2002, 162, 1144–1148. [Google Scholar] [CrossRef] [PubMed]
- Barco, S.; Woersching, A.L.; Spyropoulos, A.C.; Piovella, F.; Mahan, C.E. European Union-28: An annualised cost-of-illness model for venous thromboembolism. Thromb. Haemost. 2016, 115, 800–808. [Google Scholar] [CrossRef] [PubMed]
- Stone, J.; Hangge, P.; Albadawi, H.; Wallace, A.; Shamoun, F.; Knuttien, M.G.; Naidu, S.; Oklu, R. Deep vein thrombosis: Pathogenesis, diagnosis, and medical management. Cardiovasc. Diagn. Ther. 2017, 7, S276–S284. [Google Scholar] [CrossRef]
- Kesieme, E.; Kesieme, C.; Jebbin, N.; Irekpita, E.; DongoKesieme, A. Deep vein thrombosis: A clinical review. J. Blood Med. 2011, 2, 59–69. [Google Scholar] [CrossRef]
- Kahn, S.R.; Ginsberg, J.S. Relationship between Deep Venous Thrombosis and the Postthrombotic Syndrome. Arch. Intern. Med. 2004, 164, 17. [Google Scholar] [CrossRef]
- Raju, S.; Neglén, P. Chronic venous insufficiency and varicose veins. N. Engl. J. Med. 2009, 360, 2319–2327. [Google Scholar] [CrossRef]
- Hoch, R.C.; Schraufstätter, I.U.; Cochrane, C.G. In vivo, in vitro, and molecular aspects of interleukin-8 and the interleukin-8 receptors. J. Lab. Clin. Med. 1996, 128, 134–145. [Google Scholar] [CrossRef]
- Zgheib, C.; Xu, J.; Liechty, K.W. Targeting Inflammatory Cytokines and Extracellular Matrix Composition to Promote Wound Regeneration. Adv. Wound Care 2014, 3, 344–355. [Google Scholar] [CrossRef]
- Olczyk, P.; Mencner, Ł.; Komosinska-Vassev, K. The role of the extracellular matrix components in cutaneous wound healing. Biomed Res. Int. 2014, 2014, 12–14. [Google Scholar] [CrossRef]
- Deatrick, K.B.; Eliason, J.L.; Lynch, E.M.; Moore, A.J.; Dewyer, N.A.; Varma, M.R.; Pearce, C.G.; Upchurch, G.R.; Wakefield, T.W.; Henke, P.K. Vein wall remodeling after deep vein thrombosis involves matrix metalloproteinases and late fibrosis in a mouse model. J. Vasc. Surg. 2005, 42, 140–148. [Google Scholar] [CrossRef]
- Lee, Y.U.; Lee, A.Y.; Humphrey, J.D.; Rausch, M.K. Histological and biomechanical changes in a mouse model of venous thrombus remodeling. Biorheology 2015, 52, 235–245. [Google Scholar] [CrossRef]
- Mukhopadhyay, S.; Johnson, T.A.; Duru, N.; Buzza, M.S.; Pawar, N.R.; Sarkar, R.; Antalis, T.M. Fibrinolysis and inflammation in venous thrombus resolution. Front. Immunol. 2019, 10, 1–14. [Google Scholar] [CrossRef]
- Kearon, C.; Kahn, S.R.; Agnelli, G.; Goldhaber, S.; Raskob, G.E.; Comerota, A.J. Antithrombotic therapy for venous thromboembolic disease: American College of Chest Physicians evidence-based clinical practice guidelines (8th edition). Chest 2008, 133, 454S–545S. [Google Scholar] [CrossRef]
- Comerota, A.J. The ATTRACT trial: Rationale for early intervention for iliofemoral DVT. Perspect. Vasc. Surg. Endovasc. Ther. 2009, 21, 221–225. [Google Scholar] [CrossRef]
- Enden, T.; Sandvik, L.; Kløw, N.E.; Hafsahl, G.; Holme, P.A.; Holmen, L.O.; Ghanima, W.; Njaastad, A.M.; Sandbæk, G.; Slagsvold, C.E.; et al. Catheter-directed Venous Thrombolysis in acute iliofemoral vein thrombosis-the CaVenT Study: Rationale and design of a multicenter, randomized, controlled, clinical trial (NCT00251771). Am. Heart J. 2007, 154, 808–814. [Google Scholar] [CrossRef]
- Cesarman-Maus, G.; Hajjar, K.A. Molecular mechanisms of fibrinolysis. Br. J. Haematol. 2005, 129, 307–321. [Google Scholar] [CrossRef]
- Mirshahi, M.; Soria, J.; Lu, H.; Soria, C.; Samama, M.; Caen, J.P. Defective thrombolysis due to collagen incorporation in fibrin clots. Thromb. Res. 1988, 50, 73–80. [Google Scholar] [CrossRef]
- Moody, A.R. Direct imaging of deep-vein thrombosis with magnetic resonance imaging. Lancet 1997, 350, 1073. [Google Scholar] [CrossRef]
- Saha, P.; Andia, M.E.; Modarai, B.; Blume, U.; Humphries, J.; Patel, A.S.; Phinikaridou, A.; Evans, C.E.; Mattock, K.; Grover, S.P.; et al. Magnetic Resonance T 1Relaxation Time of Venous Thrombus Is Determined by Iron Processing and Predicts Susceptibility to Lysis. Circulation 2013, 128, 729–736. [Google Scholar] [CrossRef]
- Phinikaridou, A.; Andia, M.E.; Saha, P.; Modarai, B.; Smith, A.; Botnar, R.M. In vivo magnetization transfer and diffusion-weighted magnetic resonance imaging detects thrombus composition in a mouse model of deep vein thrombosis. Circ. Cardiovasc. Imaging 2013, 6, 433–440. [Google Scholar] [CrossRef]
- Wu, G.; Morelli, J.; Xiong, Y.; Liu, X.; Li, X. Diffusion weighted cardiovascular magnetic resonance imaging for discriminating acute from non-acute deep venous Thrombus. J. Cardiovasc. Magn. Reson. 2019, 21, 667. [Google Scholar] [CrossRef]
- Chen, H.; He, X.; Xie, G.; Liang, J.; Ye, Y.; Deng, W.; He, Z.; Liu, D.; Li, D.; Liu, X.; et al. Cardiovascular magnetic resonance black-blood thrombus imaging for the diagnosis of acute deep vein thrombosis at 1.5 Tesla. J. Cardiovasc. Magn. Reson. 2018, 20, 1556. [Google Scholar] [CrossRef]
- Andia, M.E.; Saha, P.; Jenkins, J.; Modarai, B.; Wiethoff, A.J.; Phinikaridou, A.; Grover, S.P.; Patel, A.S.; Schaeffter, T.; Smith, A.; et al. Fibrin-Targeted Magnetic Resonance Imaging Allows In Vivo Quantification of Thrombus Fibrin Content and Identifies Thrombi Amenable for Thrombolysis. Arterioscler. Thromb. Vasc. Biol. 2014, 34, 1193–1198. [Google Scholar] [CrossRef]
- Spuentrup, E.; Katoh, M.; Buecker, A.; Fausten, B.; Wiethoff, A.J.; Wildberger, J.E.; Haage, P.; Parsons, E.C.; Botnar, R.M.; Graham, P.B.; et al. Molecular MR Imaging of Human Thrombi in a Swine Model of Pulmonary Embolism Using a Fibrin-Specific Contrast Agent. Investig. Radiol. 2007, 42, 586–595. [Google Scholar] [CrossRef]
- Hara, T.; Bhayana, B.; Thompson, B.; Kessinger, C.W.; Khatri, A.; McCarthy, J.R.; Weissleder, R.; Lin, C.P.; Tearney, G.J.; Jaffer, F.A. Molecular imaging of fibrin deposition in deep vein thrombosis using fibrin-targeted near-infrared fluorescence. JACC Cardiovasc. Imaging 2012, 5, 607–615. [Google Scholar] [CrossRef]
- Blasi, F.; Oliveira, B.L.; Rietz, T.A.; Rotile, N.J.; Naha, P.C.; Cormode, D.P.; Izquierdo-Garcia, D.; Catana, C.; Caravan, P. Multisite Thrombus Imaging and Fibrin Content Estimation With a Single Whole-Body PET Scan in Rats. Arterioscler. Thromb. Vasc. Biol. 2015, 35, 2114–2121. [Google Scholar] [CrossRef]
- Lloyd-Jones, D.; Adams, R.J.; Brown, T.M.; Carnethon, M.; Dai, S.; De Simone, G.; Ferguson, T.B.; Ford, E.; Furie, K.; Gillespie, C.; et al. Heart Disease and Stroke Statistics—2010 Update. Circulation 2010, 121, e46–e215. [Google Scholar]
- NICE. National Institute for Health and Clinical Excellence Overview Endovascular Stents for Abdominal Aortic Aneurysms. 2008. Available online: https://www.nice.org.uk/guidance/ta167/documents/abdominal-aortic-aneurysm-endovascular-stentgrafts-overview2 (accessed on 14 April 2020).
- Sakalihasan, N.; Limet, R.; Defawe, O.D. Abdominal aortic aneurysm. Lancet 2005, 365, 1577–1589. [Google Scholar] [CrossRef]
- Alcorn, H.G.; Wolfson, S.K.; Sutton-Tyrrell, K.; Kuller, L.H.; O’Leary, D. Risk factors for abdominal aortic aneurysms in older adults enrolled in the Cardiovascular Health Study. Arterioscler. Thromb. Vasc. Biol. 1996, 16, 963–970. [Google Scholar] [CrossRef]
- Nevitt, M.P.; Ballard, D.J.; Hallett, J.W. Prognosis of Abdominal Aortic Aneurysms. N. Engl. J. Med. 1989, 321, 1009–1014. [Google Scholar] [CrossRef]
- Hong, H.; Yang, Y.; Liu, B.; Cai, W. Imaging of Abdominal Aortic Aneurysm: The present and the future. Curr. Vasc. Pharmacol. 2010, 8, 808–819. [Google Scholar] [CrossRef]
- Brangsch, J.; Reimann, C.; Collettini, F.; Buchert, R.; Botnar, R.M.; Makowski, M.R. Molecular Imaging of Abdominal Aortic Aneurysms. Trends Mol. Med. 2017, 150–164. [Google Scholar] [CrossRef]
- Botnar, R.M.; Brangsch, J.; Reimann, C.; Janssen, C.H.P.; Razavi, R.; Hamm, B.; Makowski, M.R. In Vivo Molecular Characterization of Abdominal Aortic Aneurysms Using Fibrin-Specific Magnetic Resonance Imaging. J. Am. Heart Assoc. 2018, 7, e007909. [Google Scholar] [CrossRef]
- Erbel, R.; Alfonso, F.; Boileau, C.; Dirsch, O.; Eber, B.; Haverich, A.; Rakowski, H.; Struyven, J.; Radegran, K.; Sechtem, U.; et al. Diagnosis and management of aortic dissection: Recommendations of the Task Force on Aortic Dissection, European Society of Cardiology. Eur. Heart J. 2001, 22, 1642–1681. [Google Scholar] [CrossRef]
- Kadoglou, N.P.; Liapis, C.D. Matrix metalloproteinases: Contribution to pathogenesis, diagnosis, surveillance and treatment of abdominal aortic aneurysms. Curr. Med. Res. Opin. 2004, 20, 419–432. [Google Scholar] [CrossRef]
- Sosa, S.E.Y.; Flores-Pliego, A.; Espejel-Nuñez, A.; Medina-Bastidas, D.; Vadillo-Ortega, F.; Zaga-Clavellina, V.; Estrada-Gutierrez, G. New insights into the role of matrix metalloproteinases in preeclampsia. Int. J. Mol. Sci. 2017, 18, 1448. [Google Scholar] [CrossRef]
- Thompson, R.W.; Parks, W.C. Role of matrix metalloproteinases in abdominal aortic aneurysms. Ann. N. Y. Acad. Sci. 1996, 800, 157–174. [Google Scholar] [CrossRef]
- Hellenthal, F.A.M.V.I.; Buurman, W.A.; Wodzig, W.K.W.H.; Schurink, G.W.H. Biomarkers of AAA progression. Part 1: Extracellular matrix degeneration. Nat. Rev. Cardiol. 2009, 6, 464–474. [Google Scholar] [CrossRef]
- Krettek, A.; Sukhova, G.K.; Libby, P. Elastogenesis in human arterial disease: A role for macrophages in disordered elastin synthesis. Arterioscler. Thromb. Vasc. Biol. 2003, 23, 582–587. [Google Scholar] [CrossRef]
- Botnar, R.M.; Wiethoff, A.J.; Ebersberger, U.; Lacerda, S.; Blume, U.; Warley, A.; Jansen, C.H.P.; Onthank, D.C.; Cesati, R.R.; Razavi, R.; et al. In vivo assessment of aortic aneurysm wall integrity using elastin-specific molecular magnetic resonance imaging. Circ. Cardiovasc. Imaging 2014, 7, 679–689. [Google Scholar] [CrossRef]
- Okamura, H.; Pisani, L.J.; Dalal, A.R.; Emrich, F.; Dake, B.A.; Arakawa, M.; Onthank, D.C.; Cesati, R.R.; Robinson, S.P.; Milanesi, M.; et al. Assessment of elastin deficit in a Marfan mouse aneurysm model using an elastin-specific magnetic resonance imaging contrast agent. Circ. Cardiovasc. Imaging 2014, 7, 690–696. [Google Scholar] [CrossRef]
- Lavin, B.; Lacerda, S.; Andia, M.E.; Lorrio, S.; Bakewell, R.; Smith, A.; Rashid, I.; Botnar, R.M.; Phinikaridou, A. Tropoelastin: An in vivo imaging marker of dysfunctional matrix turnover during abdominal aortic dilation. Cardiovasc. Res. 2019, 116, 995–1005. [Google Scholar] [CrossRef] [PubMed]
- Shimizu, K.; Mitchell, R.N.; Libby, P. Inflammation and cellular immune responses in abdominal aortic aneurysms. Arterioscler. Thromb. Vasc. Biol. 2006, 26, 987–994. [Google Scholar] [CrossRef] [PubMed]
- Abdul-Hussien, H.; Soekhoe, R.G.V.; Weber, E.; von der Thüsen, J.H.; Kleemann, R.; Mulder, A.; van Bockel, J.H.; Hanemaaijer, R.; Lindeman, J.H.N. Collagen degradation in the abdominal aneurysm: A conspiracy of matrix metalloproteinase and cysteine collagenases. Am. J. Pathol. 2007, 170, 809–817. [Google Scholar] [CrossRef] [PubMed]
- Klink, A.; Heynens, J.; Herranz, B.; Lobatto, M.E.; Arias, T.; Sanders, H.M.H.F.; Strijkers, G.J.; Merkx, M.; Nicolay, K.; Fuster, V.; et al. In Vivo Characterization of a New Abdominal Aortic Aneurysm Mouse Model With Conventional and Molecular Magnetic Resonance Imaging. J. Am. Coll. Cardiol. 2011, 58, 2522–2530. [Google Scholar] [CrossRef]
- Satta, J.; Juvonen, T.; Haukipuro, K.; Juvonen, M.; Kairaluoma, M.I. Increased turnover of collagen in abdominal aortic aneurysms, demonstrated by measuring the concentration of the aminoterminal propeptide of type III procollagen in peripheral and aortal blood samples. J. Vasc. Surg. 1995, 22, 155–160. [Google Scholar] [CrossRef]
- Bazeli, R.; Coutard, M.; Duport, B.D.; Lancelot, E.; Corot, C.; Laissy, J.-P.; Letourneur, D.; Michel, J.-B.; Serfaty, J.-M. In Vivo Evaluation of a New Magnetic Resonance Imaging Contrast Agent (P947) to Target Matrix Metalloproteinases in Expanding Experimental Abdominal Aortic Aneurysms. Investig. Radiol. 2010, 45, 662–668. [Google Scholar] [CrossRef]
- Golestani, R.; Razavian, M.; Nie, L.; Zhang, J.; Jung, J.-J.; Ye, Y.; de Roo, M.; Hilgerink, K.; Liu, C.; Robinson, S.P.; et al. Imaging Vessel Wall Biology to Predict Outcome in Abdominal Aortic Aneurysm. Circ. Cardiovasc. Imaging 2015, 8, e002471. [Google Scholar] [CrossRef]


© 2020 by the authors. Licensee MDPI, Basel, Switzerland. This article is an open access article distributed under the terms and conditions of the Creative Commons Attribution (CC BY) license (http://creativecommons.org/licenses/by/4.0/).