Article

Growth and Photosynthetic Response of Capsicum annuum L. in Biochar Amended Soil

Institute of Soil Sciences and Agricultural Chemistry, Centre for Agricultural Research, Herman O. St. 15, 1022 Budapest, Hungary
*
Author to whom correspondence should be addressed.
Appl. Sci. 2020, 10(12), 4111; https://doi.org/10.3390/app10124111
Submission received: 12 May 2020 / Revised: 11 June 2020 / Accepted: 12 June 2020 / Published: 15 June 2020
(This article belongs to the Special Issue Environmental Applications of Biochar)

Abstract

:

Featured Application

Monitoring the effect of biochar application on plant growth using destructive and non-destructive methods.

Abstract

The present study investigated the growth of Capsicum annuum L. (pepper) in an outdoor pot experiment. Changes in the plants’ aboveground and root biomass, leaf area, plant height, stem thickness, and yield, as a response to different doses of biochar amendments were observed. During the 12.5-week-long study, four treatments with biochar amounts of 0, 0.5%, 2.5%, and 5.0% (by weight) were added to silt loam soil. Photochemical responses of plants, the plants photochemical reflectance index (PRI) modified by the different doses of biochar were continuously monitored. Plant height and fruit yield were initially the highest for BC5.0; however, by the end of the experiment, both parameters showed higher values for BC2.5, e.g., 15.9 and 9.1% higher plant height and 32.5 and 22.6% higher fruit yield for BC2.5 and BC5.0 compared to control, respectively. By the end of the experiment the BC2.5 treatments had significantly higher stem thickness (p < 0.001) compared to all other amendments. Root dry matter in biochar treatments increased relative to controls with the highest values (54.9% increase) observed in the BC2.5 treatment. Biochar treatment increased leaf area index (LAI) values for the higher doses (1.58, 1.59, 2.03, and 1.89 for C, BC0.5, BC2.5, and BC5.0, respectively). Significant differences between control and biochar amended soils’ PRI measurements were observed (p < 0.001), showing less plant sensitivity to environmental changes when biochar was applied to the soil. While biochar amendment could greatly enhance plant growth and development, there is an optimal amount of biochar after which additional amount might not result in substantial differences, or even can result in lower fruit yield as found in the present study.

1. Introduction

Biochar is used as soil organic amendment to restore soil health and increase crop yield, especially at areas with degraded soils [1]. Many studies reported on using biochar amendment in soils to improve soil water holding capacity, which can directly cause increase in plant health and productivity [2,3]. Biochar amendment reported to be enhancing root growth, consequently increasing water retention of soils [4]. Even though biochar use in agricultural settings can influence the soil’s biogeochemical properties with or without fertilizer addition [5], its particles can also retain soil nitrogen and supply phosphorous to the plants [6]. As biochar is made of organic materials, in many cases its particles might contain larger amounts of additional nutrients, which can be released into the soil through increased cation retention [7] that can be available for plants to use. However, nutrients from biochar might not be immediately available to plants, as nutrient availability in biochar depends on the environmental parameters and soil type [8]. While potassium (K) availability in biochar is typically high [9], most of the nitrogen is present as heterocyclic nitrogen in biochar, which also partially available for plants [8]. Therefore, biochar amendments might be used to lower the amount of synthetic fertilizer [10].
Several studies investigated the effects of biochar on plant growth, biomass production, and crop or fruit yield [11], including Capsicum annuum L. (pepper plants) [12,13,14]. Even though many studies demonstrated increases in biomass and yield production as a result of biochar addition to soils [15], negative secondary effects could be observed, such as reduced plant defense against insects or pathogens [16]. Furthermore, several reports noted no significant changes in crop yield, or fruit production, depending on the types and dose of applied biochar [17,18,19,20]. Based on these effects, prior to field application, the intended biochar should be investigated to determine the economically most feasible amount and type to be used.
Remote sensing measurements for determining vegetation indices as a nondestructive technique can be very useful in plant studies. Very good correlations between destructive and nondestructive methods could result in the decrease of destructive techniques and increase in remote sensing for gathering data fast with large investigated area. He et al. [21] investigated different techniques to measure leaf area index (LAI) including a destructive method and two instruments representing nondestructive techniques. The authors found that the instruments provided similar results to the destructive method with 75% or more accuracy. Therefore plant canopy studies should be primarily applying nondestructive techniques if possible.
Measurements of vegetation reflectance can be used to analyze plant response to changes in environmental conditions such as irrigation [22]. LAI and photosynthetically active radiation (PAR) are parameters characterizing plant canopies and its changes [23]. Biochar can result changes in the leaf area of a plant, or of the canopy expressed in leaf area index, which can be an indicator for changes in overall biomass production and possible crop yield. There is a strong relationship between LAI and fraction of absorbed PAR (fAPAR) [24], and both LAI and fAPAR can be used to investigate canopy processes [25]. Normally, there is an optimal dose of biochar or biochar plus fertilizer that need to be added to the soil to result in the highest plant growth and crop/grain yield. However, when outside of this optimal range, such as very high biochar dose present in the soils, reduced canopy and LAI might be observed [18].
Biochar addition can have significant effects on crop photosynthetic activities [26] especially coupling with other environmental parameters such as water availability. Continuously measured with spectral sensors, the photochemical reflectance index (PRI) can be used to evaluate changes in leaf reflectance as a result of water related stress [27]. At low light intensity high PRI can be expected as most light is being utilized by the plants, while at high light intensities the PRI decreases [28]. Therefore, the effects of biochar on the plants’ light use efficiency can be estimated by continuously measuring PRI. While biochar related studies increased in recent decades especially in agricultural systems, there are very limited studies available in literature on evaluating canopy response to biochar using spectral sensors, such as PRI.
Gaining more information on the effects of biochar on crop growth and functioning can contribute to more effective decision making processes of biochar application in agricultural systems. This paper is mainly focusing on plant responses to different amount of biochar amendments in silt loam soil under field conditions using discrete and continuous measurements. Therefore, the key objectives of this study were (i) to examine the impact of biochar addition on canopy structural properties of plant height, stem thickness, leaf area, and overall biomass production (comprising root and aboveground dry matter), concurrent with fruit yield; and (ii) to determine the photosynthetic and photochemical response of Capsicum annuum L. growth in biochar amended soils based on fAPAR and PRI data. We hypothesized that changes in the soil’s chemical and physical parameters as a result of biochar amendment will be detectable on the plants’ photochemical and photosynthetic responses. Findings of the present study can help better understand the changes in the soil–plant–water system as a result of biochar application.

2. Materials and Methods

2.1. Soil Physical and Chemical Parameters, and Collection Site Information

The present study is a part of a more complex study investigating the effects of biochar addition to soil’s biological, chemical, and physical parameters [29,30].
Soil samples were collected from a freshly tilled, agricultural field. The samples were collected from the upper 28 cm (46.92936° N, 17.67033° E) on June 5, 2016, and homogenized thoroughly prior to using in the experiment to ensure each plant will have the same soil chemical and physical parameters per treatment. The annual average precipitation for the area is 604 mm, the average annual temperature is 10.9 °C, and the average wind speed is 3 m s−1 [31].
The ca. Alfisol soil (USDA) was consisting of mainly silt (55.97%) and sand (23.85%; Table 1). The soil used was silty loam with 26.5% (±3.7) volumetric water content at the time of sample collection and experimental setup. The volumetric water contents (VWC) were determined by oven drying soil samples (24 h; 105 °C) of a known volume. Particle size distribution was determined using the sieve-pipette method (Table 1).
Prior to experimental setup, the specific soil characteristics were analyzed using standard wet chemical techniques and their results are summarized in Table 1. During the experiment (11 June–4 September 2016) the average daily temperature was 24.9 °C, with the lowest of 11.8 °C and the highest of 27.6 °C. The total amount of natural precipitation was 89.6 mm. As the amount of precipitation was less than it was needed for the plants to grow, additional plant watering was performed with the equivalent of 7 mm rainfall per irrigation, which occurred 21 times during the experiment. With the irrigation water the total of 248.8 mm water was received by the plants over the course of the study. Irrigation frequency was determined based on visual inspections of the plants, performing at the same time late afternoon. Further information on how the precipitation and irrigation events were occurring are described by Horel et al. [30].

2.2. Biochar Used in the Experiment

Commercially available biochar was bought for the experiment, having a European Biochar Certificate (EBC) ensuring similar physical and chemical characteristics for different batches. According to the manufacturer (SonnenErde Gmbh, Riedlingsdorf, Austria), the biochar was made from wood chips, fiber sludge, and grain husks using Pyreg-reactor technology at 600 °C. The physical and chemical analyses of the biochar used here is presented in Table 1.

2.3. Experimental Design

Four treatments, i.e., control (C), BC0.5, BC2.5, and BC5.0, were investigated in 7 replicates planted in the soil at the start of the experiment. BC0.5, BC2.5, and BC5.0 received 0.5%, 2.5%, and 5.0% biochar by weight, respectively. Control treatments received no biochar addition. The chosen amounts were determined based on earlier laboratory experiments and literature review [17,32], indicating a small (0.5%), a medium (2.5%), and a relatively large (5.0%) amendment amount.
Plants were grown from seeds for several weeks prior to the experiment. After the pepper plants reached the four leaf stage, seedlings subsequently were placed into pots (with dimensions of 14 cm in height and an 18 cm diameter with a drain outlet) to ensure minimizing plant growth differences prior to treatments. Each pots received two plants, where each treatments included the total plant numbers of 14, with ensuring that similar plant height and development phase were present in all treatments. All pots included 2 kg of soil (dry weight). Fertilizer (N:P:K of 20:20:20 in a concentration equal to 400 mg kg−1 soil [33], manufacturer Elixir Zorka, Šabac, Serbia) was added to the soil during the third week of the experiment to eliminate nutrient limitations over the course of the study.
At the beginning of the experiment, a PAR sensor (Apogee Instruments) was placed at 2 m above the ground (above investigated plant canopy) and the information was used as reference PAR data of radiation reaching the leaf surface. Within each treatments a PAR sensor was placed between plant replicates ensuring same distance from plant stems for all treatments (Figure 1). This setup resulted in continuous measurements of the response of four partial plants per treatment. From the measured PAR values we calculated the fraction of the absorbed PAR (fAPAR) as a difference of the hemispherical and below canopy radiation flux over the below canopy radiation flux [34]. The PAR and consequently the fAPAR values were used as supplementary data for the LAI measurements. Data, which might have been influenced by shadows from nearby trees were omitted and we only used sunshine hours when all below and above plant canopy sensors could receive the same amount of sunlight. Photon flux values are presented in µmol m−2 s.
Spectral reflectance sensor of PRI (Decagon Devices; measuring 532 and 570 nm spectral irradiance) were included in the experimental setup approximately four weeks after the beginning of the study. One hemispherical sensor was placed 2 m above ground, and three PRI sensors (field view) were placed at the same distance (45 cm, resulting in a 23 cm by 16 cm radii continuous leaf reflectance measurements with the total area of 0.11 m2) from two plant replicates’ meeting point in terms to collect data on entering and reflecting the 532 and 570 nm wavelength of the sunlight (Figure 1). With the replicates, portions of four plants and their response to environmental changes were monitored continuously for the control, BC2.5, and BC5.0 treatments. For BC0.5 data was not obtainable. The experimental setup schematics of plants and sensors is shown in Figure 1, including the used instrumentation and treatment placements.
The PRI values were calculated based on Gamon et al. [35] using the following equation:
PRI = P r / P i 532 nm P r / P i 570 nm P r / P i 532 nm + P r / P i 570 nm
where Pr represents the field stop lens sensor for reflected radiation from the canopy, while Pi the hemispherical sensor for incident radiation values. The uncorrected reflectance values (Pr/Pi) were calculated for each wavebands (532 and 570 nm) and used to calculate uncorrected PRI. Daily variations of VWC (v/v) were measured using soil moisture sensors (5TM Decagon Devices) and used to correlate with PRI values at lower and higher VWC values.
From the collected data, midday PRI and PAR values were used, meaning that measurements prior from 10 am and after 1 pm were omitted to ensure no shadows from other plants influenced the collected data. Afterwards, these daily values (21 measurements per treatment) were averaged prior to further analysis.

2.4. Plant Root Mass, Growth Stages, and Leaf Area Determination

Selected pots were disassembled at week 3, 6, 10, and 12 to study the changes in plant growth and development, with special interest to plant root, stem, and leaf dry mass to calculate above- and belowground biomass, fruit yield, and leaf area over time. From the selected pots at week 3, 6, and 10 two plants per treatment (one pot), while at week 12 eight plants per treatment (four pots) were disassembled and measured their total aboveground and plant root dry mass. The plants’ leaf areas were also measured separately for all plants, from which the plants’ leaf area indexes (LAI) were calculated. The direct measurement methods are considered to be the most accurate [36], therefore leaf area per plants were determined using a Delta-T Scan leaf area scanner (Delta-T Devices). The scanner was calibrated to leaf shape prior to each analyses. The pot setup of the experiment enabled us to fully investigate plant root. They were carefully washed off from any soil and biochar particles above 0.8 mm sieve and were placed in the oven. Stem and leaf dry weight was measured after oven drying at 70 °C until the weights got constant.
Plant growth measurements such as stem diameter and plant height were measured weekly for all plants to analyze the extent of average growth changes between different treatments. From the second week of the experiment, plant flowers and flower buds were counted weekly. Capsicum annuum L. yield was cut and collected at week 10 for the disassembled pots and at the end of the experiment (W12), which fresh weight were measured immediately and dry weight masses after oven drying at 70 °C until the weights got constant.

2.5. Statistical Analyses

A one-way ANOVA application was used to analyze the data and repeated measure ANOVA for plant height and stem thickness, using either STATISTICA 13 software or the software package R (version 3.6.3). Tukey’s HSD test was used to further analyze significant interactions within groups. Statistical significance of the data sets was determined at p < 0.05. Error is reported as standard deviation.

3. Results

3.1. Vegetative and Reproductive Plant Growth

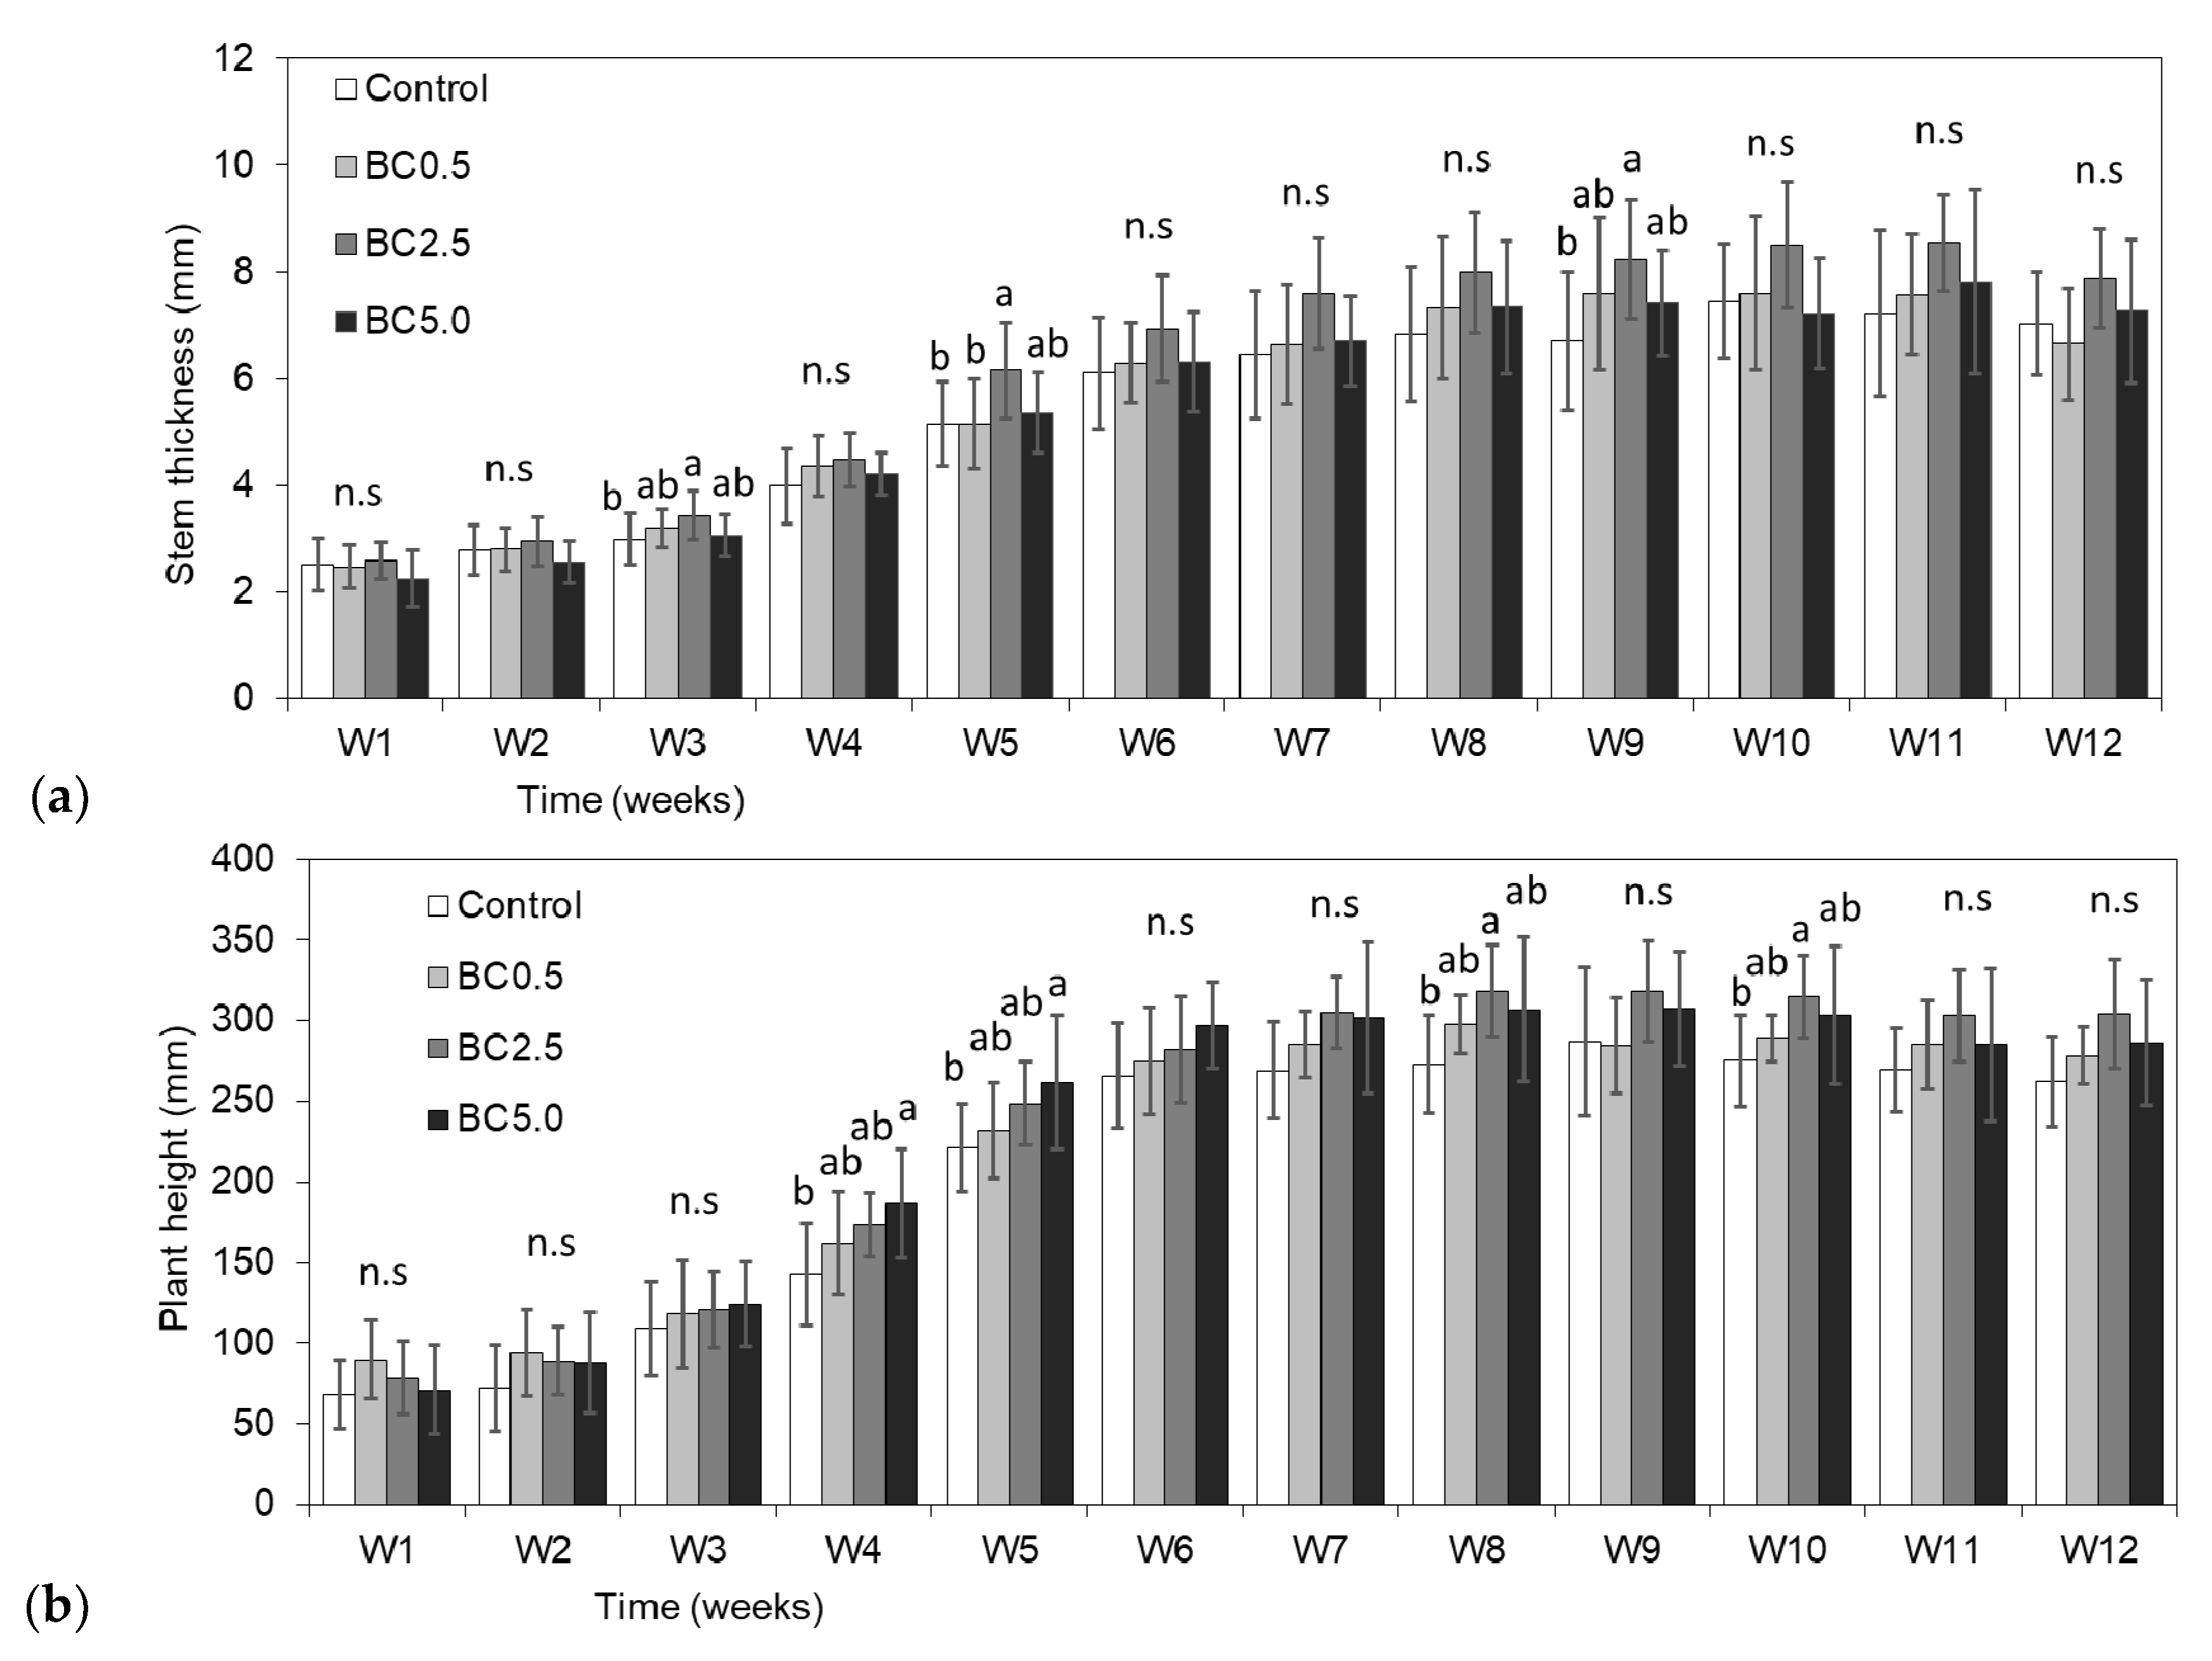
As an indicator for plant growth stem thickness and plant height were monitored. Stem thickness values were increasing at rates between 0.24 (control) and 0.42 mm d−1 (BC2.5), representing statistically significant changes between the control and BC2.5 treatments (p < 0.001). Plant height measurements were varying between 1.4 (control) and 2.66 mm d−1 (BC5.0; Table 2). The plant growth showed an exponential increase in all treatments until week 6, where the growth slowed down reaching a plateau (Figure 2a) at a time when the fruit growth took place. Even though biochar addition showed larger plant height and stem thickness values, the amount of biochar added to the soil showed no linear response, e.g., BC2.5 treatment had the highest average values during plant development at the end of the experiment. Increasing biochar amount resulted in significant differences in plant height between treatments until 2.5% of biochar addition, while stem thickness only showed significant differences between BC2.5 and all other treatments (Table 2). Soil pH can influence the growth of pepper plants, with optimal pH values ranging between 6 and 8. In the present study the soil pH was slightly alkaline for all treatment (average pH of 7.81, 8.06, 8.16, and 8.15 for C, BC0.5, BC2.5, and BC5.0, respectively), indicating similar plant growth effects among treatments.
Based on the 12 weeks averages, BC2.5 treatments showed 15.44% higher stem thickness compared to control treatment, while BC0.5 and BC5.0 had 3.77 and 3.56% increases, respectively. These changes showed no substantial influence on stem thickness of low or high biochar additions to the silt loam soil. When comparing plant heights during the overall experimental period, BC2.5 and BC5.0 treatments had 13.58 and 12.10% increase, while BC0.5 had only 6.98% increase in height compared to controls. These results show that biochar addition helped plant growth during the growing phase; however, after 6 weeks all plants reached a plateau value and the difference between treatments were kept relatively constant (Figure 2).
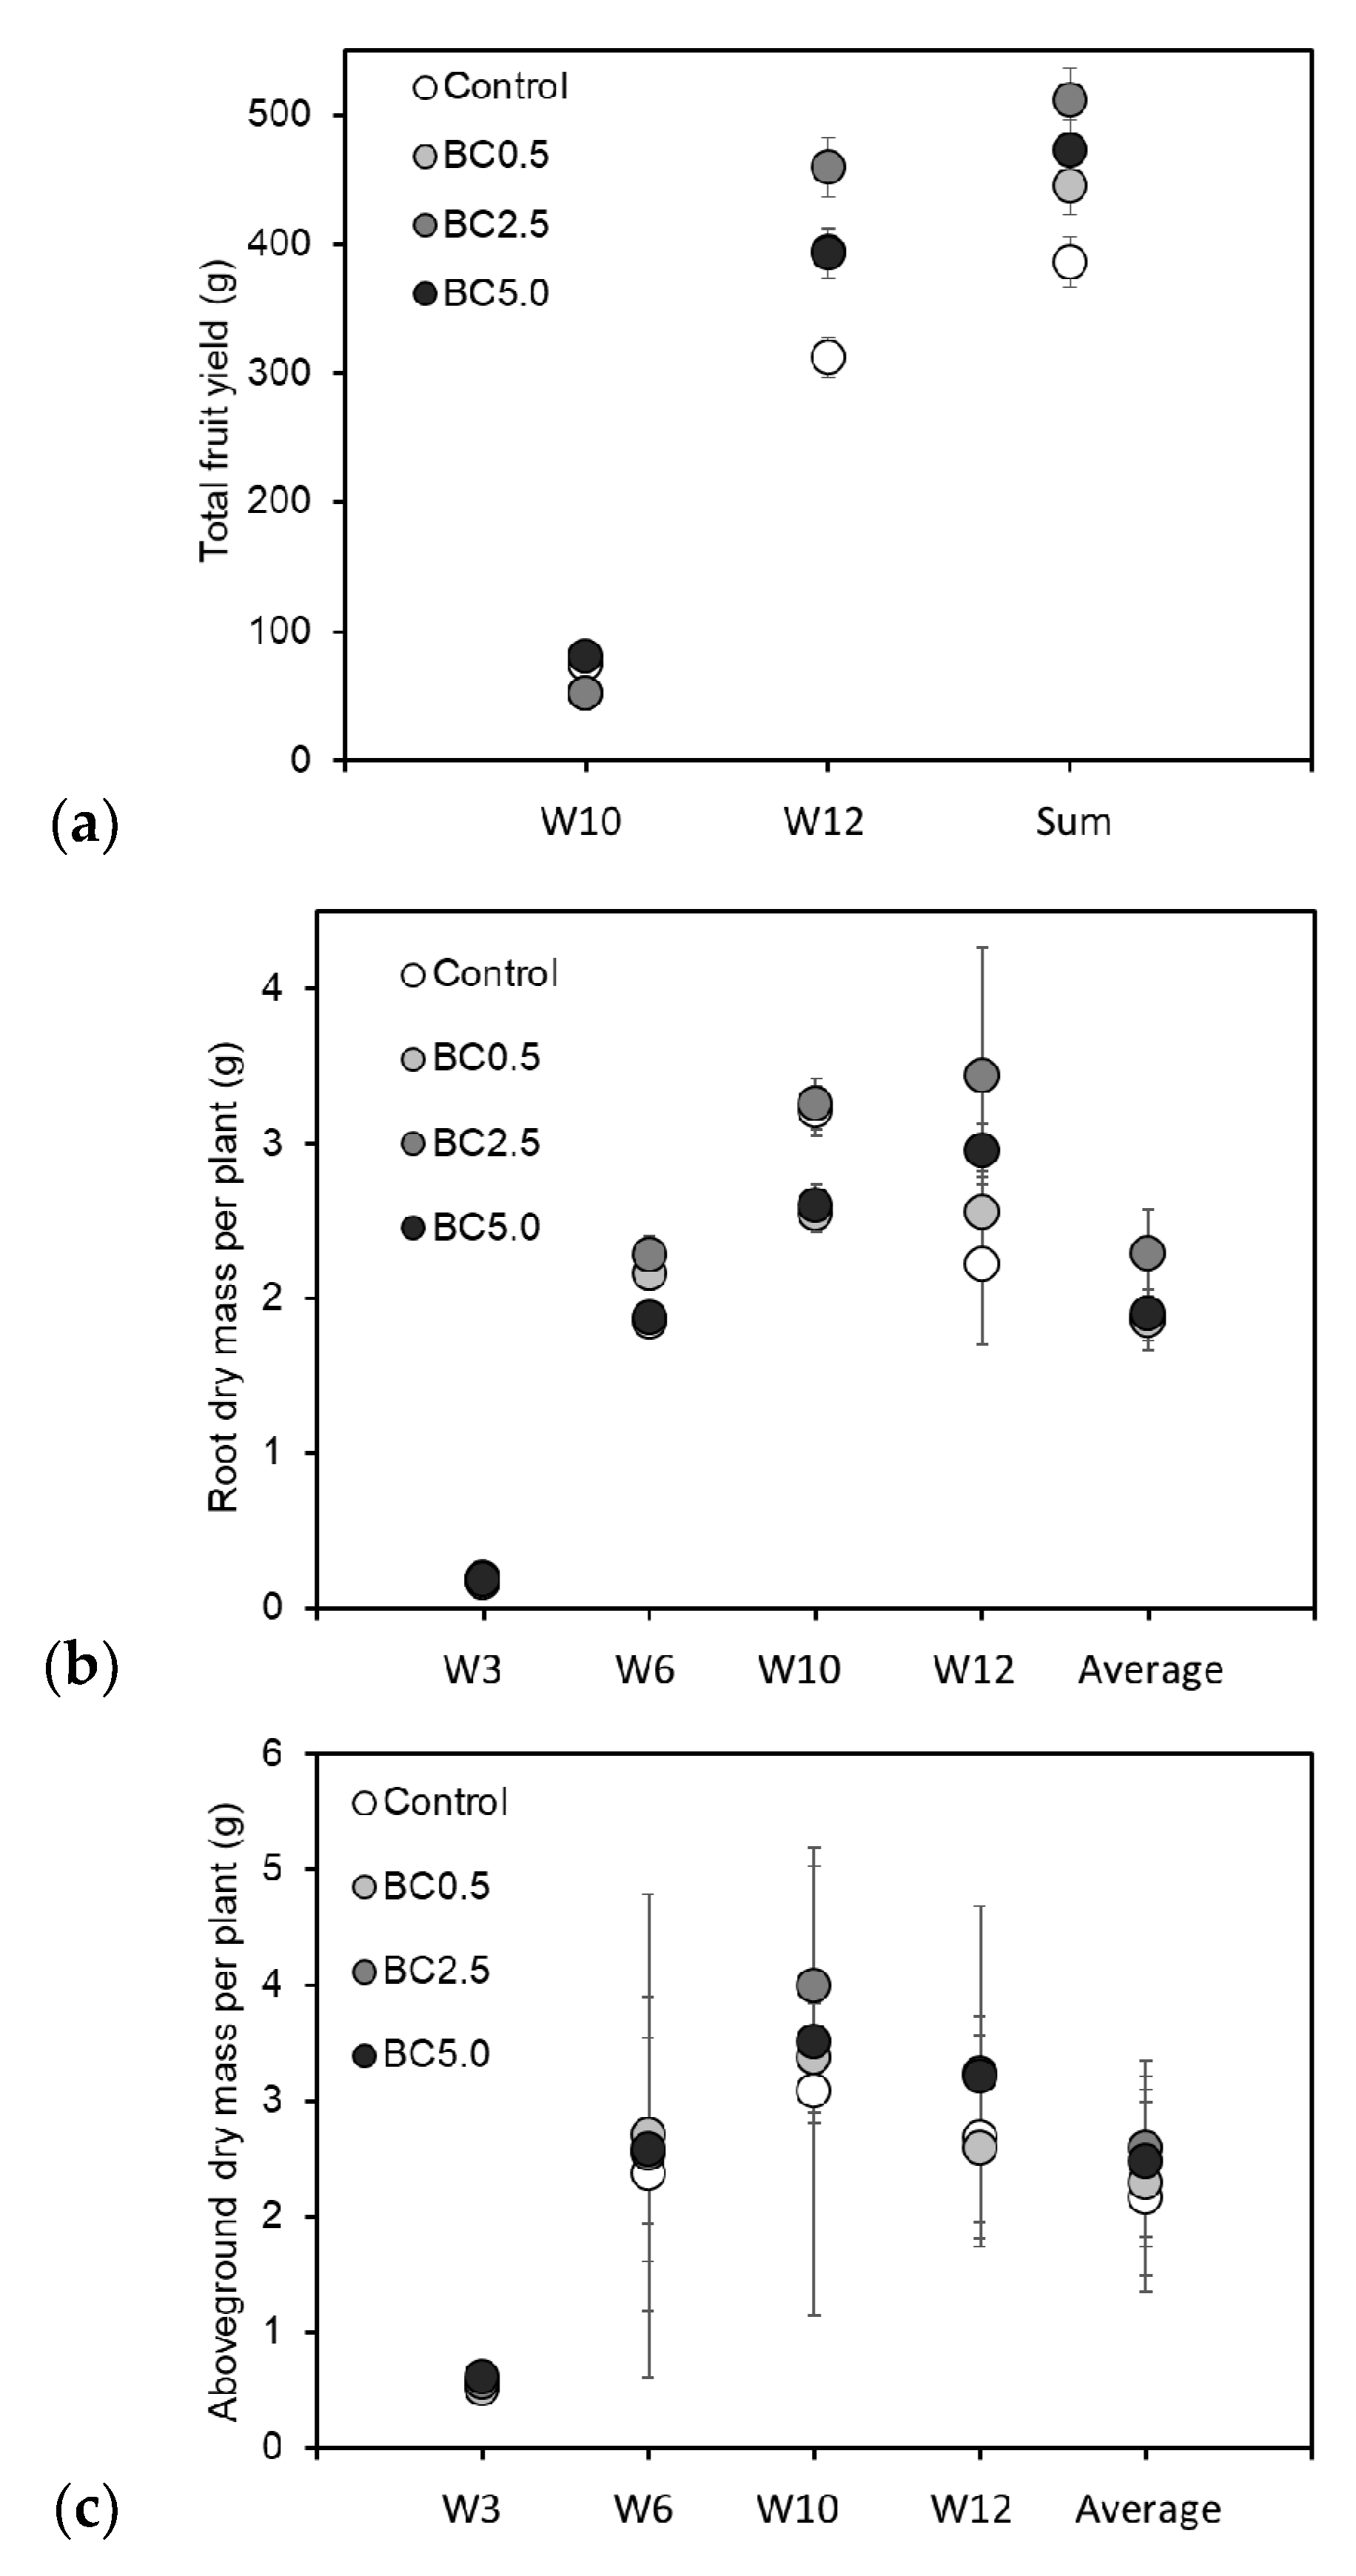
Bud development and flowering started around the second and third weeks of the experiment, and fruit development were observed after the 6th week. During the course of the study, no significant differences were observed between bud/flower numbers for the different treatments (p > 0.05). The highest value of fruit yield was observed for the BC5.0 earlier in the experiment (W10), while later at W12 and overall during the experiment in the case of BC2.5 treatment (Figure 3a).
Increasing root biomass was highly correlated to the increased aboveground biomass (R2 = 0.927). In general, strong correlations were observed between the investigated plant parameters as shown in Table 3. The weight of the roots showed similar results to the aboveground biomass data, the BC2.5 had the highest value with 45.5% increase compared to control, although, BC5.0 and BC0.5 also had higher root dry weight compared to control (20.0 and 8.1%, respectively, Figure 3b). During the third and 6th weeks of the experiment, similar total aboveground biomass (stem plus leaves) values were observed for the different treatments with the highest increase of 13.5% between BC5.0 and the control and 14.1% between BC0.5 and the control, respectively (Figure 3c). At later weeks, substantial increase in biomass dry weight were observed, especially for BC2.5, where 29.7% higher values were measured compared to control (Figure 3c). However, there were no significant differences observed in the overall values between treatments (p > 0.05; Table 2).

3.2. LAI and PRI Changes over Time

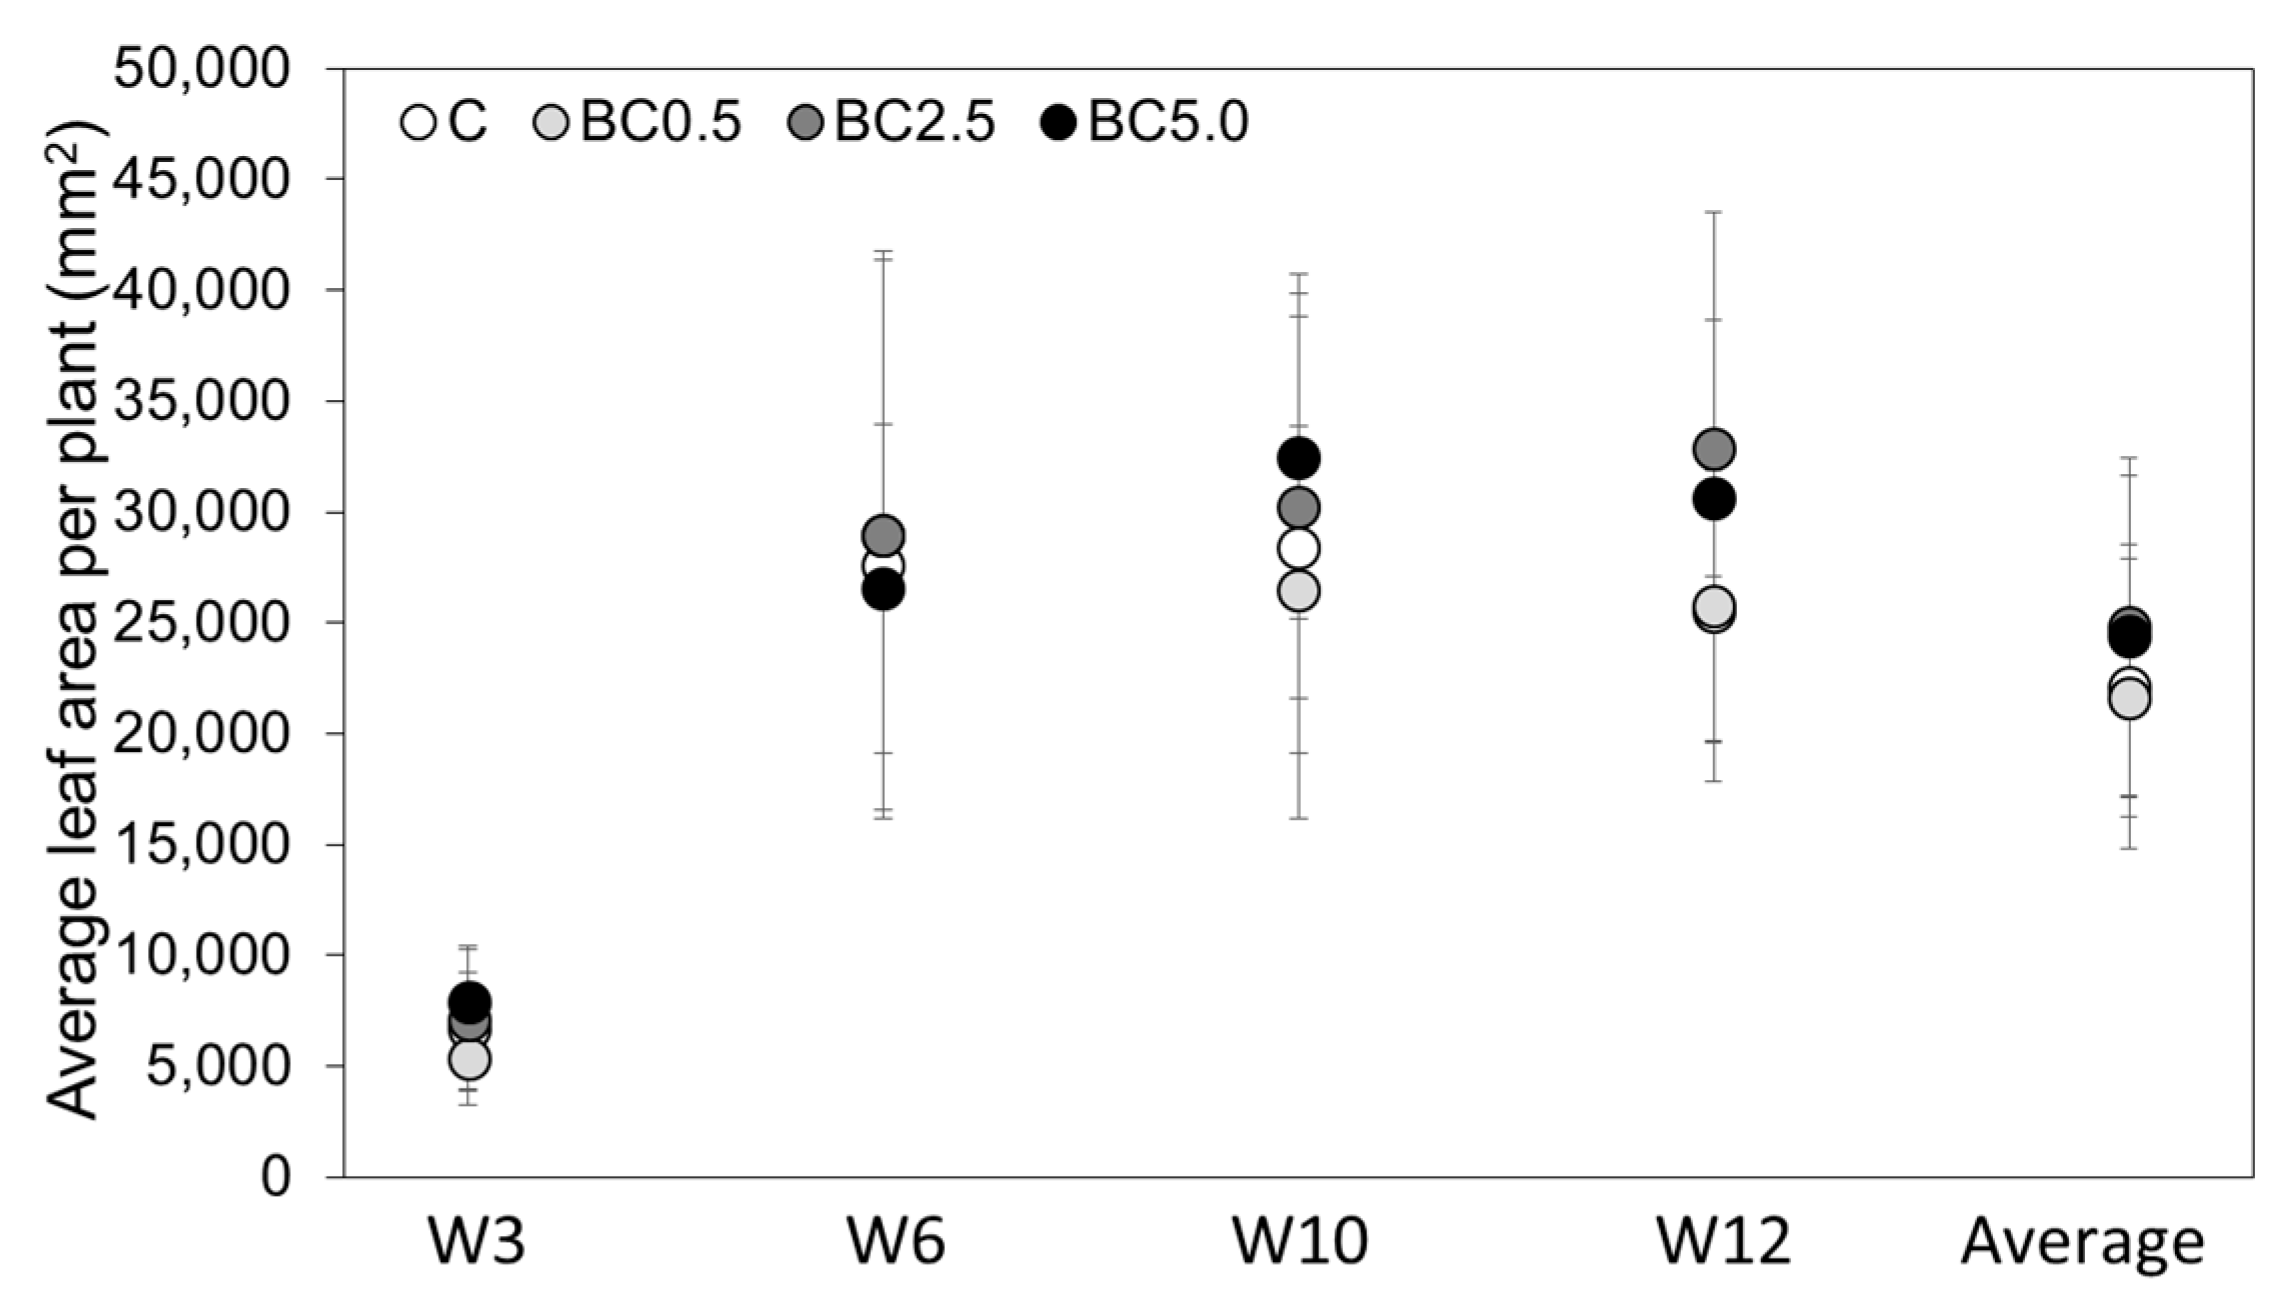
The data collected on the investigated pepper plants during the experiment showed that the average highest leaf area per plant was measured in the case of BC2.5 treatment (Figure 4). During the first 6 weeks of the experiment, plant growth was substantial, the time at which plant flowering and fruit production began. Statistically significant differences were observed for the treatments between the third and 10th week of the study (p < 0.05), while the LAI values between week 6 and 10 did not show significant differences (p > 0.05; Figure 4). Through the first part of the study, control treatments showed similar growth compared with other treatments; however, by the end of week 12 the lowest leaf areas were observed in the case of control. Average leaf area measurements showed that BC2.5 and BC5.0 had similarly high values (Figure 4) with no significant differences between them at the end of the experiment (p > 0.05). At the same time, BC0.5 had approximately 12% lower leaf areas than the control. The calculated average LAI at the end of the experiment were the following: 1.58, 1.59, 2.03, and 1.89 for control, BC0.5, BC2.5, and BC5.0, respectively (n = 8). However, during earlier plant development stages, higher biochar amendment (BC5.0) also resulted in the highest LAI (Figure 4).
In this study we found that BC2.5 treatment was unique in terms of leaf area per plant as it could continuously grow until W12. It is in consistency with the findings that stem thickness and plant height were also larger in this treatment; consequently the total plant biomass as well.
Continuous monitoring of the amount of light transferred to the ground using PAR sensors showed that during the first few weeks of the plant growth, there were no differences between plants, especially when only a few leaves might have provided shadows to the sensors causing changes in the measured PAR values. Therefore, data from the first few weeks are demonstrative information only. However, at later weeks, very distinctive changes were observed (Figure 5), resulting in significant differences between the treatments (p < 0.05) for the PAR and fAPAR values. While this measurement technique only provide insight to the light reaching the ground, the destructive method, where all leaves were measured separately, offers more precise LAI values. Both measurements resulted in similar outcomes, biochar addition to the soils increased the LAI of the pepper plants compared to control.
Although transmitted radiation data was collected from 4 partial plant canopies per treatment, the calculated intercepted radiation values were in consistency with destructively measured LAI values for all plants, hence both methods can be used to estimate relative changes in plant response to different treatments.
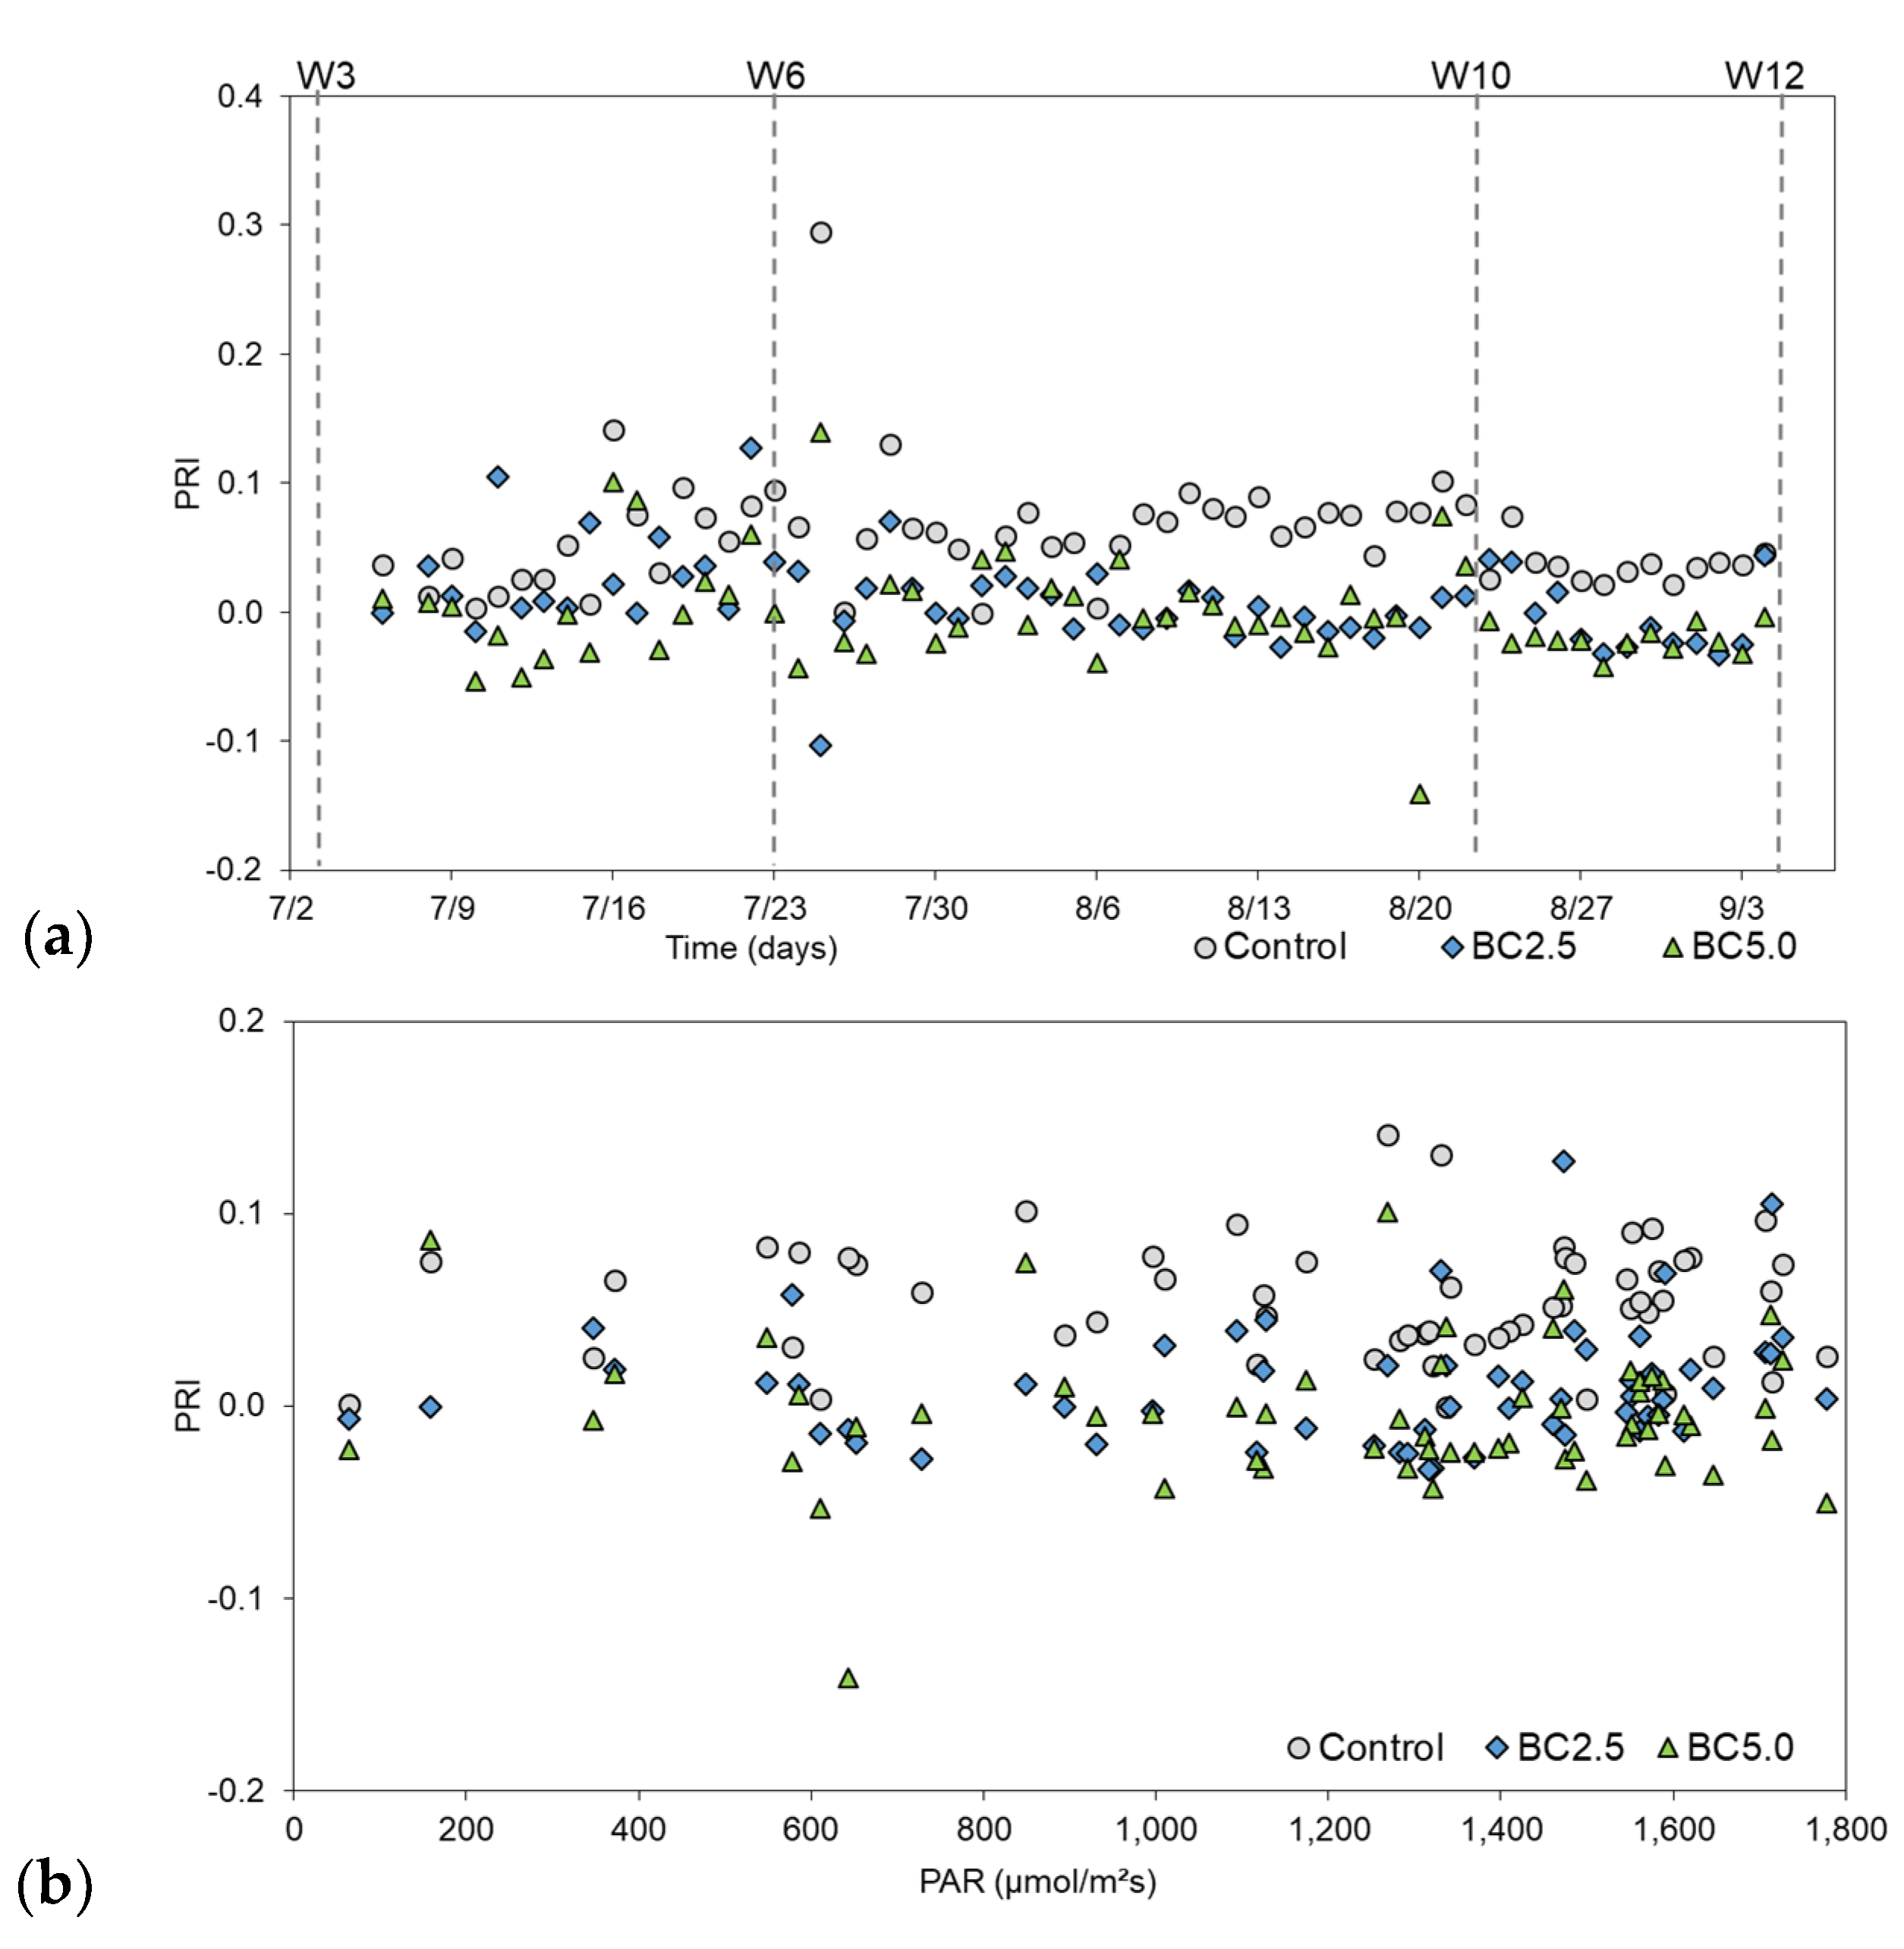
The PRI value, which might reflect the stress response from the plants mainly to drought or nitrogen deficiency [37], showed lower values for both BC2.5 and BC5.0 treatment compared to control during the entire measuring time (from week 4 through 12; Figure 6a). The differences between the treatments and control were significant (p < 0.001), indicating changes in light use efficiency when biochar is used in excess amount. However, the difference between BC2.5 and BC5.0 was not significant (p > 0.05). The relationships between the different treatments’ PAR and PRI values were investigated (Figure 6b), and we did not find an effect of increasing amount of PAR on the PRI values.
Water related stress in the present study only included high water amount, which could pond on the soil surface. Silt loam soil after compaction can slow water movement through the soil matrix [38], which was visually observable after larger precipitation events in the present study. However, these larger precipitation events (>15 mm d−1) occurred only four times during the experiment, while drought conditions could be occurring more often without frequent irrigation [30]. We found weak correlations between soil water content and PRI measurements (Figure 7), however these values were not significant. For better understanding the relationship between PRI and water or other environmentally related stress for biochar amended soils, further studies should be implemented specifically investigating longer-term drought and/or flooding conditions.

4. Discussion

Biochar addition can result in increased plant biomass, especially in leaves [39]; however, the amount of biochar added to the soil also influence biomass production rates. Rondon et al. [39] found that up to 60 g biochar per kg soil could increase the biomass production by 39%, while 90 g biochar per kg soil showed similar biomass production as the control treatments. This finding is similar to the present study’s finding, as BC5.0 showed a somewhat less amount of biomass compared to BC2.5 treatment by the end of the experiment. However in the present experiment the high biochar addition did not decrease biomass production, instead still substantial differences were observed compared to control at specific sampling times (Figure 3). The findings of biochar effects on plant growth and fruit production emphasize the necessity for optimization to local parameters prior to biochar addition to soils. Currently there are many studies without consistent data on the effectiveness of biochar amended soils to crop and fruit yield. Tammeorg et al. [40] found no significant effects of biochar on canopy growth of spring wheat, nor yield components. Similarly, Carvalho et al. [18] observed no distinct effect of biochar on rice grain yield. On the other hand, Njoku et al. [41] noted significantly higher plant height, leaf area index, and grain yield for maize grown in biochar amended soils.
Fluctuations in PRI can be used as an indicator of changes in photosynthetic dynamics and gross primary production (GPP) [37]. PRI can be used as a proxy of light use efficiency (LUE), also can be used to complement normalized difference vegetation index (NDVI) to estimate GPP [42,43]. The midday average PRI values were consistently higher for the control compared to BC2.5 and BC5.0 treatments in the present study, which could indicate LUE changes as influenced by biochar addition. The midday PRI values tend to be more sensitive to water stress than earlier in the morning or later afternoon measurements [44], thus better providing values of changes in PRI. Our measurements were chosen in this time frame, expecting the largest differences between treatments.
Strong relationship between PAR and PRI values can be observed for water stressed plants [27]. However, in the present study, increasing PAR did not change significantly the PRI values, although longer drought conditions were disabled by watering the plants. The results of the relationships between these parameters highly depend on the research environment, different types of plants or experimental setup, such as laboratory or field-scale study might result different outcomes. Strong relationship was observed between PRI and PAR values by Merlier et al. [45], while investigating different tree canopies. Our results were comparable at higher PAR values (>400 µmol m−2 s−1), where a plateau in the values was occurring. In general, at all PAR ranges the PRI were highest for the control treatment, indicating potentially higher sensitivity for water or other environmentally related stress for the control plants.
Biochar amendment to improve the water holding capacities of a given soil, especially for sandy soils, have been widely investigated during the last few decades [46,47]. Several studies observed that biochar amendment can substantially affect soil moisture levels [26,48], which can be available for plants to grow. However, no significant effects on soil moisture were noted in many studies depending on the type and/or amount of biochar added to the soils [49,50]. In the present experiment natural rainfall was adjusted with watering when it seemed necessary to minimize drought stress to the pepper plants; nevertheless, the pot setup could increase evaporation concurrent with fasten soil temperature changes as a response to air temperature fluctuations. The present study disabled longer time periods where the plants could be investigated for either drought or flooded conditions. The short-term changes were still similar in all biochar amended treatments. This finding indicates fast recovery of the pepper plants soon after the water content in the soil is within optimal range again.
Using PRI as a water-stress index has been proposed by several researchers, however with caution, such that PRI can be influenced by the age of plant leaves [27]. Because our study used same aged pepper plants, differences between PRI values were assumed to be either water-stress or pot size constrain related. Thenot et al. [27] found that water-stressed plant’s PRI can increase when drought effects were investigated. Also, the better utilization of the available nitrogen forms by plants can be implied by the lower spectral values for the biochar treated plants, as it was found by Ronga et al. [51]. Though, the authors also found that biochar alone could increase PRI values for tomato plants. In the present study the control treatments showed the highest PRI, which might indicate higher plant sensitivity for changes in water or nutrient conditions compared to biochar amendment to soils. However, to better understand the complex effects of biochar amendment on plant response and crop/fruit yield, more nutrient and water-stress related studies should be implemented and investigated using non-destructive methods such as remote sensing.
The present experiment showed that addition of biochar to silty loam soil can help plant growth; however, plant stem thickness and height showed only marginal differences to biochar amendment. During this study we used pots for the experiment, which had limited spaces for plant root growth and water holding as water could flow through the bottom of the pots, especially during the first weeks of the experiment. These boundaries could stress the plants, showing similar stress response from all treated plants, such as early drops of flowers or pepper buds.

5. Conclusions

In general, our data showed that after early influence on plant growth, too low (0.5%) or too high (5.0%) biochar addition to the soil has diminishing effects on plant (Capsicum annuum) development and yield over time. At the end of the experiment, BC2.5 had 22.2%, while BC0.5 and BC5.0 showed 17.4 and 15.7% increase in yield weight, respectively, compared to controls suggesting optimal biochar amendment range for best fruit yield. Leaf areas of Capsicum annuum L. in low biochar added soil showed minimal difference to control treatment, while BC2.5 treatment had the most distinguishable effects. Early in the plant development process, the highest biochar addition resulted in the highest LAI, while later BC2.5 showed increased values, highlighting reducing positive effects on a longer term. The collected data also showed that plants growing on biochar treated soil have generally lower PRI values compared to control treatment. Overall, our findings emphasize how even small changes in the soil can have an extensive impact on plant growth and development. The additional knowledge gained from the present study can be used to further implement continuous monitoring of plant health without using destructive techniques, consequently taking the necessary actions to minimize negative effects on crop/fruit yield.

Author Contributions

Conceptualization, Á.H. and K.P.; methodology, K.P. and Á.H.; formal analysis, Á.H. and K.P.; resources, E.T.; data curation, Á.H. and K.P.; writing—original draft preparation, K.P., Á.H. and E.T.; writing—review and editing, Á.H., K.P. and E.T.; project administration, Á.H.; funding acquisition, E.T. and Á.H. All authors have read and agreed to the published version of the manuscript.

Funding

This research was funded by the National Research, Development and Innovation Office—NKFIH grant number OTKA 116157, OTKA 131792, OTKA 116084, and by the Széchenyi 2020 program, the European Regional Development Fund and the Hungarian Government (GINOP-2.3.2-15-2016-00028). The APC was funded by OTKA 131792 and OTKA 116084.

Conflicts of Interest

The authors declare no conflict of interest.

References

  1. Liu, X.; Zhang, A.; Ji, C.; Joseph, S.; Bian, R.; Li, L.; Pan, G.; Paz-Ferreiro, J. Biochar’s effect on crop productivity and the dependence on experimental conditions—A meta-analysis of literature data. Plant Soil 2013, 373, 583–594. [Google Scholar] [CrossRef]
  2. Akhtar, S.S.; Li, G.; Neumann Andersen, M.; Liu, F. Biochar enhances yield and quality of tomato under reduced irrigation. Agric. Water Manag. 2014, 138, 37–44. [Google Scholar] [CrossRef]
  3. Githinji, L. Effect of biochar application rate on soil physical and hydraulic properties of a sandy loam. Arch. Agron. Soil Sci. 2014, 60, 457–470. [Google Scholar] [CrossRef]
  4. Bruun, E.W.; Petersen, C.T.; Hansen, E.; Holm, J.K.; Hauggaard-Nielsen, H. Biochar amendment to coarse sandy subsoil improves root growth and increases water retention. Soil Use Manag. 2014, 30, 109–118. [Google Scholar] [CrossRef]
  5. Ulyett, J.; Sakrabani, R.; Kibblewhite, M.; Hann, M. Impact of biochar addition on water retention, nitrification and carbon dioxide evolution from two sandy loam soils. Eur. J. Soil Sci. 2014, 65, 96–104. [Google Scholar] [CrossRef]
  6. Prendergast-Miller, M.T.; Duvall, M.; Sohi, S.P. Biochar–root interactions are mediated by biochar nutrient content and impacts on soil nutrient availability. Eur. J. Soil Sci. 2014, 65, 173–185. [Google Scholar] [CrossRef]
  7. Nelson, N.O.; Agudelo, S.C.; Yuan, W.; Gan, J. Nitrogen and phosphorus availability in biochar-amended soils. Soil Sci. Soc. Am. J. 2011, 176, 218–226. [Google Scholar] [CrossRef]
  8. Gunarathne, V.; Mayakaduwa, S.; Vithanage, M. Biochar’s influence as a soil amendment for essential plant nutrient uptake. In Essential Plant Nutrients: Uptake, Use Efficiency, and Management; Naeem, M., Ansari, A.A., Gill, S.S., Eds.; Springer International Publishing: Cham, Switzerland, 2017; pp. 47–67. [Google Scholar]
  9. Lehmann, J.; Kern, D.; German, L.; Mccann, J.; Martins, G.C.; Moreira, A. Soil fertility and production potential. In Amazonian Dark Earths: Origin Properties Management; Lehmann, J., Kern, D.C., Glaser, B., Wodos, W.I., Eds.; Springer: Dordrecht, The Netherlands, 2003; pp. 105–124. [Google Scholar]
  10. Ding, Y.; Liu, Y.; Liu, S.; Huang, X.; Li, Z.; Tan, X.; Zeng, G.; Zhou, L. Potential benefits of biochar in agricultural soils: A review. Pedosphere 2017, 27, 645–661. [Google Scholar] [CrossRef]
  11. Biederman, L.A.; Harpole, W.S. Biochar and its effects on plant productivity and nutrient cycling: A meta-analysis. GCB Bioenergy 2013, 5, 202–214. [Google Scholar] [CrossRef]
  12. Akça, M.; Namli, A. Effects of poultry litter biochar on soil enzyme activities and tomato, pepper and lettuce plants growth. Eurasian J. Soil Sci. 2015, 4, 161–168. [Google Scholar] [CrossRef] [Green Version]
  13. Gravel, V.; Dorais, M.; Menard, C. Organic potted plants amended with biochar: Its effect on growth and Pythium colonization. Can. J. Plant Sci. 2013, 93, 1217–1227. [Google Scholar] [CrossRef]
  14. Harel, Y.M.; Kolton, M.; Elad, Y.; Rav-David, D.; Cytryn, E.; Borenshtein, M.; Shulchani, R.; Graber, E.R. Biochar impact on plant development and disease resistance in pot trials. IOBC/WPRS Bull. 2012, 78, 141–147. [Google Scholar]
  15. Dao, T.T.; Canh, N.T.; Trach, N.X.; Preston, T.R. Effect of different sources of biochar on growth of maize in sandy and feralite soils. Livest. Res. Rural Dev. 2013, 25, #59. Available online: http://www.lrrd.org/lrrd25/4/dao25059.htm (accessed on 3 October 2019).
  16. Viger, M.; Hancock, R.D.; Miglietta, F.; Taylor, G. More plant growth but less plant defence? First global gene expression data for plants grown in soil amended with biochar. GCB Bioenergy 2015, 7, 658–672. [Google Scholar] [CrossRef]
  17. Alburquerque, J.A.; Calero, J.M.; Barrón, V.; Torrent, J.; del Campillo, M.C.; Gallardo, A.; Villar, R. Effects of biochars produced from different feedstocks on soil properties and sunflower growth. J. Plant Nutr. Soil Sci. 2014, 177, 16–25. [Google Scholar] [CrossRef]
  18. Carvalho, M.T.M.; Madari, B.E.; Bastiaans, L.; van Oort, P.A.J.; Heinemann, A.B.; da Silva, M.A.S.; Maia, A.H.N.; Meinke, H. Biochar improves fertility of a clay soil in the Brazilian Savannah: Short term effects and impact on rice yield. J. Agric. Rural Dev. Trop. Subtrop. 2013, 114, 101–107. [Google Scholar]
  19. Jeffery, S.; Abalos, D.; Prodana, M.; Bastos, A.C.; van Groenigen, J.W.; Hungate, B.A.; Verheijen, F. Biochar boosts tropical but not temperate crop yields. Environ. Res. Lett. 2017, 12, 053001. [Google Scholar] [CrossRef]
  20. Jeffery, S.; Abalos, D.; Spokas, K.A.; Verheijen, F.G.A. Biochar effects on crop yield. In Biochar for Environmental Management: Science and Technology, 2nd ed.; Lehmann, J., Joseph, S., Eds.; Earthscan: London, UK, 2015; pp. 301–326. [Google Scholar]
  21. He, Y.; Guo, X.; Wilmshurst, J.F. Comparison of different methods for measuring leaf area index in a mixed grassland. Can. J. Plant Sci. 2007, 87, 803–813. [Google Scholar] [CrossRef]
  22. Aparicio, N.; Villegas, D.; Casadesus, J.; Araus, J.L.; Royo, C. Spectral vegetation indices as nondestructive tools for determining durum wheat yield. Agron. J. 2000, 92, 83–91. [Google Scholar] [CrossRef]
  23. Mõttus, M.; Sulev, M.; Baret, F.; Lopez-Lozano, R.; Reinart, A. Photosynthetically Active Radiation: Measurement and Modeling In Encyclopedia of Sustainability Science and Technology; Meyers, R.A., Ed.; Springer: New York, NY, USA, 2012; pp. 7902–7932. [Google Scholar]
  24. Zhou, X.; Zhu, Q.; Tang, S.; Chen, X.; Wu, M. Interception of PAR and relationship between FPAR and LAI in summer maize canopy. In Proceedings of the IEEE International Geoscience and Remote Sensing Symposium, Toronto, ON, Canada, 24–28 June 2002; Volume 3256, pp. 3252–3254. [Google Scholar]
  25. Mougin, E.; Demarez, V.; Diawara, M.; Hiernaux, P.; Soumaguel, N.; Berg, A. Estimation of LAI, fAPAR and fCover of Sahel rangelands (Gourma, Mali). Agric. For. Meteorol. 2014, 198, 155–167. [Google Scholar] [CrossRef]
  26. Haider, G.; Koyro, H.-W.; Azam, F.; Steffens, D.; Müller, C.; Kammann, C. Biochar but not humic acid product amendment affected maize yields via improving plant-soil moisture relations. Plant Soil 2015, 395, 141–157. [Google Scholar] [CrossRef]
  27. Thenot, F.; Méthy, M.; Winkel, T. The photochemical reflectance index (PRI) as a water-stress index. Int. J. Remote Sens. 2002, 23, 5135–5139. [Google Scholar] [CrossRef]
  28. Barton, C.V.M.; North, P.R.J. Remote sensing of canopy light use efficiency using the photochemical reflectance index: Model and sensitivity analysis. Remote Sens. Environ. 2001, 78, 264–273. [Google Scholar] [CrossRef]
  29. Horel, Á.; Barna, G.; Makó, A. Soil physical properties affected by biochar addition at different plant phaenological phases. Part I. Int. Agrophys. 2019, 33, 255–262. [Google Scholar] [CrossRef]
  30. Horel, Á.; Tóth, E.; Gelybó, G.; Dencső, M.; Farkas, C. Biochar amendment affects soil water and CO2 regime during Capsicum annuum plant growth. Agronomy 2019, 9, 58. [Google Scholar] [CrossRef] [Green Version]
  31. Dövényi, Z. Magyarország kistájainak katasztere (in Hungarian); MTA Földrajztudományi Kutatóintézet: Budapest, Hungary, 2010; p. 876. [Google Scholar]
  32. Lim, T.J.; Spokas, K.A.; Feyereisen, G.; Novak, J.M. Predicting the impact of biochar additions on soil hydraulic properties. Chemosphere 2016, 142, 136–144. [Google Scholar] [CrossRef]
  33. Schon, M.K.; Compton, M.P.; Bell, E.; Burns, I. Nitrogen concentrations affect pepper yield and leachate nitrate-nitrogen from Rockwool culture. HortScience 1994, 48, 1241–1249. [Google Scholar] [CrossRef]
  34. Monteith, J.L. Climatic variation and the growth of crops. Q. J. R. Meteorol. Soc. 1981, 107, 749–774. [Google Scholar] [CrossRef]
  35. Gamon, J.A.; Kovalchuck, O.; Wong, C.Y.S.; Harris, A.; Garrity, S.R. Monitoring seasonal and diurnal changes in photosynthetic pigments with automated PRI and NDVI sensors. Biogeosciences 2015, 12, 4149–4159. [Google Scholar] [CrossRef] [Green Version]
  36. Pokovai, K.; Fodor, N. Adjusting ceptometer data to improve leaf area index measurements. Agronomy 2019, 9, 866. [Google Scholar] [CrossRef] [Green Version]
  37. Zhang, C.; Filella, I.; Garbulsky, M.F.; Peñuelas, J. Affecting factors and recent improvements of the photochemical reflectance index (PRI) for remotely sensing foliar, canopy and ecosystemic radiation-use efficiencies. Remote Sens. 2016, 8, 677. [Google Scholar] [CrossRef] [Green Version]
  38. Makó, A.; Barna, G.; Horel, A. Soil physical properties affected by biochar addition at different plant phenological phases II. Int. Agrophys. 2020, 1, 1–7. [Google Scholar] [CrossRef]
  39. Rondon, M.A.; Lehmann, J.; Ramírez, J.; Hurtado, M. Biological nitrogen fixation by common beans (Phaseolus vulgaris L.) increases with bio-char additions. Biol. Fertil. Soils 2007, 43, 699–708. [Google Scholar] [CrossRef]
  40. Tammeorg, P.; Simojoki, A.; Mäkelä, P.; Stoddard, F.L.; Alakukku, L.; Helenius, J. Short-term effects of biochar on soil properties and wheat yield formation with meat bone meal and inorganic fertiliser on a boreal loamy sand. Agric. Ecosyst. Environ. 2014, 191, 108–116. [Google Scholar] [CrossRef]
  41. Njoku, C.; Mbah, C.N.; Igboji, P.O.; Nwite, J.N.; Chibuike, C.C.; Uguru, B.N. Effect of biochar on selected soil physical properties and maize yield in an ultisol in Abakaliki southeastern Nigeria. Glob. Adv. Res. J. Agric. Sci. 2015, 4, 864–870. [Google Scholar]
  42. Peñuelas, J.; Garbulsky, M.F.; Filella, I. Photochemical reflectance index (PRI) and remote sensing of plant CO2 uptake. New Phytol. 2011, 191, 596–599. [Google Scholar] [CrossRef]
  43. Rahimzadeh-Bajgiran, P.; Munehiro, M.; Omasa, K. Relationships between the photochemical reflectance index (PRI) and chlorophyll fluorescence parameters and plant pigment indices at different leaf growth stages. Photosynth. Res. 2012, 113, 261–271. [Google Scholar] [CrossRef]
  44. Xu, S.; Liu, Z.; Zhao, L.; Zhao, H.; Ren, S. Diurnal response of sun-induced fluorescence and PRI to water stress in maize using a near-surface remote sensing platform. Remote Sens. 2018, 10, 1510. [Google Scholar] [CrossRef] [Green Version]
  45. Merlier, E.; Hmimina, G.; Dufrêne, E.; Soudani, K. Explaining the variability of the photochemical reflectance index (PRI) at the canopy-scale: Disentangling the effects of phenological and physiological changes. J. Photochem. Photobiol. B Biol. 2015, 151, 161–171. [Google Scholar] [CrossRef]
  46. Abel, S.; Peters, A.; Trinks, S.; Schonsky, H.; Facklam, M.; Wessolek, G. Impact of biochar and hydrochar addition on water retention and water repellency of sandy soil. Geoderma 2013, 202, 183–191. [Google Scholar] [CrossRef]
  47. Karhu, K.; Mattila, T.; Bergström, I.; Regina, K. Biochar addition to agricultural soil increased CH4 uptake and water holding capacity—Results from a short-term pilot field study. Agric. Ecosyst. Environ. 2011, 140, 309–313. [Google Scholar] [CrossRef]
  48. Horel, Á.; Tóth, E.; Gelybó, G.; Dencső, M.; Potyó, I. Soil CO2 and N2O emission drivers in a vineyard (Vitis vinifera) under different soil management systems and amendments. Sustainability 2018, 10, 1811. [Google Scholar] [CrossRef] [Green Version]
  49. Hardie, M.; Clothier, B.; Bound, S.; Oliver, G.; Close, D. Does biochar influence soil physical properties and soil water availability? Plant Soil 2014, 376, 347–361. [Google Scholar] [CrossRef]
  50. Novak, J.M.; Busscher, W.J.; Watts, D.W.; Amonette, J.E.; Ippolito, J.A.; Lima, I.M.; Gaskin, J.; Das, K.C.; Steiner, C.; Ahmedna, M.; et al. Biochars impact on soil-moisture storage in an Ultisol and two Aridisols. Soil Sci. 2012, 177, 310–320. [Google Scholar] [CrossRef] [Green Version]
  51. Ronga, D.; Caradonia, F.; Parisi, M.; Bezzi, G.; Parisi, B.; Allesina, G.; Pedrazzi, S.; Francia, E. Using digestate and biochar as fertilizers to improve processing tomato production sustainability. Agronomy 2020, 10, 138. [Google Scholar] [CrossRef] [Green Version]
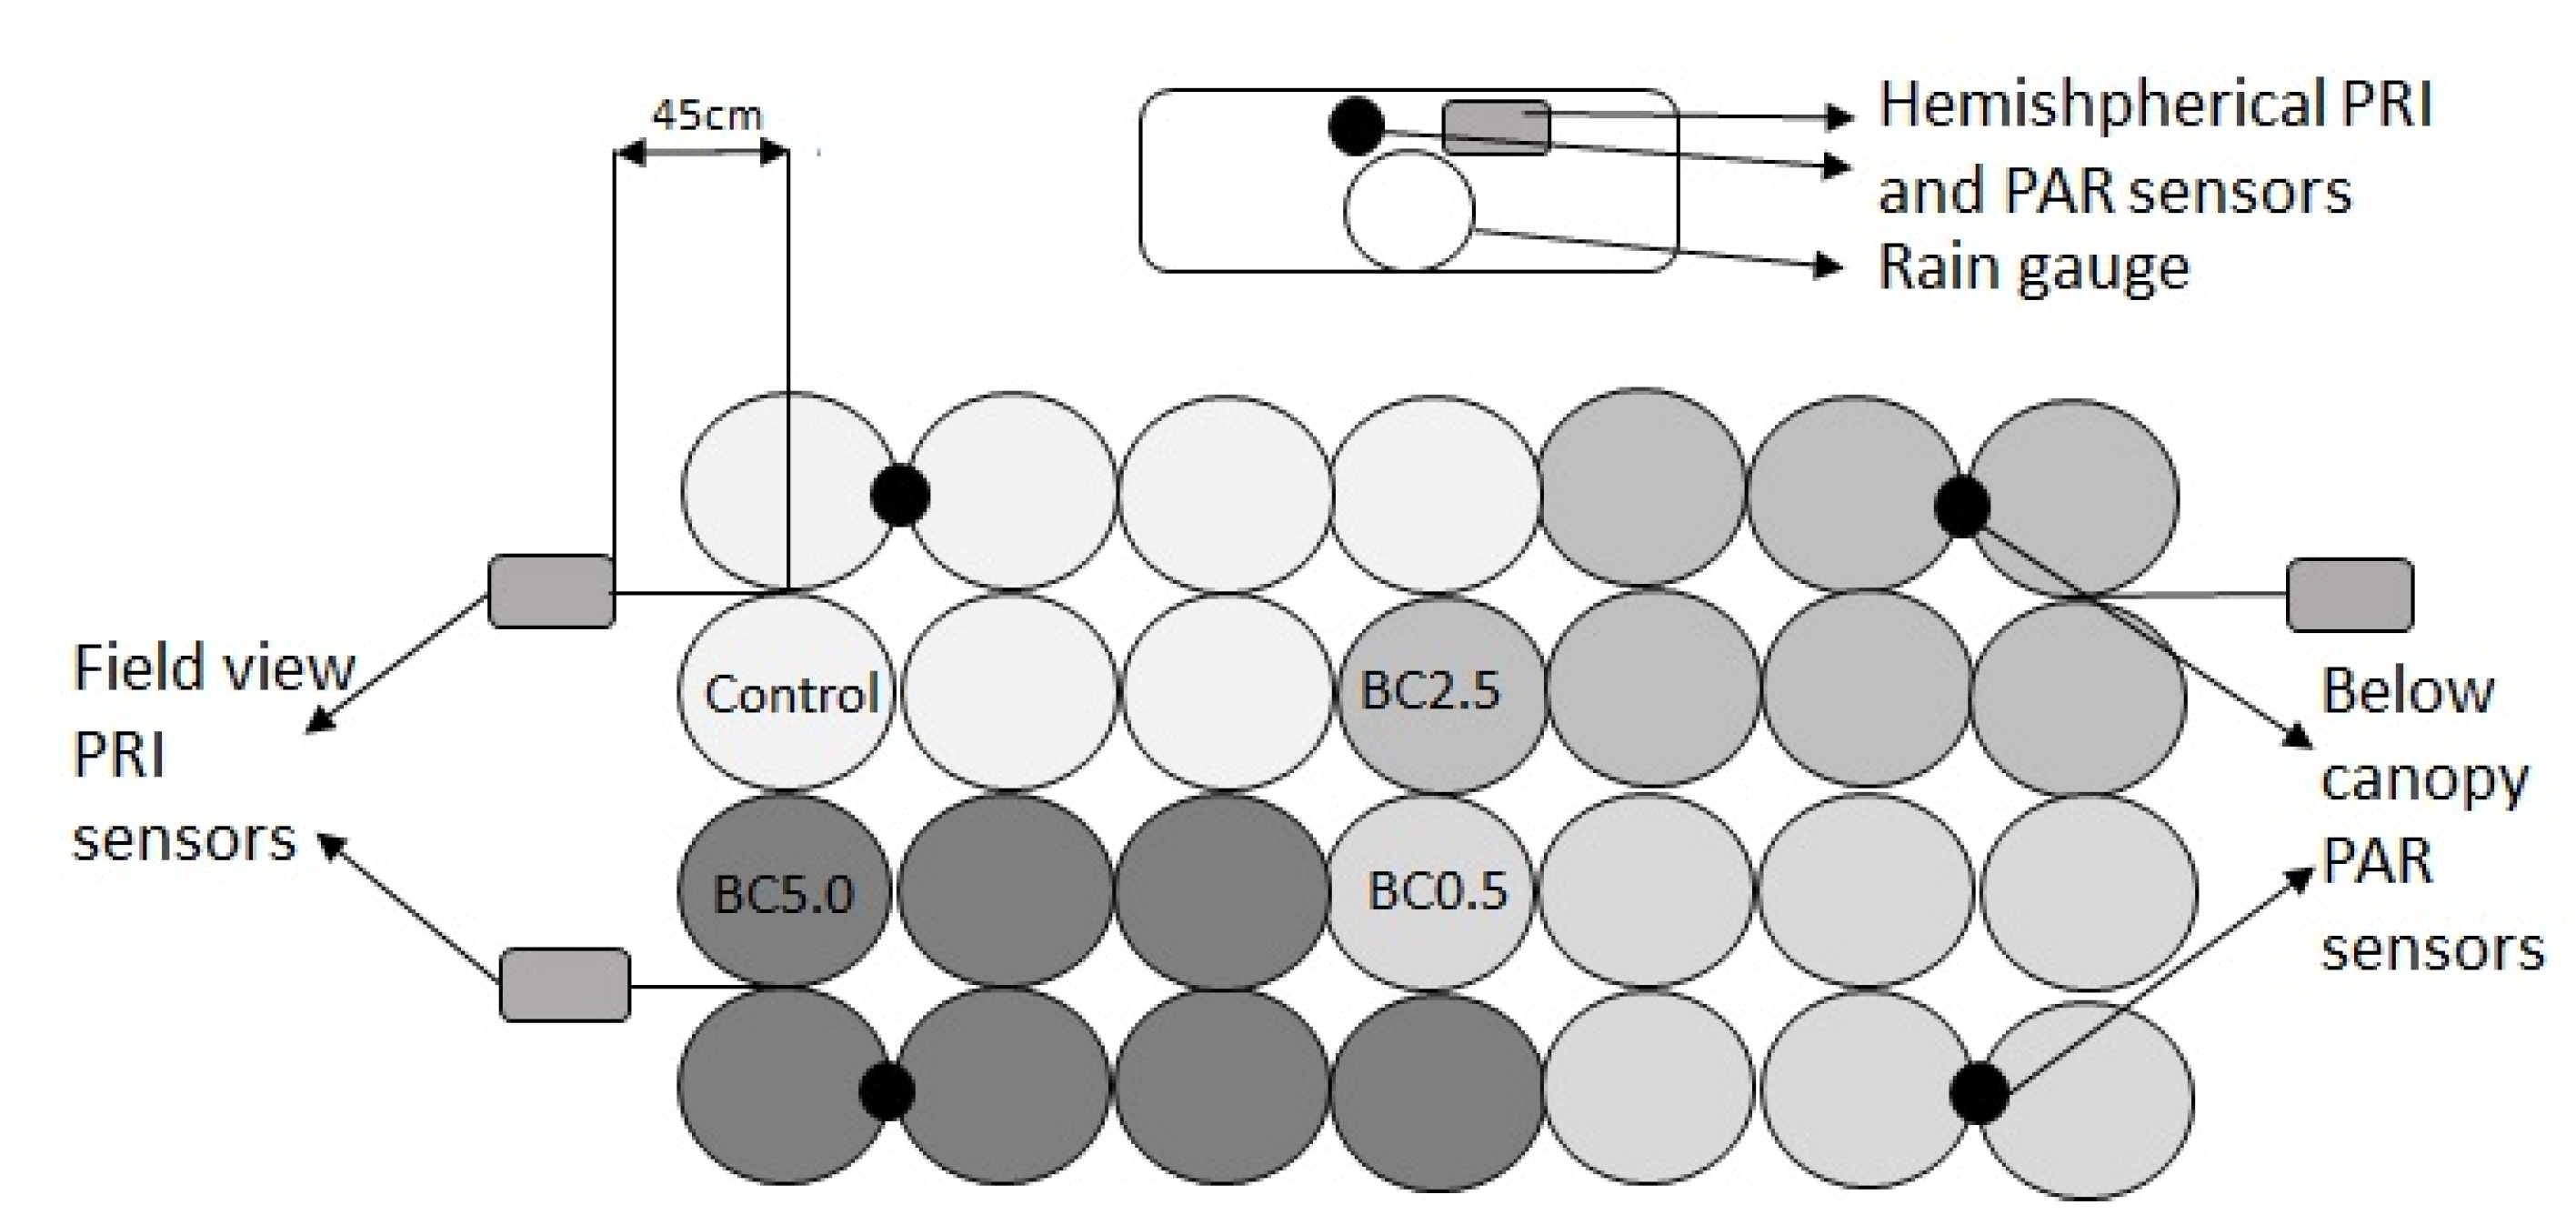
Figure 1. Schematics of the experimental setup at the beginning of the experiment. photochemical reflectance index (PRI) is the photochemical reflectance index and photosynthetically active radiation (PAR) is the photosynthetically active radiation.
Applsci 10 04111 g001
Figure 2. Plant growth values based on Capsicum annuum L. (a) stem thickness and (b) plant height collected weekly. n = 8 to 14; Mean, ±SD. Statistically significant differences (p < 0.05) are indicated by different letters, while n.s. signifies not significant differences between treatments.
Applsci 10 04111 g002
Figure 3. Measurements of the (a) fruit yield, (b) root dry mass, and (c) total aboveground biomass (dry weight) per pepper plant over time. W represents the weeks after beginning of the experiment. W3, W6, and W10 n = 2, W12 n = 8 plants; Mean ± SD.
Applsci 10 04111 g003
Figure 4. Average leaf areas (mm2) of the pepper plants over time for control and biochar (BC) amended treatments. W represents the weeks after beginning of the experiment. n = 2 to 8; mean ± SD.
Applsci 10 04111 g004
Figure 5. Average midday values of fraction of absorbed photosynthetically active radiation (fAPAR) data for the different treatments. W3, W6, W10, and W12 represents the time in weeks when additional plant measurements occurred.
Applsci 10 04111 g005
Figure 6. (a) Average midday photochemical reflectance index (PRI) values for the pepper plants and (b) relationship between PRI and belowground photosynthetically active radiation (PAR) for the control, BC2.5, and BC5.0 treatments. W3, W6, W10, and W12 represents the time of weeks when destructive plant sampling occurred.
Applsci 10 04111 g006
Figure 7. Relationships between midday average photochemical reflectance index (PRI) and volumetric water content (VWC, v/v) values for control, BC2.5, and BC5.0 treatments at (a) maximum and (b) minimum daily water contents.
Applsci 10 04111 g007
Table 1. Physical and chemical characteristics of the soil and biochar used in the experiment. n = 3; mean ± SD. Volumetric water contents (VWC) represents volumetric water content.
Chemical and Physical Parameters and Grain Size Distribution at t = 0SoilSDBiocharSD
<0.002 mm (%)23.85±0.6484.52±0.08
0.05–0.002 mm (%)55.97±0.7613.90±0.70
2–0.5 mm (%)20.18±0.151.57±4.23
pH(H2O)7.97±0.0410.33±0
Total N (%)0.14±0.021.0±0.1
NH4+-N (mg kg−1)5.84±1.011.9±0.1
CaCO3 (%)10.41±0.34n.d.-
P as P2O5 (mg kg−1)977.9±158.15031.1±32.6
K as K2O (mg kg−1)443.1±96.213,570.3±59.0
Organic C (%)0.93±0.0727.89±1.73
EC 2.5/EC 5.0 (mS cm−1)0.2±0.013.03-
VWCinitial (%)26.51±3.7--
n.d. represents not detectable value.
Table 2. Average plant growth parameter measurements for the control and biochar (BC) amended treatments at the end of the experiment. Statistically significant differences are indicated by different letters. SD is the standard deviation of the data. One-way ANOVA, Tukey post-hoc test, n = 8.
TreatmentPlant Height 1Stem Thickness 1Leaf AreaAboveground Dry MassRoot Dry BiomassFruit Yield
AverageSDAverageSDAverageSDAverageSDAverageSDAverageSD
mmmmmm2ggg
Control262.38a27.717.02a0.9525,547a58952.67a0.882.22a0.51312.24a15.61
BC0.5278.25b17.846.66a1.0525,735a61022.59a0.642.56ab0.27393.60a19.68
BC2.5304.13c33.767.88b0.9232,861b58043.23a0.503.44b0.82459.52a22.98
BC5.0286.25c39.027.27a1.3530,656ab12,8403.21a1.472.95ab0.17392.72a19.64
1 values were based on 12 weeks data with repeated measures ANOVA.
Table 3. Pearson correlation analysis (r) and p-value (p) between the investigated plant parameters for the different treatments at the end of the experiment (W12). * Correlation is significant at the 0.05 level, ** correlation is significant at the 0.01 level, and *** correlation is significant at the 0.001 level.
rPlant HeightStem ThicknessLeaf AreaAbove-Ground MassRoot Dry MassFruit Yield
p
Plant height-0.0890.4550.5280.2550.405
Stem thickness0.743-0.8030.7150.5680.168
Leaf area0.077<0.0002 ***-0.8870.7760.437
Aboveground mass0.035 *0.002 **<0.0001 ***-0.5070.200
Root dry mass 0.3410.022 *<0.0005 ***0.045 *-0.561
Fruit yield0.1200.5330.0910.4590.024 *-