Article

A Performance Improvement Strategy for Solenoid Electromagnetic Actuator in Servo Proportional Valve

1
State Key Laboratory of Fluid Power and Mechatronic Systems, Zhejiang University, Hang Zhou 310027, China
2
Ningbo HOYEA Machinery Manufacture Co.Ltd., Ningbo 315131, China
3
Ningbo Research Institute, Zhejiang University, Ningbo 315100, China
*
Author to whom correspondence should be addressed.
Appl. Sci. 2020, 10(12), 4352; https://doi.org/10.3390/app10124352
Submission received: 31 May 2020 / Revised: 19 June 2020 / Accepted: 23 June 2020 / Published: 25 June 2020
(This article belongs to the Section Mechanical Engineering)

Abstract

:
This study presents a simulation model, optimization strategy and the experimental validation of a solenoid electromagnetic actuator that is widely used in industry components, especially in pneumatic/hydraulic valves. In the preliminary design, a two-dimensional magnetostatic finite element analysis (FEA) model is proposed and verified by static push-force comparisons between the two-dimensional FEA model, the three-dimensional FEA model and the experimental results. Then, a static and dynamic performance improvement strategy is proposed. To optimize the static push-force of the actuator, a static multi-objective optimization strategy for actuator structure parameters was developed based on a genetic algorithm. An experimental analysis of dynamic performance was carried out to improve the dynamic response of the actuator. By using a high-precision measuring device in the static-push-force test and dynamic direct current-input-signal tests, the comparisons results between the manufactured conventional actuator and the manufactured optimal actuators showed that the proposed optimization strategy was feasible. Through the static optimization strategy, the average static push-force in the working stroke was improved by 21.8%. Moreover, through the dynamic optimization strategy, the cutoff frequency of the push force response was improved by 129.1%, 79.6% and 74.3%, respectively, at three key positions in the working stroke.

1. Introduction

Nowadays, electromagnetic actuators as force generation components are widely used in vehicle clutch and fuel injection systems, inverter compressors and many other pneumatic/hydraulic valves. Linear proportional solenoids (LPS) is generally employed in proportional control valves (PCV) and servo proportional valves (SPV) due to their simple structure, high reliability, low cost and long stroke. However, different from the low performance requirement of PCV, the LPS need a high static push-force and a high frequency force response in SPV. This means the study of electromagnetic actuators is necessary for the improvement of electro–hydraulic control performance.
In last decades, many studies for electromagnetic actuators have shown that the static and dynamic performance are closely related to design parameters [1,2,3]. The optimization methods of electromagnetic actuators include parametric analysis [4,5,6] and global optimization algorithms [7,8,9,10]. Moreover, many researchers have used the parametric methods to optimize the shape of electromagnetic devices in their study [11,12]. For example, Huang, N.B. et al. [13] studied the improvement of solenoid static electromagnetic forces and the reduction of open- and closed-response times of fuel injectors by optimizing the coil cross-sectional shape and the relative position of the coil and the armature. However, the obvious disadvantages of parametric analysis methods could be found in previous studies, such as the heavy workload of multi-objective and the limited number of optimization parameters. In addition, it usually obtains a locally optimum result that has a lower performance than the results of global optimization algorithms. Therefore, a global optimization algorithm still needs to be used in the study of electromagnetic actuators.
To optimize structure parameters, a numerical calculation model of electromagnetic actuator must first be established. The numerical magnetic field calculation methods of electromagnetic actuator include equivalent magnetic circuit (EMC) method [14] and finite element analysis (FEA) method [15]. Cai, B. et al. [16] studied the influences of five main the shape parameters (thickness of the coil, thickness of the magnetic ring, thickness of plunger sleeve, thickness of upper plunger sleeve and the gap between the plunger and the plunger sleeve) on the magnetostatic force. A magnetostatic force comparison between EMC model, FEA model and the experimental result has shown that the two-dimensional FEA model has a good agreement to measured result with a large amount of computation.
However, with the improvement of computer computing power, the calculation time-cost of the two-dimensional FEA model is greatly reduced. Z.-Y. Sun et al. [17] studied the effects of driving current and solenoid valve structure parameters (iron-core length, magnetic pole cross-sectional area, coil turn, coil position, armature thickness, damping hole position, damping hole size and width of the working air–gap) on the static electromagnetic force and the other characteristics by a three-dimensional FEA model in ANSYS MAXWELL software. Since the three-dimensional model will cost a large numerical calculation time in FEA, it is only used to analyze the influence of different parameters and values. Thus, in order to reduce the time cost for parameter optimization, the need of the two-dimensional FEA is obvious.
In addition, some other researchers investigated the dynamic response characteristics of electromagnetic actuator by analyzing the influence of mechanical system parameters [18] and power drive system parameters [19]. For example, [20] Lee, S.H. et al. reduced the moving time of solenoid actuator by the natural frequency of mechanical system as optimization goal. However, only validate the optimization result by simulation model, is unsuitable for experimental work [21]. Wu, S. et al. optimized the performances of the response time, size and thermal performance by a theoretical model of solenoid actuator, which employed EMC method. Moreover, it is inaccurate to only consider the static EMC models without dynamic phenomenon, such as the hysteresis and the eddy current in the magnetic materials. Thus, experimental analysis strategy is also essential for the dynamic performance of the LPSs.
This study aims to improve the static and dynamic performances of the LPS, which is used in SPV [22]. In order to improve the static performance, a multi-objective optimization strategy is presented in this study. The optimization objectives of the static performance include maximum average push force in the working stroke, minimum standard deviation of the push force in the working stroke and the maximum average push force to moving mass ratio. Since these objectives are mixed with each other, a genetic algorithm (GA) optimization algorithm was used to optimize the shape of the LPS by a high accuracy magnetostatic FEA model. In order to improve the dynamic performance, an experimental analysis of the coil parameters and the LPS component material of was employed in this study. A comparison result between the manufactured conventional actuator and the manufactured optimal actuator could be found through using a high-precision measuring device in the static-push-force test and dynamic direct current-input-signal test. By the static optimization strategy, the average static push-force in the working stroke was improved by 21.8%. Moreover, by the dynamic optimization strategy, the cutoff frequency of the push force response was improved by 74%, 79.6% and 74.3%, respectively, at start, middle and end position in the working stroke.
In summary, this study is organized as following chapters: In Section 2, the magnetostatic 3D FEA model of the LPS is introduced and developed. Meanwhile, the static-force optimization process of the LPS is also described. Then, in Section 3, the dynamic performance improvement strategy of the LPS’s coil parameters and materials is presented and verified by the high precision test device. Finally, the proposed performance optimization strategy is validated with the test data of the manufactured optimal LPS. The overall description of this performance optimization strategy is shown in Figure 1.

2. Static Performance Optimization of Solenoid Electromagnetic Actuator

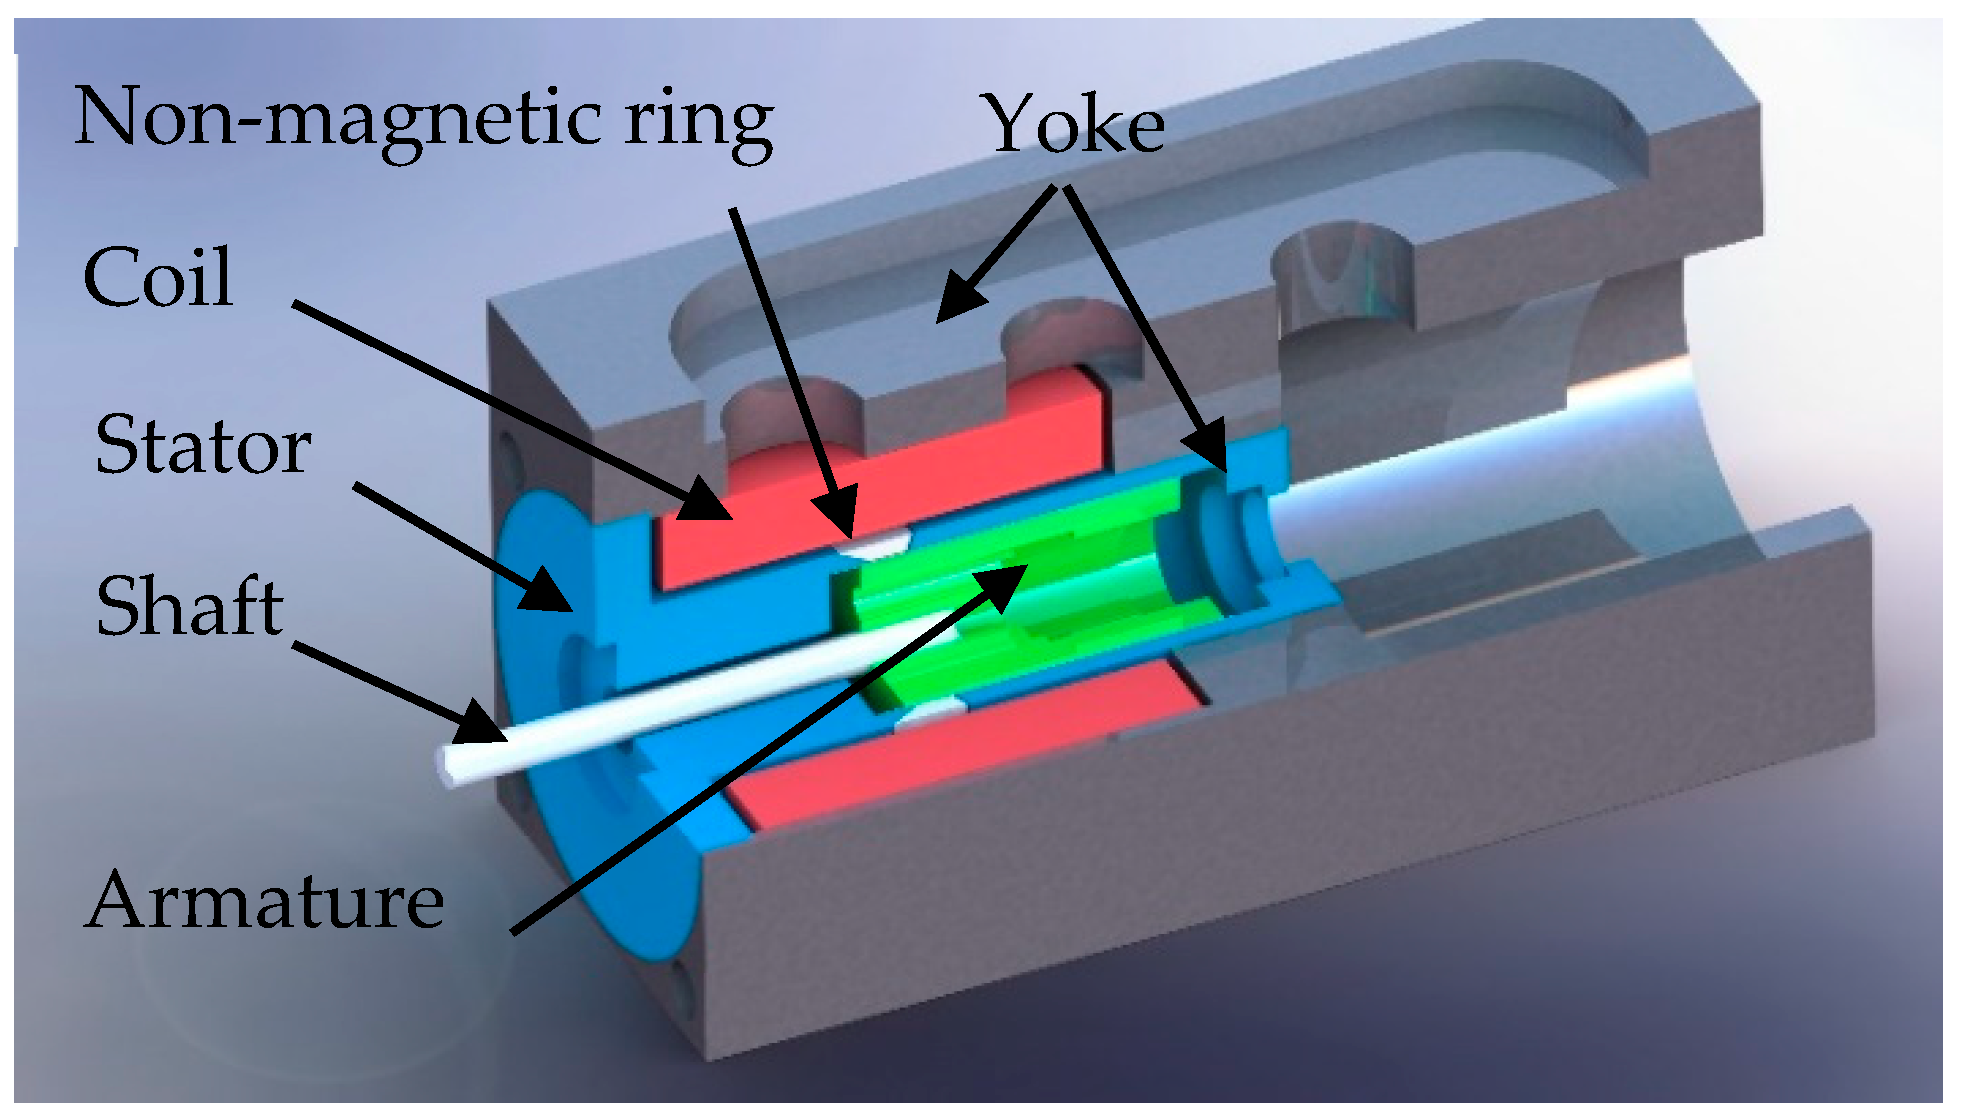
2.1. Structure and Simulation Model

The structure parameters are the main factors of the static performance optimization. In order to simplify the complexity of optimization, this study only optimizes the parameters of the core components such as armature, stator, coil, yoke and non-magnetic ring.
Moreover, a series of magnetostatic models are needed to describe the force versus displacement curve of the LPS static performance. These models are distinguished by different air gap, symbol A1 in Figure 2, between armature and the stator. Moreover, the air gap of each model is expressed in 0.2-mm intervals. Therefore, at least 14 calculation models are required for entire working stroke (from 1-mm air gap to 3.6-mm air gap). The holes in the armature include shaft hole and the two oil through holes. Oil-through-hole is usually used to introduce oil and reduce moving mass of the LPS. In the 3D models, the influence of these two holes is considered in Figure 3 and the result is shown in Figure 4b. Considering the calculation time of the 3D model and the number of calculation models, a simplified two-dimensional (2D) model was used for structure parameter optimization. The description of this cylindrical axisymmetric 2D model (about axis Z) is shown in Figure 2a. Moreover, the mesh of the 2D FEA model is shown in Figure 2b.
The definition of the LPS shape parameters are shown in Figure 2a. All parameters can be divided into four parameter arrays. Parameter array Parmature{a1, a2, a3, a4} represents the design parameters of the armature, which includes the length and radius of the armature and the length of return spring hole and the thickness of the spring sleeve. Parameter array Pyoke{y1, y2, y3, y4, y5, y6} includes the design parameters of the stator design parameter y1, the non-magnetic ring design parameters from y2 to y5 and the yoke parameter y6—thickness of the armature sleeve. Parameter array Pcoil{c1, c2} represents the length and thickness of the coil winding. Other fixed shape parameters (radius and the length of the 2D model, height of the stator and the three thickness parameters of the bobbin) are contained in array Pfixed{f1, f2, f3, f4, f5, f6}. The conventional values of the shape design parameters array are Parmature{31.4 mm, 9.02 mm, 16.9 mm, 4.5 mm}, Pyoke{5.5 mm, 3.7 mm, 3 mm, 3.9 mm, 1 mm, 2 mm}, Pcoil{8.2 mm, 41.5 mm} and Pfixed{26.8 mm, 67.5 mm, 23 mm, 1.4 mm, 1.1 mm, 1.2 mm}.
The theoretical Equations of this simplified 2D model are shown as below.
The magnetic field strength H is obtained by the Ampere’s law:
H = i N c 1
where i represents coil excitation direct current, N is the number of turns of the coil, c1 represents the length of flux path in the cross-sectional area of the yoke.
The numerical relationship between H and the magnetic flux density B and the magnetic flux Φ in the cross-sectional area of the yoke are obtained as follows:
B = μ H
ϕ = B S e
S e = π ( f 1 ) 2 π ( f 1 t ) 2
where μ is the magnetic permeability of the material, Se is the equal cross-sectional area of the yoke in the 2D model and t is the equal thickness of the yoke in the 2D model. Meanwhile, the cross-sectional area Se is equal to the area of the yoke in the 3D model (45-mm width and 50-mm height rectangle with a hole of 21-mm radius).
All components of the LPS in the 2D model are cylindrical axisymmetric structures, but the yoke of the LPS in the 3D model is a cube structure. A simplified 2D model is established, which has equal yoke cross-sectional area with the 3D model. From the basic theoretical Equations (1)–(3), it can be obtained that H in the yoke of these two models are equal in the same simulation condition. Moreover, B in the yokes are also equal by the same material parameter μ. Thus, when the cross-sectional area S of the two models are equal, the magnetic flux Φ in the yoke of the two models will equal and the simplified 2D model will be considered suitable.
The 2D-magnetostatic field simulator solver computes are derived from Ampere’s law and Maxwell’s differential equation:
× H = J
B = 0
B = × A
× ( 1 μ × A ) = J
where J is the current density of the direct current excitation of the coil. A is the magnetic vector potential.
To calculate the magnetostatic field result of the 2D model and the 3D model, ANSYS MAXWELL (ANSYS, Inc., Canonsburg, PA, USA, 2019, version: ANSYS Electronics suite 2019R2) software is employed in this study. These simulation model are calculated by a workstation with two CPU (Intel E5-2650v2) and 32 GB DDR3 memory. The 2D FEA model with 3.6-mm air gap (A1) has 45,732 elements and the calculation time cost is 1 min and 30 s and the workstation can calculate 30 tasks at same time. While, the 3D FEA model with 3.6-mm air gap (A1) has 746,669 elements, and the calculation time cost is 31 min and 49 s, and the workstation only calculate one task. Therefore, replacing 3D FEA model with 2D FEA model can reduce the time cost by more than 99.8%. The boundaries of the 2D FEA model is balloon boundary and the boundaries of the 3D FEA model is zero tangential H field boundary. The current density of the coil excitation is 5.56 × 10⁶ A/m2. This study calculated a series of FEA model with different air gap (A1), which are distinguished by the interval of the 0.2-mm air gap. The FEA model use the conventional values of each components and pure iron as the soft magnetic material to calculate the static electromagnetic force of the armature. The property of pure iron are shown in Figure 5. The absolute values of the static electromagnetic force of the armature are shown in Figure 4a.
In Figure 4a, the static force versus displacement curves of the experimental result, the 3D model simulation result and the 2D model simulation result of conventional LPS are illustrated. The push force of the 2D FEA model in Figure 4a is the armature static electromagnetic force along the negative direction of the Z coordinate axis in Figure 2 and Figure 4c. Moreover, push force of the 3D FEA model in Figure 4a is the armature static electromagnetic force along the negative direction of Y coordinate axis in Figure 4b. By the comparison of these curves, the 2D model has same accuracy as the 3D model. It also can be confirmed that both 2D and the 3D model can guarantee equal accuracy on magnetostatic force calculation. In Figure 4b,c, the flux density field of the 3D model and the flux density field of the 2D model are illustrated, respectively. The air gap A1 of the two models are 3.6 mm and the other calculation conditions are the same as well.
By the comparison of the flux density field results at position 1, the cross section of the 3D FEA result indicates that the circle flux density field in Position 1 is similar with the 2D cylindrical axisymmetric FEA model result. Moreover, based on the calculation results in Figure 4a, and the flux density field of Position 2 in Figure 4b,c, the holes in axial symmetry 2D model are feasible.
Therefore, the validity of the equal yoke cross-sectional area simplified method can be indicated in Figure 4.
The maximum deviation occurs at the end position of the working stroke (3-mm position at working stroke). The reason of calculation error can be considered by the saturation phenomenon of the magnetic materials. The maximum 4 T flux density field of the armature at position 2 in Figure 4b,c can explain why the numerical calculation is not consistent with the reality.

2.2. Multi-Objective Genetic Algorithm Optimization for Structure Parameters of the LPS

LPS is used to generate the push force to SPV, its performance directly influences the valve control quality. The static push-force magnitude, output efficiency and constant performance at different air gap are the main factors of the LPS. Thus, static performance optimization design objects include average push force, the standard deviation of the push force in the working stroke and the average push force to moving mass ratio. To solve this optimization issue, genetic algorithm is employed to obtain the optimal shape parameters. The presented 2D model is used to calculate the push force at each 0.2-mm interval air gap in the working stroke (from 1-mm air gap to 3.6-mm air gap). It means that there fourteen 2D models with different air gap A1 in one group of the LPS design parameters. All these work are accomplished by ANSYS MAXWELL (ANSYS, Inc., Canonsburg, PA, USA, 2019, version: ANSYS Electronics suite 2019R2).
The following Equation (9) shows the optimization fitness function:
f i t n e s s = F ex | F A V G | F ex + D ex D D ex + K ex | F A V G | m K ex
Equation (9) includes three normalized objects and each factor: average electromagnetic force-FAVG, standard deviation of the absolute value of the static electromagnetic force-D and the average electromagnetic force to mass ratio of the moving parts in SPV-FAVG/m. In this study, FAVG is calculated by the average push forces of each sampling air gap in the working stroke and the expectation average force-Fex is set as 170 N. It is used to evaluate the excitation force performance in the coil rated current (direct current). The LPS generates electromagnetic force to overcome the spring force and flow force of SPV and provides acceleration for the spool of SPV. The maximum flow force of SPV is 25-N and the maximum spring force is 50 N. The armature of the LPS pushes the spool from the end position (3.6-mm air gap) to the start position (1-mm air gap) in the LPS working stroke. The spring is used to store energy and the push the spool and the armature back to the end position of the working stroke. Thus, the magnitude of FAVG is the key performance of the LPS for static requirement (overcome flow force) and dynamic requirement (large force generation). By the consideration of deviation between 2D simulation result and the measurement result, this study chose 170N as the value of FAVG to ensure that FAVG is twice as much as the sum of the spring force and flow force. D is used to evaluate the standard deviation of the push force at each sampling position and the expectation standard deviation of the push force—Dex—is set as 10 N. It means that the difference between maximum push force and minimum push force is 65-N in the working range, at worst situation. In the Equation (9), FAVG/m represents the push force output efficiency and the expectation force to mass ratio—Kex—is set as 1.8 N/g.
A genetic algorithm—100 population size and 49 generations—was employed to solve this optimization problem and the optimal shape design parameters was obtained. The GA optimization details and flow chart were shown in Figure 6. In this study, we set the individual crossover probability as 0.5 and variable crossover probability as 0.2 and variable exchange probability as 0.1 to guarantee that enough new individuals were produced. We also set the uniform mutation probability as 0.3 and individual mutation probability as 0.2 and variable mutation probability as 0.1 to escape local optimal result by the large mutation probability.
The iteration result is shown in Figure 7 and the shape design parameter array can be defined by Ptotal{a1, a2, a3, a4, y1, y2, y3, y4, y5, y6, c1, c2}. All values of the key design parameters are shown in Table 1.

2.3. Simulation and the Measurement Results

All simulation resulted in this study were calculated by ANSYS MAXWELL (ANSYS, Inc., Canonsburg, PA, USA, 2019, version: ANSYS Electronics suite 2019R2). To ensure the accuracy of the measurement results, ZLDS100 (ZSY GROUP LTD) laser displacement sensor and U9C (HBM) force transducer were employed in the performance test device. The structural details of the test device are shown in Figure 8a; the experimental setup is shown in Figure 8b. For static performance test, a series of the static push-force versus displacement curves are depicted in Figure 9. By the comparison of the manufactured optimal LPS and conventional LPS in different coil excitation current, it can be seen that the static performance of the optimal LPS showed a high force generation and a well constant performance in low coil current. When the coil current was rated current (1980 ampere-turn), the numerical calculation error will increase with the influence of the magnetic saturation phenomenon in the soft magnetic material of the LPS.
The comparison of the design objectives is shown in Figure 10. The average force shown in Figure 10a was calculated by the measured values in Figure 9. The results indicate that the optimal-type LPS can generate more push force than the conventional type. Moreover, the standard deviation of the force versus displacement curves is shown in Figure 10b. In high magnetomotive force condition (1980 and 1587 ampere-turn), the push force of the conventional-type LPS showed a better constant performance. However, in low magnetomotive force condition (1188, 792 and 396 ampere-turn), the optimal-type LPS showed a better constant performance. Moreover, considering the same push force output, the optimal-type LPS was more stable. As shown in Figure 10c, it can be seen that the optimal-type LPS showed a better force output efficiency.
Although the push force constant performance is worse than conventional-type LPS in high magnetomotive force condition, the constant performance of the optimal-type LPS has no disadvantage in large force requirement condition, based on the large force output ability and good constant performance in low magnetomotive force condition. Thus, the presented static performance optimization strategy of the LPS is valuable.

3. Dynamic Performance Improvement of Solenoid Electromagnetic Actuator

In previous chapter, we already discussed the static performance improvement strategy of the LPS. The optimization object-force to mass ratio of the strategy has already take the dynamic performance of mechanical system into account. Moreover, the dynamic performance of the LPS coil current subsystem and the push force generation subsystem also make great influence to the mechanical system of the LPS. Therefore, it is necessary to discuss the influence and improvement strategy of these two subsystem. For the dynamic performance improvement strategy of the coil current subsystem, we will analysis and verify the influence of the coil rated current by theoretical method and the experimental method. For the dynamic performance improvement strategy of the push force generation subsystem, we will also analysis and verify the influence of the magnetic materials of the LPS armature by theoretical method and the experimental method.

3.1. The Analysis of the Coil Winding Parameters

Obviously, the resistance and the inductance of the coil winding will directly affect the coil current response and finally affect the push force response property. Thus, the analysis of different rated excitation current is employed to improve the dynamic performance of the LPS. The theoretical principle is shown as below.
According to the Hopkinson’s formula, the magnetomotive force-F can be described as:
F = ϕ R m
where Rm is the magnetic reluctance. The definition of Rm is expressed as:
R m = δ μ S
Moreover, according to the definition of the magnetic flux density B and Ampere’s law, F is expressed as:
F = N i
The definition of the inductance L is expressed as follow:
L = N ϕ i
Combining the Equations (12) and (13), the inductance of the coil-L can be expressed as:
L = N 2 R m
The simplified equivalent circuit of the coil drive control system of the LPS is shown in Figure 11:
Since the pulse-width modulation (PWM) signal of the controller is assumed to be 100% duty cycle with ignoring the voltage drop of the other components of the controller, the controller can be simplified as 24 V DC power supply. Thus, it can be clearly obtained from Figure 11 that the LPS drive circuit is a resistor–inductor circuit, and the current response is determined by the Equation:
i ( t ) = V ( 1 e L t / R ) R
where i ( t ) represents the time-dependent coil excitation current, V is the drive voltage of the coil (24 V DC), R represents the resistance of the coil. Since the LPS is a direct current (DC) electromagnetic actuator with 24 V DC power supply, the drive voltage-V is constant. Thus, the current response time related with R and L. Theoretically, according to the value of V and R, the coil current can rise to the maximum value. But it is obvious that the power consumption of the coil and the controller are too high under maximum current. Thus, a rated power loss of the coil is limited in this study. The rated power loss Prated can be expressed as:
P rated = I r a t e d 2 R
where Irated is the rated current of the coil.
According to the Equations (12),(14)–(16), the response time of the rated current-trated can be described as follow Equation:
t r a t e d = F rated 2 R m P rated ln ( V I r a t e d V I r a t e d P rated )
trated represents the time cost of the coil current from 0 to Irated. In this study, the rated magnetomotive force-Frated is 1980 ampere-turn, the drive voltage of the LPS-V is 24 V DC and the power loss of the coil-Prated is 32 W, these rated parameters are constant in the coil parameter analysis. Moreover, Rm is correlated with structure parameters of the LPS and it is unchanged with coil winding parameters. Thus, the response time of the rated current-trated is only related to coil rated current-Irated.
With the increasing of excessive excitation current, the power consumptions of drive components in the controller and the coil winding of the LPS are increased rapidly. For the requirement of actually use, the rated current increased from 3A to 5A in this study. Correlatively, the turns number of the coil winding is reduced from 660 to 396 and the resistance of the coil winding is reduced from 3.5 Ω to 1.3 Ω. The resistance of the coil is measured by multimeter (FLUKE). Thus, the copper loss of the LPS and the rated magnetomotive force can stay constantly. By the magnetic circuit calculation Equations in reference [21], the Rm calculation result of the conventional-type LPS is 2.08145 × 10⁶ H−1 at end position (3.6-mm air gap) of the working stroke. According to the Equation (14), the time constant T of the 3A-coil is 59.8 ms and the time constant T of the 5A-coil is 58 ms. The theoretical correlation between rated current and the rated current step response time is calculated and shown in Figure 12 according Equation (17).
The response times in different rated current indicate that the current response performance can be improved effectively by the increasing of the rated current and with the increasing of the rated current, the reduction of the response time is decreasing. The rated current response time of 3A-coil LPS is 34.4 ms and the rated current response time of the 5A-coil LPS is 18.2 ms, it can be seen that 5A is an appropriate rated current.
In order to verify this dynamic performance improvement strategy, the shape of the optimal-type LPS was optimized by static optimization strategy and the coil winding was also designed by dynamic performance improvement strategy. The dynamic performance test mainly measured the response of the coil current and the push force at fixed position in the working stroke. The start position (1-mm air gap), middle position (2.3-mm air gap) and end position (3.6-mm air gap) were set as the key positions of the working stroke. Moreover, the input signal of dynamic test was rated current (direct current), which was 3A and 5A for the conventional-type LPS and the optimal-type LPS, respectively. Since 50 Hz was close to the cutoff frequency of the optimal-type LPS, we choose 50 Hz as the frequency of the input signal to clearly verify this improvement strategy. The test resulted of the manufactured conventional-type LPS and the manufactured optimal-type LPS were shown in Figure 13. From the comparison of the coil current response in Figure 13a, it could be confirmed that the coil current response performance was improved effectively by the optimized coil winding parameters. With the improvement of the current response performance, the push force response performance could be improved immediately. All these conclusions could also be proved from Figure 13b,c. Moreover, the details of the Bode plot of frequency response are shown in Figure 14. Therefore, the dynamic improvement strategy of changing coil winding parameters was valuable.

3.2. The Analysis of the Magnetic Materials

Except the coil winding parameters, the soft magnetic material of the LPS is another important factor on the static and dynamic performance of the LPS. Due to the high saturation magnetization, pure iron is usually used in the LPS to generate large static push-force. However, the dynamic performance of the LPS requires low remanence and low coercivity characterizes of soft magnetic material to generate less power loss. Thus, selecting the appropriate soft magnetic material of each part of the LPS is an improvement method for dynamic performance. The theoretical principle is shown as below.
According to the empirical Bertotti Equation for the core loss calculation, the total power is presented as:
P t o t a l = P m e c h a n i c a l + P c o r e l o s s + P c o p p e r l o s s + P s o l i d l o s s
P c o r e l o s s = P h + P c + P e = k h f B 2 m + k c ( f B m ) 2 + k e ( f B m ) 1.5
P s o l i d l o s s = V o l J e 2 d V o l σ
P c o p p e r l o s s = i 2 R
where Ptotal represents the total power consumption, Pmechanical represents the mechanical power, Pcoreloss represents the power loss generated by time varying magnetic field, Pcopperloss represents the power loss generated by coil of the LPS and Psolidloss represents the resistive loss in the conductor volume of the LPS [23]. kh, kc and ke represent the coefficients related to hysteresis loss, eddy current loss and excessive loss, respectively. kh, kc and ke are determined by the measurement of specific magnetic material. f represents the frequency of the magnetic field, Bm represents the maximum amplitude of the magnetic flux density. Je represents the eddy current density, σ represents the conductivity of the magnetic materials and Vol represents the volume of the magnetic materials of the LPS.
By the coil winding parameters improvement strategy, the Pcopperloss of conventional-type LPS and the optimal-type LPS are equal. Therefore, the mechanical power Pmechanical is correlated with Ptotal, Pcoreloss and Psolidloss. According to the expression of Pcoreloss and Psolidloss, when Ptotal is constant, Pmechanical is related to materials of the LPS.
Taking the armature into account—the only moving part of the LPS—electrical steel is employed as the soft magnetic materials of the armature in this study. The electrical steel armature is made by cold-drawn non-oriented silicon steel rod, which meet IEC 60404-8-6 class c1 standard. The comparisons of the magnetic hysteresis loops of pure iron and electrical steel are shown in Figure 15 and the test magnetic fields include the DC magnetic field and 20-Hz-, 50-Hz- and 100-Hz-AC magnetic field. It can be seen that the pure iron has large maximum relative permeability, low remanence and low coercivity in DC magnetic field, but when the frequency of the AC magnetic field increased, the electrical steel shows a better dynamic performance than pure iron. As a specific electromagnetic actuator used in SPV, LPS is required both high dynamic performance and high static performance. Therefore, based on the high dynamic performance requirement, electrical steel is more suitable as the metrical of the armature. Moreover, for large push-force requirements, pure iron is employed as the material of the other non-moving components.
In order to verify the improvement of electrical steel, an electrical steel optimal-type LPS was redesigned and the manufactured. Considering the differences of Magnetic Hysteresis Loops between electrical steel and pure iron, the static optimization strategy in present study was employed to redesign the structure of electrical steel optimal-type LPS. Moreover, the rated current of electrical steel optimal-type LPS increased from 3 A to 5 A; the other coil winding parameters were the same as the optimal-type LPS. Thus, only the material of the armature was the variable between the optimal-type LPS and the electrical steel optimal-type LPS.
The test objects include the conventional-type LPS, the optimized-type LPS and the electrical steel optimal-type LPS. The amplitude of sine wave input signal was rated current (direct current) and the test frequencies were 1 Hz, 20 Hz, 50 Hz and 70 Hz. All LPS were tested at middle position (2.3-mm air gap) of the working stroke. The measured push force response curves are shown in Figure 16. As represented in Figure 16, the electrical steel optimal-type LPS showed a lower amplitude attenuation than other two types LPS. These comparison results indicate that replacing the armature material with electrical steel could also improve the dynamic performance of the LPS. Although the material replacing improvement strategy had great advantage to improve the dynamic performance, it also had a disadvantage of the push force decreasing. But by the contribution of the static performance strategy, the electrical steel optimal-type LPS had same magnitude of the push force at low frequency.

3.3. Dynamic Performance Test

The force frequency response magnitude plots and phase plots at the start position (1-mm air gap), the middle position (2.3-mm air gap) and the end position (3.6-mm air gap) of the working stroke are illustrated in Figure 14. Moreover, the amplitude of the input signal was rated current (direct current). As seen from Figure 14, the cutoff frequency of the magnitude plots is lower than the phase plots. Therefore, it can be concluded that the dynamic performance of the LPS was determined by the amplitude–frequency characteristics. From the amplitude plot, both the optimal-type LPS and the electrical steel optimal-type LPS showed better dynamic performance than the conventional-type LPS. The improvement of the coil parameter optimization strategy and the armature optimization strategy could be illustrated by Figure 14. In addition, from Figure 14, it also could be confirmed that the amplitude attenuation of the electrical steel optimal-type LPS was less than the optimal-type LPS. Thus, the electrical steel optimal-type LPS was more suitable than the optimized-type LPS for high dynamic performance requirement situation.
Table 2 illustrates the cutoff frequency of the conventional-type LPS, the optimal-type LPS and the electrical steel optimal-type LPS at start, middle and end position in the working range. The optimal-type LPS increased by 73.4%, 52.2% and 57.5%, respectively. Moreover, the electrical steel optimal type increased by 129.1%, 79.6% and 74.3%, respectively.
In summary, we can clearly obtain a conclusion from Figure 14 and Table 2 that increasing the coil rated current strategy and the replacing material strategy significantly improved the dynamic performance of the LPS. These two types of the LPS were used in different requirements of the LPS; which one is more suitable depends on what kind of occasion it is used for. The optimal-type LPS showed high static push-force generation and the electrical steel optimal-type LPS showed high push-force frequency response.
The manufactured LPS is shown in Figure 17.

4. Conclusions

This study presented a performance optimization strategy for LPS used in SPV. The strategy mainly includes a multi-objective static performance optimization strategy and a dynamic performance experimental improvement strategy. By this optimization strategy, the optimized types of the LPS were manufactured and tested. The main conclusions are listed in the following:
(1)
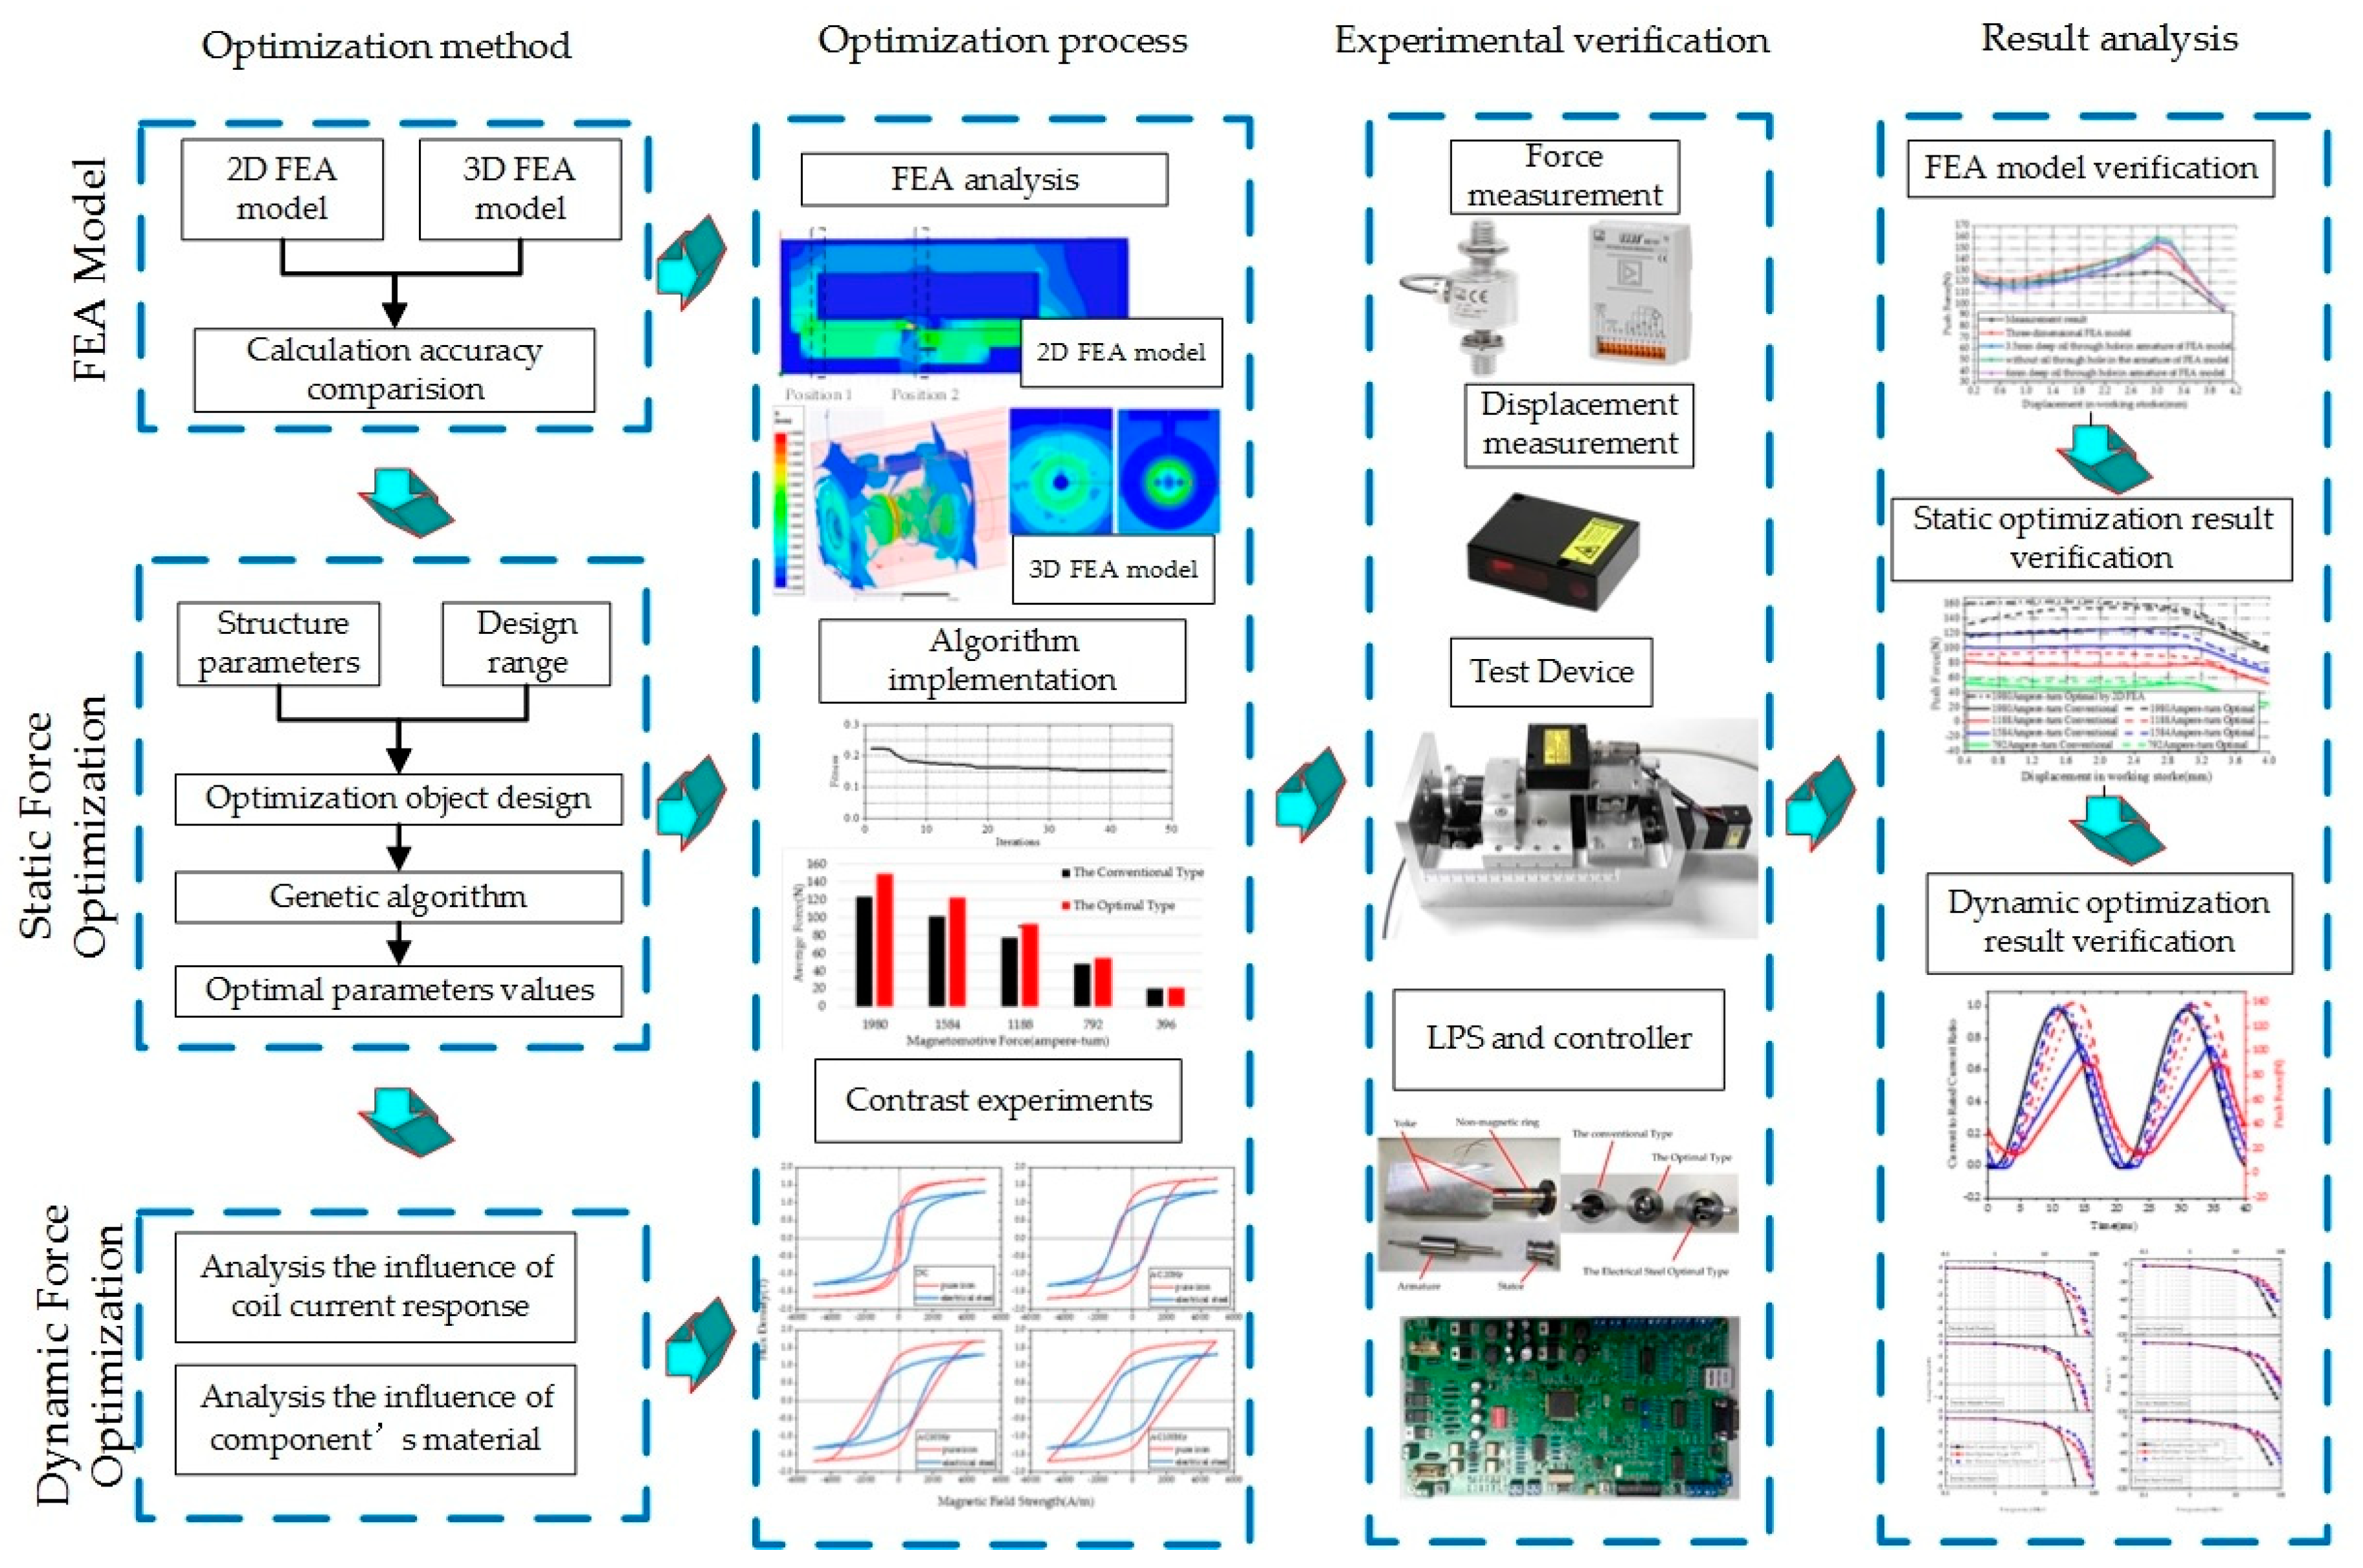
An equal yoke cross-sectional area simplified method was proposed in this study to reduce the time cost of the 3D FEA model of the LPS. The simplified 2D FEA model was verified by the comparison of the static push-force versus displacement curves. The simulation result and the measurement result indicated that the simplified 2D FEA model showed equal calculation accuracy with 3D FEA model and the time cost of the 2D FEA model was reduced more than 99.8% by comparison with 3D FEA model.
(2)
A multi-objective GA static performance optimization strategy was presented in this study to optimize the shape parameters of the LPS. An optimization fitness was proposed to obtain large push force and guarantee the deviation of the push force in the working stroke and improve the output efficiency (push force to mass ratio). The global optimization result was obtained and the manufactured. According to the comparison results of the manufactured optimal-type LPS and conventional-type LPS, the push force of the optimal-type LPS was increased by 21.8% in the rated current (total 1980 Ampere-turn magnetomotive force). Moreover, in low force requirement states, the optimal-type LPS also illustrated a good static performance.
(3)
A dynamic performance improvement strategy of increasing coil rated current was proposed. To certify the performance influence of the coil rated current, a theoretical analysis and an experimental test were employed. Both the theoretical results and test results could validate the advantage of increasing rated current. According to the comparison result of the manufactured optimal-type LPS and conventional-type LPS, the force response frequency of the optimal-type LPS were increased by 73.4%, 52.2% and 57.5%, respectively at start, middle and end position in the working stroke.
(4)
In addition, a dynamic performance improvement strategy of replacing magnetic material of the armature was proposed. To verify the influence of the magnetic materials, a theoretical analysis and an experimental test were also employed. Both the theoretical analysis and the experimental tests also validated the advantage of electric steel. According to the comparison results of the manufactured electrical steel optimal-type LPS and conventional-type LPS, the force response frequency of the electrical steel optimal type increased by 129.1%, 79.6% and 74.3%, respectively at start, middle and end position in the working stroke.
From what have been discussed above, the improvement of the static optimization strategy and dynamic improvement strategy can be verified by the test results of the high accuracy device. However, some gaps also can be found in this study. For example, the deviation between simplified 2D FEA model and the measurement result can be reduced by considering the magnetic saturation phenomenon in the LPS. Moreover, an optimization algorithm and a multi-objective goal, which includes power loss and the current response time could be used to optimize coil winding parameters in further study.

Author Contributions

Conceptualization, S.W.; methodology, S.W.; software, S.W.; validation, S.W. and Z.W.; formal analysis, S.W.; investigation, S.W.; resources, Z.W.; data curation, S.W.; writing—original draft preparation, S.W.; writing—review and editing, S.W. and B.J.; visualization, S.W.; supervision, B.J.; project administration, B.J.; funding acquisition, Z.W. and B.J. All authors have read and agreed to the published version of the manuscript.

Funding

This research was funded by Ningbo Municipal Bureau of Science and Technology, Grant Number 2019B10052.

Acknowledgments

The authors would like to thank Ya Hui Guan for her contribution in review work.

Conflicts of Interest

The authors declare no conflicts of interest.

References

  1. Sefkat, G. The design optimization of the electromechanical actuator. Struct. Multidisc. Optim. 2009, 37, 635–644. [Google Scholar] [CrossRef]
  2. Meng, F.; Chen, H.; Liu, H.; Han, B.; Nie, X. The optimisation of a proportional solenoid valve design for heavy vehicle active suspension system. Int. J. Vehicle Des. 2015, 68, 180–200. [Google Scholar] [CrossRef]
  3. Wang, L.; Li, G.; Xu, C.; Xi, X.; Wu, X.; Sun, S.P. Effect of characteristic parameters on the magnetic properties of solenoid valve for high-pressure common rail diesel engine. Energy Convers. Manag. 2016, 127, 656–666. [Google Scholar] [CrossRef]
  4. Chen, C.; Chiang, M. Development of Proportional Pressure Control Valve for Hydraulic Braking Actuator of Automobile ABS. Appl. Sci. 2018, 8, 639. [Google Scholar] [CrossRef] [Green Version]
  5. Yang, Y.; Liu, J.; Ye, D.; Chen, Y.; Lu, P. Multiobjective optimal design and soft landing control of an electromagnetic valve actuator for a camless engine. IEEE-ASME Trans. Mechatron. 2013, 18, 963–972. [Google Scholar] [CrossRef]
  6. Yoon, S.; Hur, J.; Chun, Y.; Hyun, D. Shape optimization of solenoid actuator using the finite element method and numerical optimization technique. IEEE Trans. Ind. Electron. 1997, 33, 4140–4142. [Google Scholar] [CrossRef]
  7. Yang, W.; Guo, J.; Liu, Y.; Zhai, G. Multi-Objective Optimization of Contactor’s Characteristics Based on RBF Neural Networks and Hybrid Method. IEEE Trans. Magn. 2019, 99, 1–4. [Google Scholar] [CrossRef]
  8. Shin, Y.; Lee, S.; Choi, C. Shape Optimization to Minimize the Response Time of Directacting Solenoid Valve. J. Magn. 2015, 20, 193–200. [Google Scholar] [CrossRef] [Green Version]
  9. Liu, P.; Fan, L.; Zhou, W.; Ma, X.; Song, E. Dynamic performances analysis and optimization of novel high-speed electromagnetic actuator for electronic fuel injection system of diesel engine. J. Mech. Sci. Technol. 2017, 31, 4019–4028. [Google Scholar] [CrossRef]
  10. Plavec, E. Genetic Algorithm Based Plunger Shape Optimization of DC Solenoid Electromagnetic Actuator. In Proceedings of the IEEE TELFOR, Belgrade, Serbia, 22–23 November 2016. [Google Scholar] [CrossRef]
  11. Park, C.; Lim, B.; Chung, K. Design verification methodology for a solenoid valve for industrial applications. J. Mech. Sci. Technol. 2015, 29, 677–686. [Google Scholar] [CrossRef]
  12. Yamada, H.; Kihara, S.; Yamaguchi, M.; Nakagawa, H.; Hagiwara, K. Static thrust improvement of a linear proportional solenoid. J. Magn. Soc. Jpn. 1994, 9, 117–121. [Google Scholar] [CrossRef]
  13. Hung, N.; Lim, O. Improvement of Electromagnetic Force and Dynamic Response of a Solenoid Injector Based on the Effects of Key Parameters. Int. J. Automot. Technol. 2019, 20, 949–960. [Google Scholar] [CrossRef]
  14. Li, S.; Nehl, T.; Gopalakrishnan, S.; Omekanda, A.; Namuduri, C.; Prasad, R. A Dynamic Solenoid Model for Fuel Injectors. In Proceedings of the IEEE Energy Conversion Congress and Exposition (ECCE), Portland, OR, USA, 23–27 September 2018. [Google Scholar] [CrossRef]
  15. Tao, G.; Chen, H.; J, Y.; He, Z. Optimal design of the magnetic field of a high-speed response solenoid valve. J. Mater. Process. Tech. 2002, 129, 555–558. [Google Scholar] [CrossRef]
  16. Cai, B.; Liu, Y.; Tian, X.; Wang, Z.; Wang, F.; Li, H.; Ji, R. Optimization of Submersible Solenoid Valves for Subsea Blowout Preventers. IEEE Trans. Magn. 2011, 47, 451–458. [Google Scholar] [CrossRef]
  17. Sun, Z.; Li, G.; Wang, L. Effects of structure parameters on the static electromagnetic characteristics of solenoid valve for an electronic unit pump. Energy Convers. Manag. 2016, 113, 119–130. [Google Scholar] [CrossRef]
  18. Lee, H.; Ahn, J.; Kim, H. Design of a Solenoid Actuator for a Cylinder Valve in a Fuel Cell Vehicle. Appl. Sci. 2016, 6, 288. [Google Scholar] [CrossRef] [Green Version]
  19. Zhao, J.; Wang, M.; Wang, Z.; Grekhov, L.; Qiu, T.; Ma, X. Different boost voltage effects on the dynamic response and energy losses of high-speed solenoid valves. Appl. Therm. Eng. 2017, 123, 1494–1503. [Google Scholar] [CrossRef]
  20. Lee, S.; Yi, H.; Han, K.; Kim, J. Genetic Algorithm-Based Design Optimization of Electromagnetic Valve Actuators in Combustion Engines. Energies 2015, 8, 13222–13230. [Google Scholar] [CrossRef]
  21. Wu, S.; Zhao, X.; Li, C.; Jiao, Z.; Qu, Y. Multiobjective optimization of a hollow plunger type solenoid for high speed on/off valve. IEEE Trans. Ind. Electron. 2017, 65, 3115–3124. [Google Scholar] [CrossRef]
  22. Wang, X.; Quan, L.; Luan, S. Dynamic and Static Characteristics of Double Push Rods Electromechanical Converter. Chin. J. Mech. Eng. 2019, 32, 62. [Google Scholar] [CrossRef] [Green Version]
  23. Cheng, Q.; Zhang, Z.; Xie, N. Power losses and dynamic response analysis of ultra-high speed solenoid injector within different driven strategies. Appl. Therm. Eng. 2015, 91, 611–621. [Google Scholar] [CrossRef]
Figure 1. Overall description of this performance optimization strategy.
Applsci 10 04352 g001
Figure 2. Simplified 2D finite element analysis (FEA) model of linear proportional solenoid (LPS). (a) geometry structure and the design parameters; (b) the mesh of the 2D FEA model.
Applsci 10 04352 g002
Figure 3. Geometry structure definition of the LPS.
Applsci 10 04352 g003
Figure 4. Verification of simplified 2D FEA model: (a) push force comparison; (b) flux density field result of the 3D FEA model; (c) flux density field result of the 2D FEA model.
Applsci 10 04352 g004aApplsci 10 04352 g004b
Figure 5. Magnetic property of pure iron.
Applsci 10 04352 g005
Figure 6. The flow chart of the genetic algorithm (GA) optimization steps.
Applsci 10 04352 g006
Figure 7. The multi-objective GA optimization iteration result of the LPS shape parameters.
Applsci 10 04352 g007
Figure 8. Schematic of performance test: (a) test device; (b) test and acquisition system.
Applsci 10 04352 g008
Figure 9. Experimental test results of the static force versus displacement in different magnetomotive force condition.
Applsci 10 04352 g009
Figure 10. Comparison of optimization objectives values based on measured force in the working stroke: (a) average force; (b) standard deviation of the force; (c) force to mass ratio.
Applsci 10 04352 g010
Figure 11. Simplified equivalent circuit of the LPS coil.
Applsci 10 04352 g011
Figure 12. Theoretical response time of the rated current at end position of the working stroke.
Applsci 10 04352 g012
Figure 13. The 50-Hz current input signal response comparison of the three types LPS: (a) start position of the working stroke; (b) middle position of the working stroke; (c) end position of the working stroke.
Applsci 10 04352 g013
Figure 14. Frequency response of the push force at fixed air gap.
Applsci 10 04352 g014
Figure 15. Magnetic Hysteresis Loops of pure iron and electrical steel in DC-magnetic field and AC-magnetic field of 20 Hz,50 Hz and 100 Hz.
Applsci 10 04352 g015
Figure 16. Force–response comparison of the three types LPS. (a) 1-Hz-current input signal; (b) 20 Hz current input signal; (c) 50-Hz-current input signal; (d) 70-Hz-current input signal.
Applsci 10 04352 g016
Figure 17. The three types of manufactured LPSs.
Applsci 10 04352 g017
Table 1. The values and the design ranges of key design parameters and the key characteristics of the design results.
Key Parameter and Key CharacteristicRange of the Design Parameter (mm)Conventional Type LPSOptimal Type LPSElectrical Steel Optimal Type LPS
length of the armature—a125 mm–34.4 mm31.4 mm32.3 mm33.2 mm
radius of the armature—a2correlated to c2 and y69.02 mm9.65 mm10.15 mm
depth of the spring hole—a34 mm–20 mm16.9 mm4.7 mm8 mm
thickness of the spring hole sleeve—a43 mm–8 mm4.5 mm5.2 mm4.5 mm
thickness of the stator—y14 mm–8 mm5.5 mm5.5 mm4.9 mm
non-magnetic ring—y23.5 mm–3.9 mm3.7 mm3.6 mm3.7 mm
non-magnetic ring—y31.5 mm–5 mm3 mm2.5 mm3.3 mm
non-magnetic ring—y43 mm–6 mm3.9 mm3.4 mm3.3 mm
non-magnetic ring—y51 mm–3 mm1 mm2.6 mm2.2 mm
thickness of the armature sleeve—y61.5 mm–3 mm2 mm2.3 mm1.9 mm
length of the coil—c1correlated to c18.2 mm7.7 mm7.6 mm
thickness of the coil—c26 mm–8.5 mm41.5 mm43.8 mm44.6 mm
moving mass 85.8 g99.1 g112.1 g
rated average force 123.4 N149.6 N131.3 N
force response frequency 32.7 Hz52.8 Hz57.0 Hz
Table 2. Cutoff frequency of the three types of the LPS at different position in the working stroke.
PositionConventional Type LPSOptimal Type LPSElectrical Steel Optimal Type LPS
start position31.6 Hz54.8 Hz72.4 Hz
middle position34.7 Hz52.8 Hz62.3 Hz
end position32.7 Hz51.5 Hz57.0 Hz

