1. Introduction
The steering system plays a very important role in a motor vehicle, and its correctness is of great importance for passengers’ safety, since it is one of the most important systems of active safety within a vehicle [
1]. Thus, the quality of a steering system must be high in each sense, and the maintenance of its quality and reliability also plays a very important role [
2] and must be applied on all vital parts of a steering system. The protective parts—cuffs—are the elements that are considered by the majority of people as not very important, when they actually play a very significant part in the proper operation and lifespan of a steering system [
3]. Cuffs have the task of protecting the working elements of a steering head, as the most important part of a steering system, against the impacts of ambient factors and their very failure is, in most cases, responsible for other failures occurring later on in a steering system.
The topic of this research is the experimental and numerical testing of a steering system’s cuffs, with special attention paid to the impact of ambient temperatures on their exploitation lifespans. It is assumed that external factors, the first being ambient temperatures where a vehicle is exploited, impact their exploitation lifespans, i.e., the lifespans of cuffs. This assumption is according to ascertainment which are presented in [
4], stating that the properties of rubber depend, often to a considerable extent, on its history before testing and the atmospheric conditions under which the test was carried out. That is, the results are affected by the age of the rubber, the conditions such as temperature and humidity under which it was stored, any mechanical deformation before the test, and the temperature and humidity at the time of the test. Thus, to produce consistent results, it is essential that these factors are controlled within suitable limits.
Different working temperatures have different influences on the mechanical properties of the products of rubber. The ageing reactions in rubber materials will accelerate with the increase in temperature, which will lead to a decline in its anti-fatigue property. Under the action of repeated loads, fatigue failure is easily caused, and then potential safety hazards are generated. Therefore, the effective prediction of fatigue life at different temperatures is of great significance for the timely replacement and extension of the service life of rubber products.
In many applications in the automotive industry, rubber parts are subjected to cyclic loading and it is essential to predict the stresses and temperatures to avoid premature failure and to estimate the service life of rubber parts [
5,
6,
7,
8,
9,
10,
11,
12,
13,
14]. The prediction of rubber fatigue life under the influence of temperature is faced with two major difficulties. On the one hand, it is necessary to carry out the corresponding fatigue test and establish a model to analyze the fatigue characteristics of such parts because of the large variation of ambient temperature and complex loading conditions; on the other hand, there is the difficulty of how to establish the relationship between temperature and fatigue life models to predict the rubber fatigue life at different temperatures. Fatigue life prediction at different temperatures has a huge significance for rubber components to ensure their reliability and safety. There are a number of studies on the fatigue life of rubber, but there is less research into fatigue life predictions when considering temperature factors. Although several sources have carried out some tests to research the influence of temperature, none of them established a prediction model that chose the temperature as the dependent variable [
15,
16,
17,
18,
19,
20]. Mars and Fatemi [
21] showed that the rubber fatigue life changes with temperature and that there are variabilities across different rubber compounds. Duan et al. [
22] carried out the uniaxial tensile fatigue test on both the specimens with two different harnesses (45 and 50) and three filled natural rubbers at different temperatures. Then, several kinds of fatigue life prediction models were established using the engineering strain as the damage parameter based on the experimental data at different temperatures. Neuhaus et al. [
23] carried out fatigue tests to study the direct influence of chemical and thermal ageing on the fatigue life of natural rubber, and he also studied the various influences of high temperature on fatigue life further. Elastomeric butt joints were studied by Kakavas et al. [
24] by a combination of the finite element method and Mooney–Rivlin model. However, the above researchers only studied the fatigue characteristics under the influence of temperature from the perspective of the type of rubber materials and the selection of fatigue damage parameters, and no model was established to demonstrate the relationship between temperature and fatigue life prediction [
15].
Real, accurate data were used, obtained by recording the number of oscillations on a simulator performing a linear harmonic motion, which was specially made for the purposes of the testing of the remaining lifespan of cuffs. Here, fatigue was taken to cover only changes resulting from repeated cyclic deformation, which means, in effect, long thermodynamic testing. In many products from rubber, it is the loss in strength shown by cracking, and/or complete rupture, which is considered to be the important aspect of fatigue and this is the measure of fatigue which is normally used in laboratory tests on products from rubber [
4].
The motive for this research was based on a finding that vehicles that are exploited in the northern parts of Montenegro show a need for more frequent interventions on their steering systems than the vehicles exploited in the southern parts. It is a fact that a big number of works dealing with the issue of maintenance of active systems in which a steering system is one of the most important components have been written. However, a very small number of papers deal with the analyzing causes of failures, where a cuff’s failure was identified as the key cause of the failure of a steering system, with special attention paid to the impact of ambient temperatures on a vehicle’s lifespan. Only the shortage of papers dealing with the study of the abovementioned failures was the main motive for our research.
The goal of our research was to find out in what way the ambient temperatures at which a vehicle is exploited have an impact on a cuff’s lifespan. The task was to determine after which time of testing the defects on a cuff will be noticed, and to determine whether the cuffs taken from a vehicle used in the northern part of Montenegro have shorter lifespans in comparison with those used in southern areas, and the ways in which the testing temperatures of a refrigerating chamber will reflect on the lifespans of cuffs. In order to achieve this goal, it is necessary to execute the classification and selection of vehicles from which cuffs, convenient for analyses, should be taken.
2. Materials and Methods
2.1. Hypothesis of the Research
Hypothesis: A cuff’s lifespan depends on the characteristics of the environment in which the vehicle is exploited, i.e., on the climatic conditions, with the primary dependence on its ambient temperature.
2.2. Methodology of the Research
The first phase of the research was related to the classification of vehicles from which the cuffs would be taken for the research. The selection of cuffs for testing was executed on the basis of the geographic area where a vehicle had been used for most of the time, the number of kilometers travelled, the manufacturing year, the vehicle’s category and the type of steering system. It was necessary to provide a certain number of cuff samples obtained from various areas where these were used in order to carry out the research. Since the goal of the research was to determine the impact of ambient temperature on a cuff’s lifespan, it was necessary to supply a certain number of samples from the area with relatively high temperatures and favorable weather conditions (southern), and a similar number of samples from the areas with low temperatures and bad weather conditions (northern).
The second phase provides the testing of samples under various conditions, namely in various temperature conditions. The selected samples will be tested on temperatures from 4 °C to 20 °C, and temperatures from −4 °C to −20 °C, in two temperature ranges that are close to temperature ranges characteristic of the southern and northern region. To be more specific, the ambient temperatures in the southern and northern region were simulated. All selected samples of cuffs were tested both on temperature ranges from 4 °C to 20 °C and from −4 °C to −20 °C.
The third phase was the analysis of the results obtained, based on which the conclusions about the mentioned impact should be drawn.
Our approach to the research is both quantitative and qualitative. As for the quantitative data, these are related to the number of cycles that the cuffs will undergo during the testing process. However, besides the quantitative approach, a qualitative approach will also be applied on one part of the work. Of the qualitative methods, a comparative analysis for the comparison of lifespans of cuffs taken from vehicles exploited in the south and cuffs taken from vehicles exploited in the northern region of Montenegro will be used.
It has been experimentally proven that tire stiffness decreases with an increasing number of cycles during dynamic testing, as shown in
Figure 1 [
22]. From the experimental results of a series of static and cyclic loading tests, it is clear that the effects of thermal aging on the fatigue parameters of rubber compounds are significant and should be taken into account in designing rubber components [
25,
26,
27,
28].
2.3. Description of the Experimental Setup
The structure of the experimental setup, made only for the purpose of the experimental testing of cuffs’ lifespans, is presented below. Besides the description of the experimental setup, the procedure for testing cuffs depending on the region where a vehicle was exploited is also explained.
The process of the experimental testing was divided into two stages:
The experimental setups differ depending on the temperature range at which a cuff is tested.
Figure 2 presents the experimental setup for the testing at a temperature range from 4 °C do 20 °C. The main part of the experimental setup consists of an oscillator performing a harmonic oscillatory motion. The driving structure of the simulator consists of a three-phase electromotor and a reducer, which makes a rotational motion by its operation and converts it through a transfer mechanism into a linear harmonic motion. There are breakers on its control panel for starting the electromotor, temperature sensor and the oscillation counter (Manufactured by Shande Electric Factory-Zhejiang, China; type BENKPAK, model BNK-NPN5P). The oscillation counter is limited to six digits, but periodical checks will serve to control and record the number of oscillations when these are exceeded. The simulator supports the testing of two cuffs simultaneously. The frequency and amplitude of oscillations are constant during the operation of the simulator.
Figure 2 presents the schematic structure of the experimental setup for testing cuffs at a temperature range from 4 °C to 20 °C.
Its additional capacity, presented in
Figure 2, is the setting of an oscillation amplitude by the screwing and unscrewing of movable body 2a or 2b on which a cuff part with a smaller diameter is placed, and this can be done both on the first and second part. Parts 3a and 3b are immovable parts, which serve to assist in the installation of a part of a cuff with a bigger diameter.
In order to better describe the process of testing the cuffs,
Figure 3 presents a cuff in three characteristic positions.
A maximal motion of a cuff, namely the sum of amplitudes from a balance position “0” is ≈150 mm (“-A” to the position “A”).
A simulator is made in order to perform 107 oscillations in a minute (n = 107°/min).
The oscillation period concerns the interval of duration of one oscillation T [s]:
The frequency concerns the number of oscillations in one unit of time ν [Hz]:
Figure 4 presents the experimental setup for the testing cuffs at a temperature range from −4 °C to −20 °C. This simulator also supports the testing of two cuffs simultaneously. The frequency and amplitude of oscillation are constant during the simulator’s operation, as in the previous case. The adjustment of the experimental setup has been made due to the temperature of the environment where the testing is carried out and, hence, the simulator part on which the cuffs are placed is positioned in a thermo-insulated chamber with a refrigerating device (refrigerating chamber).
The temperatures inside the chamber varied within the interval from −4 °C to −20 °C, and the reason for this was the detailed periodic control of the cuffs, in which cases the chamber’s lid had to stay open for some time.
Figure 4 presents the schematic structure of the experimental setup for the testing cuffs in the temperature range from −4 °C to −20 °C.
2.4. Description of the Experimental Testing of Cuffs
The testing procedure consisted of three phases:
The first phase—classification of vehicles and recording of cuff data;
The second phase—testing on temperature ranges from 4 °C to 20 °C and −4 °C to −20 °C;
The third phase—analyzing the obtained data.
In order to execute the testing procedure, it is necessary to classify the vehicles according to the region where they were exploited.
During the classification of vehicles, it was especially important that the samples of cuffs were taken from vehicles with similar characteristics in terms of their type, the number of kilometers travelled, steering system type and manufacturing years, but different areas of exploitation. It was also important for our research that vehicles exploited in the southern region had not left this region for a long time, and the same provision applied for the vehicles used in the southern region. After the classification was done, the cuffs that were taken off from vehicles had to be completely usable, without any damages or cracks, and the number of kilometers travelled was recorded in that moment. The next step in the first phase was the recording of basic data about the cuffs before the start of testing, and
Figure 5 gives the profile of the cuffs with their characteristic measurements, such as the following:
2.4.1. The Classification of Vehicles, Collecting Data about the Cuffs and Experimental Testing at Temperatures from 4 °C to 20 °C
Table 1 presents the classification of vehicles according to the first phase of testing.
Having finished the classification, the second step of the first phase was related to the collection of basic data about the cuffs that were taken from the previously mentioned vehicles, as presented in
Table 2.
Table 2 shows that the sum of the amplitudes of the cuffs’ oscillations on the simulator is approximately equal to the sum of the real oscillation amplitudes, namely the real motion of a vehicle’s cuff. The motion made by the cuff on the simulator is achieved by a vehicle in exceptional situations, such as parking processes, while moving around bends in the road, during sudden turns and the semi-circular turning of a vehicles.
After the first phase was completed, the cuffs were mounted on the simulator and then the second testing phase started. The process of testing was carried out in a room where the ambient temperature recorded by a thermometer was in the range from 4 °C to 20 °C.
As already mentioned, the cuffs that had been classified by the region and other parameters important for this work were used for the investigation. Therefore, two cuffs from different regions of use were taken, and then were introduced in the testing process. When the first crack was observed on one of the cuffs, its number of oscillations up to that moment was recorded. After this, the next adequate cuff was placed on the simulator, and the process started again.
The occurrence of cracks results from a stochastic nature and the size and number of cracks cannot be foreseen during the testing process. Due to the impossibility of the use of a sensor to trace the work of a cuff and to respond to the change in state, namely the occurrence of a crack and, finally, the destruction of a cuff, the tracing was based on periodic terminations of the work and visual checks of the state of the cuffs.
Figure 6 presents the start and end of the testing process of the cuff taken from a vehicle made by Volkswagen, which was exploited in the northern region for a long time. The ambient temperature during the testing process ranged from 14.8 °C to 19.4 °C, and the cuff that had been exploited in the northern region was damaged after 2,599,876 oscillations of the simulator (the testing lasted about 16 days and 21 h).
2.4.2. The Classification of Vehicles, Collecting Data from the Cuffs and the Experimental Testing at Temperatures from −4 °C to −20 °C
It is important to note that the simulator was reconfigured for this testing process, where a thermo-insulated chamber with a refrigerating device was embedded, and this device achieved temperatures from −4 °C to −20 °C during the testing process. The conditions for the exploitation of vehicles in the northern region were approximated and, hence, it was expected that the test results would help to prove the hypothesis.
Based on this phase, the classification of vehicles, presented in
Table 3, was performed.
Upon the classification executed, the second step in the first phase was also related to the collection of basic data about the cuffs taken from the vehicles and is presented in
Table 4.
The experimental testing of the cuffs at the temperature range from −4 °C to −20 °C was carried out in the refrigerating chamber, thanks to which it was possible to make temperatures of this range, corresponding to temperatures in the northern region. As in the previous testing phase, periodic checks of the cuffs’ states were performed and, after one of them failed, the second one was immediately embedded. The disadvantage of this procedure is the process of the periodic check of the state where the chamber’s lid had to be left open for several moments, which resulted in a temperature rise.
The procedure of testing cuffs was photographed from its very beginning, including preventive checks, but only the pictures for the start and end of the testing process are given because of limited space.
Figure 7 presents the beginning and end of the process of testing cuffs from a Volkswagen vehicle, which was exploited in the northern region for a long time.
The temperature during the testing in the refrigerating chamber ranged from −14.1 °C to −15.1 °C, while the number of oscillations for which failure occurred was 1,554,906 (the testing lasted about 10 days and 2 h).
The third phase consists of analyzing the obtained data and is given further in
Section 4.
3. Numerical Analysis of a Steering System’s Cuff in a Vehicle
The numerical analysis was performed in order to simulate elastic behavior of cuff-like material at two different temperatures, namely at −20 °C and 20 °C, under monotonic tensile test conditions. The 3D model of a cuff was previously carried out in an AutoCAD/ANSYS software environment and is presented in
Figure 8.
The boundary conditions were given, as in the experimental tests (max. stretching 75 mm),
Figure 9.
The non-linear stress–strain behavior was modeled with the two-parameter phenomenological Mooney–Rivlin model, which works well for moderately large strains in uniaxial elongation [
29]:
where
C10 and
C01 are material coefficients (MPa), and λ is the coefficient of a stretch (stretch ratio (–)). When dealing with large strains, it is convenient to define a stretch ratio instead of strain. A stretch ratio is defined as the ratio of stretched length and original length in each of the three mutually normal axes.
The estimation of the mechanical properties of a cuff-like material at specified temperatures is formulated according to the algorithm given in [
16].
To assess the increase in material stiffness with decreasing temperature, the maximum principal stress/strain was taken as a damage criterion. The stress values for the analyzed strains at specified temperatures were read from the modeled stress–strain diagrams for a similar test material, as presented in [
17]. Then the material coefficients were determined and the equivalent tensile (van Mises) stresses of the cuff were calculated.
Based on this, and appropriate fatigue damage parameters, a fatigue life prediction model could be set up, and fatigue characteristics under different temperatures could be predicted by a relationship between the model parameters and temperature, such as that in [
15,
16,
17,
18,
19,
20].
The results of the numerical testing are presented in the next section.
4. Results and Discussion
The last section of this manuscript, and the most important, has been devoted to the presentation of answers on our hypothesis, “A cuff’s lifespan depends on the characteristics of the environment in which the vehicle is exploited, i.e., on the climatic conditions, with the primary dependence on its ambient temperature”. The answers to this hypothesis were given based on the results of our previously described experimental tests.
4.1. The Test Results of Cuffs at Temperatures from 4 °C to 20 °C
The test results of the cuffs at temperatures from 4 °C to 20 °C, which correspond to the exploitation conditions in the southern region, are given below. Eight samples of cuffs, of which four were taken from vehicles exploited in the northern region, and four were from vehicles exploited in the southern region, were tested. The results of the number of oscillations to which the samples were exposed, and other relevant data, are given in
Table 5.
Table 5 shows that the termination of testing occurred for a sample from the southern region because the number of oscillations was much larger than for the samples from the northern region, and no cracks or damage emerged on the cuffs. It can be observed that, for the samples from vehicles of the same manufacturers with approximately the same number of kilometers travelled, the cuffs from vehicles exploited in the southern region survived three times more oscillations than that of the northern region.
4.2. The Test Results of Cuffs at Temperatures from −4 °C to −20 °C
The test results of the cuffs at temperatures from −4 °C to −20 °C, corresponding to the exploitation conditions in the southern region, are presented below. Four samples of the cuffs from the northern region, and three from vehicles used in the southern region were tested. The results of the number of oscillations to which the samples were exposed, as well as other relevant data, are given in
Table 6.
After analyzing
Table 6, it can be seen that, unlike the previously described testing, damage to the cuffs that had been exploited in the southern region did occur. This is the same as in the case of the previous group tested. It can be observed that more than double the number of oscillations occurred before the failure of the cuffs that were exploited in the southern region compared to cuffs the other region, taken from vehicles that had approximately the same number of kilometers travelled and were made by the same manufacturers.
4.3. The Results of the Numerical Analysis
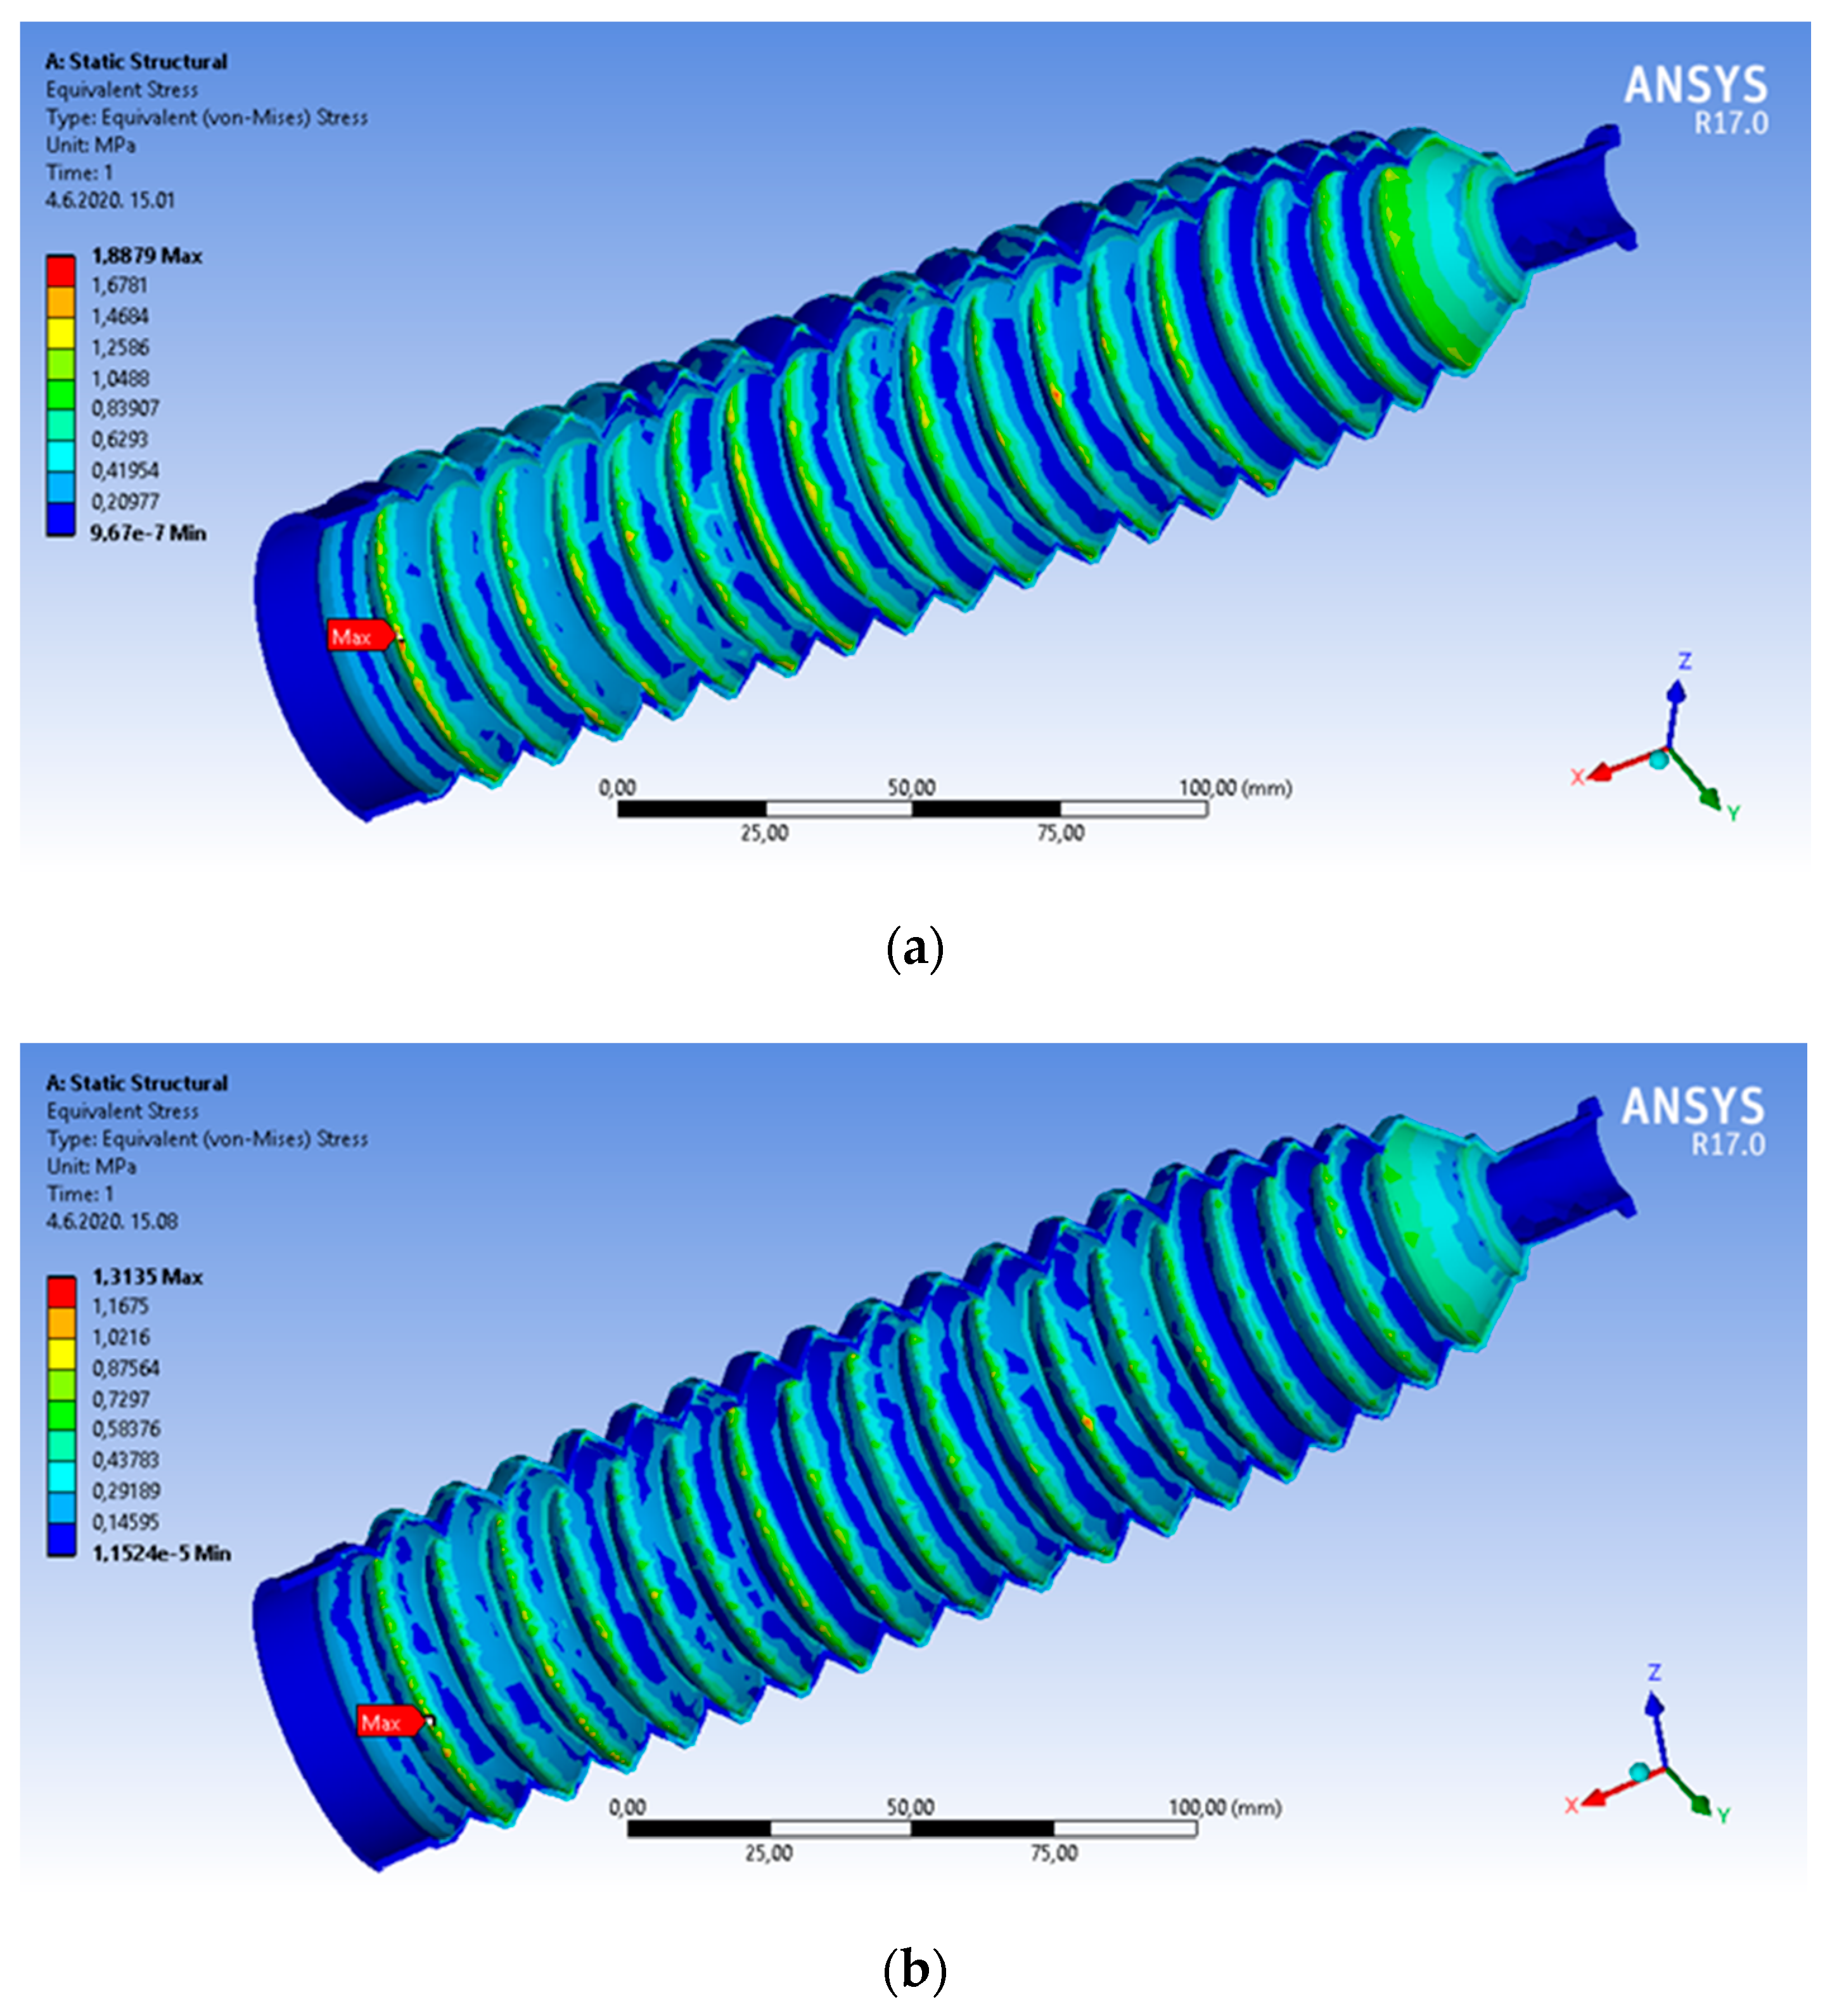
The numerical analysis shows that the maximum equivalent stresses at a temperature of −20 °C (1.8879 MPa) are about 30% higher than those at a temperature of 20 °C (1.3135 MPa). This is due to the known effect of the reduced the elasticity of materials (increasing stiffness) at lower temperatures.
Moreover, we have shown that the failure of a cuff in a vehicle could be expected at almost the same point where it was experimentally proven, because the maximal equivalent von Mises stress appears there. The maximal equivalent stresses are, however, smaller than the boundary of the breakage of test material. The failure, namely the breakage of a cuff, is a consequence of material fatigue due to a large number of oscillations, as well as the impact of various (ambient) temperatures during the oscillations of a cuff. Therefore, it is important to know the appropriate fatigue damage parameters of the material, as the effective prediction of fatigue life at different temperatures is of great significance for the timely replacement of cuffs and extension of the service life of them.
4.4. The Comparative Analysis of Test Data
If the test results of the cuffs taken from vehicles used in the southern region are analyzed for the conditions of exploitation, simulating driving in the northern region, it can be seen that the cuffs have a shorter remaining lifespans in comparison with the test results for the cuffs used at temperature conditions simulating the exploitation in the southern region. The same conclusion can be drawn when the test results for the cuffs taken from vehicles from the southern region are considered separately; thus, the number of oscillations in the conditions simulating the exploitation in the southern region was two times bigger in comparison with the test results in the exploitation conditions simulating the northern region, so the testing was terminated, although there were no failures in the cuffs.
Regarding all the results presented in
Table 7, it can be concluded that a cuff’s lifespan is evidently dependent on the ambient temperatures where a vehicle is exploited, namely that its lifespan is shorter at lower ambient temperatures. Therefore, we experimentally verified our hypothesis.
At first glance, the relatively small sample compromises the validity of the conclusion, but by keeping in mind that all the test results fully indicated the accuracy of the hypothesis, the results could be accepted without hesitation.
The experimental research lasted more than 228 days, bearing in mind that, in most cases, two cuffs were simultaneously tested on the simulator.
A comparative analysis of the results for the tested cuffs taken from vehicles exploited in different regions, namely at different temperatures ranging from 4 °C to 20 °C, corresponding to the temperatures in the southern region for a large part of the year and the second group of samples, tested at a temperature of −4 °C to −20 °C, which is a characteristic of the northern region for a significant part of the year, were carried out in this paper. Therefore,
Table 7 presents the results from both tested groups and a comparison is also given.
The schematic presentation facilitates a better visual understanding of the obtained results, which serve to prove the negative impact of low temperatures on a cuff’s lifespan, which, in previously described experiments, was presented through the number of oscillations a cuff underwent before its failure on the adapted simulator.
Figure 12 gives a better overview of the obtained results from two groups of cuffs that were tested at different temperature conditions.
The numerical analysis has shown that the maximal equivalent stresses at different temperatures are smaller than the breakage boundary of the cuff’s material. The results of our experimental research have proven that the failure of a cuff, namely breakage, is not exclusively the consequence of material fatigue due to a large number of oscillations, but that the failure depends on ambient temperatures where the cuff, namely within a vehicle, was used. Therefore, our effective fatigue life prediction at different temperatures has a profound significance for the manufacture of cuffs to ensure their reliability and safety.
5. Conclusions
The basic purpose of this paper was the testing of the ambient temperature impact on the lifespan of vehicle steering system cuffs. The motive for the realized research emerged on the basis of the authors’ observation that the vehicles used in the northern region of Montenegro show more frequent need for interventions in their steering systems than vehicles exploited in the southern region.
The main hypothesis set in this paper was: “A cuff’s lifespan depends on the characteristics of the environment in which the vehicle is exploited, i.e., on the climatic conditions, with the primary dependence on its ambient temperature”. Keeping in mind that the simulator was used to prove the hypothesis, the research was based on an experimental method. The testing was carried out on a simulator that makes linear harmonic oscillatory motions, where the number of oscillations were registered and then an analysis of the obtained data was executed for the purpose of proving the hypothesis. Based on the experimental testing, it can be concluded that the climate conditions in the northern region, and low ambient temperatures, in the first instance, have a negative impact on the lifespans of cuffs.
The results of our experimental research have proved that the failure of a cuff, namely the breakage of a cuff, is not exclusively the consequence of material fatigue due to a large number of oscillations, but that the failure depends on the ambient temperatures where the cuff, namely within a vehicle, was used.
Based on our comparative analysis of the obtained results, a comparison of the role of the area of use, namely the region of exploitation, for a longer time interval and test temperature was made. The analysis showed that the cuffs from vehicles that were in use in the northern part of Montenegro, in both observed temperature ranges during the experiment, have a significantly shorter remaining lifespan compared to the cuffs from vehicles from the southern part. The numerical analysis shows that the maximum equivalent stresses at a temperature of −20 °C are about 30% higher than those at a temperature of 20 °C. This is due to the known effect of increasing stiffness at lower temperatures.
In other words, the cuffs from vehicles used in the northern region of Montenegro, in conditions with frequent low temperatures, bad weather, salt and sand on roadways to combat snow or ice, have drastically shorter lifespans in comparison with those vehicles used in more favorable conditions of the ambient temperature, namely in the southern region of Montenegro.
The obtained results are, in the first instance, very significant for the owners of vehicles who live and work in areas where, for a large part of the year, low temperatures are present. Based on the test results, we recommend that vehicle owners more frequently perform preventive checks to reduce possible problems caused by a cuff failure, such as a malfunction of the steering system head. Therefore, it is important to know the appropriate fatigue damage parameters of the material, as the effective prediction of fatigue life at different temperatures is of great significance for the timely replacement of cuffs and the extension of the service life of a steering system.
Finally, it should be noted that there is more space for research in this area, keeping in mind that a large amount of data was unavailable, and the fact that, in similar papers with cuffs as the object of the research, there were limits to this research. The testing took a very long time (seven months and a half), but only a small number of samples was processed. Note that the given research was not financially helped by means of any project or sponsor, meaning that all of the previously presented research is the result of the authors’ enthusiasm and their wish to realize the planned research. It would be interesting to include, in the testing process, the impacts of other factors that could negatively influence a cuff’s lifespan. Thus, these ideas represent possible directions for future research.
Author Contributions
Conceptualization, P.N., R.V., V.P., S.S. and M.D.; methodology, P.N., R.V and V.P.; conceived and designed the system P.N.; performed the experiments and realized the system P.N.; software, S.S. and M.D.; validation, R.V. and V.P.; writing—original draft preparation, P.N. and R.V.; offered useful suggestions for the preparation and writing of the paper, S.S. and M.D.; writing—review and editing, R.V., V.P., S.S. and M.D. All authors have read and agreed to the published version of the manuscript.
Funding
This research received no external funding.
Acknowledgments
This research did not receive any specific grant from funding agencies in the public, commercial, or not-for-profit sectors.
Conflicts of Interest
The authors declare no conflict of interest.
Nomenclature
| T | oscillation period |
| n | number of oscillations in a minute |
| ν | oscillation frequency |
| L | length of cuff |
| d1 | smaller diameter of a cuff |
| d2 | bigger diameter of a cuff |
| TE | thermoplastic elastomers |
| EPDM | ethylene propylene diene monomer |
| PP | polypropylene |
| TPV | thermoplastic vulcanizates |
References
- Nikolić, B.; Nikolić, D.; Vujadinović, R. Motor Vehicles I—Fundamentals of Motor Vehicles, 1st ed.; Doclean Academy of Sciences&Institute for Transport: Podgorica, Montenegro, 2006; ISBN 86-85779-00-6. [Google Scholar]
- Knowles, D. Automotive Suspension and Steering Systems, 3rd ed.; Cengage Learning: Boston, MA, USA, 2002. [Google Scholar]
- Nikčević, P.; Vujadinović, R. Periodic and aperiodic maintenance of hydraulic power steering systems on vehicles. In Proceedings of the XIV International Conference on Maintenance and Production Engineering—KODIP 2017, Budva, Montenegro, 14–17 June 2017; pp. 209–216. [Google Scholar]
- Brown, R. Physical Test Methods for Elastomers, 1st ed.; Springer International Publishing: New York, NY, USA, 2018. [Google Scholar]
- Nagode, M.; Šeruga, D. Fatigue life prediction using multiaxial energy calculations with the mean stress effect to predict failure of linear and nonlinear elastic solids. Results Phys. 2016, 6, 352–364. [Google Scholar] [CrossRef] [Green Version]
- Cho, J.R.; Yoon, Y.H.; Seo, C.W.; Kim, Y.G. Fatigue life assessment of fabric braided composite rubber hose in complicated large deformation cyclic motion. Finite Elem. Anal. Des. 2015, 100, 65–76. [Google Scholar] [CrossRef]
- Palfi, L.; Varadi, K. Characterization and implementation of the viscoelastic properties of an EPDM rubber into FEA for energy loss prediction. Period. Polytech. 2010, 54, 35–40. [Google Scholar] [CrossRef]
- Shahzad, M.; Kamran, A.; Zeeshan Siddiqui, M.; Farhan, M. Mechanical Characterization and FE Modelling of a Hyperelastic Material. Mater. Res. 2015, 18, 918–924. [Google Scholar] [CrossRef] [Green Version]
- Jahani, K.; Mahmoodzade, H. Predicting the dynamic material constants of Mooney-Rivlin model in broad frequency range for elastomeric components. Lat. Am. J. Solids Struct. 2014, 11, 1983–1998. [Google Scholar] [CrossRef] [Green Version]
- Berton, G.; Cruanes, C.; Lacroix, F.; Méo, S.; Ranganathan, N. Study of the fatigue behavior of the polychloroprene rubber with stress variation tests. Procedia Eng. 2015, 101, 413–420. [Google Scholar] [CrossRef]
- Marckmann, G.; Verron, E. Comparison of hyperelastic models for rubber-like materials. Rubber Chem. Technol. Am. Chem. Soc. 2006, 79, 835–858. [Google Scholar] [CrossRef] [Green Version]
- Cheng, M.; Chen, W.; Song, B. Phenomenological Modeling of the Stress–Stretch Behavior of EPDM Rubber with Loading-rate and Damage Effects. Int. J. Damage Mech. 2004, 13, 371–381. [Google Scholar] [CrossRef]
- Cheng, M.; Chen, W. Experimental investigation of the stress–stretch behavior of EPDM rubber with loading rate effects. Int. J. Solids Struct. 2003, 40, 4749–4768. [Google Scholar] [CrossRef]
- Kim, W.D.; Hur, S.; Woo, C.S.; Kim, W.S.; LEE, S.B. A Study of the Static and Dynamic Characteristics for Automotive Rubber Mount by FEA and Experiment. Key Eng. Mater. 2005, 297, 299–304. [Google Scholar]
- Zhang, J.; Xue, F.; Wang, Y.; Zhang, X.; Han, S. Strain energy-based rubber fatigue life prediction under the influence of temperature. R. Soc. Open Sci. 2018, 5, 180951. [Google Scholar] [CrossRef] [Green Version]
- Park, B.; Lee, K.; Ki, M.; Kim, D.; Kim, H.S. A study on the properties estimation of hyperelastic material under low temperature conditions. In Proceedings of the 41st Solid Mechanics Conference—SOLMECH 2018, Warsaw, Poland, 27–31 August 2018. [Google Scholar]
- Lion, A. On the large deformation behaviour of reinforced rubber at different temperatures. J. Mech. Phys. Solids 1997, 45, 1805–1834. [Google Scholar] [CrossRef]
- Fu, X.; Wang, Z.; Ma, L.; Zou, Z.; Zhang, Q.; Guan, Y. Temperature-Dependence of Rubber Hyperelasticity Based on the Eight-Chain Model. Polymers 2020, 12, 932. [Google Scholar] [CrossRef] [PubMed] [Green Version]
- Sridhar, S.; Prasad, N.H.; Seetharamu, K.N. Estimation of temperature in rubber-like materials using non-linear finite element analysis based on strain history. Finite Elem. Anal. Des. 1998, 31, 85–98. [Google Scholar] [CrossRef]
- Li, X.; Dong, Y.; Li, Z.; Xia, Y. Experimental study on the temperature dependence of hyperelastic behavior of tire rubbers under moderate finite deformation. Rubber Chem. Technol. 2011, 84, 453–454. [Google Scholar] [CrossRef]
- Mars, W.V.; Fatemi, A. Factors that affect the fatigue life of rubber: A literature survey. Rubber Chem. Technol. 2004, 77, 391–412. [Google Scholar] [CrossRef]
- Duan, X.; Shangguan, W.-B.; Li, M.; Rakheja, S. Measurement and modelling of the fatigue life of rubber mounts for an automotive powertrain at high temperatures. Proc. Inst. Mech. Eng. Part D J. Automob. Eng. 2016, 230, 942–954. [Google Scholar] [CrossRef]
- Neuhaus, C.; Lion, A.; Johlitz, M.; Heuler, P.; Barkhoff, M.; Duisen, F. Fatigue behaviour of an elastomer under consideration of ageing effects. Int. J. Fatigue 2017, 104, 72–80. [Google Scholar] [CrossRef]
- Kakavas, P.A.; Giannopoulos, G.I.; Anifantis, N.K. Mixed finite element analysis of elastomeric butt-joints. ASME J. Eng. Mater. Technol. 2007, 129, 11–18. [Google Scholar] [CrossRef]
- Chou, H.W.; Huang, J.S.; Lin, S.T. Effects of Thermal Aging on Fatigue of Carbon Black–Reinforced EPDM. Rubber J. Appl. Polym. Sci. 2007, 103, 1244–1251. [Google Scholar] [CrossRef]
- Korba, A.G.; Kumar, A.; Sun, G.; Barkey, M.E. A Model for Calculating Hyperelastic Material Properties under Thermal Aging. J. Eng. Mater. Technol. 2018, 140, 1006. [Google Scholar] [CrossRef]
- Hamza, S.S. Effect of Aging and Carbon Black on the Mechanical Properties of EPDM Rubber. Polym. Test. 1998, 17, 131–137. [Google Scholar] [CrossRef]
- Delor-Jestin, F.; Lacoste, J.; Barrois-Oudin, N.; Cardinet, C.; Lemaire, J. Photo-thermal and natural ageing of ethylene-propylene-diene monomer (EPDM) rubber used in automotive applications. Influence of carbon black, crosslinking and stabilizing agents. Polym. Degrad. Stab. 2000, 67, 469–477. [Google Scholar] [CrossRef]
- Ziobro, J. Numerical analysis and experimental research of the rubber boot of the joint drive vehicle. Open Eng. J. 2016, 6, 79–85. [Google Scholar] [CrossRef] [Green Version]
Figure 1.
Variation in the dynamic stiffness of the rubber mount with the number of cycles [
22].
Figure 1.
Variation in the dynamic stiffness of the rubber mount with the number of cycles [
22].
Figure 2.
The schematic structure of the experimental setup for testing cuffs at a temperature range from 4 °C to 20 °C (Elements for setting oscillation amplitude: 1a/1b—contra thread 2a/2b—body for fastening of a smaller diameter of a cuff, 3a/3b—body for fastening of a bigger diameter of a cuff).
Figure 3.
The drawing of a cuff in three characteristic positions (1—cuff in an unloaded state, 2—maximally elongated, 3—maximally compressed, X0—amplitude).
Figure 3.
The drawing of a cuff in three characteristic positions (1—cuff in an unloaded state, 2—maximally elongated, 3—maximally compressed, X0—amplitude).
Figure 4.
The schematic structure of the experimental setup in the temperature range from −4 °C to −20 °C (Elements for setting an oscillation amplitude: 1a/1b—opposite thread 2a/2b—body for fastening of a smaller diameter of the cuff, 3a/3b—body for fastening of a bigger diameter of the cuff, 4—thermo insulated chamber with a refrigerating device).
Figure 5.
The schematic presentation of a cuff with characteristic measurements.
Figure 5.
The schematic presentation of a cuff with characteristic measurements.
Figure 6.
The presentation of the cuff’s state at the start and the end of the testing on sample no. 1, where the cuffs were on a vehicle exploited in the northern region.
Figure 6.
The presentation of the cuff’s state at the start and the end of the testing on sample no. 1, where the cuffs were on a vehicle exploited in the northern region.
Figure 7.
The presentation of a cuff’s state at the start and end of the tests on sample no. 9, which was exploited in the northern region.
Figure 7.
The presentation of a cuff’s state at the start and end of the tests on sample no. 9, which was exploited in the northern region.
Figure 8.
3D model of a cuff: (a) isometric view; (b) the mesh of finite elements.
Figure 8.
3D model of a cuff: (a) isometric view; (b) the mesh of finite elements.
Figure 9.
The cuff’s boundary conditions.
Figure 9.
The cuff’s boundary conditions.
Figure 10.
Equivalent von Mises stresses in longitudinal cross-section of a cuff (isometric view) at different temperatures: (a) at −20 °C; (b) at 20 °C.
Figure 10.
Equivalent von Mises stresses in longitudinal cross-section of a cuff (isometric view) at different temperatures: (a) at −20 °C; (b) at 20 °C.
Figure 11.
Equivalent von Mises stresses in transverse cross-section of a cuff (isometric view) at different temperatures: (a) at −20 °C; (b) at 20 °C.
Figure 11.
Equivalent von Mises stresses in transverse cross-section of a cuff (isometric view) at different temperatures: (a) at −20 °C; (b) at 20 °C.
Figure 12.
A chart of the obtained results for all tested samples.
Figure 12.
A chart of the obtained results for all tested samples.
Table 1.
The classification of vehicles for testing at temperatures from 4 °C to 20 °C.
Table 1.
The classification of vehicles for testing at temperatures from 4 °C to 20 °C.
| Sample Number | Vehicle Brand | Vehicle Model | Year of Manufacture | Steering System Type | Number of Kilometers | Region of Use |
|---|
| 1 | Volkswagen | Golf 1.9 TDI | 2000 | hydraulic | 298,485 | north |
| 2 | Volkswagen | Golf 1.9 SDI | 2000 | hydraulic | 320,489 | north |
| 3 | Opel | Astra 1.7 DTI | 2001 | hydraulic | 289,583 | north |
| 4 | Renault | Clio 1.5 dCi | 2005 | electric | 290,241 | north |
| 5 | Volkswagen | Golf 1.9 TDI | 2001 | hydraulic | 309,587 | south |
| 6 | Opel | Astra 1.7 DTI | 2002 | hydraulic | 281,456 | south |
| 7 | Renault | Clio 1.5 dCi | 2007 | electric | 244,327 | south |
| 8 | Renault | Clio 1.5 dCi | 2006 | electric | 237,327 | south |
Table 2.
The basic data of the first group of cuffs before the start of testing.
Table 2.
The basic data of the first group of cuffs before the start of testing.
| Sample Number | Vehicle Brand | Length (L, mm) | Ratio of Diameters d1/d2 (mm) | Sum of Amplitudes on the Simulator (mm) | Sum of Amplitudes on a Vehicle (mm) | Chemical Composition | Region of Use |
|---|
| 1 | Volkswagen | 179.0 | 16.0/50.0 | 150.0 | 150.0 | TE(EPDM+PP) | north |
| 2 | Volkswagen | 188.0 | 17.0/54.0 | 150.0 | 150.0 | TE(EPDM+PP) | north |
| 3 | Opel | 198.0 | 15.0/52.0 | 150.0 | 155.0 | TE(EPDM+PP) | north |
| 4 | Renault | 178.0 | 14.0/53.0 | 150.0 | 153.0 | TE(EPDM+PP) | north |
| 5 | Volkswagen | 190.0 | 16.0/50.0 | 150.0 | 150.0 | TE(EPDM+PP) | south |
| 6 | Opel | 205.0 | 15.0/53.0 | 150.0 | 155.0 | TE(EPDM+PP) | south |
| 7 | Renault | 170.0 | 9.0/45.0 | 150.0 | 153.0 | TE(EPDM+PP) | south |
| 8 | Renault | 168.0 | 9.0/46.0 | 150.0 | 153.0 | TE(EPDM+PP) | south |
Table 3.
The classification of vehicles for testing at temperatures from −4 °C to −20 °C.
Table 3.
The classification of vehicles for testing at temperatures from −4 °C to −20 °C.
| Sample Number | Vehicle Brand | Vehicle Model | Year of Manufacture | Steering System Type | Number of Kilometers | Region of Use |
|---|
| 9 | Volkswagen | Golf 1.9 TDI | 1999 | hydraulic | 298,545 | north |
| 10 | Volkswagen | Golf 1.9 TDI | 1998 | hydraulic | 320,148 | north |
| 11 | Volkswagen | Golf 1.9 TDI | 2000 | hydraulic | 332,874 | north |
| 12 | Renault | Clio 1.5 dCi | 2007 | electric | 274,121 | north |
| 13 | Renault | Clio 1.5 dCi | 2006 | electric | 298,745 | south |
| 14 | Volkswagen | Golf 1.6i | 1998 | hydraulic | 334,584 | south |
| 15 | Ford | Mondeo 2.0 TDCi | 2007 | hydraulic | 225,121 | south |
Table 4.
The basic data of the second group of cuffs before the test process.
Table 4.
The basic data of the second group of cuffs before the test process.
| Sample Number | Vehicle Brand | Length (L, mm) | Ratio of Diameters d1/d2 (mm) | Sum of Amplitudes on the Simulator (mm) | Sum of Amplitudes on a Vehicle (mm) | Chemical Composition | Region of Use |
|---|
| 9 | Volkswagen | 175.0 | 16.0/50.0 | 150.0 | 150.0 | TE(EPDM+PP) | north |
| 10 | Volkswagen | 179.0 | 16.0/50.0 | 150.0 | 150.0 | TE(EPDM+PP) | north |
| 11 | Volkswagen | 169.0 | 17.0/49.0 | 150.0 | 150.0 | TE(EPDM+PP) | north |
| 12 | Renault | 173.0 | 16.0/46.0 | 150.0 | 153.0 | TE(EPDM+PP) | north |
| 13 | Renault | 176.0 | 14.0/44.0 | 150.0 | 153.0 | TE(EPDM+PP) | south |
| 14 | Volkswagen | 167.0 | 15.0/48.0 | 150.0 | 150.0 | TE(EPDM+PP) | south |
| 15 | Ford | 172.0 | 18.0/55.0 | 150.0 | 157.0 | TPV | south |
Table 5.
The results of testing cuffs at temperatures from 4 °C to 20 °C.
Table 5.
The results of testing cuffs at temperatures from 4 °C to 20 °C.
| Sample Number | Vehicle Brand | Region of Use | Number of Kilometers | Testing Temperature [°C] | Temperature at the Moment of Failure [°C] | Number of Oscillations to the Failure | Number of Oscillations to the Termination of Testing |
|---|
| 1 | Volkswagen | north | 298,485 | 14.8 ÷ 19.4 | 16.9 | 2,599,786 | --- |
| 2 | Volkswagen | north | 320,489 | 4.0 ÷ 7.9 | 7.9 | 2,666,406 | --- |
| 3 | Opel | north | 289,583 | 15.7 ÷ 19.0 | 19.0 | 2,986,007 | --- |
| 4 | Renault | north | 290,241 | 4.5 ÷ 7.6 | 5.8 | 2,819,850 | --- |
| 5 | Volkswagen | south | 309,587 | 17.2 ÷ 19.0 | 19.0 | --- | 9,014,279 |
| 6 | Opel | south | 281,456 | 16.8 ÷ 19.0 | 19.0 | --- | 10,108,004 |
| 7 | Renault | south | 244,327 | 14.6 ÷ 19.5 | 19.0 | --- | 11,931,162 |
| 8 | Renault | south | 237,327 | 15.2 ÷ 19.7 | 19.0 | --- | 8,331,308 |
Table 6.
The results of testing cuffs at temperatures from −4 °C to −20 °C.
Table 6.
The results of testing cuffs at temperatures from −4 °C to −20 °C.
| Sample Number | Vehicle Brand | Region of Use | Number of Kilometers | Testing Temperature [°C] | Temperature at the Moment of Failure [°C] | Number of Oscillations to the Failure |
|---|
| 9 | Volkswagen | north | 298,545 | (−14.1) ÷ (−15.1) | −14.1 | 1,554,906 |
| 10 | Volkswagen | north | 320,148 | (−4.1) ÷ (−13.7) | −13.7 | 1,822,630 |
| 11 | Volkswagen | north | 332,874 | (−10.1) ÷ (−14.3) | −14.3 | 1,795,112 |
| 12 | Renault | north | 274,121 | (−4.1) ÷ (−12.4) | −12.4 | 1,981,989 |
| 13 | Renault | south | 298,745 | (−10.1) ÷ (−18.9) | −13.3 | 4,427,388 |
| 14 | Volkswagen | south | 334,584 | (−12.7) ÷ (−18.4) | −18.4 | 3,541,361 |
| 15 | Ford | south | 225,121 | (−10.2) ÷ (−20.5) | −20.1 | 4,745,626 |
Table 7.
The test results for the cuffs from both groups.
Table 7.
The test results for the cuffs from both groups.
| Sample Number | Vehicle Brand | Region of Use | Number of Kilometers | Temperature at the Moment of Failure [°C] | Number of Oscillations to the Failure | Number of Oscillations before Termination of Testing | Duration of Testing |
|---|
| 1 | Volkswagen | north | 298,485 | 16.9 | 2,599,786 | --- | 16 days and 21 h |
| 2 | Volkswagen | north | 320,489 | 7.9 | 2,666,406 | --- | 17 days and 7 h |
| 3 | Opel | north | 289,583 | 19.0 | 2,986,007 | --- | 19 days and 9 h |
| 4 | Renault | north | 290,241 | 5.8 | 2,819,850 | --- | 18 days and 7 h |
| 5 | Volkswagen | south | 309,587 | 19.0 | --- | 9,014,279 | 58 days and 12 h |
| 6 | Opel | south | 281,456 | 19.0 | --- | 10,108,004 | 65 days and 14 h |
| 7 | Renault | south | 244,327 | 19.0 | --- | 11,931,162 | 77 days and 10 h |
| 8 | Renault | south | 237,327 | 19.0 | --- | 8,331,308 | 54 days and 2 h |
| 9 | Volkswagen | north | 298,545 | −14.1 | 1,554,906 | --- | 10 days and 2 h |
| 10 | Volkswagen | north | 320,148 | −13.7 | 1,822,630 | --- | 11 days and 20 h |
| 11 | Volkswagen | north | 332,874 | −14.3 | 1,795,112 | --- | 11 days and 16 h |
| 12 | Renault | north | 274,121 | −12.4 | 1,981,989 | --- | 12 days and 21 h |
| 13 | Renault | south | 298,745 | −13.3 | 4,427,388 | --- | 28 days and 18 h |
| 14 | Volkswagen | south | 334,584 | −18.4 | 3,541,361 | --- | 23 days |
| 15 | Ford | south | 225,121 | −20.1 | 4,745,626 | --- | 30 days and 19 h |
© 2020 by the authors. Licensee MDPI, Basel, Switzerland. This article is an open access article distributed under the terms and conditions of the Creative Commons Attribution (CC BY) license (http://creativecommons.org/licenses/by/4.0/).


