Article

Theoretical and Experimental Study on Contact Characteristics of Spiral Bevel Gears under Quasi-Static and Large Loading Conditions

1
State Key Laboratory of Fluid Power Transmission and Control, Zhejiang University, Hangzhou 310000, China
2
College of Technology, Lishui University, Lishui 323000, China
3
Guangzhou Institute of Advanced Technology, Chinese Academy of Sciences, Guangzhou 510000, China
4
Wuhan Second Ship Design and Research Institute, Wuhan 430205, China
*
Authors to whom correspondence should be addressed.
Appl. Sci. 2020, 10(15), 5109; https://doi.org/10.3390/app10155109
Submission received: 3 July 2020 / Revised: 20 July 2020 / Accepted: 23 July 2020 / Published: 25 July 2020
(This article belongs to the Special Issue Experimental Mechanics, Instrumentation and Metrology)

Abstract

:
The precise mathematical model for the tooth surface and transition surface of spiral bevel gears is derived. Taking a pair of spiral bevel gears of a heavy vehicle as an example of calculation and analysis, a finite element model of spiral bevel gears transmission system is established. Through the finite element tooth contact analysis under quasi-static loading and high loading condition, the influences of torque on the root stress distribution, contact stress, and transmission error are discussed, and the results are compared with the empirical formula results. Finally, a contact performance test bench of spiral bevel gear pair is developed, then the root bending stress, contact pattern, and transmission error tests are carried out. These experiment results are compared with analyzed ones, which showed a good agreement.

1. Introduction

Tooth contact analysis (TCA) technology is widely applied for assessing meshing quality duet to the increasing demand for vibration, strength, and mechanical efficiency of gear in various industrial fields such as aviation, automotive, and civil engineering [1,2]. There are some main evaluation items to reflect the tooth contact performances. For instance, the transmission error has a significant impact on gear vibration and noise, and the qualified contact pattern can avoid edge contact and premature failure [3,4,5]. Using a meshing simulation, the transmission errors and contact pattern of the gear pair can be determined.
Currently, the new optimization method based on the loaded tooth contact analysis (LTCA) for improving strength and contact performance of bevel gears has been a great concern to scholars worldwide. Simon analyzed the influences of machine settings and misalignments on tooth contact pressure and loaded transmission error, and then presented a method to improve gear meshing performance by reducing the loaded transmission error and the maximum tooth contact pressure of hypoid gears [6,7,8,9,10]. Antoni et al. studied the ease-off optimizing method for loaded transmission error and contact surface of bevel gears, which reduced the risk of vibration and noise [11,12,13]. Kolivand et al. [14,15] developed a novel formulation for LTCA using the ease-off topography. The study defined the surface of action and roll angle surface to simplify the task of locating the instantaneous contact curves. Yanming et al. proposed an ease-off flank modification method to solve the problem of the design and fabrication of high contact ratio spiral bevel gears with a seventh-order transmission error [16]. Nie et al. studied a new method of tooth surface topography modification for improving the meshing performance and correct contact area of spiral bevel gears [17].
Furthermore, a lot of research efforts have already gone into the analysis and optimization of individual gear pairs by experimental testing. De Vaujany et al. discussed the theoretical analysis and experimental research on load transmission error and actual coincidence of spiral bevel gears [18]. Kazumasa et al. investigated the tooth contact pattern and transmission errors of large-sized spiral bevel gears, and these analyzed results were compared with experimental ones [19]. Zhuo et al. investigated the contact characteristics of hypoid gears under quasi-static condition, and proposed a method for the global optimization of the tooth contact pattern and transmission error of spiral bevel and hypoid gears [20,21]. Cao et al. discussed a new method for gear tooth contact analysis, which concentrates on solving two considerable disadvantages of the generalized algorithm, which were verified with the gear-rolling test [22]. Liang et al. studied the influence of different grinding parameters on the surface topography and compared the simulation results with experiment results [23].
It can be seen that the research of loaded contact analysis and experimental testing of spiral bevel gear has not been sufficient so far. There are few comprehensive studies on its high loading comprehensive contact performance. In this work, an accurate finite element model of spiral bevel gear transmission system was established, which was based on the generating principle of spiral bevel gear and meshing theory. This model considered the influence of gear and shaft deformation, installation position, and bearing load, and the contact characteristics under quasi-static loading and high loading condition were analyzed through this model. In addition, a contact performance test bench of spiral bevel gear pair was developed in this paper, and the bending stress, contact pattern and transmission error test results were obtained for validating FEM results and the reliability of proposed model.

2. Theoretical Tooth Surface Modeling

2.1. Tooth Surface Modeling of the Gear

The method described in this paper is the generating method, in which both sides of the gear teeth are processed simultaneously with a double-sided cutter disc containing an inner cutter and an outer cutter. When machining large wheels, the cutter head rotates around its own axis while revolving around the axis of the production wheel. The position relationship between the large wheel blank and the cutter head is shown in Figure 1.
β 2 is the coordinate system of the gear machine tool; P 2   is the unit vector of the axis direction of the gear; α 02 is the pressure angle of the gear cutter head; β 02 is the coordinate system of the gear cutter head; S 2 is the radial cutter position; q 2   is the angular cutter position; E 02 is the vertical wheel position; X 02   is the axial wheel position; X B 2 is the bed position;   δ M 2 is the root angle of machine tool; r 0 is the nominal radius of cutter head; W 2 is the angular cutter head radius; r e 2 is cutter tip arc radius; O e   is the tool tip arc center; M 0 is the apex of the tool tip; θ 2 is the angle between the section of cutter disk axis passing O 0 M 0 ¯ and i 2 ; r 02 is the radius of the tool tip.
Let | M M 0 ¯ | = s 2 ; then, in   β 02 , the radius vector r C 2   and normal vector n C 2 of M points on the cutting surface can be represented as follows:
r c 2 ( s 2 , θ 2 ) = [ ( r 02 s 2 s i n α 02 ) c o s θ 2 ( r 02 s 2 s i n α 02 ) s i n θ 2 s 2 c o s α 02 ]
  n c 2 ( θ 2 ) = [ c o s α 02 c o s θ 2 c o s α 02 s i n θ 2 s i n α 02 ]
θ 02 is the angle between O e M ¯ and the axis of the cutter head, and the radius vectors r e 2 and normal vectors n e 2 of M on the cutter tip arc can be represented as
r e 2 ( θ 02 , θ 2 ) = [ ( r O e 2 r e 2 s i n θ 02 ) c o s θ 2 ( r O e 2 r e 2 s i n θ 02 ) s i n θ 2 r e 2 ( c o s θ 02 1 ) ]  
  n e 2 ( θ 02 , θ 2 ) = [ s i n θ 02 c o s θ 2 s i n θ 02 s i n θ 2 c o s θ 02 ]  
The cutter head rotates q 2 around k, and the relationship between β 02 and β 2 can be obtained:
M β 02 ( q 2 ) = [   1   0   0   S 2 cos ( q 2 + q 2 )   0   1   0   S 2 s i n ( q 2 + q 2 )   0   0   1   0   0   0   0   1 ]
Gear coordinate system   β g moves E 02 along j :
M E 02 = [ 1 0 0 1 0 1 0 E 02 0 0 1 0 0 0 0 1 ]
Move X B 2 along k:
M X B 2 = [ 1 0 0 0 0 1 0 0 0 0 1 X B 2 0 0 0 1 ]
Then, rotate (90°- δ M 2 ) around j ,
  M δ M 2 = [ s i n δ M 2   0 0   1   c o s δ M 2 0   0   0   c o s δ M 2 0 0 0   s i n δ M 2   0   0   1 ]
Move X 2 along P 2 :
  M X 2 = [ 1 0 0 1   0 0   0   0   0 0 0 0   1 X 2   0   1 ]
The cutter head rotates q 2   around k and the gear rotates ψ 2 = i 02 q 2 around P 2 :
M ψ 2 ( q 2 ) = [ c o s ( ψ 2 ) s i n ( ψ 2 ) 0 0 s i n ( ψ 2 ) c o s ( ψ 2 ) 0 0 0 0 1 0 0 0 0 1 ]
In summary, the homogeneous transformation matrix of the gear coordinate system   β g and the machine tool coordinate system   β 2 obtain:
M β g =   M E 02 M X B 2 M δ M 2 M X 2 M ψ 2  
The homogeneous transformation matrix of the cutter head coordinate system β 02 and the gear coordinate system   β g can be calculated as:
M 02 ( q 2 ) = ( M β g ) 1   M β 02
In the gear coordinate system   β g , the radius vector r 2 of the conjugate tooth surface of the gear can be represented as:
r 2 ( s 2 , θ 2 , q 2 ) = M 02 r c 2
The unit normal vector n 2 of the conjugate tooth surface of the gear can be represented as:
n 2 ( θ 2 , q 2 ) = M 02 n c 2
The relative velocity at any point of the conjugate tooth surface of the gear can be calculated as:
v g ( s 2 , θ 2 , q 2 ) = r 2 ψ 2
The expressions of v g and n 2 are substituted for the meshing equation, and the following can be obtained:
v g · n 2 = 0
From Equation (16), it can be concluded that s 2 is a function with θ 2 and q 2 as parameters. Plugging   s 2 = f ( θ 2 , q 2 ) into Equation (13), the equation r 2 ( θ 2 , q 2 ) of the gear surface and transition surface is obtained. When q 2 changes, a series of contact lines can be calculated, and constituting the tooth surface of the gear, as shown in Figure 2.

2.2. Tooth Surface Modeling of the Pinion

The pinion is machined by tool tilting mechanism and one-sided method, and modeling of the pinion is more complicated than that of the gear. The forming process of the pinion is shown in Figure 3.
  β 1   is the coordinate system of the pinion machine tool; P 1   is the unit vector of the axis direction of the gear; α 01 is the pressure angle of the pinion cutter head;   β 01 is the coordinate system of the gear cutter head; b is the projection of k 01 on plane i 1 j 1 ; S 1 is the radial cutter position; q 1   is the angular cutter position; E 01 is the vertical wheel position; X 01   is the axial wheel position; X B 1 is the bed position;   δ M 1 is the root angle of machine tool; j is the turning angle of the cutter; i is the inclination angle of the cutter; r 01 is the radius of the tool tip; r e 1 is the cutter tip arc radius;   θ 1 is the angle between the section of cutter disk axis passing O 0 M 0 ¯ and i 1 . Let | M M 0 ¯ | = s 1 ; then, in   σ 01 , the radius vector r C 1   and normal vector n C 1 of M points on the cutting surface can be represented as follows:
r c 1 ( s 1 , θ 1 ) = [ ( r 01 s 1 s i n α 01 ) c o s θ 1 ( r 01 s 1 s i n α 01 ) s i n θ 1 s 1 c o s α 01 ]
n c 1 ( θ 1 ) = [ c o s α 01 c o s θ 1 c o s α 01 s i n θ 1 s i n α 01 ]
θ 01 is the angle between O e M ¯ and the axis of the cutter head, and the radius vectors r e 1 and normal vectors n e 1 of M on the cutter tip arc can be represented as:
r e 1 ( θ 01 , θ 1 ) = [ ( r O e 1 r e 1 s i n θ 01 ) c o s θ 1 ( r O e 1 r e 1 s i n θ 01 ) s i n θ 1 r e 1 ( 1 c o s θ 01 ) ]
n e 1 ( θ 01 , θ 1 ) = [ s i n θ 01 c o s θ 1 s i n θ 01 s i n θ 1 c o s θ 01 ]
The cutter head rotates q 1 around k:
M q 1 ( q 1 ) = [   1   0   0   S 2 cos ( q 2 + q 2 )   0   1   0   S 2 s i n ( q 2 + q 2 )   0   0   1   0   0   0   0   1 ]
  β 01   rotates ( q 1 j ) around k 01 :
  M j = [ c o s ( q 1 j ) s i n ( q 1 j )   0 0 s i n ( q 1 j )     c o s ( q 1 j ) 0 0 0 0 1 0 0 0 0 1 ]
Then, i   rotates   around i 01 :
M i = [ 1 0 0 0 0 c o s i s i n i 0 0 s i n i c o s i 0 0 0 0 1 ]
In conclusion, the relationship between β 01 and β 1 can be represented as:
M β 01 ( q 1 ) = M q 1 M j M i  
β P moves E 01 along j :
M E 01 = [ 1 0 0 0 0 1 0 E 01 0 0 1 0 0 0 0 1 ]
Then, X B 1 moves along k :
M X B 1 = [ 1 0 0 0 0 1 0 0 0 0 1 X B 1 0 0 0 1 ]
Rotating (90°- δ M 1 ) around j :
M δ M 1 = [   s i n δ M 1 0   0 1 c o s δ M 1 0 0 0   c o s δ M 1 0 0 0   s i n δ M 1 0 0 1 ]
Moving X 1 along P 1 :
  M X 1 = [ 1 0 0 0 0 1 0 0 0 0 1 X 1 0 0 0 1 ]
The cutter head rotates q 1   around k and the pinion rotates ψ 1 = i 01 q 1 around P 1 :
M ψ 1 ( q 1 ) = [ c o s ( ψ 1 ) s i n ( ψ 1 ) 0 0 s i n ( ψ 1 )   c o s ( ψ 1 ) 0 0 0 0 1 0 0 0 0 1 ]
The homogeneous transformation matrix of the pinion coordinate system   β P and the machine tool coordinate system   β 1 is obtained:
M β p = M E 01 M X B 1 M δ M 1 M X 1 M ψ 1
The homogeneous transformation matrix of the cutter head coordinate system β 01 and the pinion coordinate system β P can be calculated as:
M 01 ( q 1 ) = ( M β p ) 1   M β 01  
In the pinion coordinate system   β P , the radius vector r 1 of the conjugate tooth surface can be represented as:
  r 1 ( s 1 , θ 1 , q 1 ) = M 01 r c 1
The unit normal vector n 1 of the conjugate tooth surface of the pinion can be represented as:
n 1 ( θ 1 , q 1 ) = M 01 n c 1
The relative velocity at any point of the conjugate tooth surface of the pinion can be calculated:
v p ( s 1 , θ 1 , q 1 ) = r 1 ψ 1
The expressions of v p and n 1 are substituted for the meshing equation, and the following can be obtained:
  v p · n 1 = 0
From Equation (35), it can be concluded that s 1 is a function with θ 1 and q 1 as parameters. Plugging   s 1 = f ( θ 1 , q 1 ) into Equation (32), the equation r 1 ( θ 1 , q 1 ) of the pinion surface and transition surface is obtained. When q 1 changes, a series of contact lines can be calculated, and constitute the tooth surface of the pinion, as shown in Figure 4.

2.3. Meshing Contact Modeling

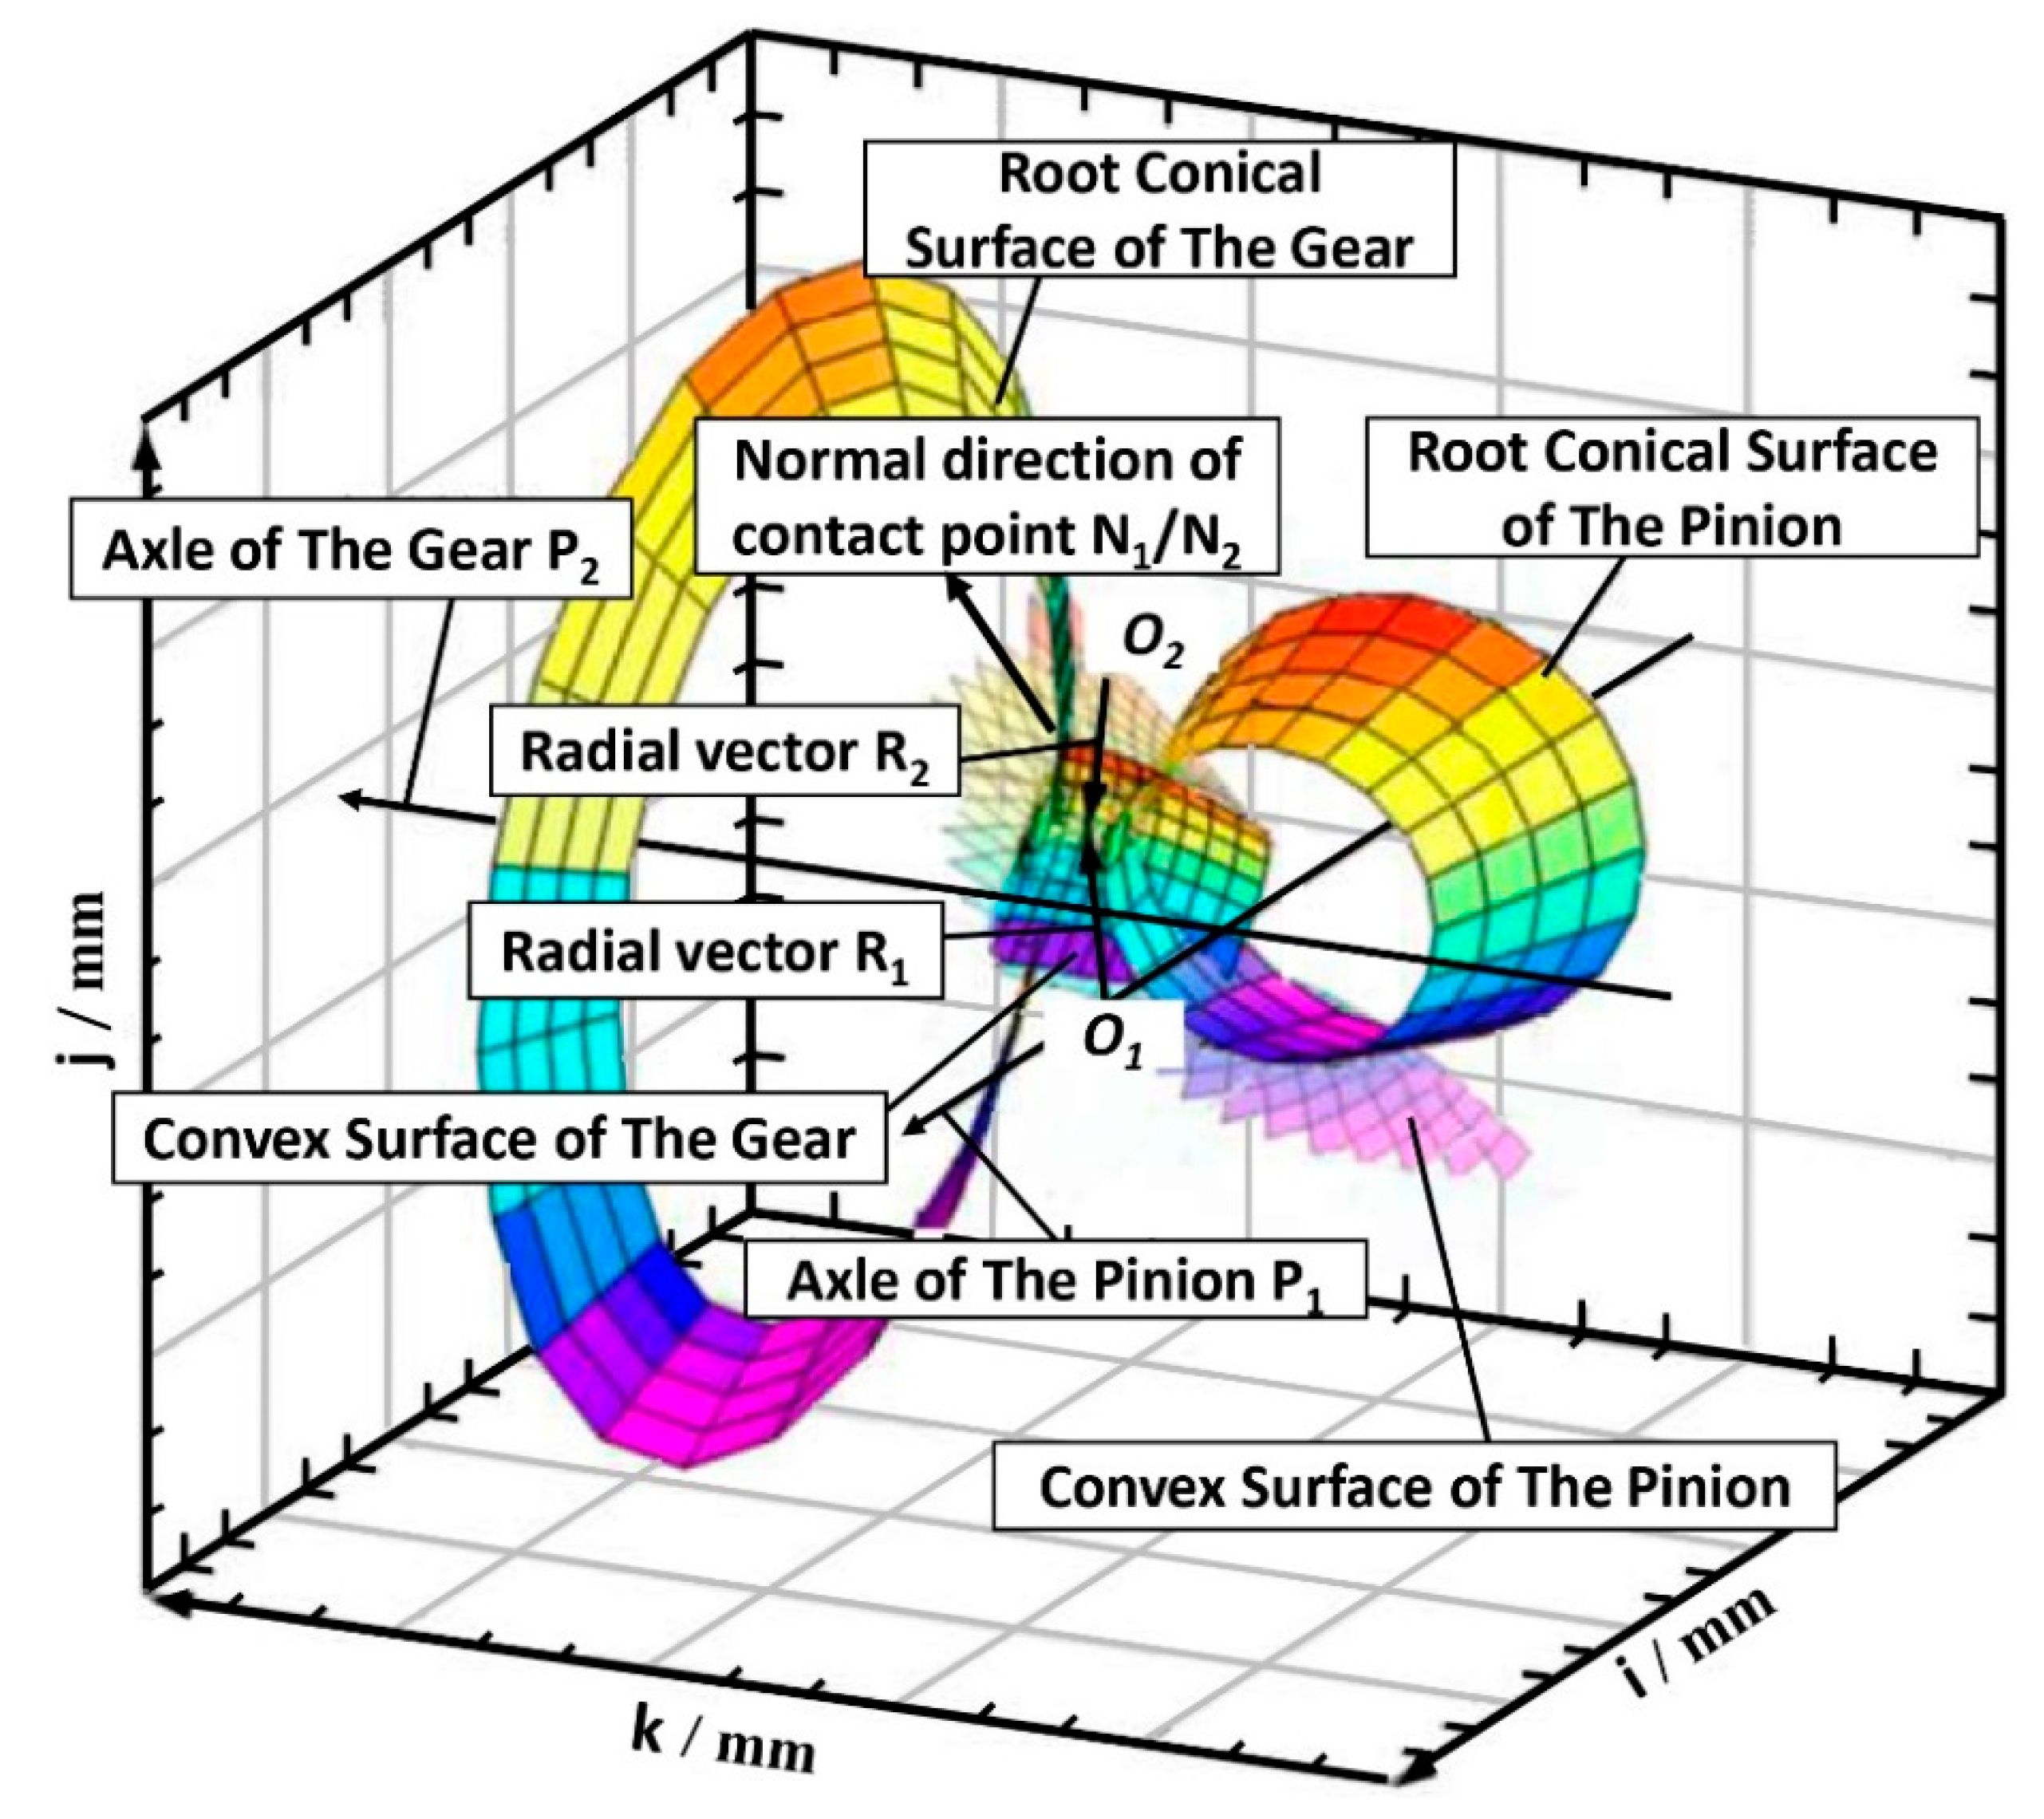
The mathematic models of the gear and the pinion are established in the gear coordinate system β g and the pinion coordinate system β p , respectively. In order to make the position relationship of spiral bevel gear pair consistent with the theoretical design, transforming the pinion coordinate system   β p is into the gear coordinate system β g . The gear rotates around p 2 axis and the pinion rotates around p 1 axis, when r 2 , n 2 rotates φ 2 around p 2 , and r 1 , n 1 rotates φ 1 around p 1 , the conjugate contact between M point on the gear tooth surface and M point on the pinion tooth surface is established. The equation R 2 and the normal vector N 2 of tooth surface of the gear at the contact point can be represented as:
  R 2 = ( r 2 · p 2 ) p 2 + s i n φ 2 ( p 2 × r 2 ) + c o s φ 2 ( p 2 × r 2 ) × p 2  
  N 2 = ( n 2 · p 2 ) p 2 + s i n φ 2 ( p 2 × n 2 ) + c o s φ 2 ( p 2 × n 2 ) × p 2
The equation R 1 and the normal vector N 1 of the gear at the contact point can be represented as:
  R 1 = ( r 1 · p 1 ) p 1 + s i n φ 1 ( p 1 × r 1 ) + c o s φ 1 ( p 1 × r 1 ) × p 1
  N 1 = ( n 1 · p 1 ) p 1 + s i n φ 1 ( p 1 × n 1 ) + c o s φ 1 ( p 1 × n 1 ) × p 1  
According to the meshing principle of gears,   R 2 ,   R 1 ,   N 2 , and   N 1 should satisfy the equations as follows:
{ R 2 = R 1 O 1 O 2 ¯ N 2 = N 1
There are six unknowns θ 1 ,   θ 2 ,   q 1 ,   q 2 ,   φ 1 , and φ 2 in the above equations; however, there are only five independent equations. When the pinion rotation angle φ 1 is given as input according to the step size, the equations can be solved. The pinion rotation angle at each moment corresponds to a meshing point, and all meshing points from entry to exit form a contact trace. The following Figure 5 shows the contact point position of the two teeth surfaces (after the gear rotating angle φ 2 and the pinion rotating   φ 1 ).

3. Solid Modeling and Finite Element Model

3.1. Examples of Calculation

In order to verify the correctness of the previous mathematical model of the gear pair and to analyze the loaded contact characteristics of the tooth surface, a pair of Grison spiral bevel gears which is used in the axle of a domestic heavy-duty vehicle was selected as the test specimen. The parameters are listed in Table 1.

3.2. Constructing Solid Geometry Model

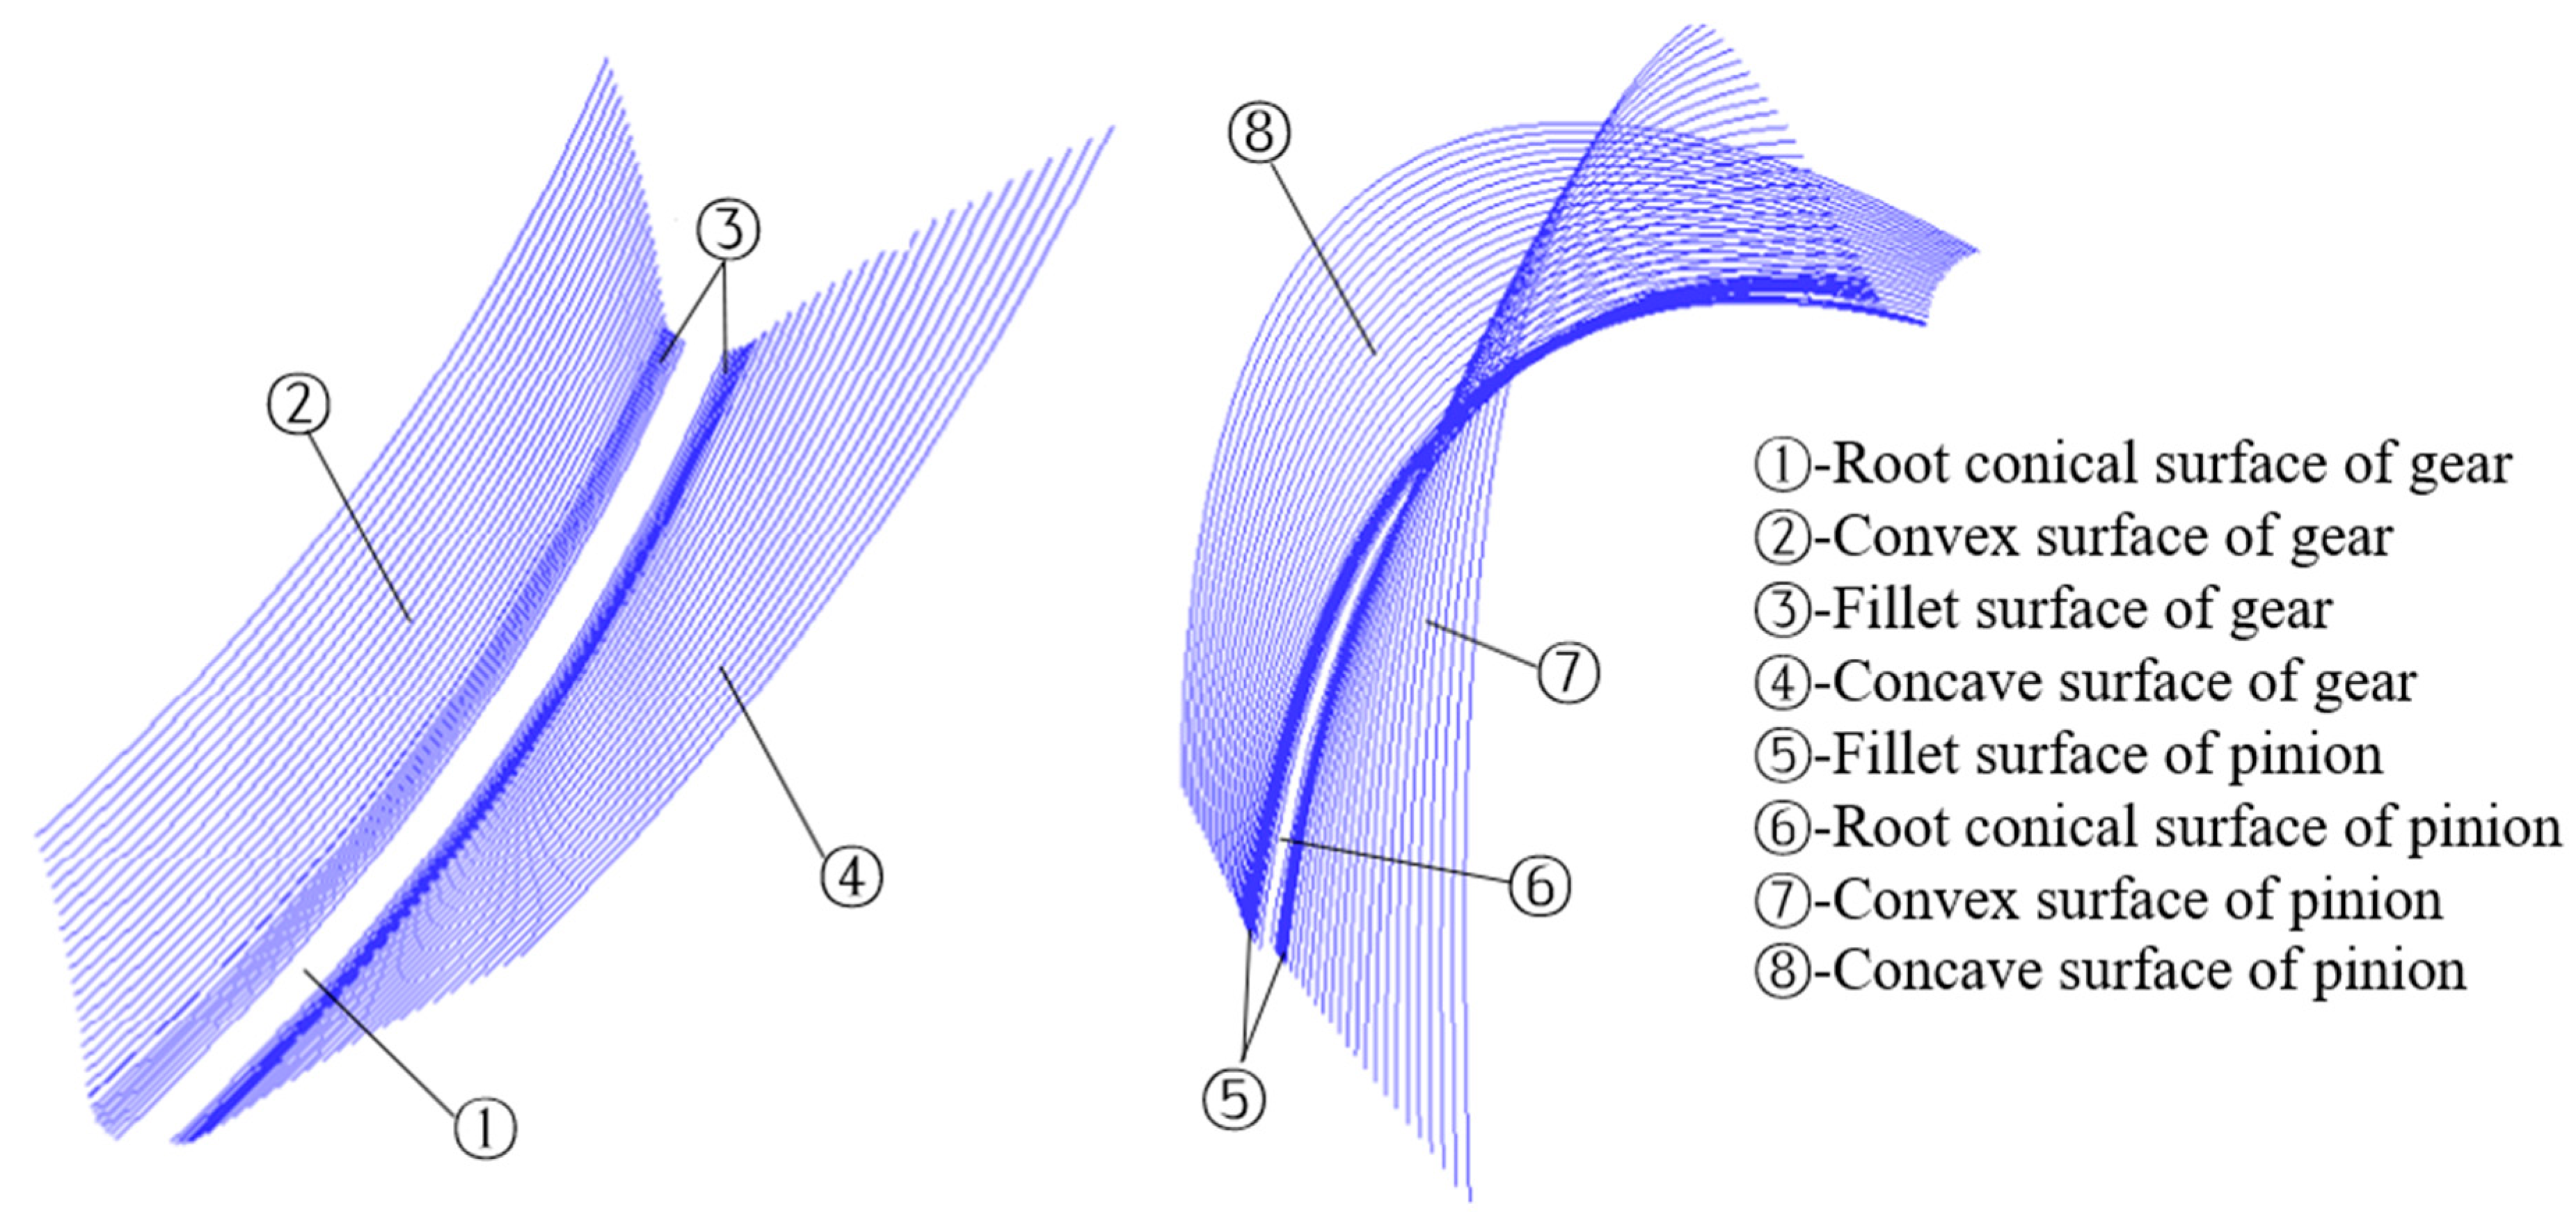
Based on the mathematical model established above, the calculated lattice data of tooth surface, transition surface, and root cone surface are imported into the software Pro/Engineer, and the discrete points are fitted with spline curve, which are shown in Figure 6 below.
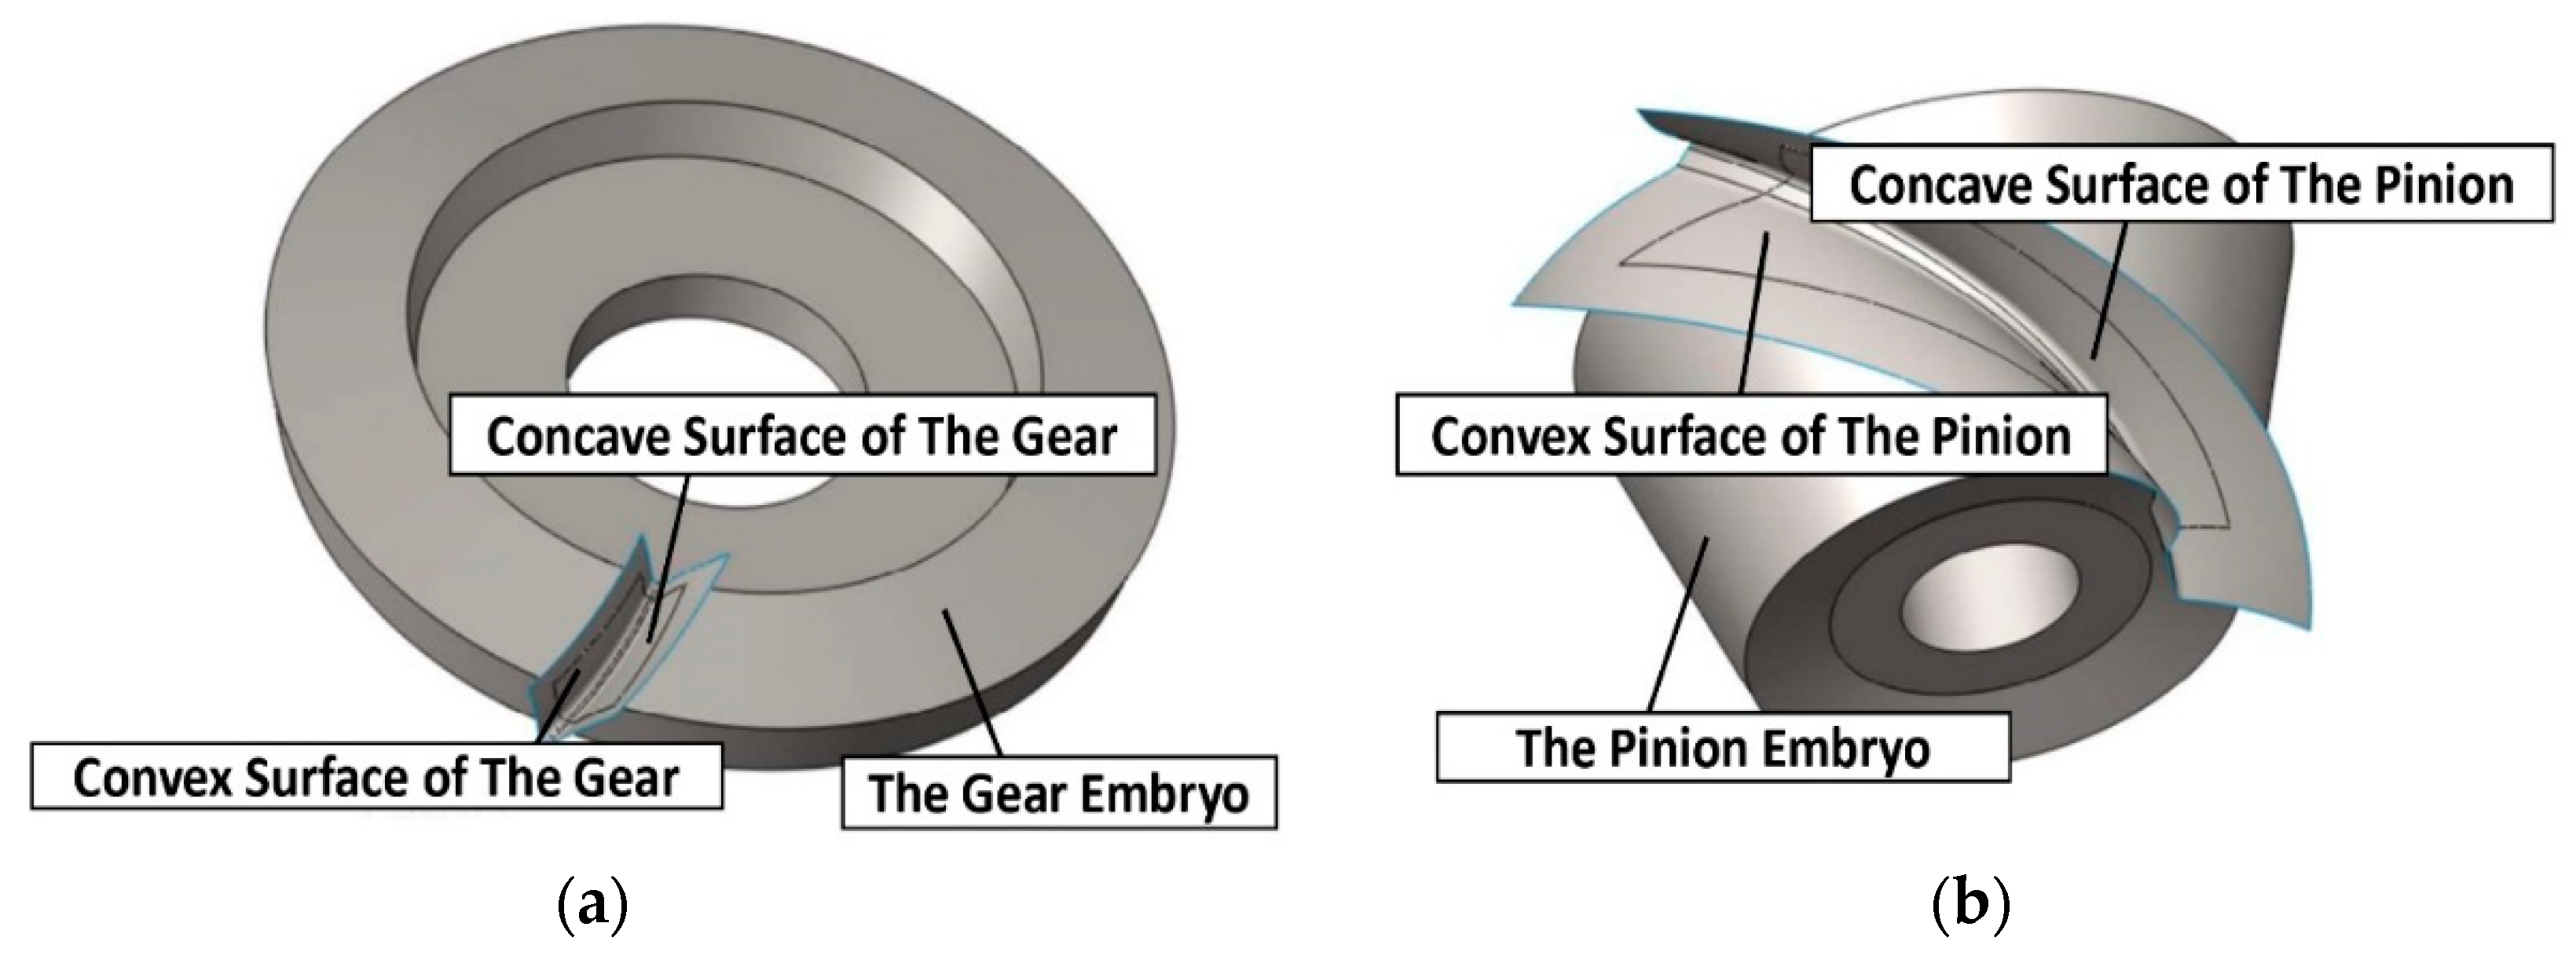
Based on the spline curve, the gear surface (including concave, convex tooth surface, fillet surface and root cone surface) is constructed by some software function, such as variable section sweep, extend, boundary blend, trim, and so on. Then, the solid model of the big gear and the small gear can be obtained by cutting the surface of the gear blank model with the gear surface. The solid model of the spiral bevel gear pair can be obtained by virtual assembly according to the theoretical installation position of the gear pair, which is shown in Figure 7.
The gear modeling method is designed according to the gear forming method in the actual gear cutting process, and the consistency between the theoretical model and the actual gear is ensured as much as possible in the mathematical modeling.

3.3. Transmission System Model

The assembly model of spiral bevel gear was imported into ANSYS software for finite element analysis. Under actual conditions, the gear pair will not be an isolated system. The whole transmission system includes supporting shafts, bearings, Gearbox, and so on. However, if all parts of the transmission system are imported into software, the solving time will be greatly increased, and the results may not converge. Therefore, it is necessary to simplify the model properly.
As shown in Figure 8, other structural components are omitted, such as bearings and gearboxes, which have little influence on the analysis results, and key parts are retained, such as gear teeth and rotating shafts. In order to simplify the analysis, the gear and its rotating shaft are consolidated together. The gear adopts two-end span support structure, while the pinion adopts the common cantilever support structure. The bearing support position of the pinion spindle is not only installation and positioning boundary, but also input end of torque T 1 , and the bearing support near the large wheel is load T 2 input end.

3.4. Material Property and Mesh Generation

The material of the spiral bevel gear pair is 20CrMnTiA, which was heat treated by carburization, quench, and low temperature tempering. The corresponding material properties are shown in Table 2. Due to heavy load, the material of the rotating shaft adopts high strength carburized steel. In order to get better contact analysis results, the whole model uses eight-node linear hexahedron element for contact analysis. Meanwhile, in order to improve the calculation accuracy of tooth surface contact analysis, the mesh refinement of contact surface of gear pair is carried out, listed in Figure 9. We selected the Von Mises material model, which is suitable for metallic materials finite element analysis.

4. Simulation Results

4.1. Tooth Surface Contact Pattern

Different torques (500 Nm, 1500 Nm and 4500 Nm) are set to simulate light, medium, and heavy loads, respectively, the variation of contact pattern on the convex face of the gear is shown in Figure 10.
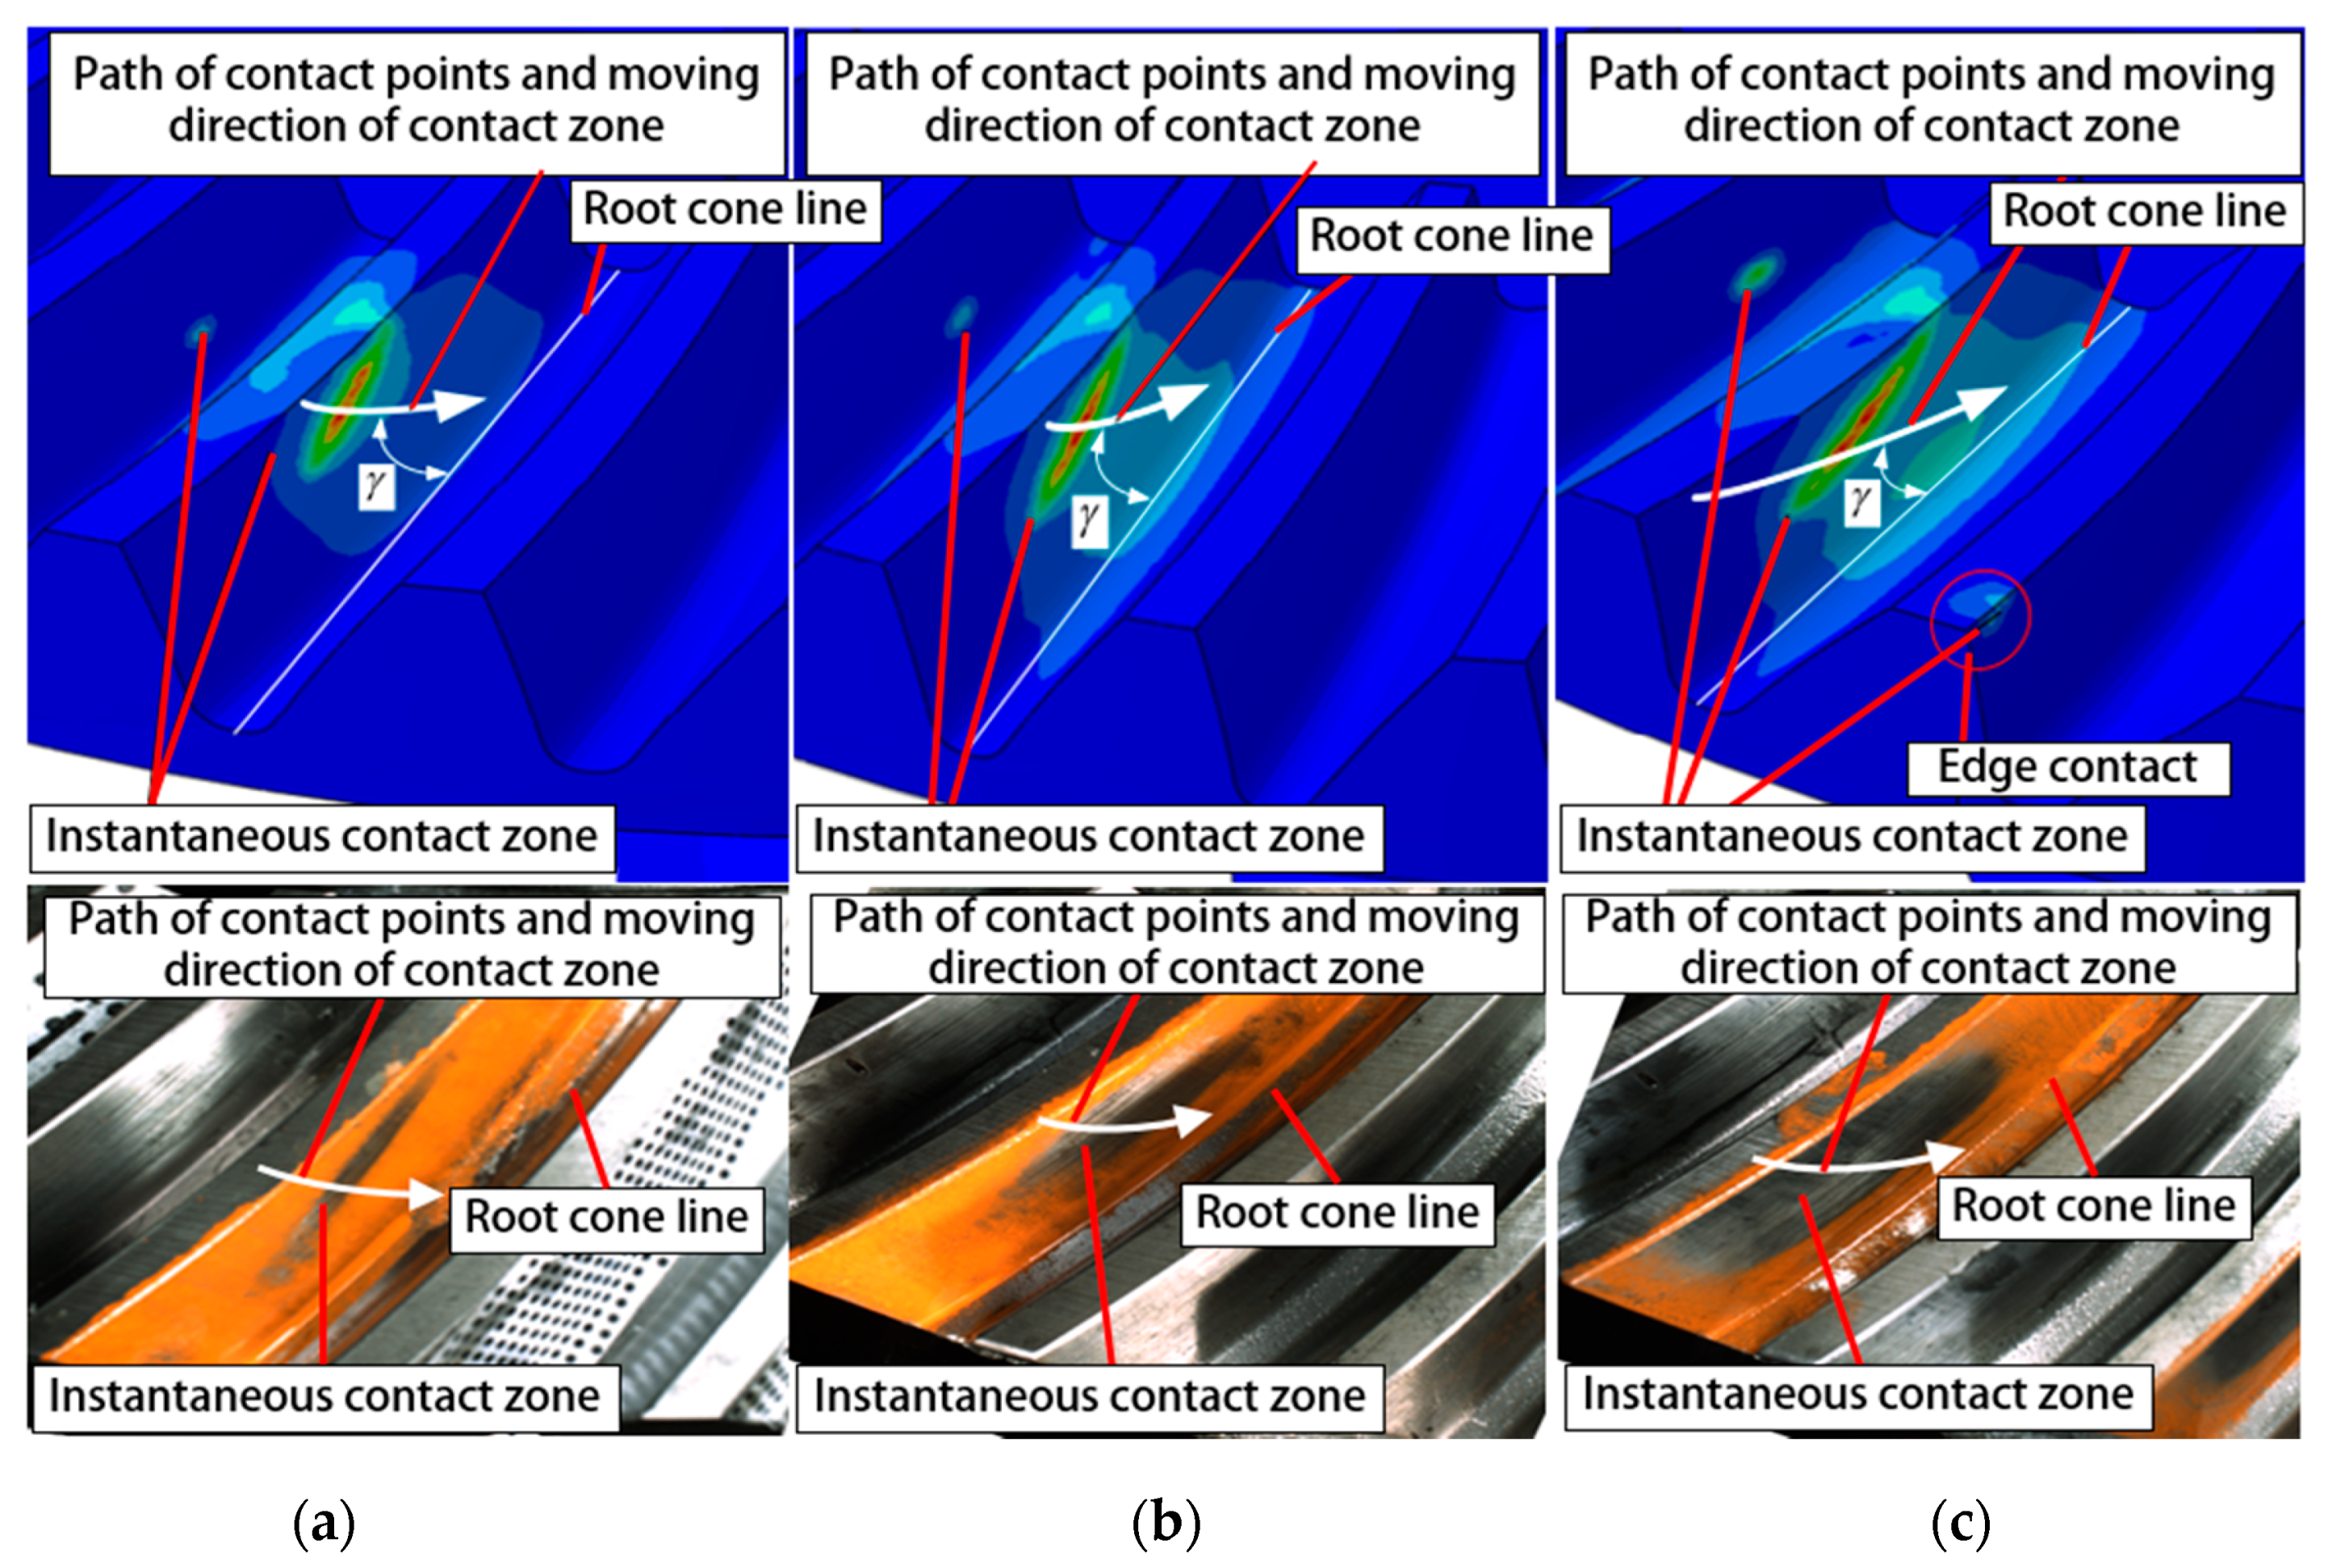
We can find in Figure 10 above that, when load T is 500 Nm, the instantaneous contact pattern is relatively small. Compared Figure 10b,c with Figure 10a, the directional angle γ becomes smaller, the contact line becomes longer, and the instantaneous contact pattern becomes larger with the load T increasing. Therefore, we can confirm that the load is an important factor affecting the contact area and the contact trace of the bevel gear tooth surface. In addition, the contact zone of tooth surface extends to the large end with the increase of load T, but not to the small end. When the torque T increases to 4500 Nm, the edge contact occurs on the tooth surface of the gear which will induce vibration, shock, and be harmful to transmission stability.

4.2. Tooth Surface Contact Stress

When load T = 1500 Nm, T = 4500 Nm, and T = 7500 Nm, the variation of contact stress on the convex face of the gear is shown in Figure 11.
As shown in Figure 11, the above results indicates that, with the increase of load T, the maximum contact stress σ H of the gear convex face becomes larger, and the worst contact zone appears in the small end teeth top of the gear. When load increases from 1500 Nm to 7500 Nm, the comparisons between the simulation results and the calculated results of empirical formula are listed in Table 3 below. The empirical formula is according to ISO 10300 and ISO 6336, which is shown in Equations (41) and (42) [24,25]. The calculation is based on the contact (Hertzian) stress, in which the load is distributed along the lines of contact. Calculations are to be carried out for pinion and wheel together, and some parameters for contact stress calculation were determined by engineering experience, processing technology, and actual operation conditions, such as gear geometry, manufacturing accuracy, rigidity of flange, bearing and bearing seat, and torque transmitted. We can find that, with the increase of loading torque, the change trend of FEM and calculated results are similar. In addition, the results of empirical formulas are about 10–15% larger than analyzed ones. The authors believe that the FEM accuracy, constraint condition setting, and the parameters selection of theoretical formula cause the difference value:
  σ H = σ H 0 K A K V K H β K H α  
  σ H 0 = F n l b m ρ r e l Z M B Z L S Z E Z K
K A is the application factor, K V is the dynamic factor, K H β is the face load factor for contact stress, K H α is the transverse load factor for contact stress,   σ H 0 is the nominal value of the contact stress, F n is the nominal normal force of the virtual cylindrical gear at mean point, l b m is the length of contact line in the middle of the zone of action, ρ r e l is the radius of relative curvature vertical to the contact line, Z M B is the mid-zone factor, Z L S is the load sharing factor, Z E is the elasticity factor, and Z K is the bevel gear factor.

4.3. Tooth Root Bending Stress

When load T = 500 Nm, T = 1500 Nm and T = 4500 Nm, the maximum root bending stress variation of the gear and the pinion is shown in Figure 12.
As shown in Figure 12, the maximum root bending stress appears near the transition line between tooth surface and tooth root. When the load T increases, the root bending stresses also increase, and the maximum root bending stress σ F 2 of the gear is less than the maximum root bending stress   σ F 1 of the pinion. When torque increases from 1500 Nm to 7500 Nm, the maximum root bending stress σ F comparisons between the FEM results and the calculated results of empirical formula are listed in Table 4 below. The empirical formula is according to ISO 10300 and ISO 6336, which is shown in Equations (43) and (44). The calculation is based on the maximum bending stress at the tooth root. It is determined separately for pinion and wheel. Some parameters for root bending stress calculation were determined by engineering experience and actual operation conditions, such as geometric similarity, operation, and manufacturing of actual gears:
  σ F = σ F 0 K A K V K F β K F α  
  σ F 0 = F vmt b v m m n Y F a Y S a Y ε Y B S Y L S  
K F β is the face load factor for bending stress, K F α is the transverse load factor for bending stress,   σ F 0 is the nominal tooth root stress, F vmt is the nominal tangential force of the virtual cylindrical gear, b v is the face width of virtual cylindrical gear,   m m n is mean normal module, Y F a is the tooth form factor, Y S a is the stress correction factor, Y ε is the contact ration factor, Y B S is the bevel spiral angle factor, and Y L S is the load sharing factor.
As shown in Table 4, the results show that the results of finite element analysis and empirical formula are similar, and the empirical value is about 10–14% larger than that of finite element analysis. The authors believe that one reason is that the load T increases the deformation of the bevel gears, which increases the actual contact ratio of the bevel gears, but the empirical value does not take this into account. Another reason is that the finite element model constraint condition setting and the parameters selection of theoretical formula will affect the difference value.
In order to observe the distribution of the maximum tooth root bending stress in a meshing period, the FEM analysis of the root bending stress is carried out by rotating the gear step by step. When load increases from 1500 Nm to 7500 Nm, the variation of the maximum value of root bending stresses of the pinion and the gear is shown in Figure 13.
As shown in Figure 13, the horizontal axis represents single tooth meshing period of the gear and pinion due to instantaneous contact point from the small end to the large end, or vice versa. Longitudinal axis is the maximum bending stress distribution along the root cone line. We can find that, when the load T is small, the mean bending stresses of the small end teeth root of gear and pinion are greater than that of the big end teeth root during the same meshing period because the modulus of the small end are smaller, which causes the bending strength of the small end to be relatively weak. When the load T increases gradually, the mean bending stresses of the small end teeth root of gear and the pinion are still greater than that of the big end teeth root during the same meshing period; however, the reasons are quite different. From previous research of the contact pattern, we can know that the moving direction of the contact pattern on the gear teeth surface is from the small end teeth top to the big end teeth root with the torque T increasing, making the contact pattern closer to the big end of the gear. Thus, the bending stresses of the small end teeth root of the gear are slightly larger than that of the big end teeth root. In contrast, the moving direction of the contact pattern on the pinion teeth surface is from the big end teeth root to the small end teeth top with the torque T increasing, making the contact pattern closer to the small end of the pinion. Thus, the bending stress of the small end tooth root of the pinion is much larger than that of the big end tooth root. Meanwhile, because of the distance of the tooth direction of the pinion is larger, the distribution of the root bending stress of the pinion is more concentrated in the tooth direction.

4.4. Transmission Error

We simulated transmission error by KISSsoft software, which is widely used and reliable in the gear field. A precise spiral bevel gear transmission system model was established before simulation calculation, and KISSsoft can calculate the difference value between theoretical and actual rotation angle during the meshing process, which considers the influence of bearings and the deformation of shafts and gears. According to the actual load condition, different moments (500 Nm, 1500 Nm and 4500 Nm) are set to simulate light, medium, and heavy loads, respectively.
The transmission error curves of this gear drives under different moment are shown in Figure 14. In addition, all transmission error curves are translated to zero position for better comparison. We can know that the transmission error change period is synchronized with the pitch angle of the pinion. Due to the increasing elastic deformation of the gear and the rotating shaft with the load T increases, the absolute value and peak to peak of the transmission error curves become larger. The transmission error curve under the heavy load (4500 Nm) fluctuates much more severely because of the increase of gear deformation and meshing impact.

5. Verification Test

5.1. Construction of Test Bench

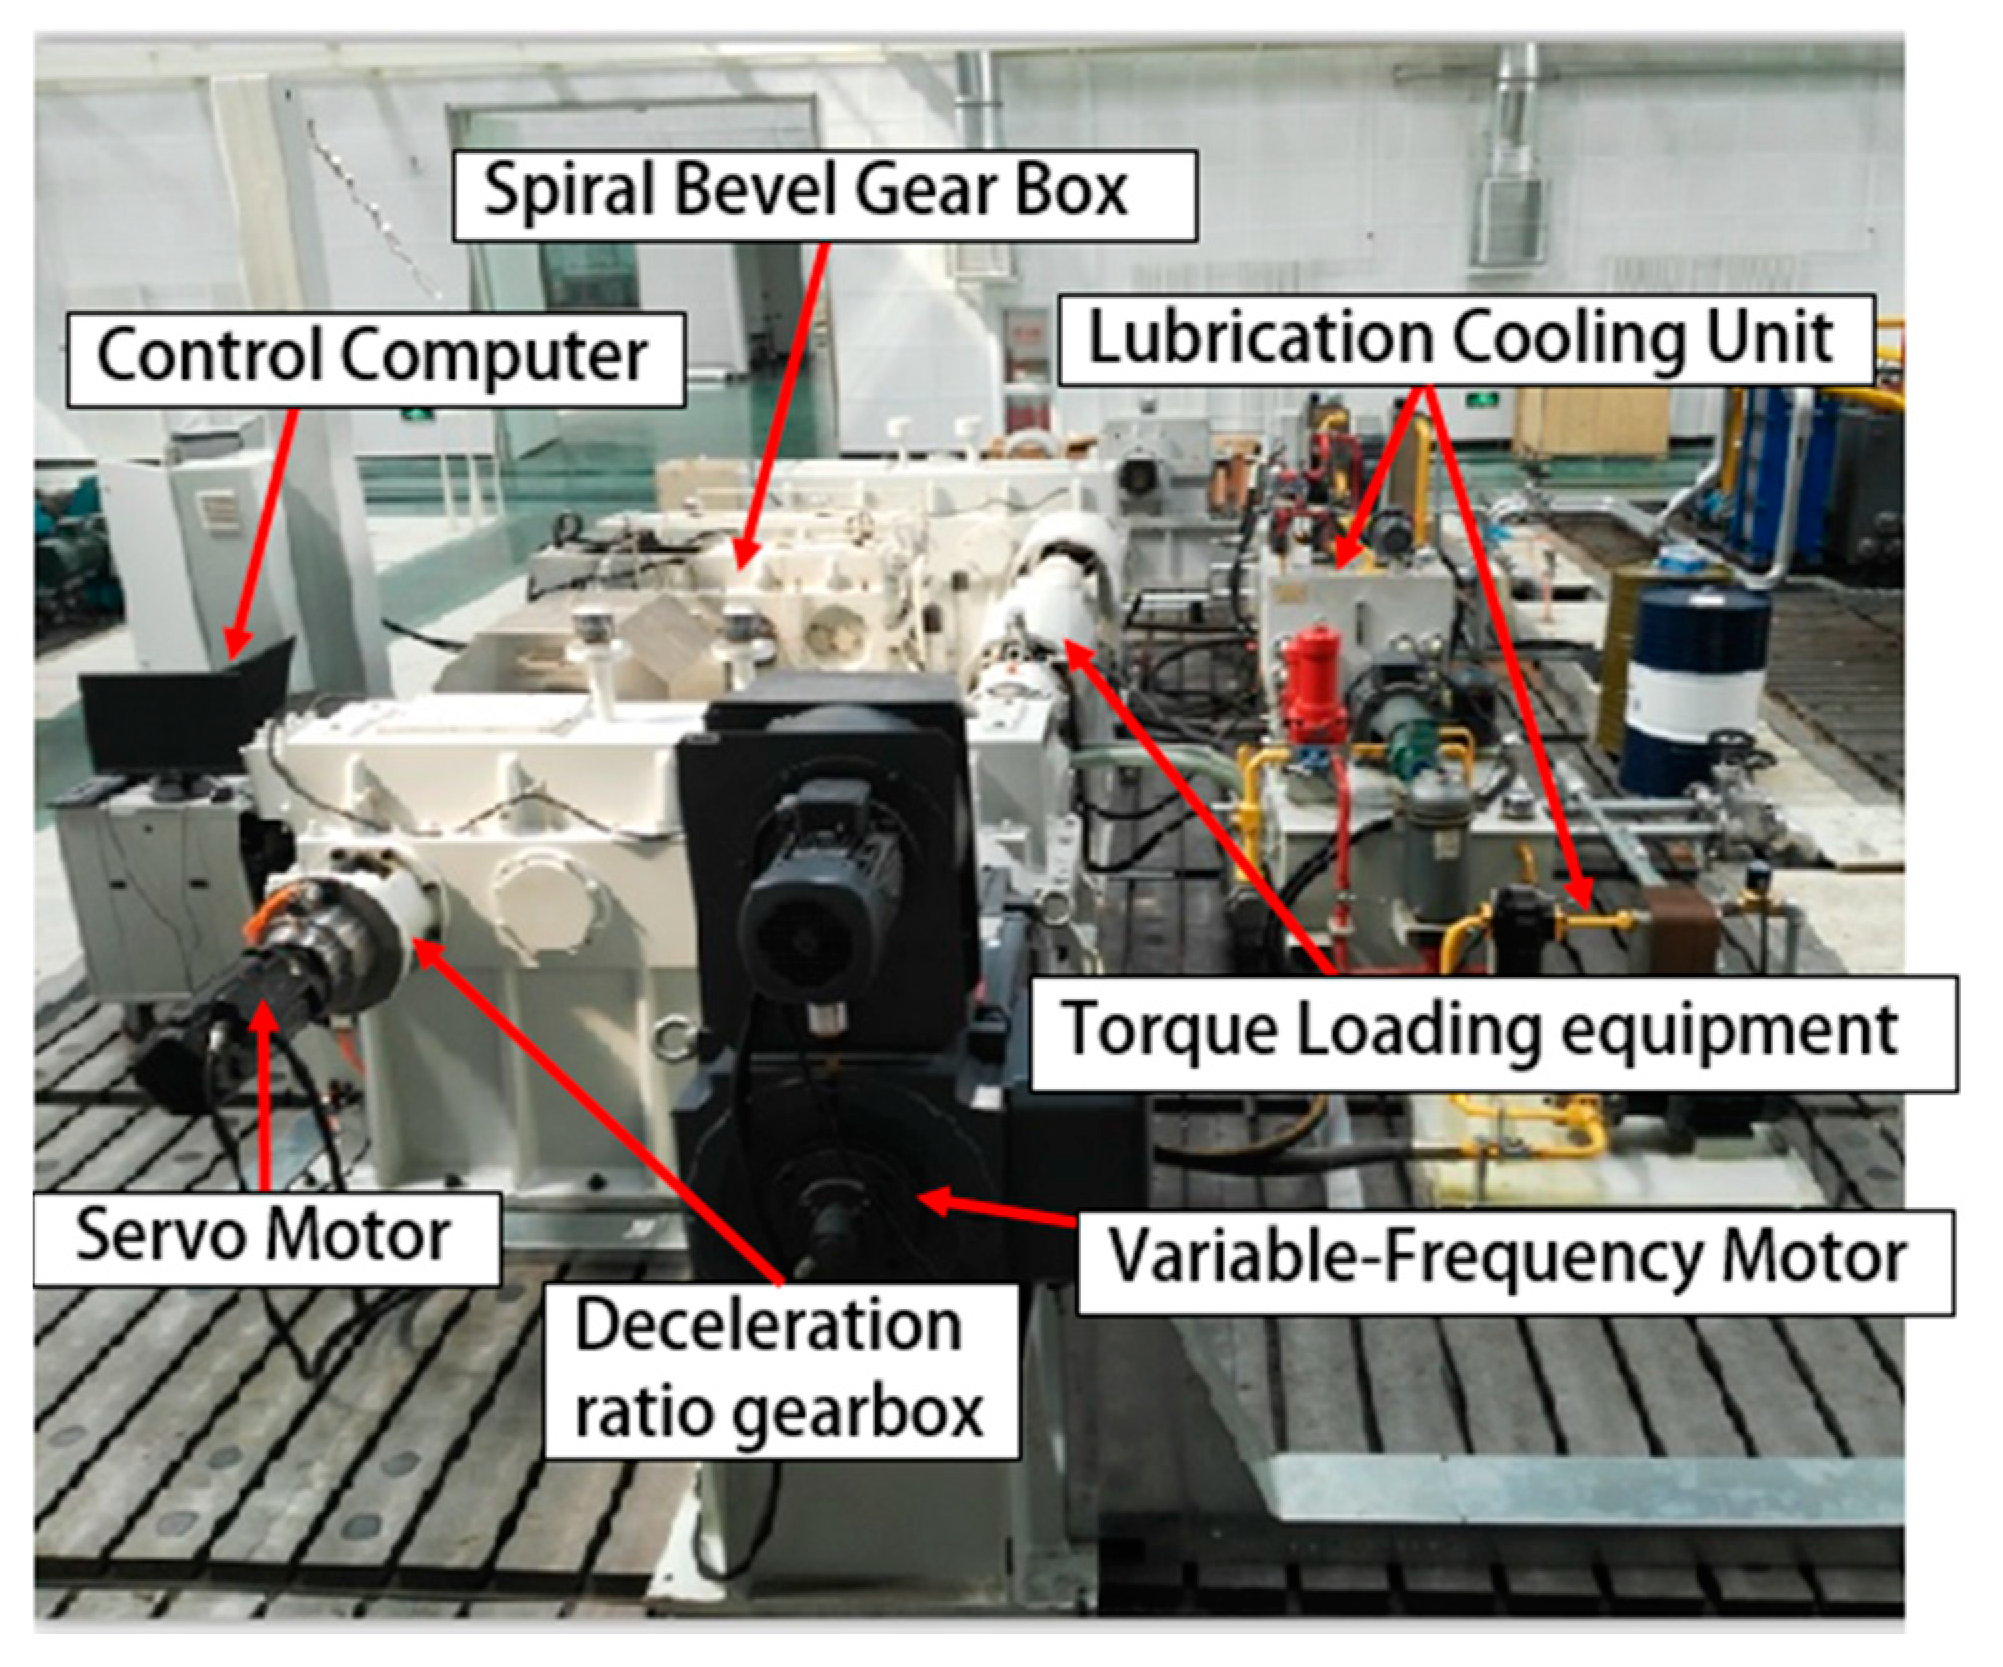
As shown in Figure 15 below, a contact performance test bench of spiral bevel gear pair was developed. The test scheme adopts servomotor and high deceleration ratio gearbox combined drive mode to realize quasi-static loading. Meanwhile, different loading torques are achieved through hydraulic torque loading equipment.

5.2. Tooth Contact Pattern Test

When the loading torque T = 500 Nm, 1500 Nm, and 4500 Nm is applied separately, the real images of the contact pattern of the teeth surface are compared with the FEM simulation result as shown in Figure 16.
As shown in Figure 16 above, we can find that the test and simulation results are basically consistent, and directional angle and contact trace change trends are similar, which preliminarily verifies the reliability of previously generated finite element models. The theoretical contact ratio of this spiral bevel gear pair is 2.26, which is calculated by Equation (45) according to gear design and manufacture parameters [26]. The theoretical contact ratio is the maximum contact ratio of gear pair can be achieved with the increase of load under the condition of no edge contact. Compared the real images of Figure 16a with Figure 16b above, we can find that, when the load T increases from 500 Nm to 1500 Nm, the contact pattern becomes larger but still within the tooth surface boundary, so the actual contact ratio of condition (a) and (b) are smaller than theoretical contact ratio, and the value are 1.53 and 1.74, which are calculated by Equations (46) and (47) [27,28]. When load T is 4500 Nm, compare with 500 Nm and 1500 Nm, the contact pattern extend to the large end of the boundary and occur edge contact, so the actual contact ratio of condition (c) exceeds theoretical contact ratio, the result is 2.31.
ε γ = ε α 2 + ε β 2
ε γ is theoretical contact ratio, ε α is transverse contact ratio, and ε β is overlap contact ratio.
ε γ = ε α 2 ε α 2 I 1 2
I 1 = C P T 1 C P D T 1 D 3 ε α ε β ε γ
ε γ is actual contact ratio, ε α is revised transverse contact ratio, C P is load distribution ratio, C P D is load distribution ratio under full load, T 1 is actual load and T 1 D is full load.
In summary, the actual contact ratio increases with the load T increases, which is beneficial to increase the meshing stiffness and improve the smoothness of transmission. When actual contact ratio is too large, the gear pair will occur severe edge contact, vibration, shock and noise. On the one hand, we need design theoretical contact ratio properly according to gear parameters and actual operating conditions, avoiding actual contact ratio greater than theoretical contact ratio. On the other hand, when we need loading large load, the actual installation position should make the contact zone of the tooth surface close to the small end when the light load is applied, so as to fully exert the loading capacity of the tooth surface, and avoiding edge contact under heavy load as much as possible.

5.3. Tooth Root Bending Stress Test

As established in Figure 17, the numbers of root bending stress signal channels are limited, and tooth pitch of pinion is too small to install the strain gauges. Eight strain gauges are installed on the adjacent teeth of the gear before the test, and the positions are arranged from the small end to the big end of the gear. Because of excessive torque (T ≥ 5000 Nm) may cause damage to strain gauges, load T = 1500 Nm, T = 3000 Nm and T = 4500 Nm are applied to the gear respectively during the test.
The results comparison of test and FEM of root bending stresses is shown in Figure 18 below. We can find that the test results and the FEM results showed a trend similar, which can verify the effectiveness of the finite element model. The test bending stress of the small end teeth root are slightly larger than that of the large end teeth root, and the maximum root bending stress spot moves towards the large end with torque increases, which indicates the reliability of the previous discussion. The difference between the test results and the FEM results is that the root bending stress solved by simulation is the geometric average value of the stress in three directions, while the strain gauge measures the strain in one direction of the tooth height. Due to the influences of installation position error, measurement accuracy, and temperature factors, there is a deviation between the test results and the FEM values.

5.4. Transmission Error Test

As established in Figure 19 below, this test bench adopts high precision circular gratings for measuring transmission error of gear pairs under quasi-static loading, and the circular gratings were installed on the both ends of spiral bevel gear pair, which can measure the relative angular displacement. We calculated transmission error according to Equation (48):
T E = ε 1 i T ε 2
where TE is transmission error, i T   is theoretical transmission ratio between input and output gear, and ε 1 , ε 2 is rotation angle of input and output gear measured by circular gratings during the same period separately.
The test results of transmission errors after translation are shown in Figure 20 below. We can know that the absolute value and peak to peak of test results are larger than that of FEM results, but the variation trend and fluctuation period of the two are similar.
We can further analyze the difference between test results with simulation results. We define the rotation speed of gear as w 1 = τ 1 , and the rotation speed of gear w 2 = i ( t ) τ 2 . i ( t ) is instantaneous transmission ratio. Relative speed of gear and pinion in meshing position can be represented as:
v 12 = τ 1 × R 2 i ( t ) τ 2 × R 1
For the meshing equation v 12 ·   N 2 = 0 , we can get i ( t ) :
i ( t ) = ( τ 2 ,   R 2 ,   N 2 ) ( τ 1 ,   R 1 ,   N 1 ) = ( τ 2 ,   r 2 ,   n 2 ) ( τ 1 ,   r 1 ,   n 1 )
We can know from above Equation (50), instantaneous transmission ratio i ( t ) changes with contact point changes, so it is not necessarily equal to theoretical transmission ratio i T . When load T is small, the fluctuation amplitude of i ( t ) is not obvious, and i ( t ) fluctuates around the theoretical value. When load T becomes larger, the fluctuation amplitude of i ( t ) increases with the deformation and the contact ratio of gear pair increases. One reason for the difference is that the instantaneous transmission ratio of spiral bevel gear pair is changing, while the test results used the unchanging transmission ratio for calculation. Another reason is that the measurement accuracy and signal interference of circular grating affect the correctness of test results.

6. Conclusions

This paper presents an accurate mathematical model of tooth surface, fillet surface, and root cone surface of spiral bevel gear pair. Based on the calculated lattice data, an FEM model of spiral bevel gears transmission system has been constructed which considers the deformation of gear and shaft, bearing support, and solving time. For further study, we develop a test bench for contact performance of spiral bevel gear pairs and compare the formula calculated results, FEM results, and experiment results together. The formula calculated value of contact stress is about 10–15% larger than that of FEM analysis value. The real images of contact pattern are basically with simulation results, and the actual contact ratio of 500 Nm and 1500 Nm load are smaller than theoretical values, and are 1.53 and 1.74, respectively. When the load is 4500 Nm, the test gear has edge contact and the actual contact ratio exceeds the theoretical value, reaching 2.31. The formula calculated value of tooth root bending stress is about 10–14% larger than that of the FEM analysis value, and the test results and the FEM results show variation trends that are similar and have some differences too. The absolute value and peak to peak of transmission error test results are larger than that of FEM results, but the variation trend and fluctuation period of the two are basically consistently similar. The reason for the difference is that the instantaneous transmission ratio i ( t ) is changing, while the test results used the theoretical transmission ratio i T for calculation.
In the future, the target will focus on FEM model accuracy by comparing with real parts using 3D scanning or cross-sections, optimize the measurement scheme, and finally reduce the difference between FEM results with experiment results. In the meantime, we will thoroughly study the global optimization design method of tooth contact characteristics and the correlation between quasi-static and dynamic operation condition.

Author Contributions

Conceptualization, Y.F. and Y.Z.; methodology, Y.F., Y.Z., and H.L.; validation, B.W. and H.L.; investigation, Y.F. and Z.W.; data curation, B.W.; writing—original draft preparation, Y.F.; writing—review and editing, Y.F., Z.W., and Y.Z.; funding acquisition, X.Z. and Y.Z. All authors have read and agreed to the published version of the manuscript.

Funding

This research was funded by the National Natural Science Foundation of China (Grant No. 51275453) and Key Research and Development Projects of Lishui City (2016ZDYF15).

Acknowledgments

The author would like to thank the State Key Laboratory of Fluid Power Transmission and Control for supporting the experimental conditions of the research.

Conflicts of Interest

The authors declare no conflict of interest.

References

  1. Litvin, F.L.; Fuentes, A. Gear Geometry and Applied Theory; Cambridge University Press: Cambridge, UK, 2004; pp. 3–11. [Google Scholar]
  2. Shojaei, A.; Tajmir, R.H.; Hirmand, M. Finite element modeling of incremental bridge launching and study on behavior of the bridge during construction stages. Int. J. Civ. Eng. 2015, 13, 112–125. [Google Scholar]
  3. Litvin, F.L.; Fuentes, A.; Fan, Q.; Handschuh, R.F. Computerized design, simulation of meshing, and contact and stress analysis of face-milled formate generated spiral bevel gears. Mech. Mach. Theory 2002, 37, 441–459. [Google Scholar] [CrossRef]
  4. Litvin, F.L.; Fuentes, A.; Hayasaka, K. Design, manufacture, stress analysis, and experimental tests of low-noise high endurance spiral bevel gears. Mech. Mach. Theory 2006, 41, 83–118. [Google Scholar] [CrossRef]
  5. He, D.; Ding, H.; Tang, J.Y. A new analytical identification approach to the tooth contact points considering misalignments for spiral bevel or hypoid gears. Mech. Mach. Theory 2018, 121, 785–803. [Google Scholar] [CrossRef]
  6. Simon, V. Optimization of face-hobbed hypoid gears. Mech. Mach. Theory 2014, 77, 164–181. [Google Scholar] [CrossRef]
  7. Simon, V. Design and manufacture of spiral bevel gears with reduced transmission errors. J. Mech. Des. 2009, 131, 041007. [Google Scholar] [CrossRef]
  8. Simon, V. Design of face-hobbed spiral bevel gears with reduced maximum tooth contact pressure and transmission errors. Chin. J. Aeronaut. 2013, 26, 777–790. [Google Scholar] [CrossRef] [Green Version]
  9. Simon, V. Manufacture of optimized face-hobbed spiral bevel gears on computer numerical control hypoid generator. J. Manuf. Sci. Eng. 2014, 136, 031008. [Google Scholar] [CrossRef]
  10. Simon, V. Computer simulation of tooth contact analysis of mismatched spiral bevel gears. Mech. Mach. Theory 2007, 42, 365–381. [Google Scholar] [CrossRef]
  11. Artoni, A.; Kolivand, M.; Kahraman, A. An ease-off based optimization of the loaded transmission error of hypoid gears. J. Mech. Des. 2010, 132, 011010. [Google Scholar] [CrossRef]
  12. Artoni, A.; Bracci, A.; Gabaccini, M.; Guiggiani, M. Optimization of the loaded contact pattern in hypoid gears by automatic topography modification. J. Mech. Des. 2009, 131, 011008. [Google Scholar] [CrossRef]
  13. Artoni, A.; Gabaccini, M.; Guiggiani, M.; Kahraman, A. Multi objective ease-off optimization of hypoid gears for their efficiency, noise, and durability performances. J. Mech. Des. 2011, 133, 121007. [Google Scholar] [CrossRef]
  14. Kolivand, M.; Kahraman, A. An ease-off based method for loaded tooth contact analysis of hypoid gears having local and global surface deviations. J. Mech. Des. 2010, 132, 071004. [Google Scholar] [CrossRef]
  15. Kolivand, M.; Kahraman, A. A load distribution model for hypoid gears using ease-off topography and shell theory. Mech. Mach. Theory 2009, 44, 1848–1865. [Google Scholar] [CrossRef]
  16. Mu, Y.M.; Fang, Z.D. An ease-off flank modification method for high contact ratio spiral bevel gears with modified curvature motion. J. Adv. Mech. Des. Syst. Manuf. 2017, 11, 0034. [Google Scholar] [CrossRef]
  17. Nie, S.W.; Deng, J.; Deng, X.Z.; Geng, L.L. A flank modification method for spiral bevel gears based on mismatch topography adjustment. J. Adv. Mech. Des. Syst. Manuf. 2018, 12, 0057. [Google Scholar] [CrossRef]
  18. De Vaujany, J.P.; Guingand, M.; Remond, D. Numerical and experimental study of the loaded transmission error of a spiral bevel gear. J. Mech. Des. 2007, 129, 195–200. [Google Scholar] [CrossRef]
  19. Kazumasa, K.; Isamu, T. Analytical and experimental tooth contact pattern of large-sized spiral bevel gears in cyclo-palloid system. J. Mech. Des. 2010, 132, 139–147. [Google Scholar]
  20. Zhuo, Y.B.; Xiang, X.Y.; Zhou, X.J. A method for the global optimization of the tooth contact pattern and transmission error of spiral bevel and hypoid gears. J. Zhejiang Univ. 2017, 18, 377–392. [Google Scholar] [CrossRef]
  21. Zhuo, Y.B.; Zhou, X.J.; Lv, H.L. Theoretical and experimental investigation on contact characteristics of hypoid gears under quasi-static condition. Chin. J. Sci. Instrum. 2017, 38, 1285–1295. [Google Scholar]
  22. Cao, X.M.; Deng, X.Z.; Wei, B.Y. A novel method for gear tooth contact analysis and experimental validation. Mech. Mach. Theory 2018, 126, 1–13. [Google Scholar] [CrossRef]
  23. Liang, Z.Q.; Huang, D.Q.; Zhou, T.F.; Li, H.W. Simulation and experimental research on grinding surface topography of spiral bevel gear. J. Mech. Eng. 2019, 55, 191–198. [Google Scholar] [CrossRef]
  24. ISO. 10300-Calculation of Load Capacity of Bevel Gears; International Standard: Geneva, Switzerland, 2014. [Google Scholar]
  25. ISO. 6336-Calculation of Load Capacity of Spur and Helical Gears; International Standard: Geneva, Switzerland, 2006. [Google Scholar]
  26. Chen, X.N.; Gu, D.Q. Machine Design; Zhejiang University Press: Hangzhou, China, 2004; pp. 165–172. [Google Scholar]
  27. Deng, X.Z.; Shu, Y.Q.; Liang, G.M. The Contact ratio of Spiral Bevel Gear for Different Loads. J. Luoyang Inst. Technol. 1994, 15, 47–152. [Google Scholar]
  28. AGMA. Rating the Pitting Resistance and Bending Strength of Generated Straight Bevel, ZEROL Bevel and Spiral Bevel Gear Teeth; American National Standard: New York, NY, USA, 1997. [Google Scholar]
Figure 1. Position relationship between the gear embryo and cutting cutter head.
Applsci 10 05109 g001
Figure 2. Theoretical Modeling of the gear concave and convex surfaces.
Applsci 10 05109 g002
Figure 3. Position relationship between the pinion embryo and cutting cutter head.
Applsci 10 05109 g003
Figure 4. Theoretical Modeling of the pinion concave and convex surfaces.
Applsci 10 05109 g004
Figure 5. Contact Point Position of the spiral bevel gear pair surfaces.
Applsci 10 05109 g005
Figure 6. Spline curves of the gear and pinion.
Applsci 10 05109 g006
Figure 7. Generation process of spiral bevel gear pair: (a) generation process of gear, and (b) generation process of pinion.
Applsci 10 05109 g007
Figure 8. Simplified spiral bevel gear transmission system.
Applsci 10 05109 g008
Figure 9. Mesh generation of spiral bevel gear.
Applsci 10 05109 g009
Figure 10. Comparison of loaded contact zone of the gear convex face: (a) Load T = 500 Nm, (b) Load T = 1500 Nm, and (c) Load T = 4500 Nm.
Applsci 10 05109 g010
Figure 11. Comparison of loaded contact stress of the gear convex face: (a) Load T = 1500 Nm, (b) Load T = 4500 Nm, and (c) Load T = 7500 Nm.
Applsci 10 05109 g011
Figure 12. Comparison of maximum root bending stress of the gear and pinion: (a) the gear T 2 = 1500 Nm, (b) the gear T 2 = 4500 Nm, (c) the gear T 2 = 7500 Nm, (d) the pinion T 1 = 1500 Nm, (e) the pinion T 1 = 4500 Nm, and (f) the pinion T 1 = 7500 Nm.
Applsci 10 05109 g012
Figure 13. Comparison of the maximum value of bending stresses on the tooth surface boundary: (a) maximum bending stresses value of gear, and (b) maximum bending stresses value of pinion.
Applsci 10 05109 g013
Figure 14. Comparison of transmission errors under different loads: (a) original transmission error curves, and (b) transmission error curves after translation.
Applsci 10 05109 g014
Figure 15. Composition of test bench.
Applsci 10 05109 g015
Figure 16. Results comparison of test and FEM of contact pattern: (a) Load T = 500 Nm, (b) Load T = 1500 Nm, and (c) Load T = 4500 Nm.
Applsci 10 05109 g016
Figure 17. Layout of root strain gauges.
Applsci 10 05109 g017
Figure 18. Results comparison of test and FEM of root bending stress of the gear.
Applsci 10 05109 g018
Figure 19. Main components of circular grating equipment.
Applsci 10 05109 g019
Figure 20. Test results of transmission errors after translation.
Applsci 10 05109 g020
Table 1. Basic tooth geometric parameters.
Geometrical ParameterDescription
PinionGear
Number of teeth 1546
Hand of spiralLeftRight
Modification coefficient 0.35−0.35
Pitch diameter (mm)90276
Tip diameter (mm)117.48423.28
Module (mm)6
Shaft angle (°)90
Pressure angle(°)20
Tooth width(mm)44
Spiral angle (°)35
Table 2. Material properties of 20CrMnTiA.
Material E / ( G P a ) v ρ / ( k g / m 3 )   σ H l i m / ( M P a )   σ F l i m / ( M P a )   R 0.2 / ( M P a )
20CrMnTiA2070.2578001475415850
Table 3. Results comparison of FEM and empirical formula of maximum contact stresses.
Load T/Nm Calculated   Results   σ H / MPa Simulation   Results   σ H / MPa Values of Differences
Δ%
1500632.79573.839.32
3000815.48758.257.02
45001045.32914.4912.51
60001324.211138.114.05
75001569.74133115.21
Table 4. Results comparison of FEM and empirical formula of bending stresses.
Load T/NmGearPinion
FEM Results
σ F 2 / MPa
Calculated Results
σ F 2 / MPa
Values of Differencs Δ%FEM
Results
σ F 1 / MPa
Calculated
Results
σ F 1 / MPa
Values of Differences
Δ%
150029634313.7133838913.11
300045652913.7956764311.82
450062171012.5479188310.42
60008058909.55925103913.86
7500912106712.521183135212.5