Article

Predicting the Width of Corrosion-Induced Cracks in Reinforced Concrete Using a Damage Model Based on Fracture Mechanics

1
Faculty of Engineering and Design, Kagawa University, 2217-20, Hayashi, Takamatsu 761-0396, Kagawa, Japan
2
Research & Development Department, Nihon Kogyo Co., Ltd., 4614-13, Shido, Sanuki 769-2101, Japan
3
College of Engineering, Ibaraki University, Hitachi, Ibaraki 3168511, Japan
*
Author to whom correspondence should be addressed.
Appl. Sci. 2020, 10(15), 5272; https://doi.org/10.3390/app10155272
Submission received: 2 July 2020 / Revised: 23 July 2020 / Accepted: 27 July 2020 / Published: 30 July 2020
(This article belongs to the Section Civil Engineering)

Abstract

:
Using a finite-element scheme based on a damage model, a numerical system is developed to predict cracks in reinforced concrete beams due to corrosion expansion. The numerical results show that the width of such cracks is affected considerably by (i) the shape of the reinforcing bar, (ii) the presence of stirrups, and (iii) the number of main reinforcement bars. Specimens of reinforced concrete beams are fabricated to simulate those used in the analysis, and we determine how the crack width is related to the amount of the reinforcing bar corrosion through electrolytic corrosion experiments. The experimental results are used to assess the validity of the numerical ones, and the latter are considered to reproduce the former.

1. Introduction

In Japan, concrete structures (including those of port facilities) that were built during the intensive post-war construction period and are associated with high economic growth are now ageing remarkably. Such circumstances suggest that a future increase in the number of associated services such as inspections and diagnoses will be needed, along with the development of laws and ordinances related to the maintenance and management of these structures [1].
Reinforced concrete (RC) structures located in coastal areas, such as port and harbor facilities, are vulnerable to corrosion by chloride ions, which cause serious structural deterioration [2,3,4,5]. In principle, corroded reinforcing bars in concrete cause cracks to propagate by pressure expansion [6], which not only degrades the appearance of the structure but also induces damage to the surrounding areas or entities as the concrete cover peels and spalls [7]. Moreover, progressive corrosion of the reinforcing bars eventually leads to the structural performance of the concrete deteriorating rapidly [8]. Therefore, evaluating the residual performance of the deteriorated facility is essential for implementing inspection and diagnosis work on the facilities. Because the structural and durability performances of a structure depend strongly on the amount of reinforcing bar corrosion [9,10], a method should be established to accurately evaluate that amount.
Currently, the standard way to diagnose structural deterioration is through visual inspection [11]. With this method, the residual structural performance is evaluated quantitatively if the amount of corrosion of the reinforcing bars in the immediate vicinity of the crack can be estimated from the width of the corrosion crack on the concrete surface. The subsequent deterioration progress can be predicted, and repair and reinforcement timing can be determined, thereby helping to improve the structure’s maintenance and management. Such estimation can be established via several representative studies incorporating various cases, among which a numerical study is very effective.
There have been many numerical studies of crack width evaluation regarding the corrosion of reinforcing bars in concrete. The approaches that have been used include (i) the meshless method [12], (ii) a model of corrosion-induced crack initiation and propagation focused on corrosion products [13], (iii) predicting the cover cracking time with a numerical model [14,15,16,17], (iv) evaluating the crack width related to the amount of corrosion [18], and (v) simulating the damage development due to steel bar corrosion with a sustained load [19]. Other approaches related to structural performance include (vi) a fatigue flexural model of a corroded RC beam [20], (vii) a seismic-capacity degradation model [21,22], and (viii) a cracking model considering predictive models of the bond-strength loss of a corroded deformed bar [23].
Recently, schemes have been developed for the fracture of RC structures using damage models based on fracture mechanics [24,25]. With that approach, all parameters (e.g., calculated strain and stress output) become less susceptible to the influence of element dimensions. On that basis, an analysis carried out with finite elements of very fine dimensions would still yield generally correct results. Furthermore, because the distribution of the damage variable indicating the degree of damage can be regarded as being approximately equal to the crack distribution, the appearance of the concrete close to the actual crack can be visualized in 3D [25]. Recently, cases have been reported in which the development of 3D cone-shaped internal cracks from the nodes of deformed reinforcing bars subjected to tensile action was simulated through a numerical analysis of the uniaxial tension and bending of RC with deformed bars shaped as nodes and ribs. Because the cracks on the concrete surface caused by the corrosion of the reinforcing bars in RC differ in width according to the bar shape, this scheme is appropriate when simulating the corrosion of reinforcing bars.
Therefore, the final goal is to develop a method to estimate the amount of reinforcing bar corrosion from the width of cracks on the concrete surface generated by such corrosion. Fundamental knowledge is presented herein to develop such a method. For instance, the reinforcing bar corrosion is expressed by forced displacement in the normal direction of the surface of the reinforcing bar element [25]. The amount of reinforcing bar corrosion is formulated in terms of (i) the expansion rate of the corrosion product of the reinforcing bar and (ii) the amount of forced displacement given to the reinforcing bar [26,27,28]. The relationship between the crack width and the forced displacement given to the reinforcing bar is recognized as being that between the crack width and the amount of corrosion. The validity of this method is assessed by comparing the results of the present study with an experimental study.

2. Numerical Analysis Based on Fracture Mechanism

2.1. Outline

Based on the damage model, the present analysis of the crack progress was formulated with respect to the fracture mechanics of concrete. Because the fracture energy is a parameter in the present damage model, the damage distribution can be regarded as being approximately a crack by dividing the elements finely, the details of which were elaborated by Kurumatani et al. [25]. The crack width at the bottom of the reinforced concrete beam was investigated.
The numerical simulation described here involved a finite element analysis using an isotropic damage model based on the fracture mechanics of concrete. In principle, the constitutive law of the isotropic damage model is based on Hooke’s law and uses the scalar variable D as follows:
σ = ( 1 D ) E ε ,
where σ is the stress, E is Young’s modulus, ε is the microstrain, and D is the damage index reflecting the degree of damage, namely D = 0 when the concrete is undamaged and D = 1 when the concrete has collapsed completely.
Using an exponential function, the relationship between the cohesive force and crack opening displacement for 1D problems is expressed as
f t = exp ( f t G f w ) ,
where ft is the uniaxial tensile strength, Gf is the fracture energy, and w is the crack opening displacement. Figure 1 describes the relationship between the cohesive traction force and the crack opening displacement. This relationship is modelled by the stress-strain curve using finite element analysis and embedded in the constitutive law of the damage model.
Supposing that a single element accommodates a single crack, the crack opening displacement w can be expressed as
w = ( ε ε 0 ) h ,
where h is the length of an element in which the damage is evaluated, which corresponds to that of the finite element in the finite element analysis, and ε 0 is expressed as
ε 0 = f t E .
In a damage model, the cohesive force f on the fracture surface corresponds to stress σ as
f t = σ .
By substituting Equations (3)–(5) into Equation (2), we can transform the cohesive force and crack opening displacement relationship as
σ = ε 0 ε exp ( E ε 0 h G f ( ε ε 0 ) ) E ε = [ 1 { 1 ε 0 ε exp ( E ε 0 h G f ( ε ε 0 ) ) } ] E ε = [ 1 D ( ε ) ] E ε .
Here, the damage index D is given by
D ( ε ) = 1 ε 0 ε exp ( E ε 0 h G f ( ε ε 0 ) ) .
In the isotropic damage model of a multidimensional problem, the strain tensor is converted to the equivalent strain, which is a scalar value. The present study used the modified equivalent strain εeq proposed by De Vree et al. [29], namely
ε e q = k 1 2 k ( 1 2 n ) + 1 2 ( k 1 2 k ( 1 2 n ) ) 2 + 12 k ( 1 2 ν ) 2 J 2 ,
where ν is Poisson’s ratio and k is the ratio of the compressive strength to the tensile strength of the material; for concrete, k ≈ 10. As the first invariant of the strain tensor ε, I1 is expressed as
I 1 = tr ε = ε k k ,
Accordingly, J2 is the second invariant of the deviatoric strain and is given by
J 2 = 1 2 e : e = 1 2 e k l e k l ,
where the special character “:” is the Frobenius Product, and e is defined as
e = ε 1 3 t r ε . e = ε tr ε ,
The direct extension of Hooke’s law in the 1D damage model, Equation (1), to multi-dimensional problems can be given as
σ = ( 1 D ) c   :   ε ,
where σ is the Cauchy stress tensor, ε is the microstrain tensor, c is the elastic modulus tensor, and D is the damage variable of the isotropic damage model expressed by
D ( ε ) = 1 κ 0 κ exp ( E κ 0 h G f (   κ κ 0 ) ) ,
where κ is the maximum equivalent strain in the deformation history, and κ0 is the equivalent strain at the start of the damage.
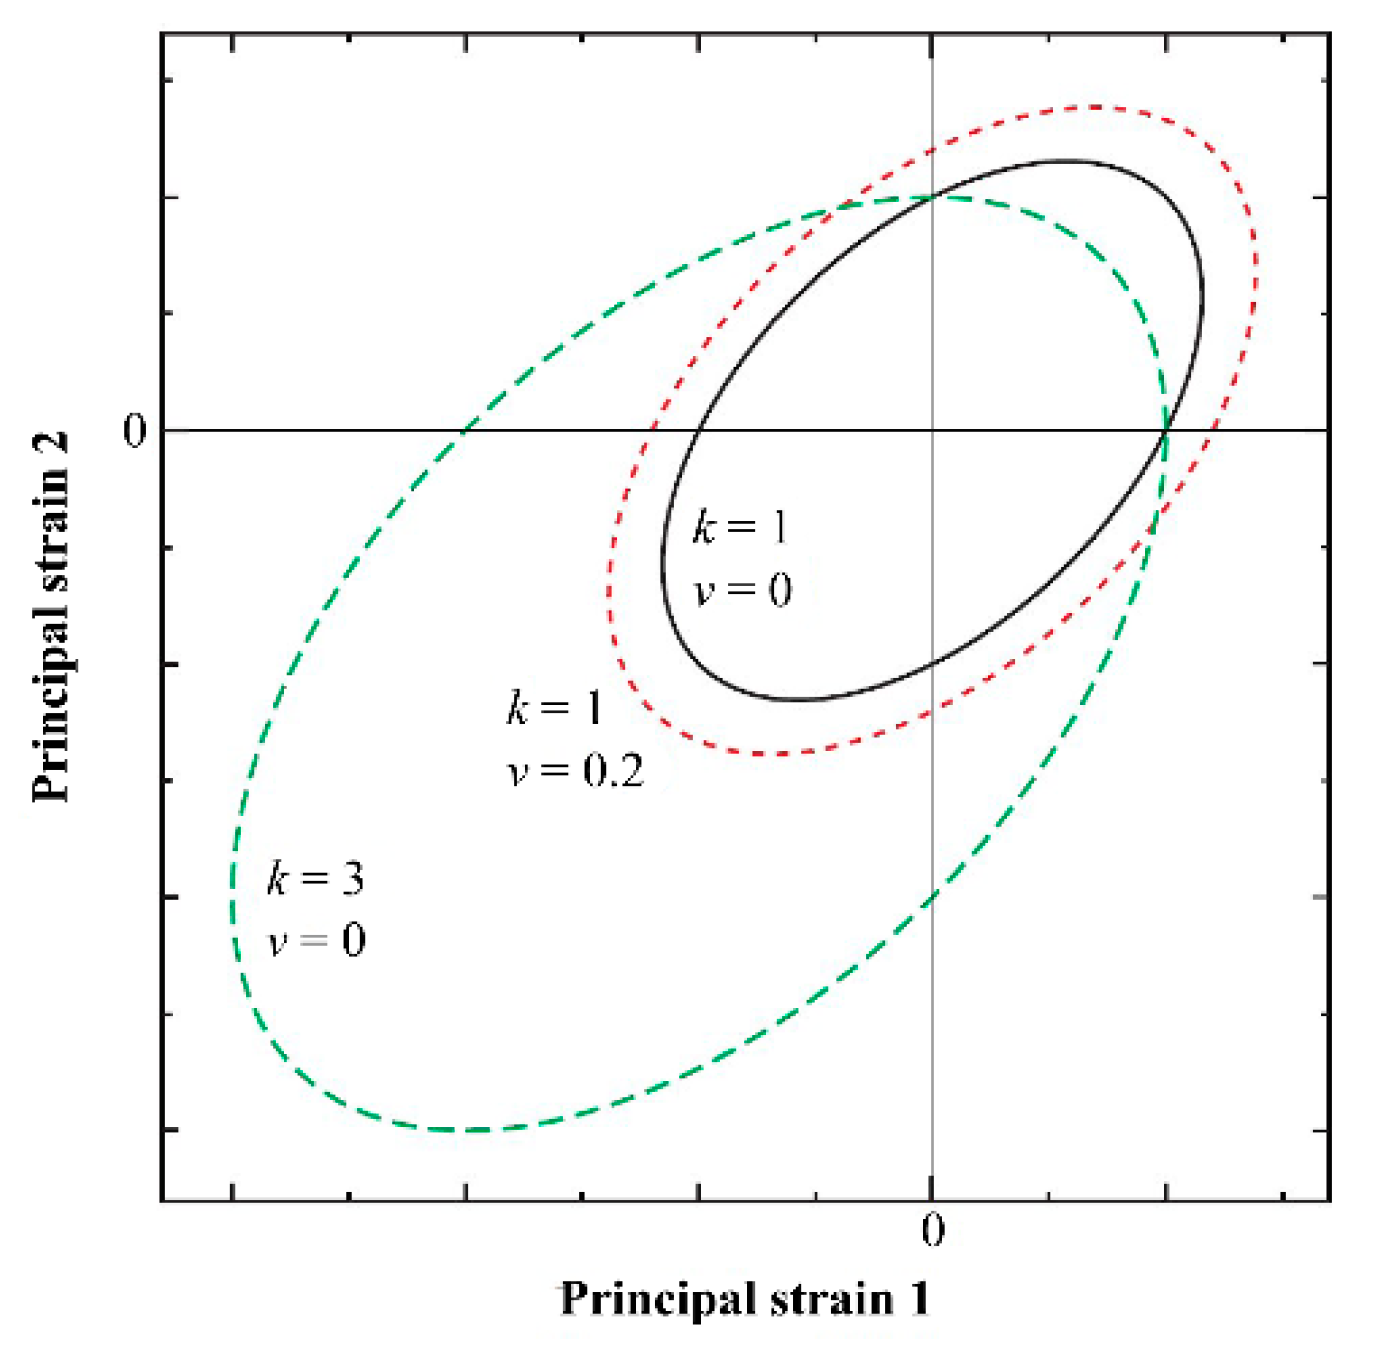
Figure 2 presents sample plots of εeq on a two-dimensional main strain space, which particularly highlights the relatively weak tensile strength and strong compressive strength. The damage model adopted herein was chosen based on the fracture energy; therefore, the analysis simulated damage and fracture behavior without being affected by the mesh size [25]. Since the damage index represents the degree of damage, its 3D distribution is an approximate reflection of the crack distribution in the concrete. Furthermore, because the model features do not characterize how the outputs depend on the finite element mesh size, a very fine mesh may result in the 3D damage distribution being almost equal in appearance to the crack distribution, where a fine damage distribution is reproducible with high resolution. Such a feature also made it possible to conduct a study that considered the shape of the deformed reinforcing bar in this model. Additionally, since this model is a damage model based on fracture mechanics, the effects of confinement provided by stirrups can be naturally considered without explicitly modeling the effects; this is discussed later in this paper.
The crack width is defined as the difference between the equivalent strain of the element and the strain at the onset of damage multiplied by the dimension factor, with respect to Equation (3),
w = ( ε e q   - ε 0 ) h ,
where εeq (>ε0) is the equivalent strain described by Equation (8).

2.2. Corrosion Expansion Model

Corrosion of the reinforcement in concrete causes the corrosion product to expand. The pressure resulting from expansion acts on the surrounding concrete and may cause damage if the generated tensile and shear stresses in concrete exceed its strength. In the present study, expansion due to the reinforcing bar corrosion was modelled by applying radial displacement to the region around the reinforcing bar. In actual structures, corrosion is more progressive in those areas that face the reinforcement side than in those that face the concrete interior, and the corrosion expansion behaves slightly differently from the corrosion expansion model used in the present study. The experimental results used to assess the validity of the present numerical results were obtained by the electrolytic corrosion of RC. In general, sufficient reinforcement corrosion occurs for such electrolytic corrosion, in which the cover thickness and tightness of the concrete are controlled so that its cover surface is filled adequately with salt water. Therefore, unlike the situation in actual structures, where the chloride ions and water content are locally different, the reinforcing bar corrosion model was considered to be appropriate within the scope of the present study and was used on that basis.
In actual structures, there is a need to model the locality of corrosion, but this is a subject for future analysis. Furthermore, the present research neglected the nonlinear effect and compressibility of the corrosion products, which we considered to be beyond the scope of this study because our aim was to simulate the generation of cracks in concrete due to corrosion expansion using the expanded damage model. Simulating the actual phenomena would require modelling (i) the Young’s modulus of the corrosion products, (ii) the spatial distribution of corrosion formation, and (iii) the nonlinear effect and compressibility of the corrosion products.

3. Validation of the Proposed Model

3.1. Outline

We used several methods to assess the validity of the simulation results. First, a model of deformed reinforcing bar that accurately reproduced the shape of the ribs was examined numerically based on the damage model, and the results are compared with those for a round reinforcing bar with no nodes or ribs. Next, we determined how the presence or absence of stirrups affected the width of surface cracks for RC beams whose main bars were deformed.

3.2. How the Shape of Reinforcing Bars Affects Corrosion Cracks

3.2.1. Analysis Conditions

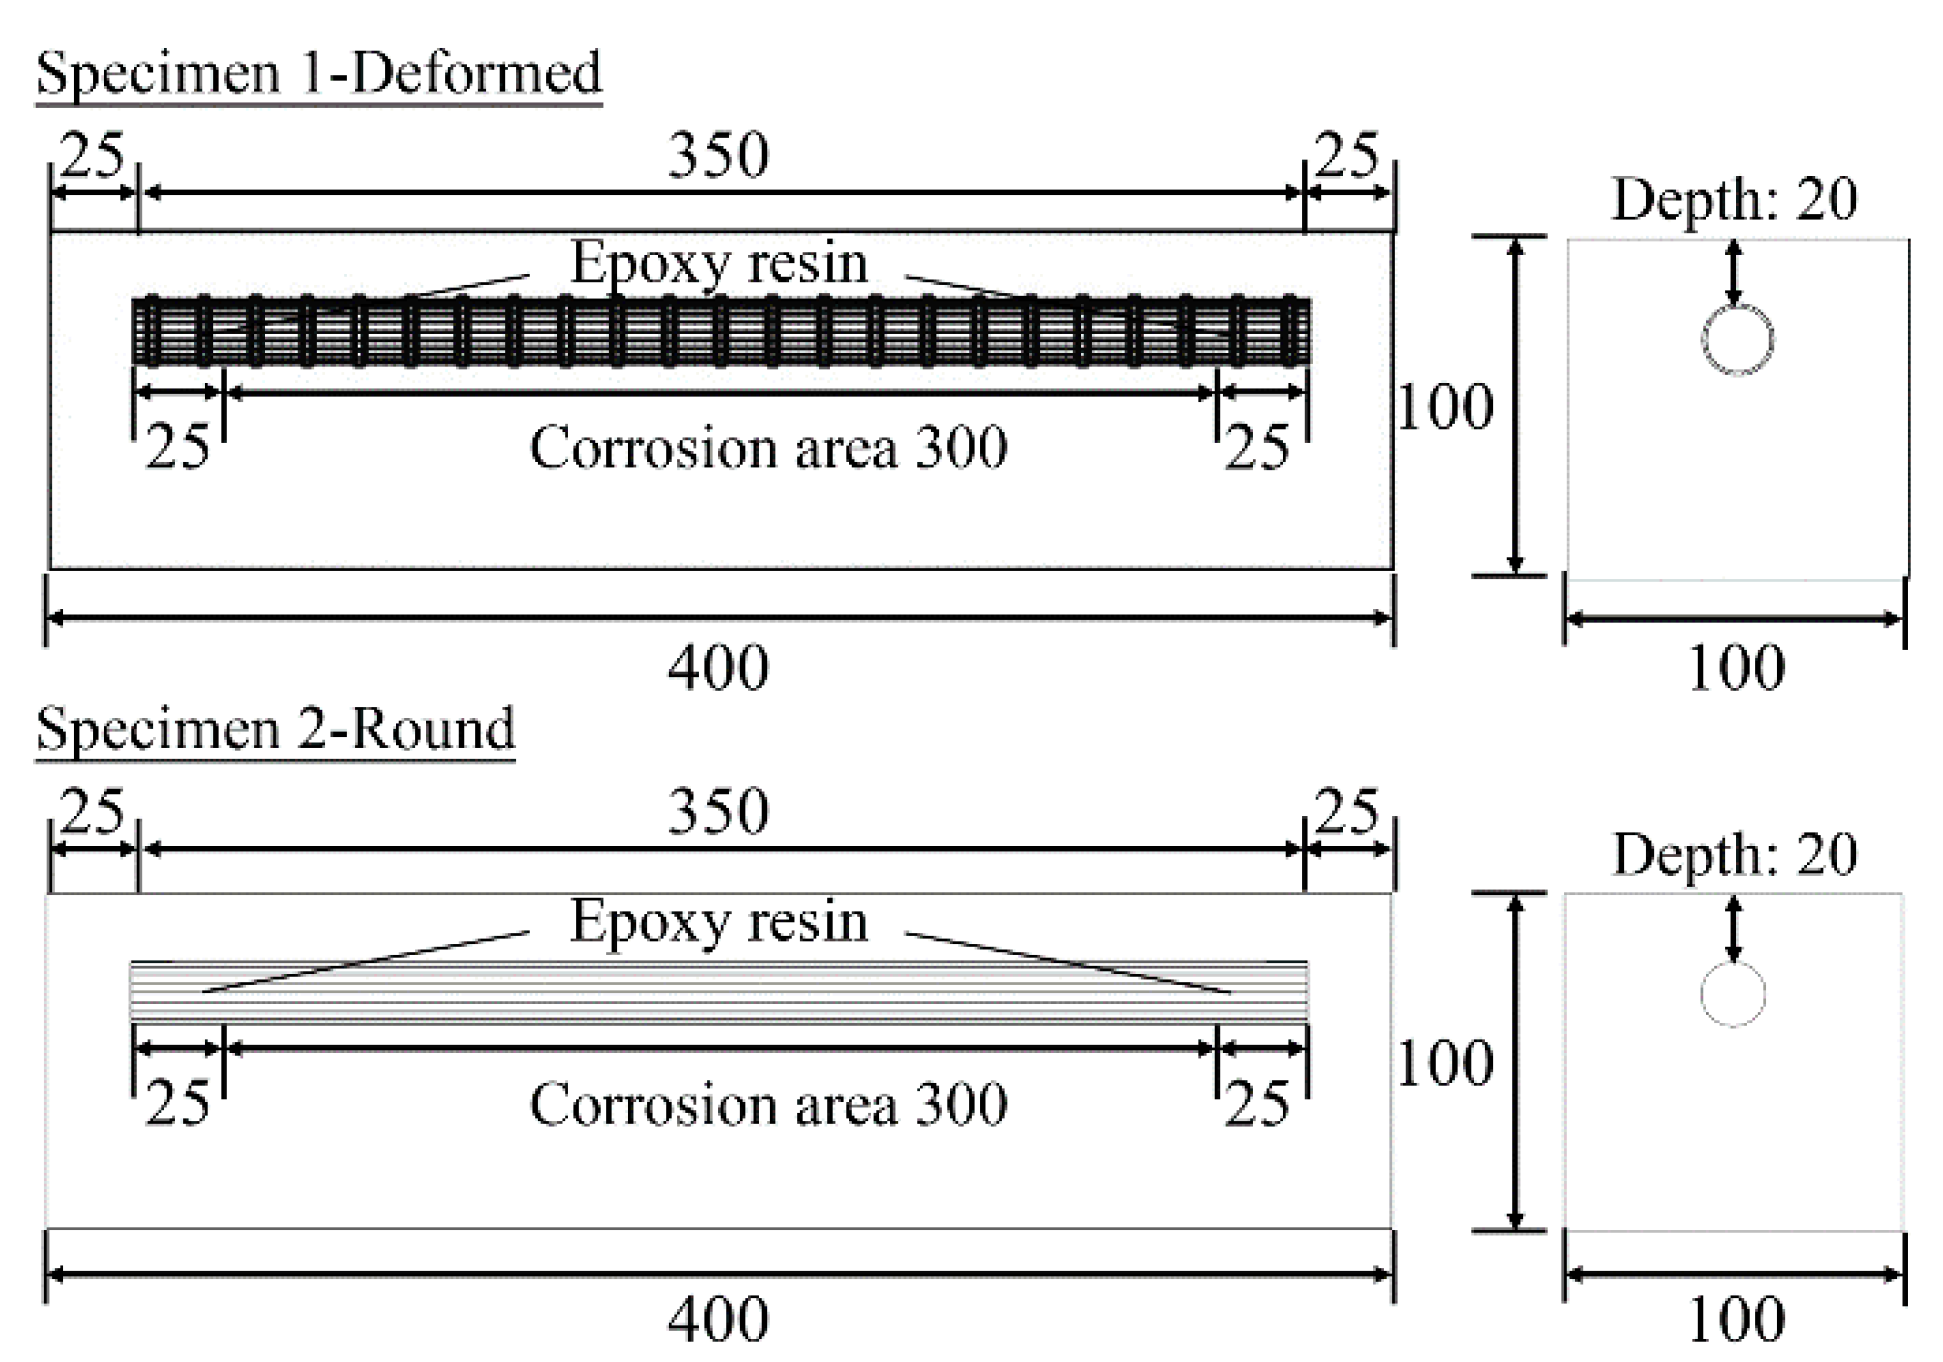
To understand (i) the state of cracks originating from reinforcing bar corrosion and (ii) the influence of the reinforcing bar shape, a 3D shape model of a deformed reinforcing bar was prepared under conditions for analyzing the crack width and with reference to Nishizawa et al. [30]. Figure 3 shows the cross-sections (sections 1 and 2) used in the analysis. The model specimens are shown schematically in Figure 4. In the literature, parts covered with epoxy resin and butyl rubber tape, other than the corrosion section of the central 300-mm area, neither corroded nor expanded. For Specimens 1 and 2, round and deformed bars were modeled and a comparison of the corrosion expansion cracks that occurred on the cover surfaces of the beams was made for the respective bars. The present reinforcing bar corrosion expansion was reproduced by applying a displacement equivalent to 0.001 mm per step to the corrosion area of the reinforcing bar model surface in the normal direction and increasing the displacement gradually up to 200 steps. The parameters used in this analysis were set to E = 20,000 MPa, υ = 0.2, k = 10, κ0 = 0.0001, Gf = 0.1 N/mm and ft = 2.0 MPa [24,30].

3.2.2. Results

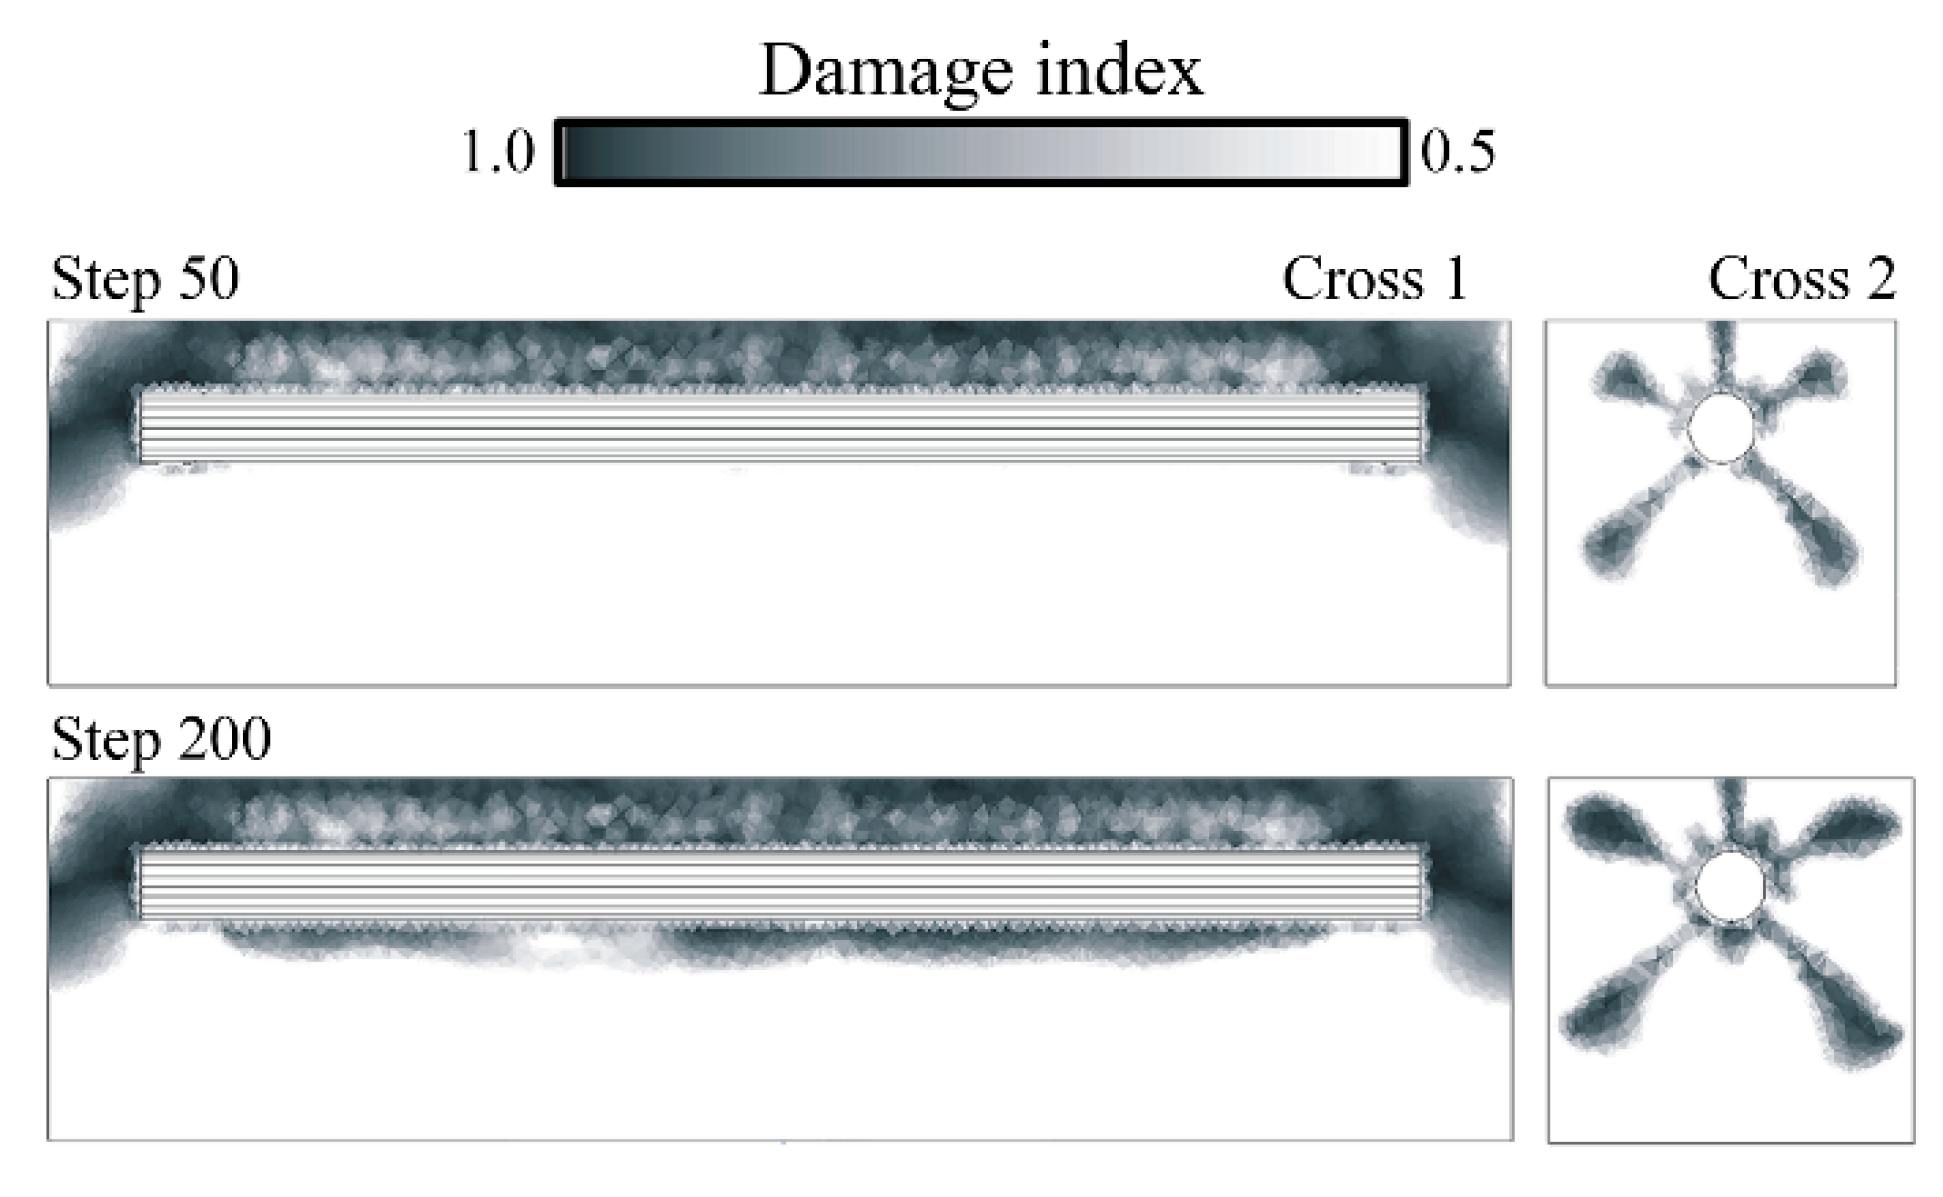
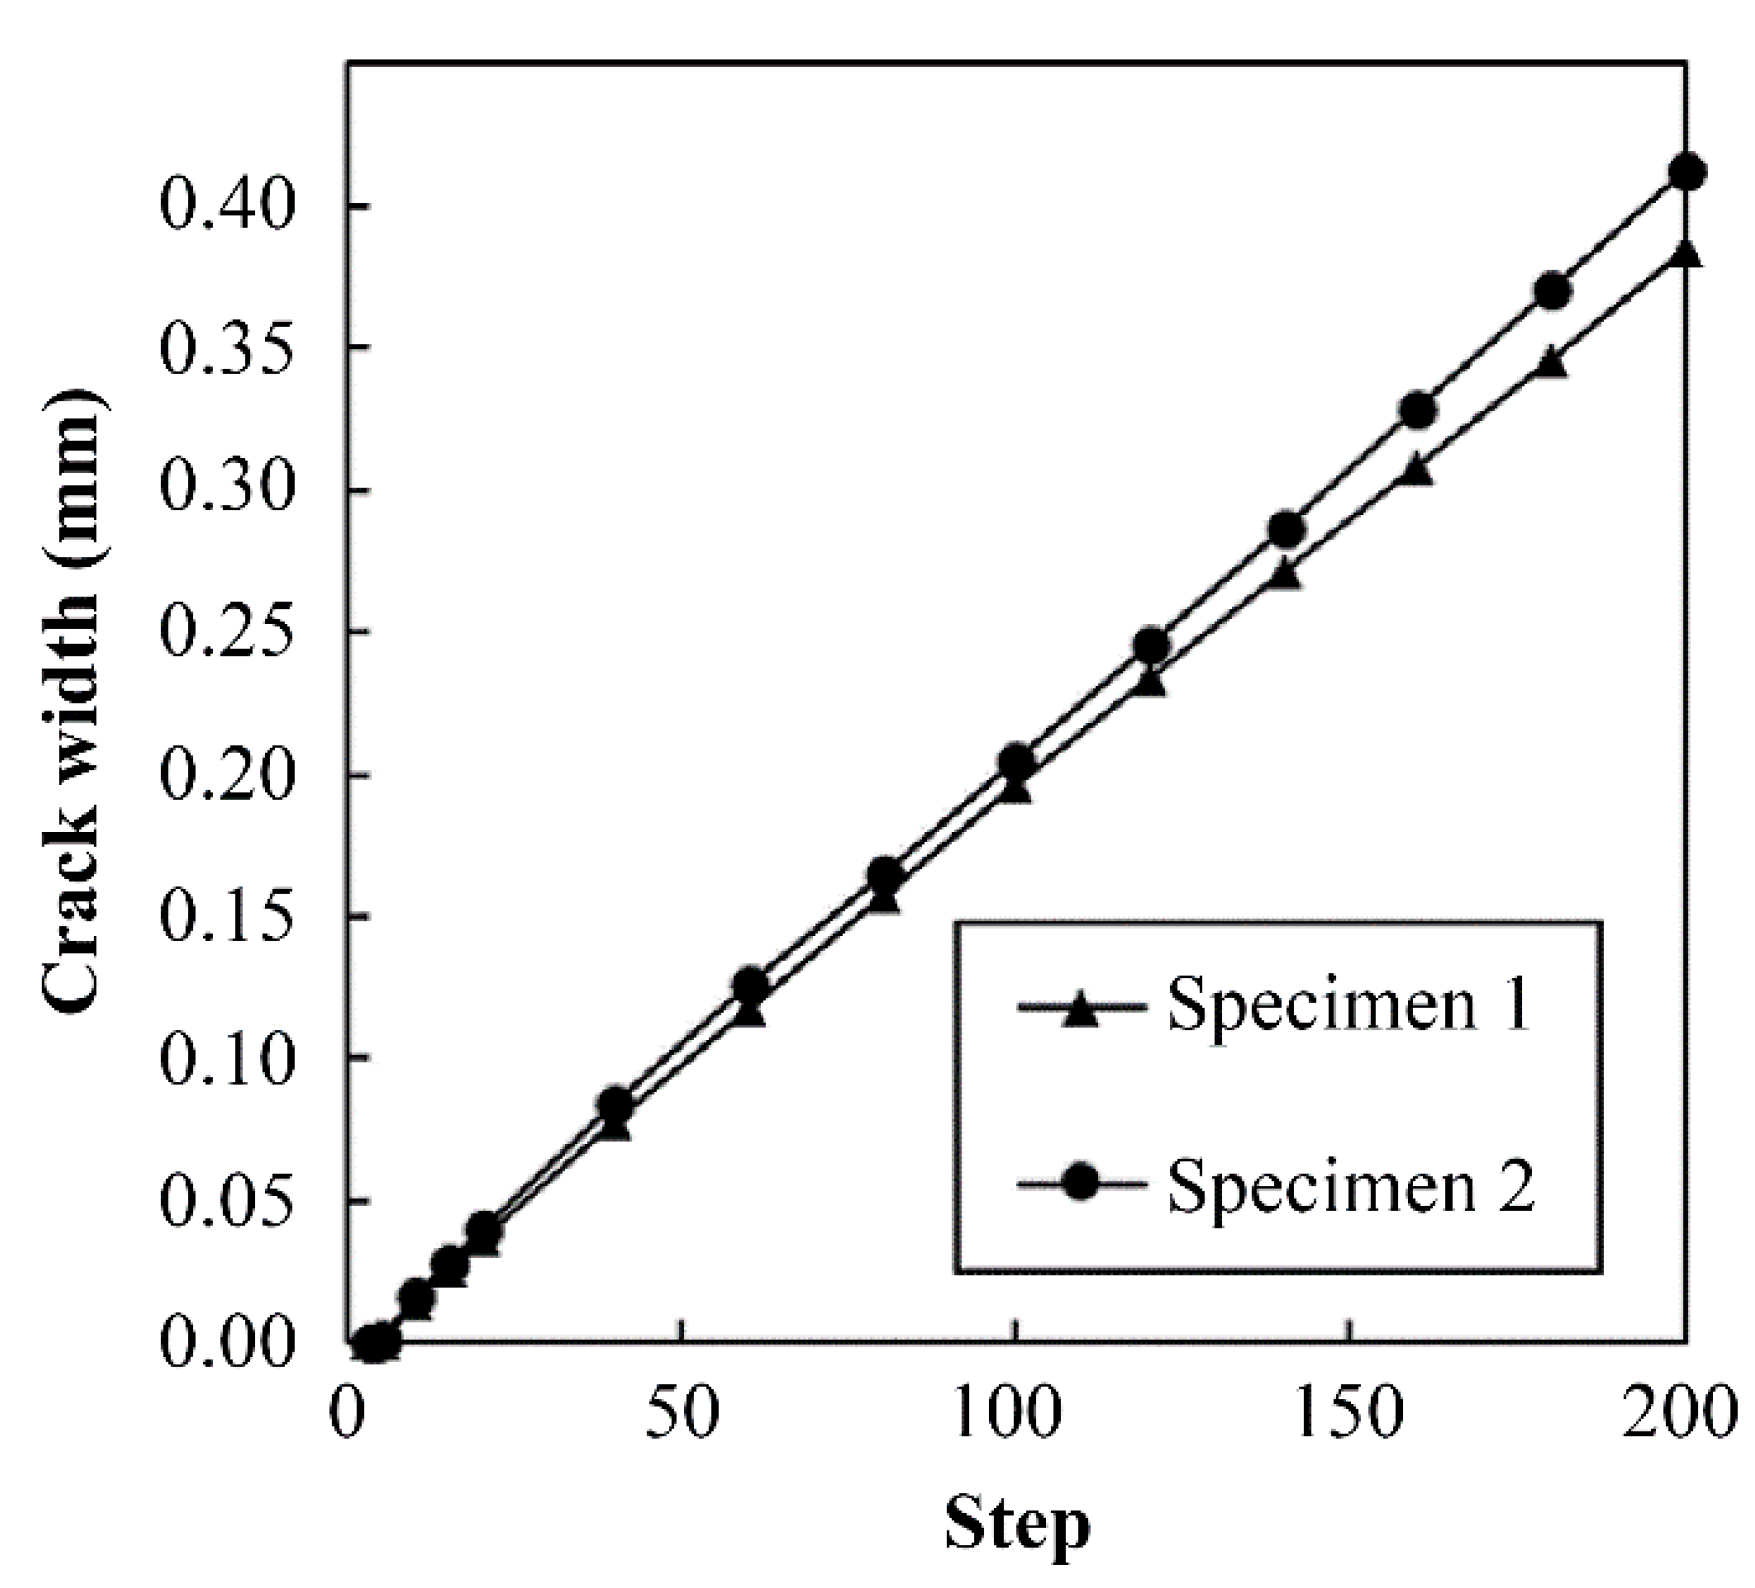
The results of the crack analysis in the 50- and 200-step sections of Specimens 1 and 2 are shown in Figure 5 and Figure 6. The crack width of the elements corresponding to the part of the line intersecting sections 1 and 2 on the top surface of the test piece in Figure 3 was calculated using Equation (14). Moreover, the results for section 2 in Figure 5 and Figure 6 show that both were radially damaged by forced displacement corresponding to corrosion expansion. At first glance, it seems that there was little difference in the spread of damage between Specimens 1 and 2. The crack width versus the loading step of reinforcement of Specimens 1 and 2 is shown in Figure 7. When the crack width of each specimen was compared in the same step at the stage of 20 steps or more, cracks at the same step were found to be wider when using a round bar than when using a deformed bar. This is consistent with the results shown by Akashiro et al. [31]. Therefore, the results collected for the modelling and examination of the shapes of the nodes and ribs of the deformed reinforcing bar seem reasonable.

3.3. How Stirrups Affect Corrosion Cracking

3.3.1. Analysis Conditions

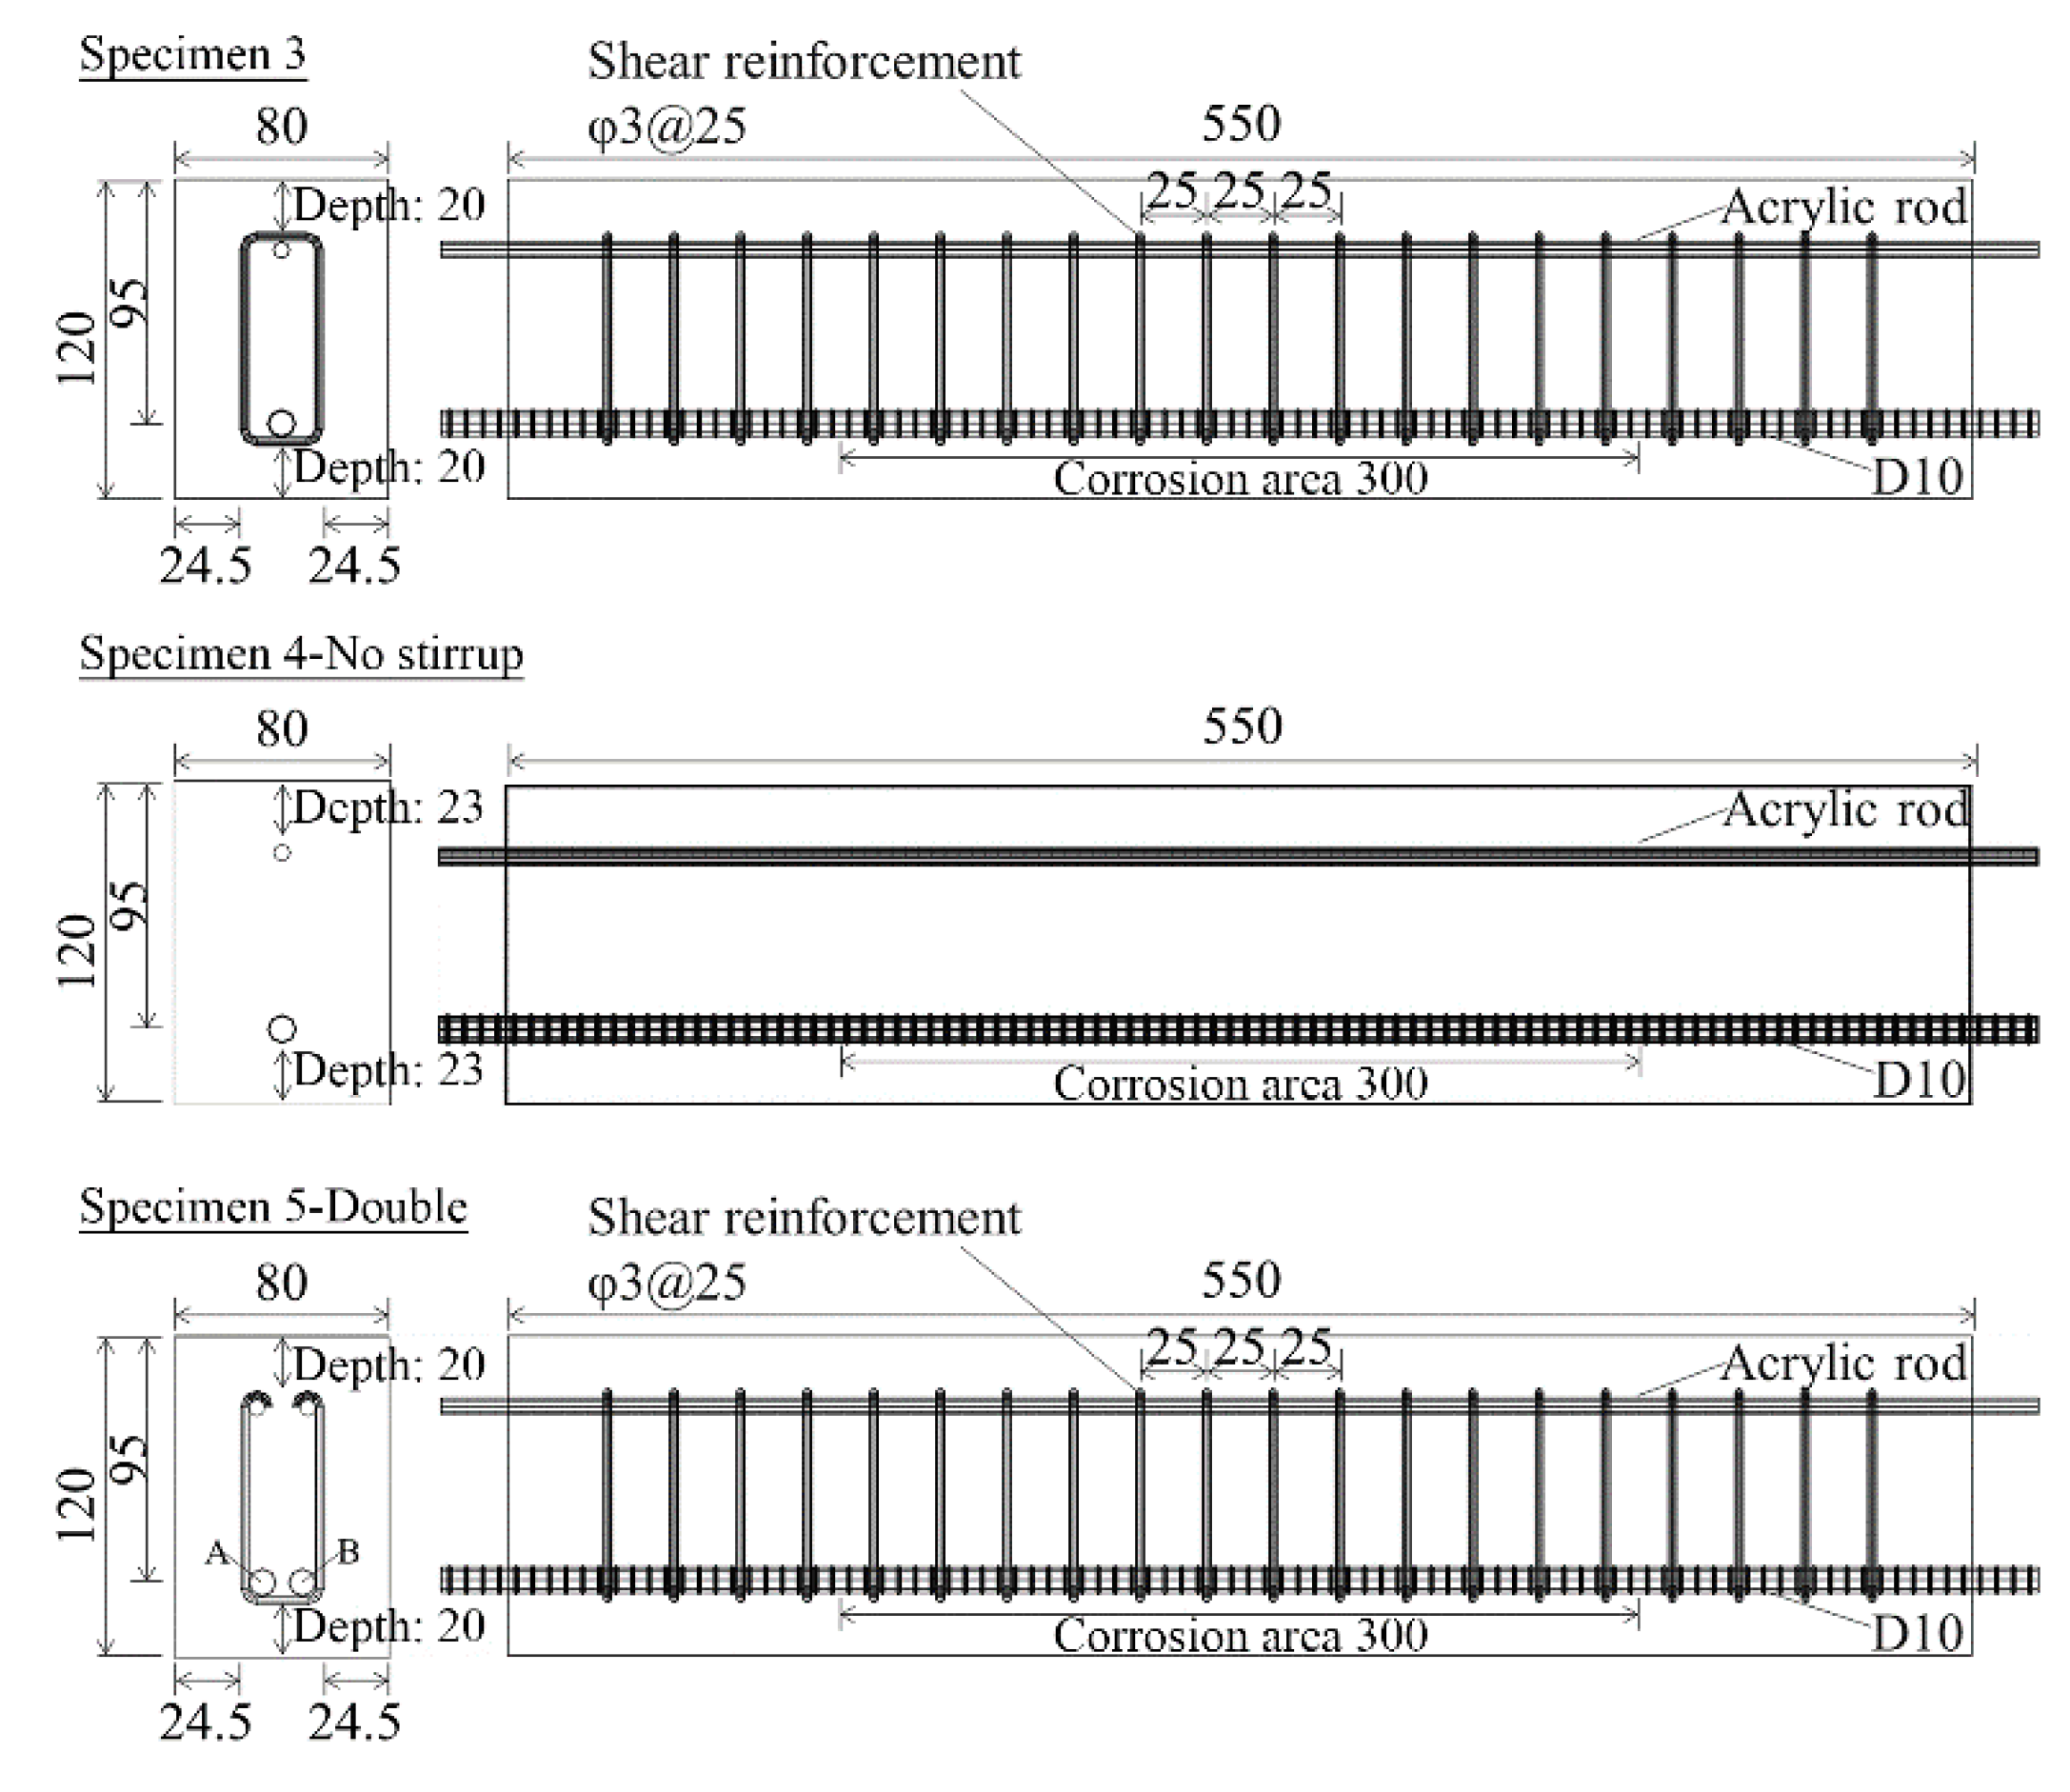
We investigated how the presence or absence of stirrups affect corrosive cracking using Specimens 3 and 4 with and without stirrups. These test specimens are shown schematically in Figure 8. A deformed reinforcing bar D10 (diameter: 10 mm) was placed in the lower part of the test specimen, whereas an acrylic bar was placed in the upper part. In the stirrup, a round reinforcing bar ϕ3 (diameter: 3 mm) was arranged at 25-mm pitches. The cover depth in this setup was 20 mm, whereas it was 23 mm in the absence of stirrups in Specimen 4. Note that the present study was a trial analysis preceding the experimental study in Section 4.
Accordingly, only the main reinforcement, and not the stirrup, was corroded in the experimental study because it was extremely difficult in practice to control the amount of corrosion of both the main reinforcement and the stirrup while the electrolytic corrosion was being performed. Thus, there was a large difference between the experimental conditions and the actual environment where the main reinforcing bar is generally corroded from the stirrup due to chloride ion penetration. The effect of corrosion of the stirrups and main reinforcing bar on the damage of covered concrete will be the subject of future study.
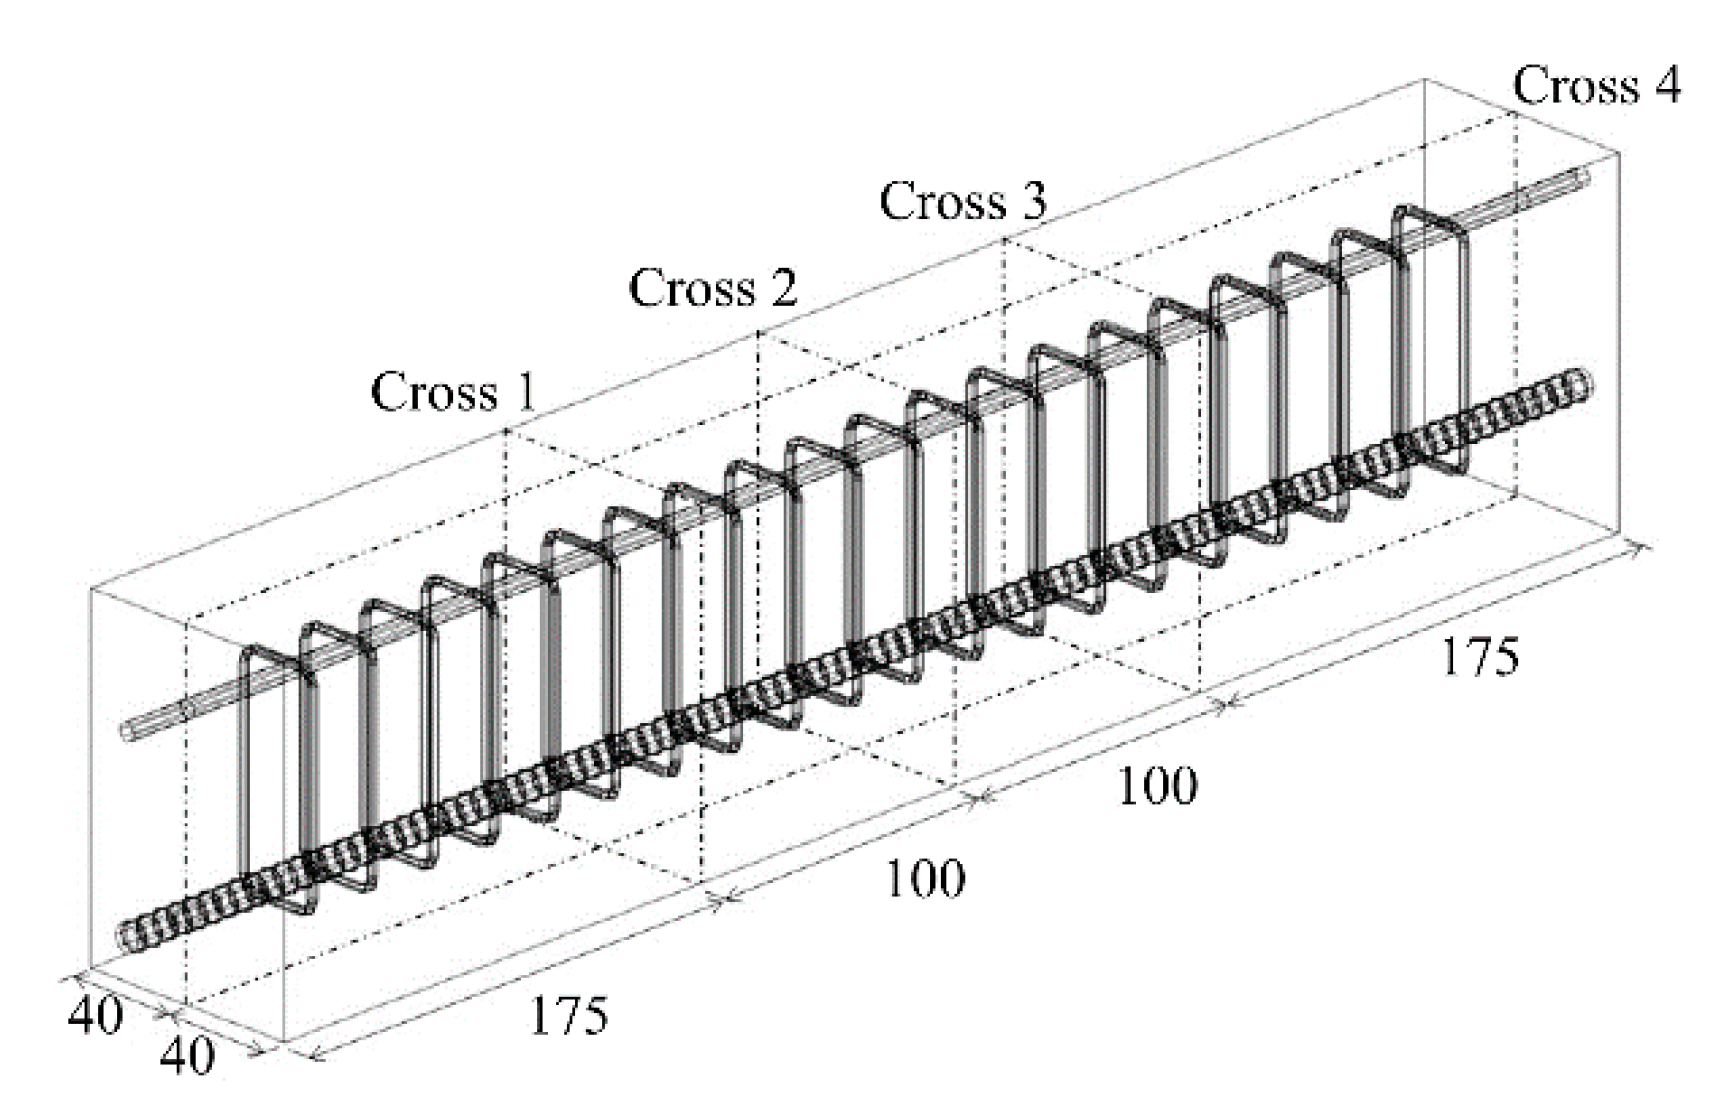
Figure 8 shows a 300-mm-long area in the center of the model surface of deformed bar D10. The corrosion expansion of the reinforcing bar was reproduced by applying an equal displacement in the normal direction and increasing the amount of displacement gradually in the same manner as was discussed in Section 3.2. Displacements equivalent to 0.001 mm per loading step were provided and loaded to the 200-loading step. Then, the width of the crack at the bottom of the beam was examined. Figure 9 shows the positions in Specimens 3, 4, and 5 of the cross-sections used to obtain the results. The parameters used in this analysis were the same as those used in the previous analysis.

3.3.2. Results: Effect of the Existence of Stirrups on the Width of Corrosion Cracks

Figure 10 and Figure 11 show the appearance of cracks on the cross-section of Specimens 3 and 4 for up to 200 steps. The crack in section 2 was confirmed to be larger (i.e., the center of the test body) than the cracks in sections 1 and 3. More specifically, the corrosive cracking was larger in section 2 than in the other two sections.
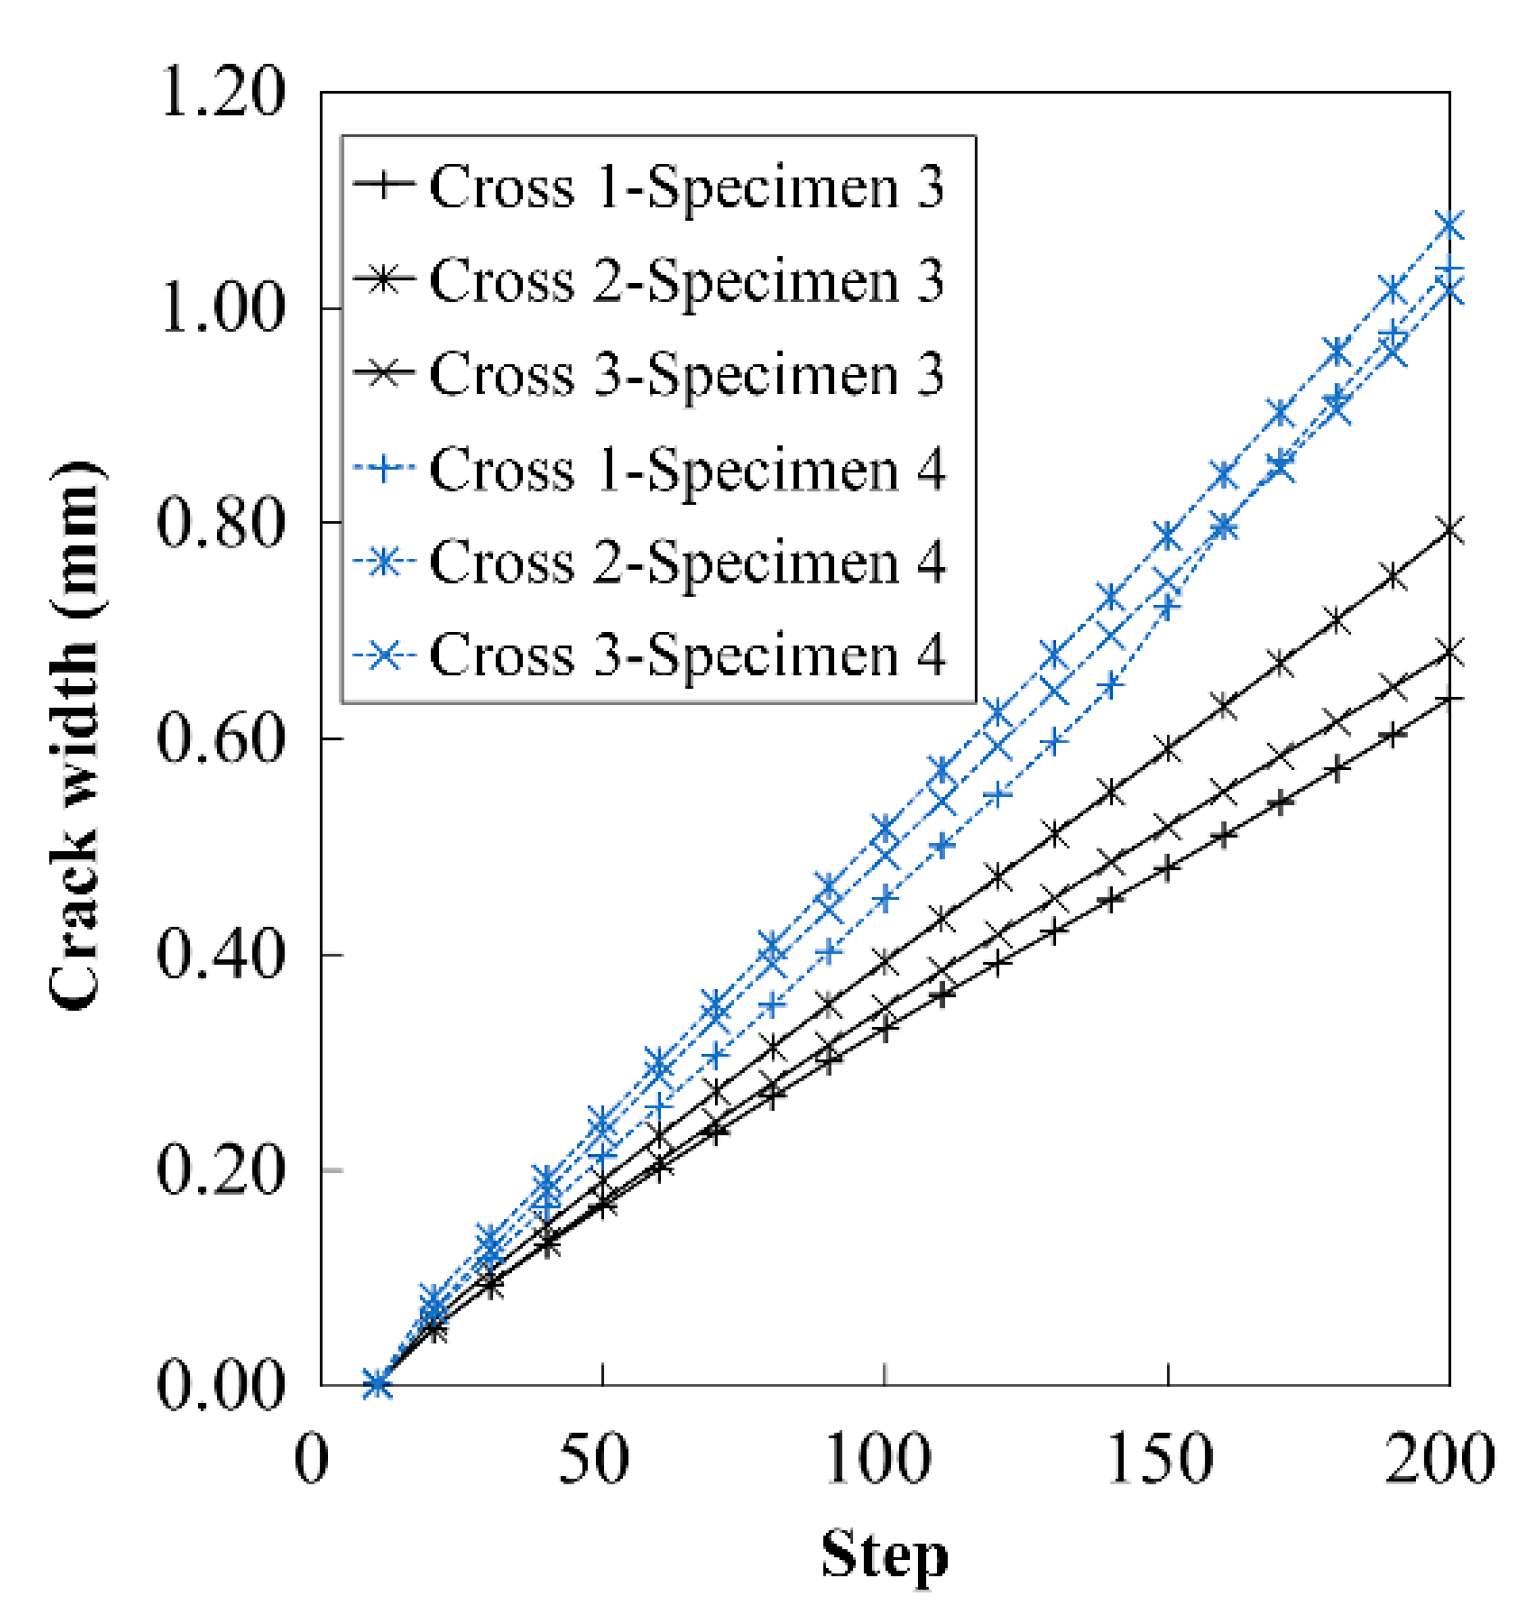
Figure 12 shows the crack widths of the element on the concrete cover surface at the intersecting line of the cross-section of sections 1–3, as well as that of section 4 at the bottom of the test specimen, as calculated from Equation (14). The results for Specimens 3 and 4 are indicated by solid and dashed lines, respectively. Regardless of the presence or absence of the stirrup, the cracks in section 2 at the center of the test piece were the widest. Moreover, a comparison of Figure 10 and Figure 11 confirmed that the range of damage in Specimen 4 (without stirrup) was larger than that in Specimen 3 (with stirrup). Subsequently, the setup of Specimen 3 was believed to restrain the corrosion expansion of the crack, as evidenced by the narrower cracks. These results confirm that the stirrup influences (i) the damage inside the concrete and (ii) the width of the cracks generated on the concrete surface.

3.3.3. Results: Effect of the Numbers of Main Reinforcement Bars on the Width of the Corrosion Cracks

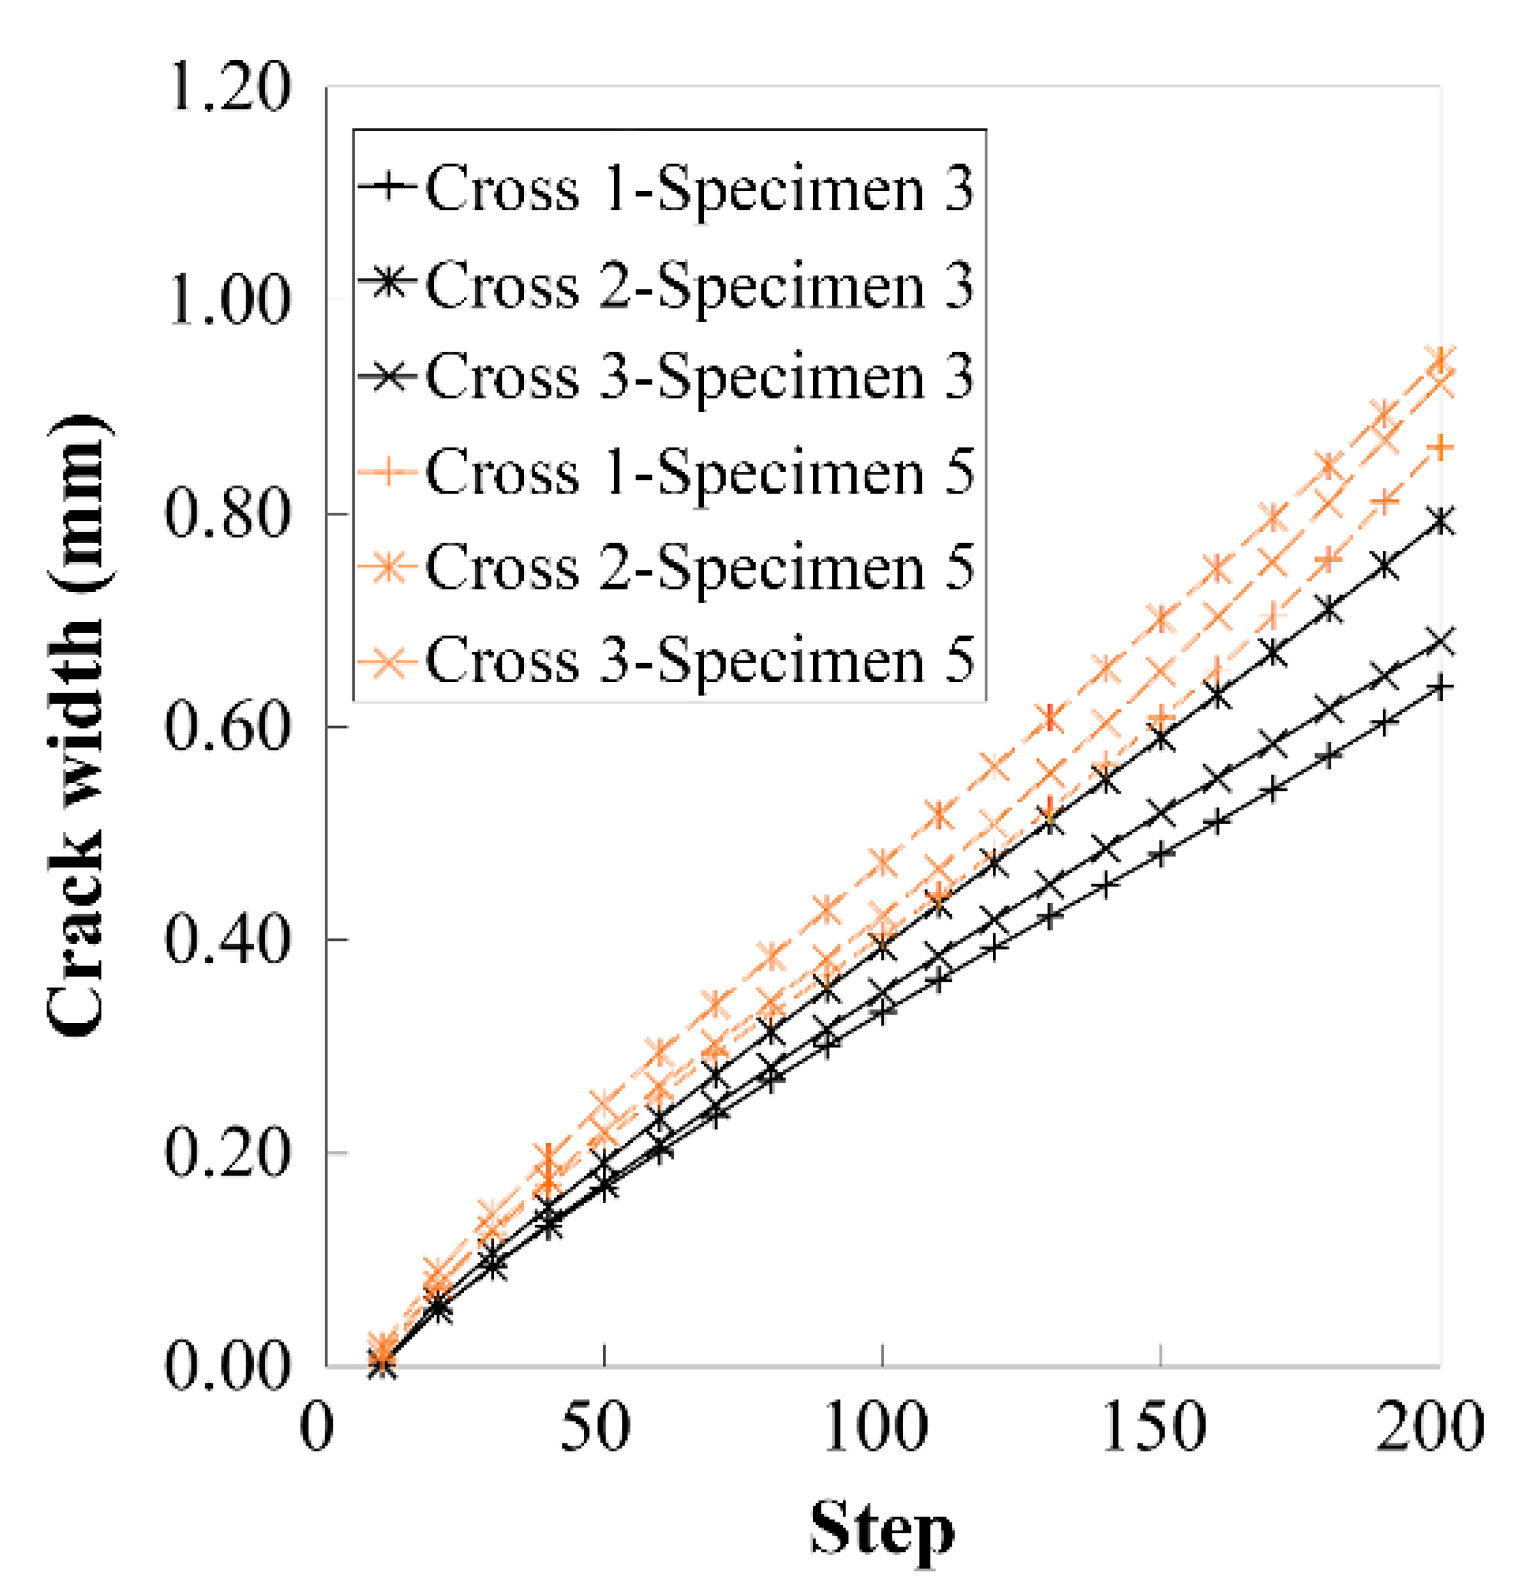
Models of Specimen 5 with two reinforcing bars arranged at the lower part were prepared to confirm how the number of reinforcing bars affects the width of cracks due to corrosion. Figure 8 shows the test specimen schematically. Next, the results for Specimen 3 were compared with those of Specimen 5. Figure 13 shows the damage distribution in the cross-section of Specimen 5, while Figure 14 shows the crack widths for Specimens 3 and 5. Note the larger range of damage for double reinforcement compared to that for single reinforcement, even though the two main reinforcements apparently underwent a displacement corresponding to the expansion. This implies that the nature and width of cracks caused by reinforcing bar corrosion are affected greatly by the presence or absence of stirrups and the arrangement of the main reinforcing bars.

4. Experimental Numerical Study of Corrosion Cracks and their Reproduction

4.1. Outline

An experiment was conducted to examine the extent to which the crack widths calculated in the analysis corresponded with the experimental results. In this Section, the results for the specimens presented in Section 3 confirmed that the reinforcing bar arrangement greatly influences the corrosive cracks and their widths. Consequently, Specimen 3 was examined with a relatively simple system with stirrups and a single reinforcing bar.

4.2. Specimen

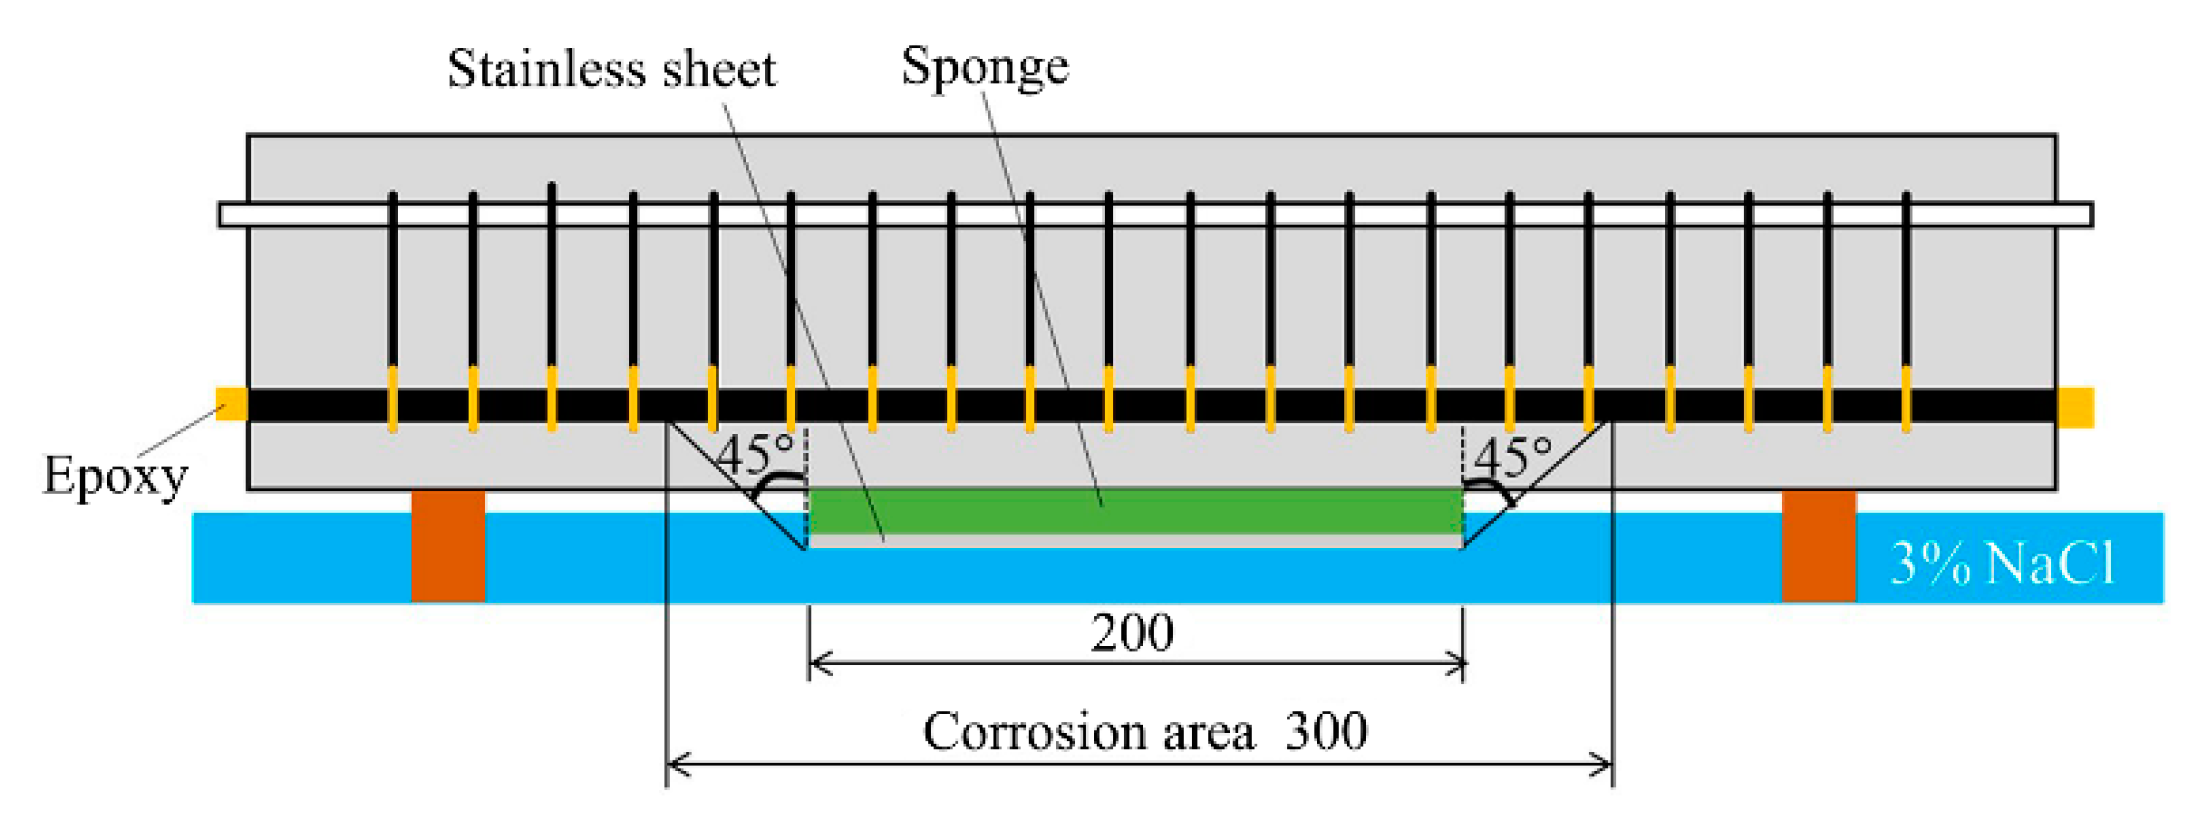
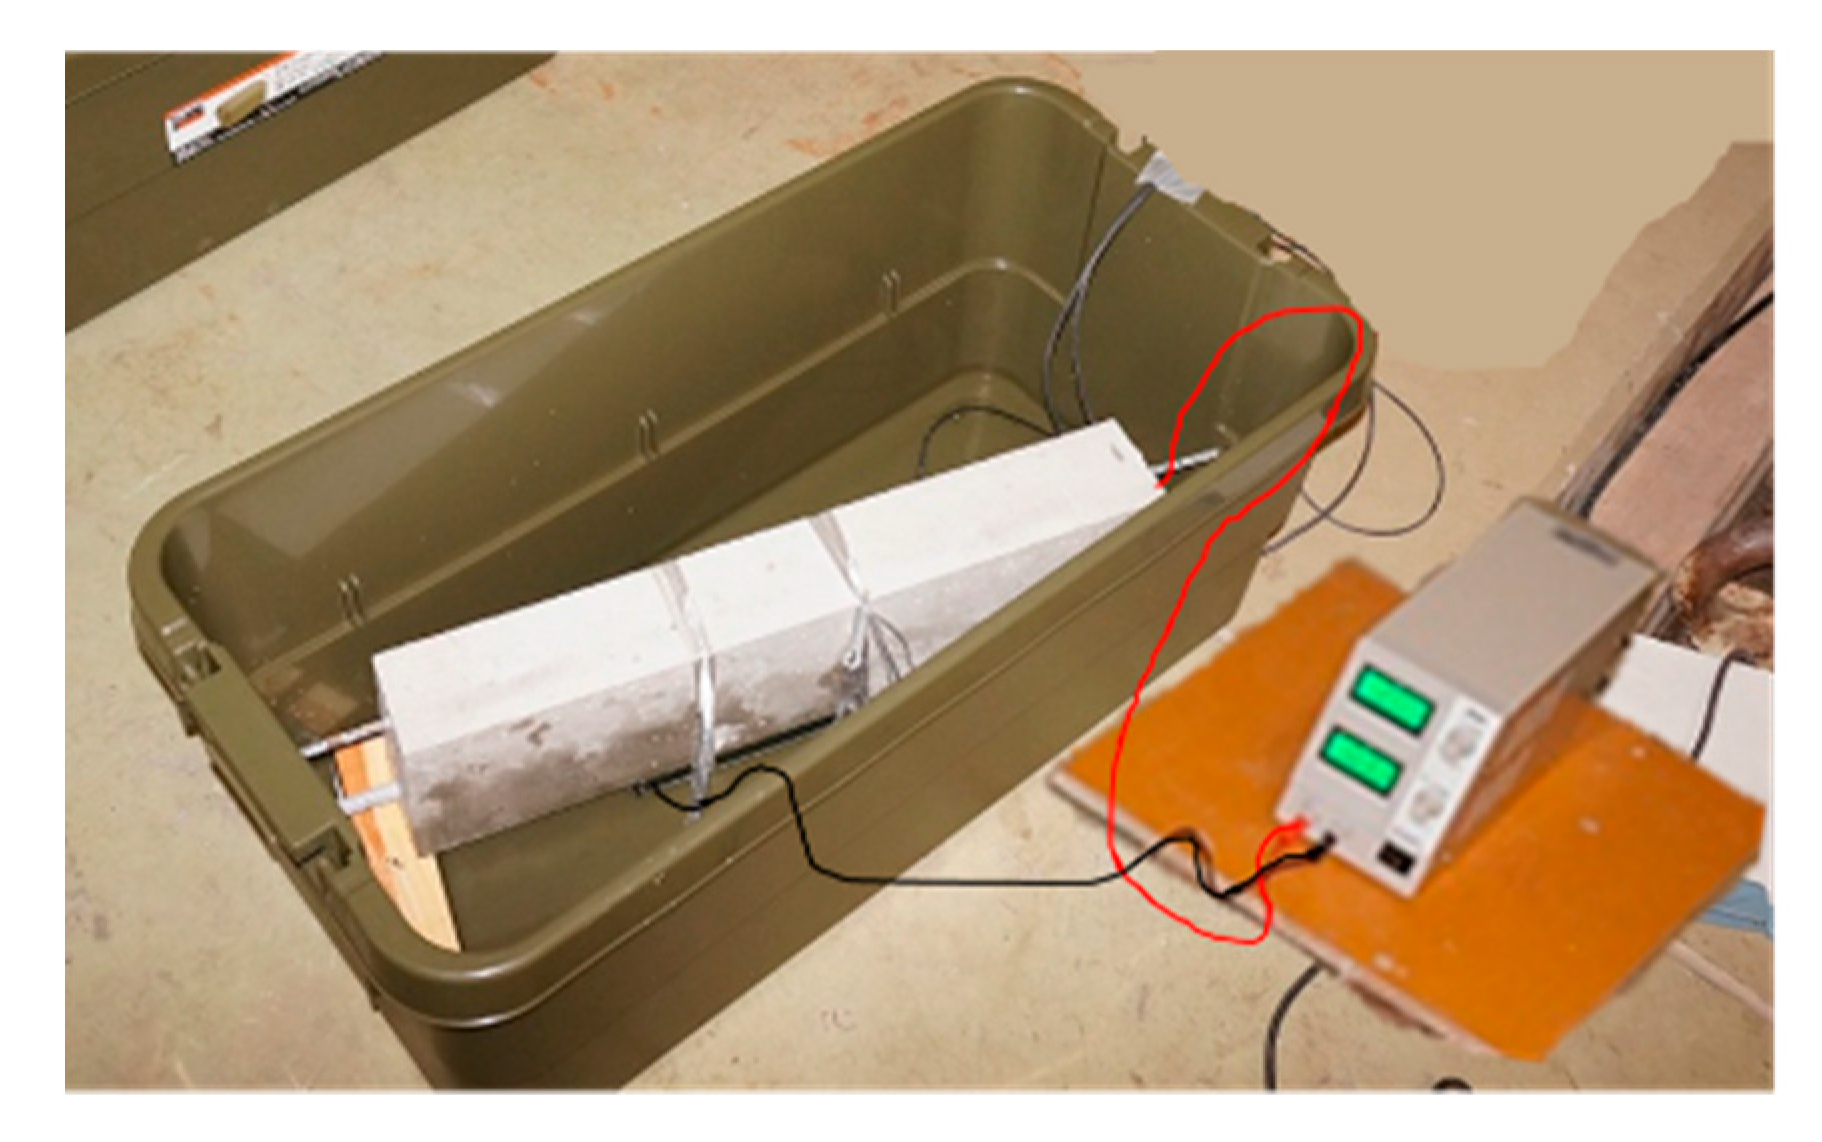
RC beam specimens with a 20-mm cover depth were fabricated to simulate Specimen 3 in Figure 8. The cover portion could have become markedly nonuniform because of the coarse aggregate in the cover portion when the concrete was applied, mainly because a region with a relatively sparse void structure, called a transition zone, forms around the coarse aggregate to cause uneven corrosion. Therefore, a test specimen using mortar was chosen. Ordinary Portland cement was used for the mortar, and crushed sand (surface dry density = 2.56 g/cm3; water absorption ratio = 1.96%; fineness modulus = 2.62) from the town of Saita in the Mitoyo district of the Kagawa prefecture of Japan was used as the fine aggregate. The water to cement ratio of mortar was 70%. The specimens were demolded immediately after being allowed to stand for 24 h and were then kept wet for 28 d under a wet cloth. Next, tests were conducted, as outlined in Figure 15, to generate early reinforcement electrolytic corrosion. A photograph of the actual test setup is shown in Figure 16.
A stainless-steel plate (80 mm × 200 mm × 0.3 mm) was installed in the center of the bottom of the test piece, and a porous water-absorbing foam (80 mm × 20 mmm × 200 mm, length × width × height) was sandwiched between it and the test piece, followed by a large plastic tray filled with a 3% aqueous sodium chloride solution. The fulcrum of the test piece was then provided at a position where half of the sponge installed in the bottom of the piece was immersed. A direct current stabilized power supply was prepared, and the anode of the apparatus and the reinforcing bar, as well as the cathode and the stainless-steel plate installed at the bottom of the test piece, were connected by a lead wire. Following the connection, a 100-mA steady-state current was applied to initiate corrosion, and anodic reactions were generated in the reinforcing bars to corrode the structures. To prevent the stirrup from electrolytic corrosion, as illustrated in Figure 15, only the main reinforcement in the 300-mm section of the center of the test specimen was corroded by applying epoxy resin on the stirrup around the main reinforcement, followed by electric insulation of the resin. Ten cases with different current application times were set up, and each specimen was subjected to electrical corrosion at a set time. Electrolytic corrosion was performed for 48 h in Cases 1–3, 161 h in Cases 4 and 5, 355 h in Cases 6 and 7, and 403 h in Cases 8–10. After the electrolytic corrosion test, the width of the corrosion cracks on the test specimens was measured by a crack width ruler. After measuring the crack width, the corroded reinforcing bars were collected from the test specimens and cut by electric cutters to divide the 300-mm section corroded by the reinforcement into three sections, each approximately 100 mm in length.
Figure 17 shows the positions and numbers of collected and cut bars. To measure the loss on the cut bars due to corrosion, they were immersed in a 10% aqueous ammonium hydrogen citrate solution for 24 h at 60 °C, mainly to remove the corrosion products, after which the mass and length of each bar were measured. The corrosion amount Wr [mg/cm2] per unit area was calculated from (i) the difference between the mass W0 [mg] of the healthy reinforcing bar before the electric corrosion experiment and the mass W [mg] after rusting, divided by (ii) the product of the length L [cm] and nominal circumference φ [cm] of the cut reinforcing bar, namely
W r = W 0 W L φ .
Table 1 indicates the amount of corrosion for each reinforcing bar position. Note that the corrosion amount Wr does not necessarily increase with the case number or the electrolytic corrosion time.

4.3. Results for Crack Width due to Corrosion

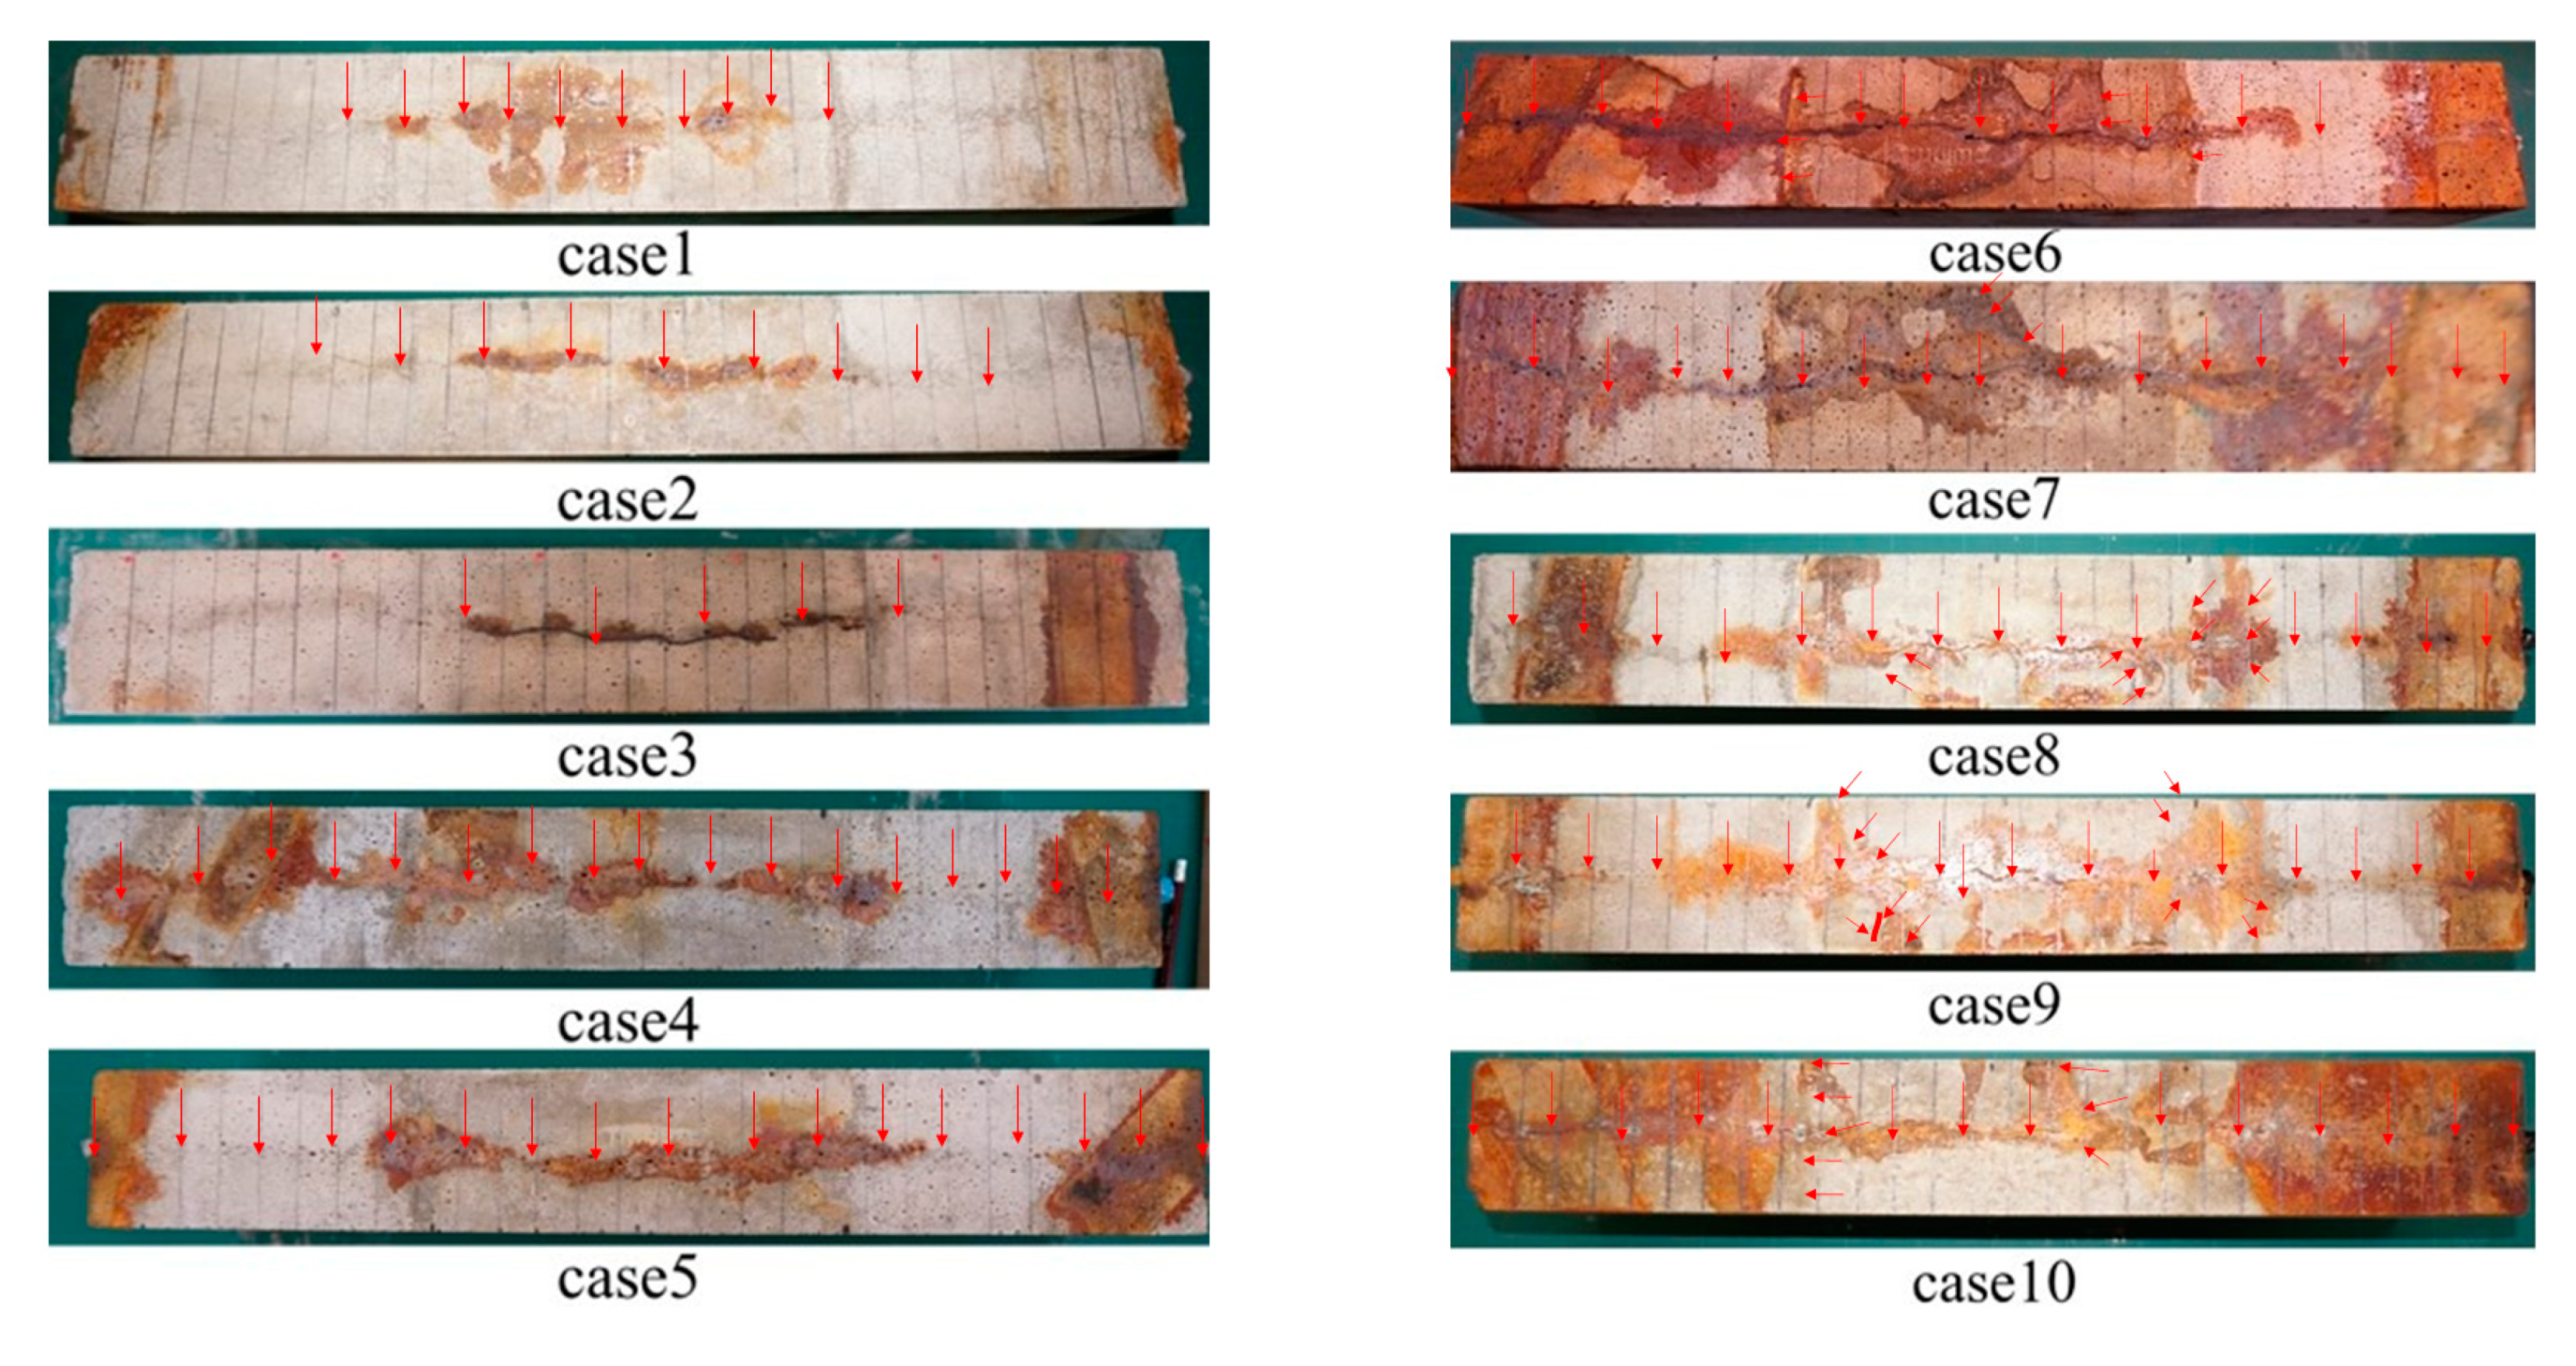
Photographs of the bottom of the tested specimens after the electrolytic corrosion test are shown in Figure 18. For each specimen, the rust fluid produced in the test adhered to the bottom surface, and corrosion cracks formed along the main reinforcing bar. Additionally, the outflow of the rust fluid adhering to the bottom increased with a longer energization time, and the corrosion cracks became wide enough to be confirmed by the naked eye. In Case 6, the outer boundary of the portion where the rust fluid adhered to the bottom surface had cracks occurring perpendicular to the axes of the main reinforcing bars, aside from those along the main reinforcing bars (Figure 18). Thus, both the numerical method and the corrosive expansion models adopted in the present study were found to be mostly valid.

4.4. Comparison of Experimental and Numerical Results

The experimental results indicate that the amount of reinforcing bar corrosion is correlated significantly with the crack width. In contrast, the relationship between the corrosion expansion displacement and the crack width of the reinforcing bars obtained from the numerical results could not be validated. Therefore, a model that describes the latter relationship is required. According to previous studies [31,32,33], the amount of corrosion per unit of reinforcing bar length is expressed as
W r = C ρ U n 1 ,
where Wr [mg/cm2] is the amount of reinforcing bar corrosion, ρ [7850 mg/cm3] is the density of iron, U [cm] is the radial displacement applied to the reinforcing bar, n is the volume expansion coefficient of the corrosion products, and C accounts for the runoff of the corrosion products. Using the results of various sensitivity analyses giving the experimental results considered external runoff of corrosion products in electrolytic tests [34], we arrived at C = 0.8.
This model required us to set the volume expansion coefficient of corrosion products on the reinforcing bar corrosion products. Nishizawa et al. [30] asserted that (i) this volume expansion coefficient is in the range of 1.8–4.8 and (ii) the chemical composition and volume expansion coefficient of the corrosion products can be large depending on the corrosion environment of iron. Suzuki et al. [35] performed X-ray diffraction on corrosion products extracted from electrolytic corroded RC members and found that the precipitation of magnetite (Fe3O4) with a volume expansion coefficient of 2.1 was predominant. Because electric corrosion was also performed in the present experiment, this result was used to convert the volume expansion displacement into the amount of reinforcing bar corrosion.
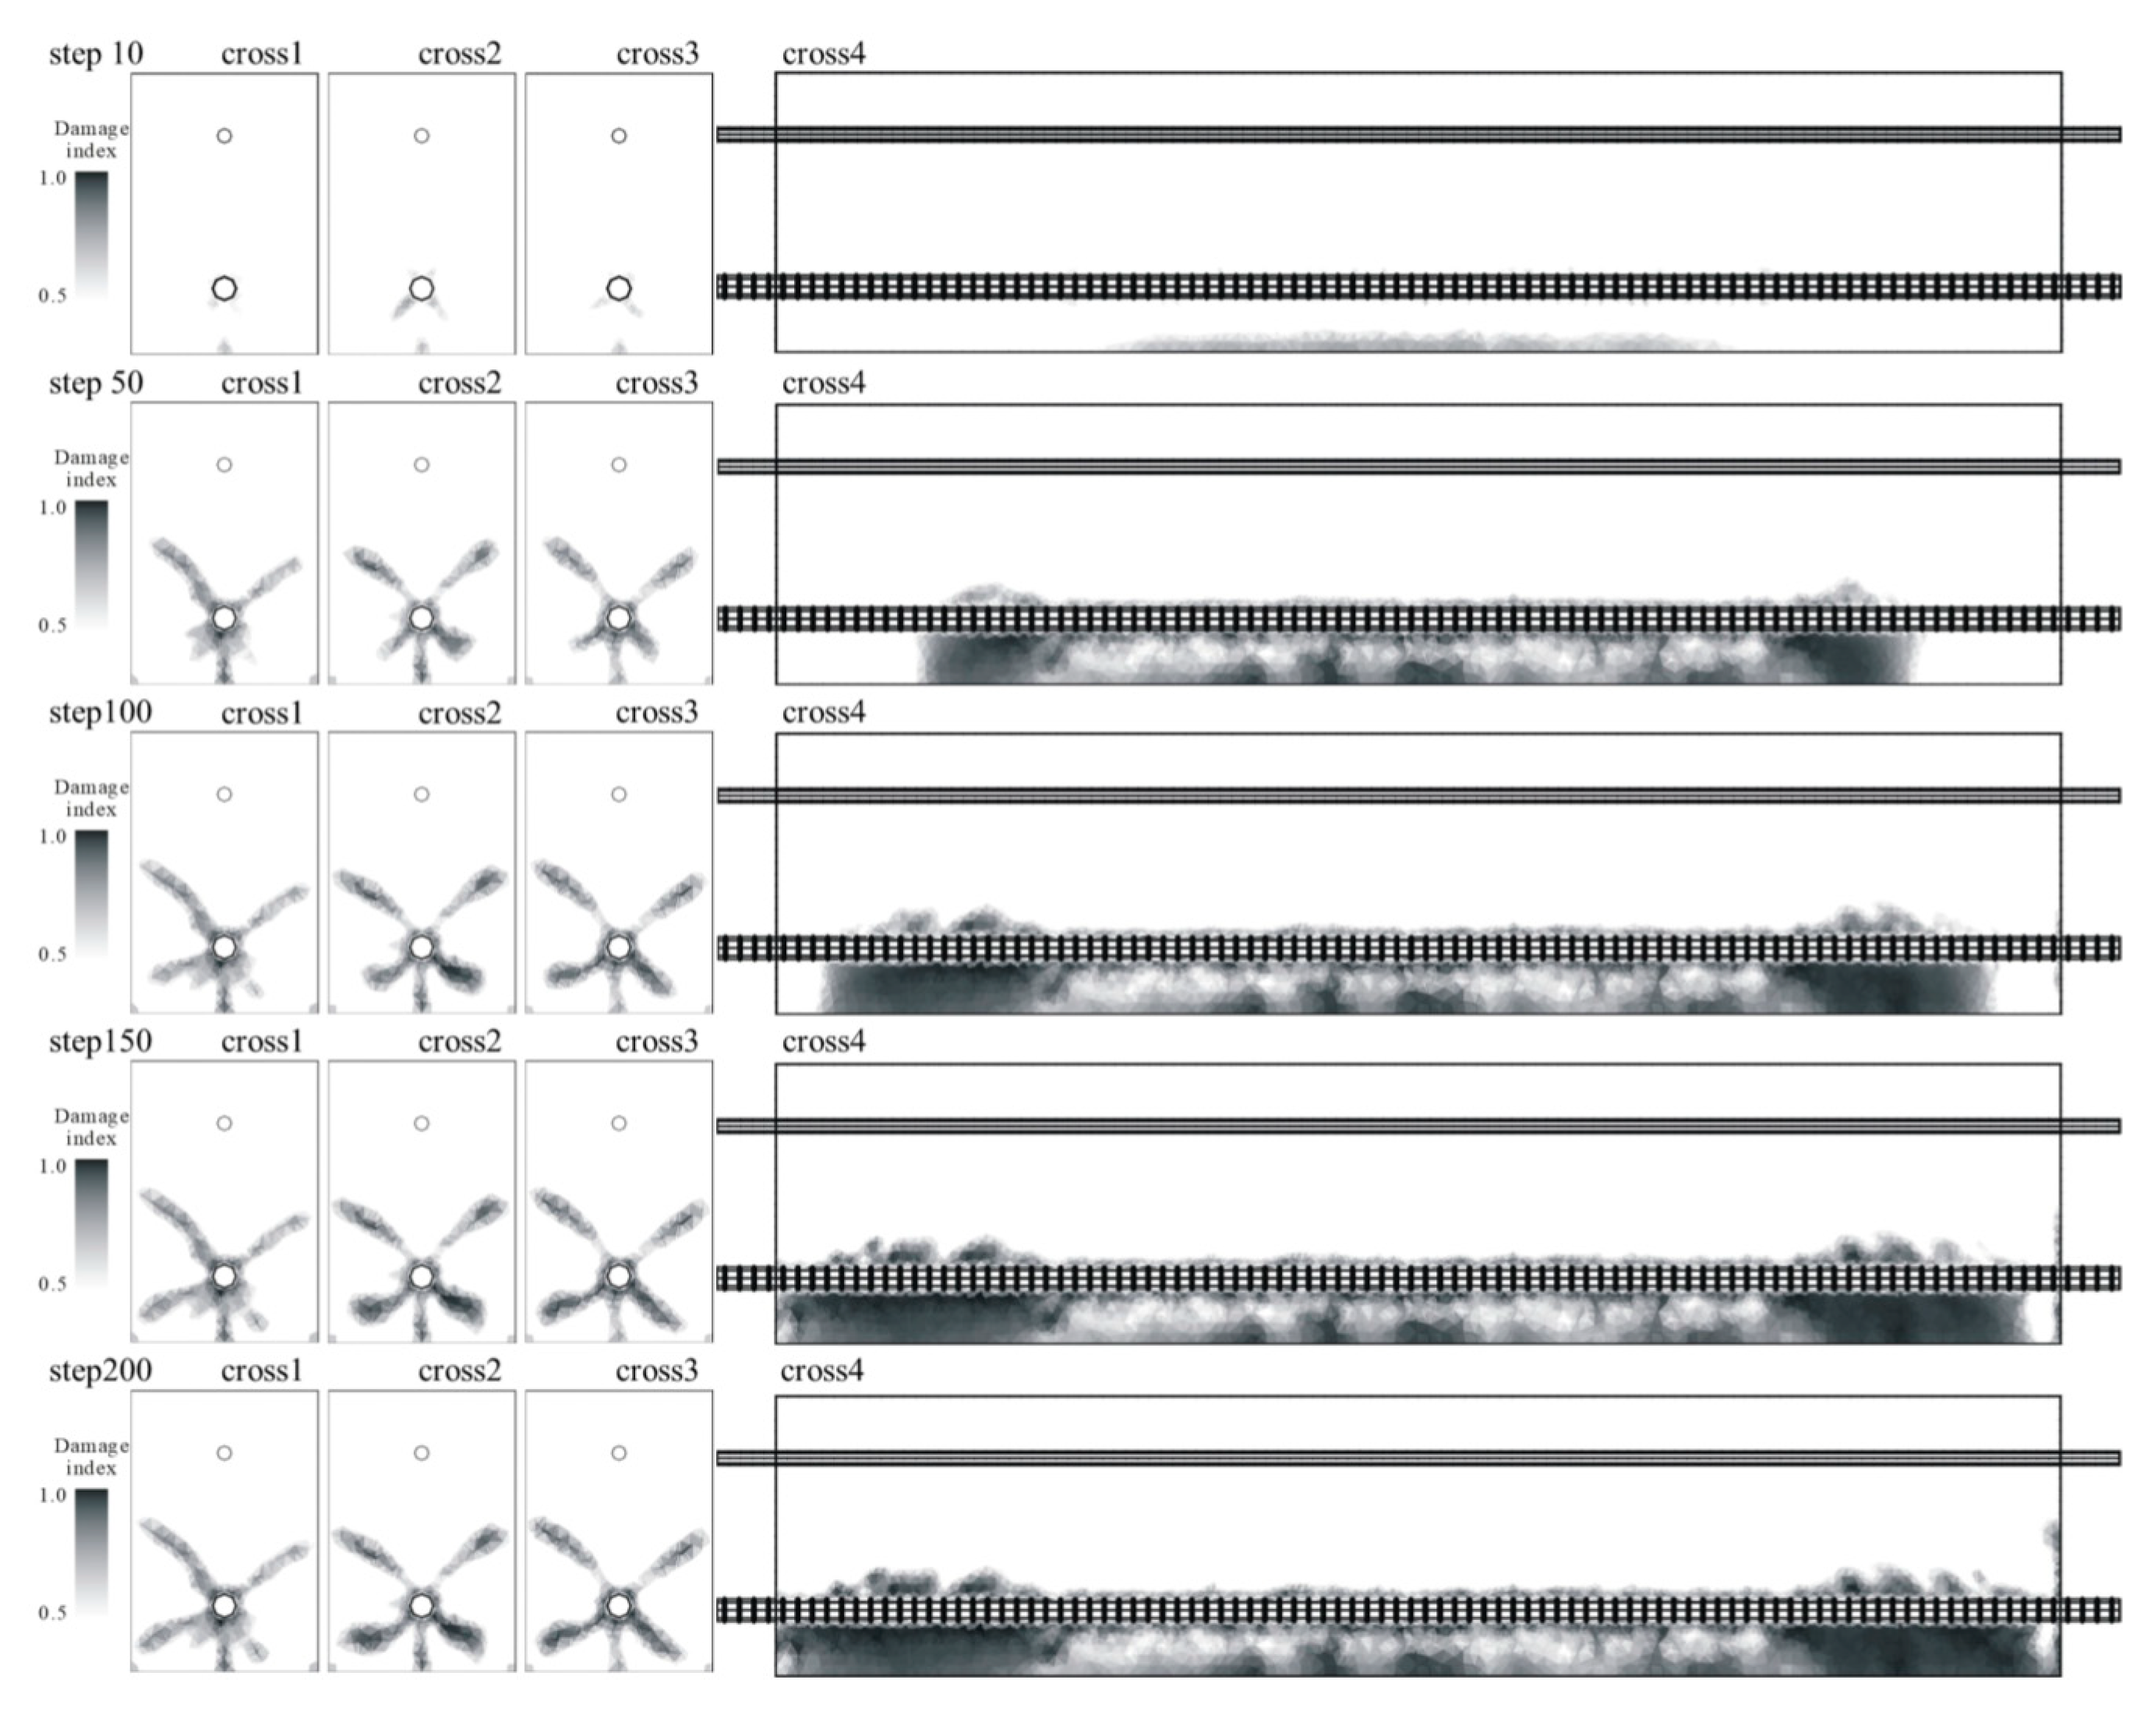
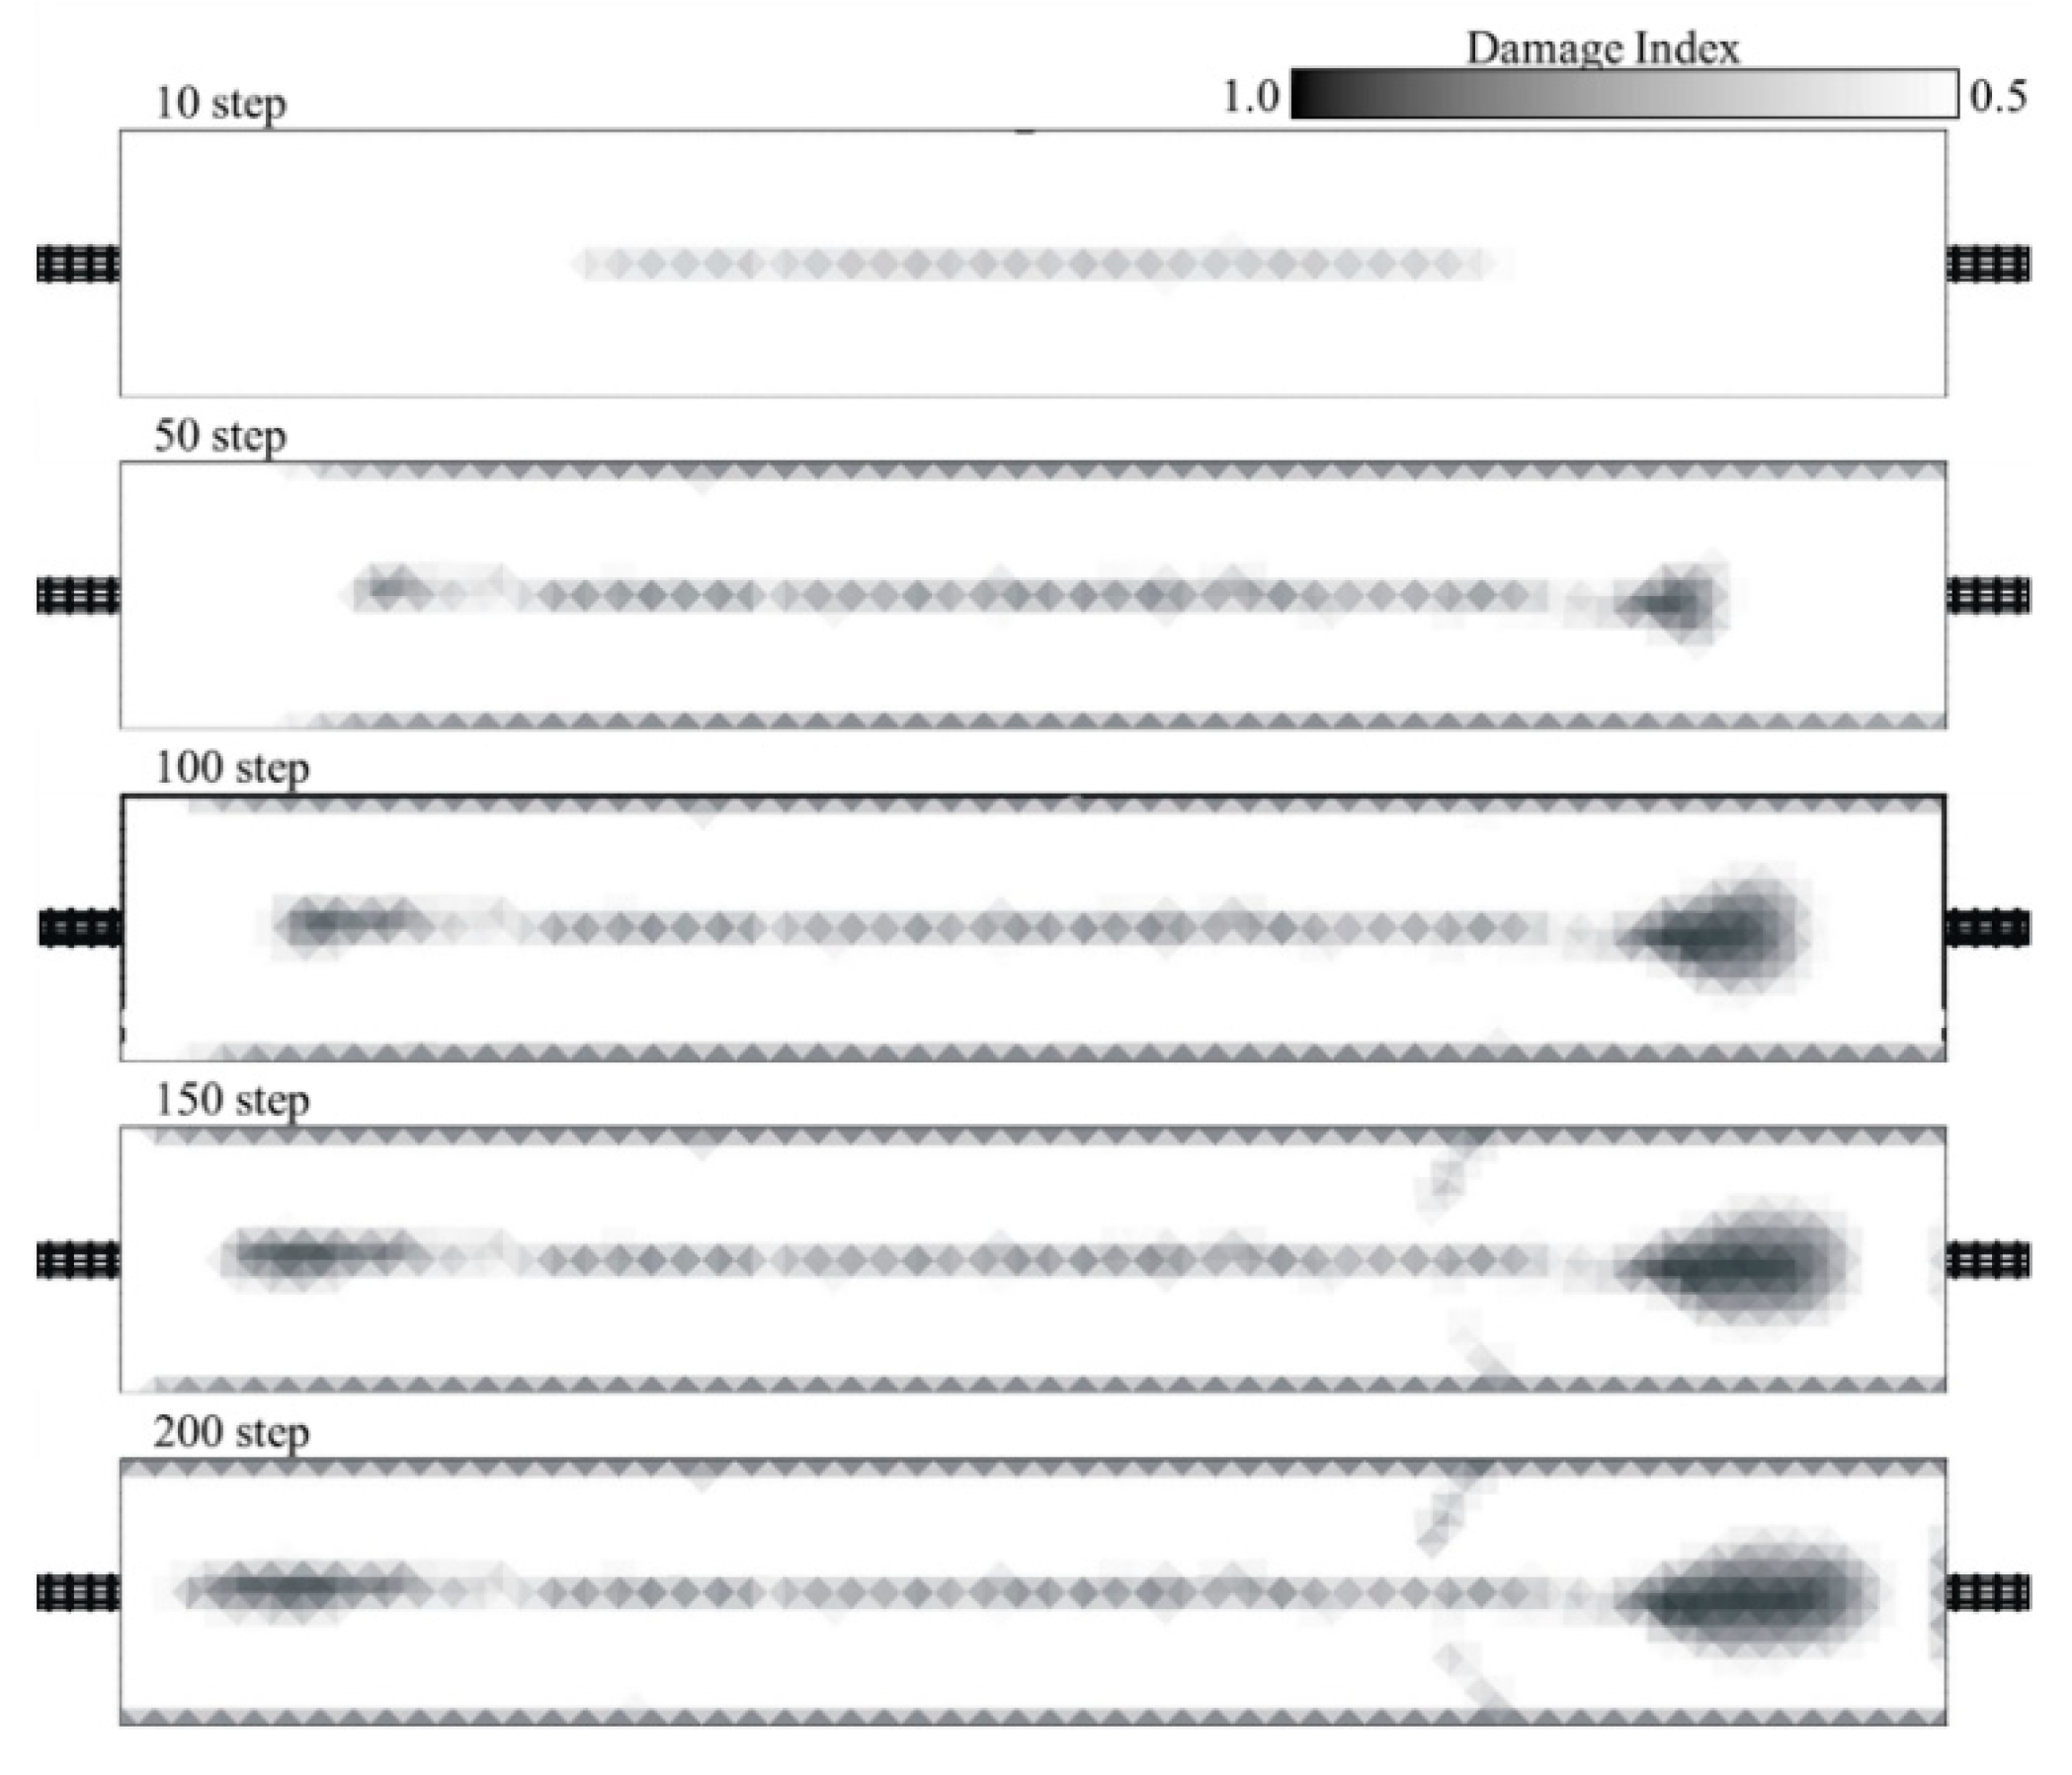
First, we compared the crack distribution on the bottom of the specimens after the experiment with the simulated results. Figure 19 shows the damage distribution on the bottom of Specimen 3. In terms of the amount of corrosion on the reinforcing bar, step 10 corresponds to Cases 1–3 in Figure 17, step 50 to Cases 4 and 5, step 150 to Case 6 and 7, and step 200 to Case 8–10. With the increase in the amount of reinforcing bar corrosion, cracks were generated along the axial direction. Furthermore, the cracks at right angles to the axial direction were generally reproduced experimentally, as well as the increase in damage. In addition, the tendency of cracking perpendicular to the axis was mostly reproduced.
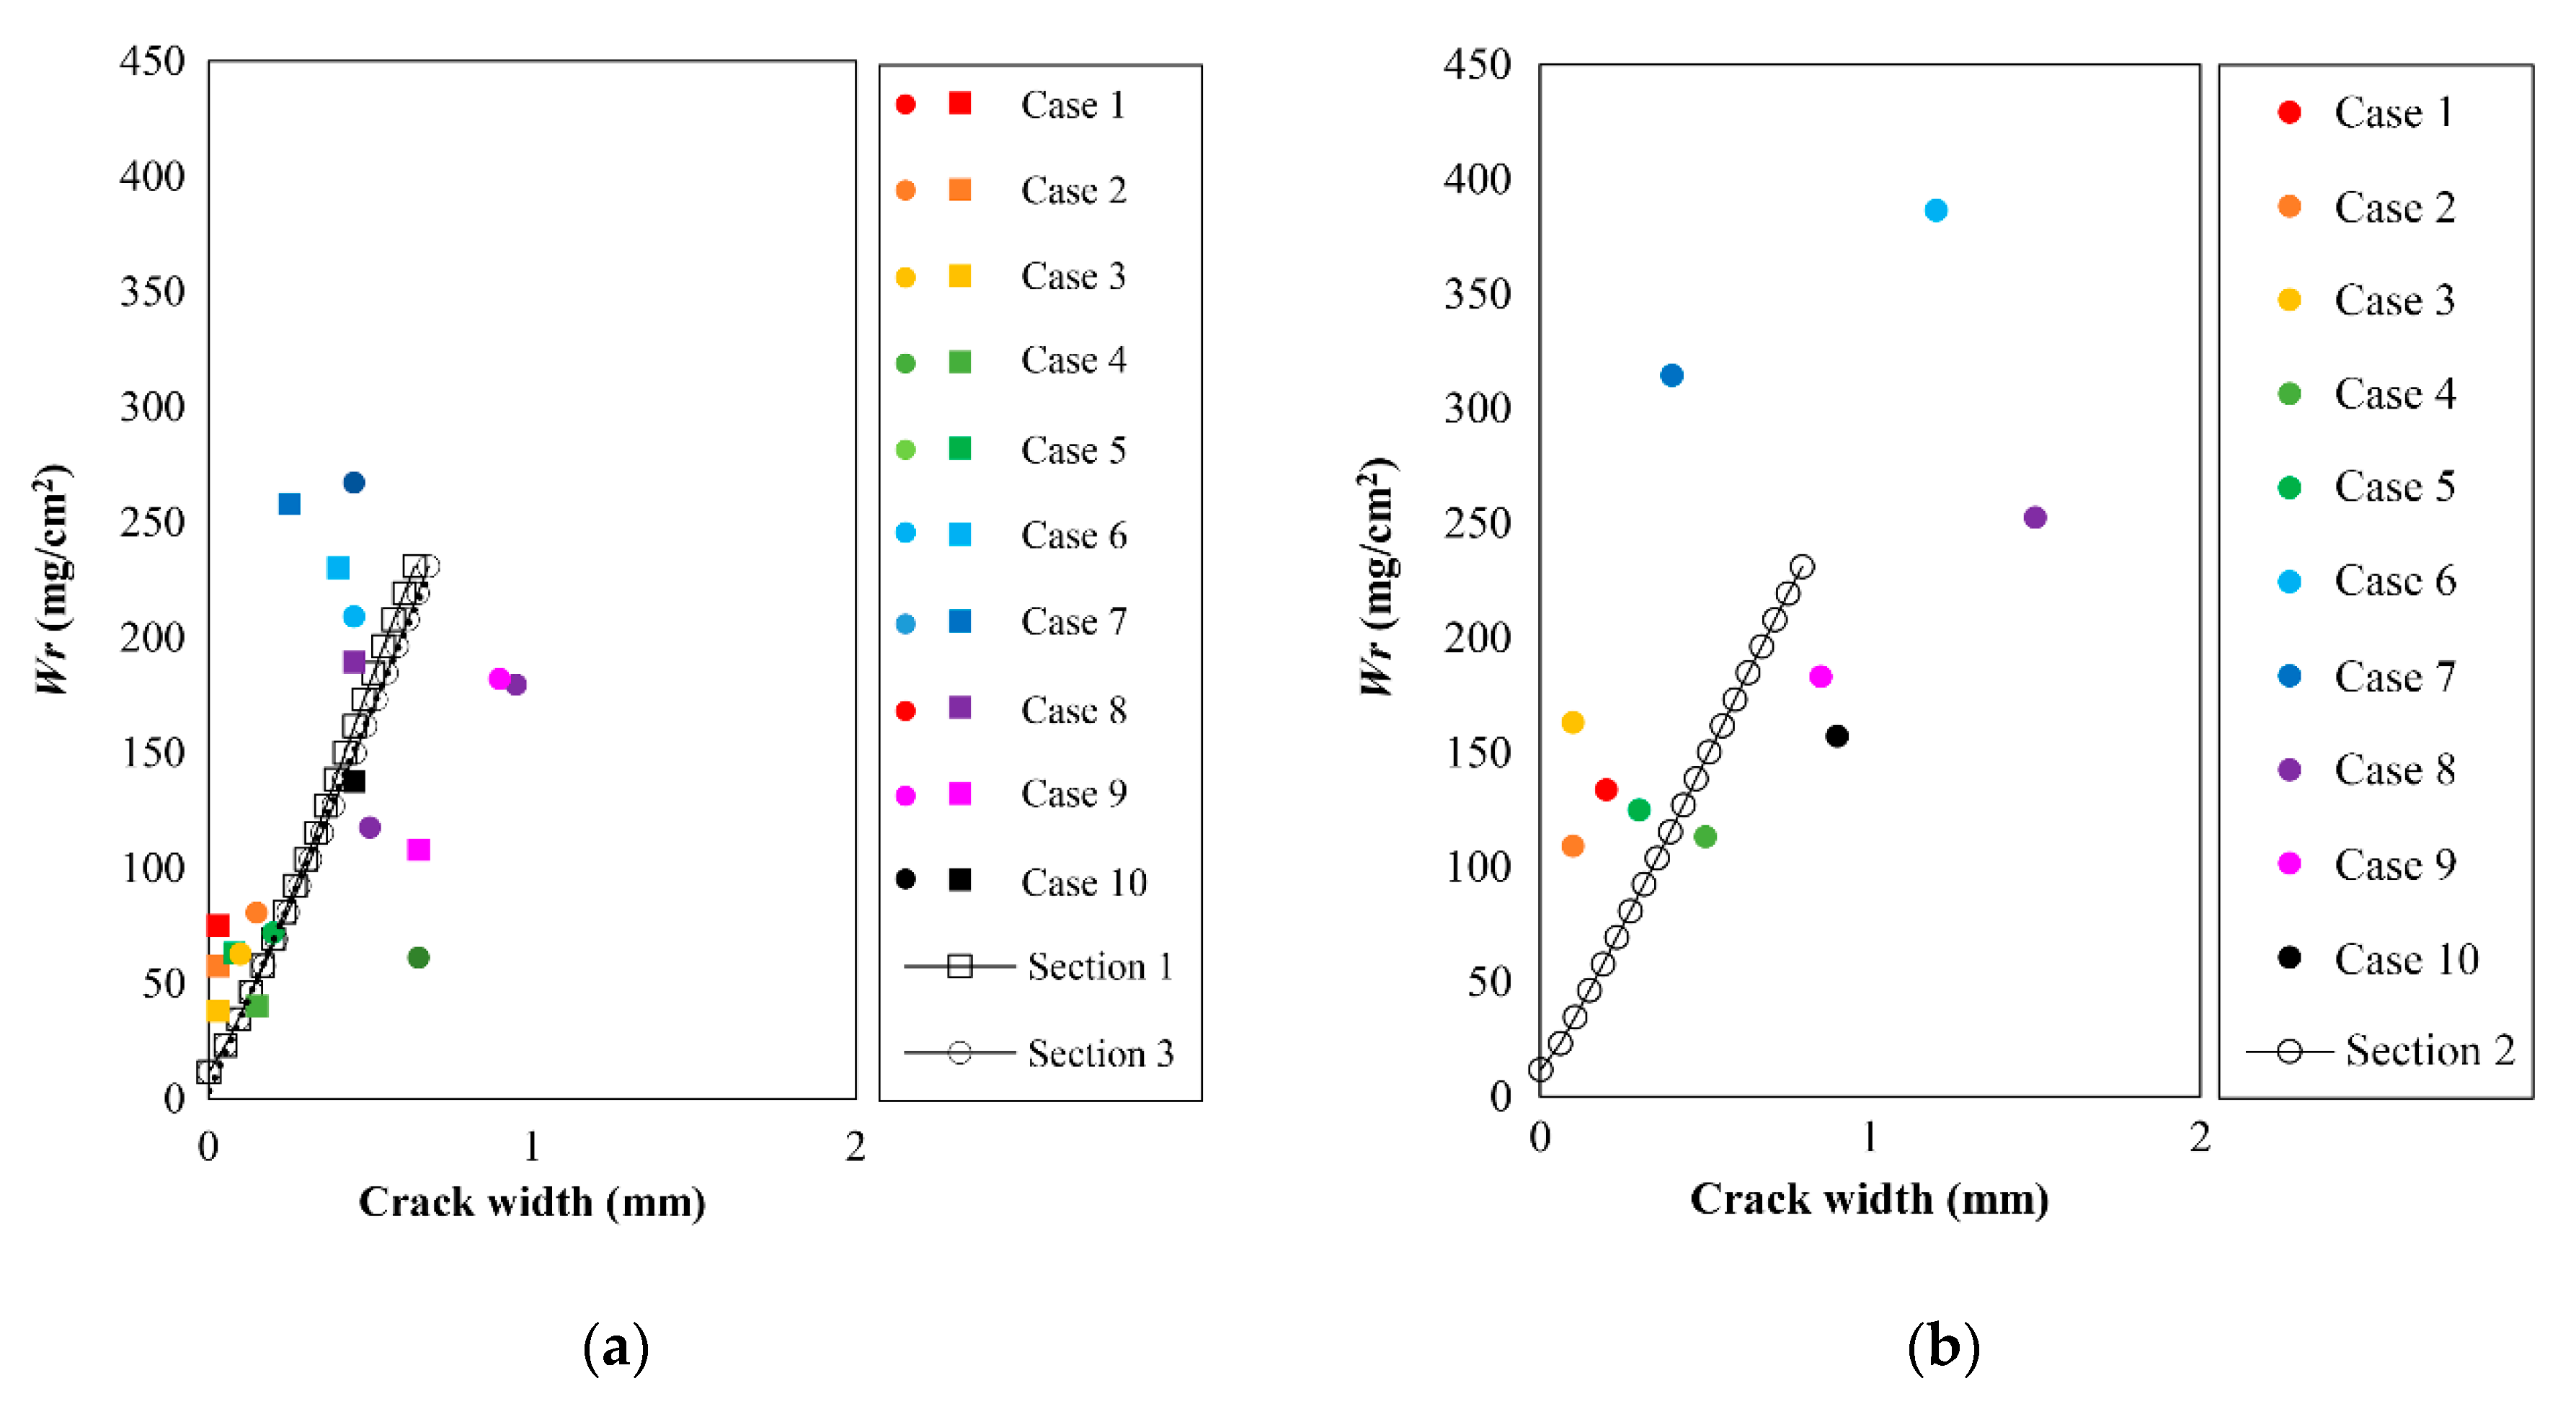
Figure 20a compares the experimental results for cross-sections ① and ③ in Figure 17 and the numerical results for sections 1 and 3 with respect to the amounts of corrosion. Similarly, Figure 20b compares the experimental results for ② with the numerical results for section 4.2. We used the maximum crack widths of the mortar bottoms at positions ① and ③. First, confirming the experimental results, the crack width tended to increase with the amount of corrosion in any cross-section, although the variation was large. The experimental and numerical values in Figure 20a,b show that for a given crack width, the amount of corrosion shown by the latter was underestimated compared with the former.
This point is elaborated as follows. In each case, the electrolytic corrosion test confirmed the continuous contact of the corrosion products with salt water that flowed out of the test piece through the porous sponges. The corrosion products probably did not contribute to the damage to the concrete, thus having little effect on the crack width of the covered concrete with respect to the actual amount of corrosion. The large deviation from the numerical values for Cases 6 and 7 confirms that a considerable amount of corrosion products flowed out, hence the presumption of a small crack width with respect to the amount of corrosion. Except for Cases 6 and 7 in which corrosion product runoff was a common phenomenon, the numerical values in Figure 20a,b were roughly near the lower limit of the plot of experimental values; this result indicates that there is a risk of underestimating the actual amount of corrosion when judging the amount of corrosion on the rebar from the crack width of the numerical results. On this basis, it appears that there would be a slight problem if the numerical result is used immediately for practical use. Thus, it is necessary to correct the numerical result by measuring the amount of corrosion products flowing out at the time of corrosion and calculating the net amount of reinforcement corrosion products that contributed to the occurrence of cracks. Taking this effect into consideration will clarify the relationship between the amount of reinforcing bar corrosion with various reinforcing bar arrangements and the crack width for this model. Moreover, a scheme could be constructed so that the amount of reinforcing bar corrosion immediately below the cover concrete can be estimated from the crack width of the RC cover surface.

5. Conclusions

A finite-element scheme based on a damage model of fracture mechanics was used to simulate the development of cracks in RC beams due to corrosion expansion. The results were used to investigate how the corrosion expansion of reinforcing bars affect the crack width. The following generalizations can be made.
The shape of the reinforcing bar has a significant effect on the crack width of the concrete surface by corrosion expansion. With deformed reinforcement, the spread of damage from the nodes by corrosion expansion was confirmed. Additionally, for a given amount of corrosion expansion, the cracks that developed with the round steel reinforcement were slightly wider than those in the deformed one.
The presence of stirrups and the number of main reinforcing bars affect the crack width of the concrete surface due to corrosion expansion of the main reinforcing bars. The damage range inside the concrete and for the crack width of the concrete surface to be suppressed were determined by the stirrups’ arrangement. In addition, the crack width in the main reinforcement direction was the same with both one and two main reinforcing bars, although the cracks were wider in the second case.
A small RC beam specimen was fabricated to simulate the specimen used in the numerical analysis, and the relationship between the amount of reinforcing bar corrosion and the crack width was obtained through an electrolytic corrosion experiment. The experimental results were used to validate the numerical values. For the relationship between the crack width and the amount of corrosion, the amount of corrosion determined by numerical values was slightly underestimated for a given crack width because of the presumed outflow of corrosion products during the electrolytic corrosion test. When this premise is considered in general, the numerical values are considered to reproduce the experimental values.

Author Contributions

Conceptualization, S.O., M.K., and M.M.; methodology, S.O., M.K., and H.Y.; validation, S.O. and C.O.; formal analysis, S.O., C.O., and M.K.; investigation, S.O. and C.O.; resources, S.O., C.O., H.Y., and M.M.; data curation, C.O.; writing—original draft preparation, S.O. and C.O.; writing—review and editing, S.O.; visualization, C.O.; supervision, M.M.; project administration, S.O.; funding acquisition, S.O. and M.M.; All authors have read and agreed to the published version of the manuscript.

Funding

This research was supported by JSPS KAKENHI Grant Numbers JP 19K04554 and Ministry of Land, Infrastructure, Transport and Tourism, Construction Technology Research and Development Grant Program (CRD).

Conflicts of Interest

The authors declare no conflict of interest.

References

  1. Ministry of Land, Infrastructure, Transport and Tourism. White Paper on Land, Infrastructure, Transport and Tourism in Japan; Ministry of Land, Infrastructure, Transport and Tourism: Japan, Tokyo, 2019; pp. 110–112.
  2. Castro, P.; Véleva, L.; Balancán, M. Corrosion of reinforced concrete in a tropical marine environment and in accelerated tests. Constr. Build. Mater. 1997, 11, 75–81. [Google Scholar] [CrossRef]
  3. Santhanam, M.; Otieno, M. Deterioration of concrete in the marine environment. In Marine Concrete Structures; Woodhead Publishing: Cambridge, UK, 2016; pp. 137–149. [Google Scholar]
  4. Ueli, M. Angst Durable concrete structures: Cracks & corrosion and corrosion & cracks. In Proceedings of the 10th International Conference on Fracture Mechanics of Concrete and Concrete Structures, Bayonne, France, 23–26 June 2019; pp. 1–10. [Google Scholar]
  5. Bossio, A.; Bellucci, F. Environmental degradation of reinforced concrete structures. Corros. Rev. 2019, 37, 1–2. [Google Scholar] [CrossRef]
  6. Marcotte, T.D.; Hansson, C.M. Corrosion products that form on steel within cement paste. Mater. Struct. 2007, 40, 325–340. [Google Scholar] [CrossRef]
  7. Vidal, T.; Castel, A.; François, R. Corrosion process and structural performance of a 17 year old reinforced concrete beam stored in chloride environment. Cem. Concr. Res. 2007, 37, 1551–1561. [Google Scholar] [CrossRef]
  8. Arai, K.; Hattori, A.; Miyagawa, T. Mechanism and prediction of cover concrete spalling due to reinforcement corrosion. J. Jpn. Soc. Civ. Eng. 2005, 69, 209–222. [Google Scholar]
  9. Du, Y.; Cullen, M.; Li, C. Structural performance of RC beams under simultaneous loading and reinforcement corrosion. Constr. Build. Mater. 2013, 38, 472–481. [Google Scholar] [CrossRef]
  10. Kato, E.; Hamada, Y.; Iwanami, M.; Yokota, H. Influence of localized corrosion of steel bars on structural performance of concrete beam. In Proceedings of the 1st International Symposium on Life-Cycle Civil Engineering, Lake Como, Italy, 11–14 June 2008; Volume 47, pp. 57–82. [Google Scholar]
  11. ACI. Committee 201. Guide for Conducting a Visual Inspection of Concrete in Service; ACI 201: Farmington Hills, MI, USA, 2008; 1R-08. [Google Scholar]
  12. Shodja, H.M.; Kiani, K.; Hashemian, A. A model for the evolution of concrete deterioration due to reinforcement corrosion. Math. Comput. Model. 2010, 52, 1403–1422. [Google Scholar] [CrossRef]
  13. Val, D.V.; Chernin, L.; Stewart, M.G. Experimental and numerical investigation of corrosion-induced cover cracking in reinforced concrete structures. J. Struct. Eng. 2009, 135, 376–385. [Google Scholar] [CrossRef]
  14. Lu, C.H.; Liu, R.G.; Jin, W.L. A model for predicting time to corrosion-induced cover cracking in reinforced concrete structures. In Fracture Mechanics of Concrete and Concrete Structures Assessment, Durability, Monitoring and Retrofitting of Concrete Structures; CRC Press: Boca Raton, FL, USA, 2010; pp. 967–975. [Google Scholar]
  15. Lau, I. Time-Dependent Reliability Analysis of Corrosion-Induced Concrete Cracking Based on Fracture Mechanics Criteria. Ph.D. Thesis, RMIT University, Melbourne, Australia, 2019. [Google Scholar]
  16. Lau, I.; Li, C.-Q.; Fu, G. Prediction of time to corrosion-induced concrete cracking based on fracture mechanics criteria. J. Struct. Eng. 2019, 145, 04019069. [Google Scholar] [CrossRef]
  17. Chernin, L.; Val, D.V. Prediction of corrosion-induced cover cracking in reinforced concrete structures. Constr. Build. Mater. 2011, 25, 1854–1869. [Google Scholar] [CrossRef]
  18. Coccia, S.; Imperatore, S.; Rinaldi, Z. Influence of corrosion on the bond strength of steel rebars in concrete. Mater. Struct. 2016, 49, 537–551. [Google Scholar] [CrossRef]
  19. Shen, J.; Gao, X.; Li, B.; Du, K.; Jin, R.; Chen, W.; Xu, Y. Damage evolution of RC beams under simultaneous reinforcement corrosion and sustained load. Materials 2019, 12, 627. [Google Scholar] [CrossRef] [PubMed] [Green Version]
  20. Song, L.; Fan, Z.; Hou, J. Experimental and analytical investigation of the fatigue flexural behavior of corroded reinforced concrete beams. Int. J. Concr. Struct. Mater. 2019, 13, 24. [Google Scholar] [CrossRef]
  21. Bossio, A.; Fabbrocino, F.; Monetta, T.; Lignola, G.P.; Prota, A.; Manfredi, G.; Bellucci, F. Corrosion effects on seismic capacity of reinforced concrete structures. Corros. Rev. 2019, 37, 45–56. [Google Scholar] [CrossRef]
  22. Cui, Z.; Alipour, A.; Shafei, B. Structural performance of deteriorating reinforced concrete columns under multiple earthquake events. Eng. Struct. 2019, 191, 460–468. [Google Scholar] [CrossRef]
  23. Apostolopoulos, C.A.; Koulouris, K.F.; Apostolopoulos, A.C. Correlation of surface cracks of concrete due to corrosion and bond strength (between Steel Bar and Concrete). Adv. Civ. Eng. 2019, 2019, 3438743. [Google Scholar] [CrossRef]
  24. Kurumatani, M.; Anzo, H.; Soma, Y.; Okazaki, S. Analysis of 3D crack propagation due to steel corrosion using damage model. Trans. Jpn. Soc. Comput. Eng. Sci. 2019, 2019, 20190007. [Google Scholar]
  25. Kurumatani, M.; Nemoto, Y.; Okazaki, S.; Hirose, S. Simulation of crack-paths formed in concrete around deformed tension bar. Trans. Jpn. Soc. Comput. Eng. Sci. 2014, 2014, 20140008. [Google Scholar]
  26. Bažant, Z.P. Physical model for steel corrosion in concrete sea structures—Application. J. Struct. Div. 1979, 105, 1155–1166. [Google Scholar]
  27. Lin, X.; Peng, M.; Lei, F.; Tan, J.; Shi, H. Analytical model of cracking due to rebar corrosion expansion in concrete considering the structure internal force. AIP Adv. 2017, 7, 125328. [Google Scholar] [CrossRef] [Green Version]
  28. Tsutsumi, T.; Matsushima, M.; Murakami, Y.; Seki, H. Study on crack models caused by pressure due to corrosion products. J. Jpn. Soc. Civ. Eng. 1996, 30, 159–166. [Google Scholar]
  29. De Vree, J.H.P.; Brekelmans, W.A.M.; van Gils, M.A.J. Comparison of nonlocal approaches in continuum damage mechanics. Comput. Struct. 1995, 55, 581–588. [Google Scholar] [CrossRef] [Green Version]
  30. Nishizawa, A.; Takaya, S.; Nakamura, S.; Miyagawa, T. Influence of steel corrosion products in concrete on crack opening weight loss of corrosion. Proc. Jpn. Concr. Inst. 2013, 35, 1051–1056. [Google Scholar]
  31. Akashiro, K.; Mitamura, H.; Watanabe, T.; Kishi, T. Effect of bond characteristics of steel bar on fatigue property of RC slab. Proc. Jpn. Concr. Inst. 2010, 32, 727–732. [Google Scholar]
  32. Lukuan, Q.; Seki, H. Analytical study on crack generation situation and crack width due to reinforcing steel corrosion. Proc. Jpn. Concr. Inst. 2001, 32, 727–732. [Google Scholar]
  33. Qiao, D.; Nakamura, H.; Tran, K.K.; Yamamoto, Y.; Miura, T. Experimental and analytical evaluation of concrete cover spalling behavior due to local corrosion. J. Struct. Eng. 2015, 61, 707–714. [Google Scholar]
  34. Takaya, S.; Nakamura, S.; Yamamoto, T.; Miyagawa, T. Influence of Steel corrosion products in concrete on crack opening weight loss of corrosion. J. Jpn. Soc. Civ. Eng. 2013, 69, 154–165. [Google Scholar]
  35. Suzuki, M.; Fukuura, N.; Maruya, T. Establishment of a coupled analysis between structure and reinforcement corrosion for predicting deterioration of reinforced concrete structure by salt damage. J. Jpn. Soc. Civ. Eng. 2014, 70, 301–319. [Google Scholar]
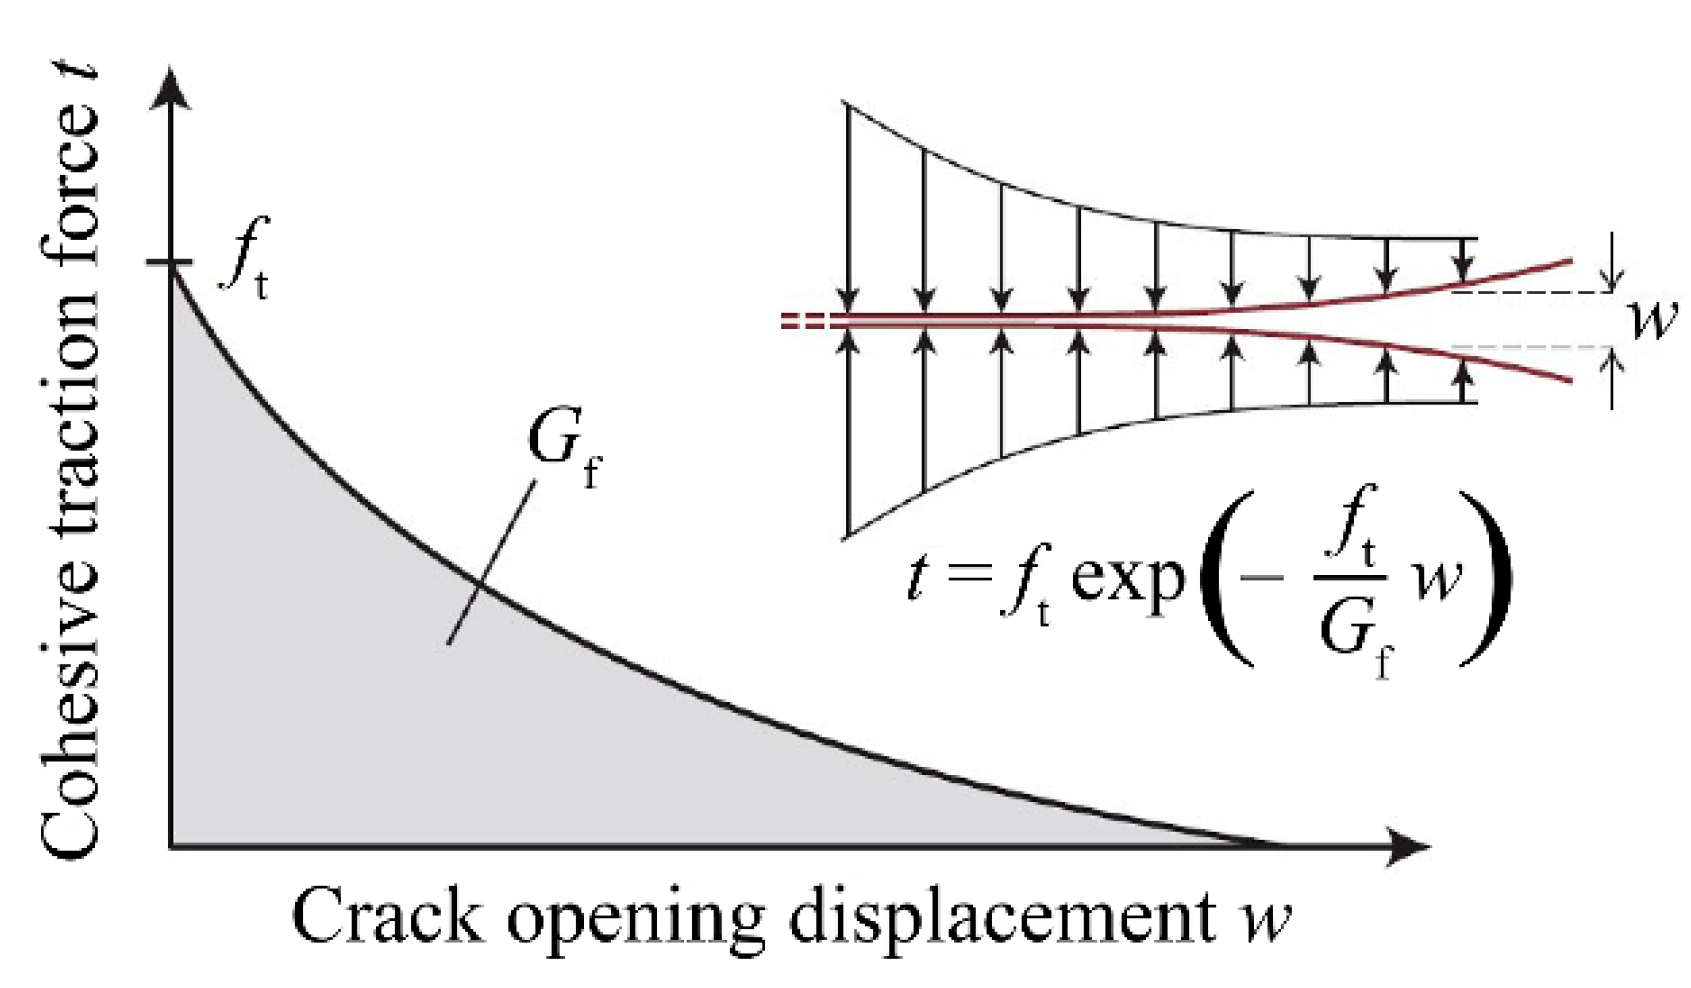
Figure 1. Relationship between the cohesive force and crack opening displacement.
Applsci 10 05272 g001
Figure 2. A contour plot of the modified von Mises criterion.
Applsci 10 05272 g002
Figure 3. Positions of cross-sections (Specimens 1 and 2).
Applsci 10 05272 g003
Figure 4. Overview of model (Specimens 1 and 2).
Applsci 10 05272 g004
Figure 5. Damage distribution of a cross-section of Specimen 1.
Applsci 10 05272 g005
Figure 6. Damage distribution of a cross-section of Specimen 2.
Applsci 10 05272 g006
Figure 7. Crack width versus expansion step of reinforcement (Specimens 1 and 2).
Applsci 10 05272 g007
Figure 8. Overview of Specimens 3, 4, and 5.
Applsci 10 05272 g008
Figure 9. Position of cross-sections Specimens 3, 4, and 5.
Applsci 10 05272 g009
Figure 10. Damage distribution of a cross-section of Specimen 3.
Applsci 10 05272 g010
Figure 11. Damage distribution of a cross-section of Specimen 4.
Applsci 10 05272 g011
Figure 12. Crack width versus expansion step of reinforcement (Specimens 3 and 4).
Applsci 10 05272 g012
Figure 13. Damage distribution of a cross-section of Specimen 5.
Applsci 10 05272 g013
Figure 14. Crack width versus expansion step of reinforcement (Specimens 3 and 5).
Applsci 10 05272 g014
Figure 15. Electrolytic corrosion test setup.
Applsci 10 05272 g015
Figure 16. Photograph of electrolytic corrosion test.
Applsci 10 05272 g016
Figure 17. Sampling areas of the reinforcing bar.
Applsci 10 05272 g017
Figure 18. Bottoms of specimens (Cases 1 to 10).
Applsci 10 05272 g018
Figure 19. Damage distribution on the bottom of the specimen (simulation).
Applsci 10 05272 g019
Figure 20. Crack width versus corrosion amount; (a) cross-sections 1 and 3; (b) cross-section 2.
Applsci 10 05272 g020
Table 1. Results for the amount of rebar corrosion.
Corrosion Amount (mg/cm2)
Area123
Case 175.10133.6962.80
Case 257.42109.2280.55
Case 337.99163.0762.41
Case 440.27113.2561.02
Case 563.17124.8071.84
Case 6230.26386.34209.09
Case 7257.94314.39267.05
Case 8189.41252.49179.49
Case 9108.07182.97182.07
Case 10137.53157.07117.41