Article

Assessment of Accidental Torsion in Building Structures Using Static and Dynamic Analysis Procedures

by
Osama Ahmed Mohamed
1,* and
Mohamed Sherif Mehana
2
1
College of Engineering, Abu Dhabi University, Abu Dhabi PO Box 59911, UAE
2
UNii Engineering Consultancy, Abu Dhabi PO Box 47378, UAE
*
Author to whom correspondence should be addressed.
Appl. Sci. 2020, 10(16), 5509; https://doi.org/10.3390/app10165509
Submission received: 6 July 2020 / Revised: 7 August 2020 / Accepted: 7 August 2020 / Published: 9 August 2020

Abstract

:

Featured Application

This article presents a model that overcomes the discrepancies between the accidental torsion response obtained using static and dynamic analysis methods. The frequency ratios for which static analysis overestimates torsional response were identified. Similarly, the frequency ratios for which static analysis underestimates torsional response were also identified.

Abstract

This article presents the findings of a study on assessment of the increase in building’s response due to accidental torsion when subjected to seismic forces. Critical stiffness and geometrical parameters that define buildings torsional response are examined including: (1) the ratio, Ω, between uncoupled torsional frequency ωθ to uncoupled translation frequencies in the direction of ground motion ωx or ωy, (2) floor plan aspect ratio, b/r, which is a function of the floor dimension and radius of gyration. The increased response is assessed on symmetric multi-storey buildings using both static and dynamic analysis methods specified by ASCE-7 and considering parameters affecting the torsional response. It was concluded that static and dynamic analysis procedures predict different accidental torsion responses. Static analysis based on the Equivalent Lateral Force (ELF) method predicts more conservative accidental torsions responses for flexible structures with Ω < 0.7~0.80, while the responses are less conservative for stiffer buildings. The conservativism in static analysis method is attributed to the response amplification factor, Ax. Floor plans and their lateral support system having frequency ratio Ω = 1 will also have a torsional radius equal to radius of gyration, and will experience drop in torsional response relative to more torsionally flexible buildings. This article presents a procedure to overcome the shortcomings of static and dynamic analysis procedures in terms of estimating accidental torsion response of symmetric building structures.

1. Motivation

Structural response due to seismic forces remains a challenge to predict due to the multitude of uncertainties related to estimating seismic forces and modelling assumptions. Structural damage due to accidental and/or inherent torsion response continues to be detected after seismic events. Static analysis methods are not necessarily conservative. This study identifies the range of building frequencies for which structural response estimated using static analysis is conservative, and the range of building frequencies for which static analysis is unconservative. Structural damage could occur when structural response due to seismic forces is underestimated.

2. Introduction

Building codes and design standards typically require that torsional effects be accounted for when designing structural systems for seismic forces. When static analysis is used to evaluate structural response, torsional effects are accounted for by applying equivalent static forces at a prescribed design eccentricity, ed, from the center of stiffness (CS). Such eccentric forces generate story twisting moments, shear forces and overturning moments. The prescribed design eccentricity accounts for both inherent and accidental torsion effects. Inherent torsion moment, Mt, is caused by the eccentricity between the locations of the center of mass (CM) and the center of rigidity, while accidental torsion moment, Mta, accounts for uncertainties in mass or strength distribution assumed in the analysis, and any torsional vibrations that might be induced by base rotational motion.
Some standards such as ASCE 7-16 [1] and codes such as Mexico Federal District Code [2] and National Building Code of Canada [3] provide some form of the Equation (1) for design eccentricity, ed, that accounts for both inherent and accidental torsions.
e d = α e s + β b or e d = δ e s β b ,
where:
  • es = static stiffness eccentricity, representing the distance between CM and CS.
  • b = building plan dimension, perpendicular to the direction of ground motion.
  • α, β, and δ are code specified coefficients.
The first two terms in Equation (1), αes and δes, are intended to account for the effect of lack in building symmetry on inducing coupled lateral and torsional responses. The second term, βb, accounts for: (i) accidental eccentricity between CM and CS, (ii) possible discrepancy between strength distributions assumed during the analysis phase, and the actual distribution at the time of earthquake, (iii) torsional vibrations at upper floors induced by rotational motion at the base of the building, and (iv) other sources of torsion not considered during the analysis/design phase.
The present paper focuses on accidental torsion in buildings evaluated using ASC7-16 standard. It is recognized however that different design codes specify different values of the coefficients α, β, and δ. Mexico Federal District Code [2] adopts a value of α = 1.5, δ = 1 and β = 0.1; while National Building Code of Canada [3] uses α = 1.5, δ = 0.5 and β = 0.1. The present study assumes values of α = δ = 1 and β = 0.05 in accordance with ASCE 7-16 Sections 12.8.4.1 and 12.8.4.2 [1]. It is worthy to note that probabilistic studies by De-la-Colina et al. [4] confirmed the appropriateness of ASCE 7 requirements for displacement of center of mass by 5% (β = 0.05) to account for accidental torsion in tall buildings. The investigators found that 10% displacement of the center of mass is more suitable for shorter buildings.
It is often accepted in practice to assume linear elastic behavior of buildings while considering accidental torsion effects on structural response. The accidental torsion effect can be included in the static analysis of the building by applying lateral static forces, equivalent to the prescribed design seismic forces, at an eccentricity of ± βb from the CM on each floor. The eccentric static forces produce larger effects including torsion to be used in design of lateral forces resisting system. Alternatively, the effects of accidental torsion on structural response can be considered through dynamic analysis of the building after notional shifting of the CM of each floor by a distance equal to the accidental eccentricity ± βb from its nominal position. The two methods of accounting for eccentricity produce different force magnitudes on structural members. Other approaches to account for accidental torsion were proposed in the literature. When static analysis is used in this article, forces are calculated using the Equivalent Lateral Force (ELF) method. The accidental eccentricity has been used by engineers to account for various uncertainties, but also to account for torsional ground motion, although the latter is not indicated in ASCE 7-16 to be part of the eccentricity definition. Basu et al. [5] proposed accounting for the effect of torsional ground motion through a process in which the translational component is multiplied by a factor that is a function of the accidental eccentricity proposed by the authors.
The parameters affecting the torsional response of a building can be classified as parameters, which are function of the stiffness of the lateral resisting system; and parameters which are function of the geometric configuration of the building.
The most significant stiffness parameter influencing torsional response of a building is the ratio between fundamental frequencies of uncoupled torsional and lateral vibrations [6,7,8]. The ratio between building fundamental frequencies of uncoupled torsional and lateral vibration, Ω, is defined as ratio between uncoupled angular torsional frequency, ωθ, and uncoupled angular translational frequencies, ωx and ωy.
The angular frequency in general is proportional to the square root of the mass divided by the stiffness as indicated by Equations (2)–(5) [9]. The ratio of uncoupled torsional and lateral frequency, Ω, can be calculated by Equation (6). It is worthy to note that the uncoupled frequency is obtained from the structure mode shapes that include both translation and torsional vibrations and are beyond the scope of this article. On the other hand, the uncoupled translation frequency is obtained from a pure translational mode shapes and uncoupled torsional frequency obtained from pure torsional mode shape.
T θ = 2 π J m K θ ,
ω θ = J m K θ ,
T x = 2 π M K x   and   T y = 2 π M K y ,
ω x = M K x   and   ω y = M K y ,
Ω x = ω θ ω x   and   Ω y = ω θ ω y
where,
  • Jm, is the torsional constant,
    Kθ is building torsional stiffness
  • Kx and Ky are building translational stiffness in X and Y direction respectively.
  • M is building mass
  • Ωx or Ωy are the ratios of uncoupled torsional and translation frequencies.
Several studies showed that accidental torsion increases the structural response of symmetric buildings more than unsymmetrical buildings [6]. Therefore, emphasis in this article is on symmetrical buildings. For symmetric buildings in general; the uncoupled torsional and lateral frequencies ωθ, ωx and ωy can be computed using standard modal analysis procedures such as Eigen value or Ritz methods. For unsymmetrical buildings, which are not addressed in this article, the uncoupled frequencies cannot be obtained from modal analysis directly. Procedures are found in literature to calculate the uncoupled frequencies for unsymmetrical buildings [6].
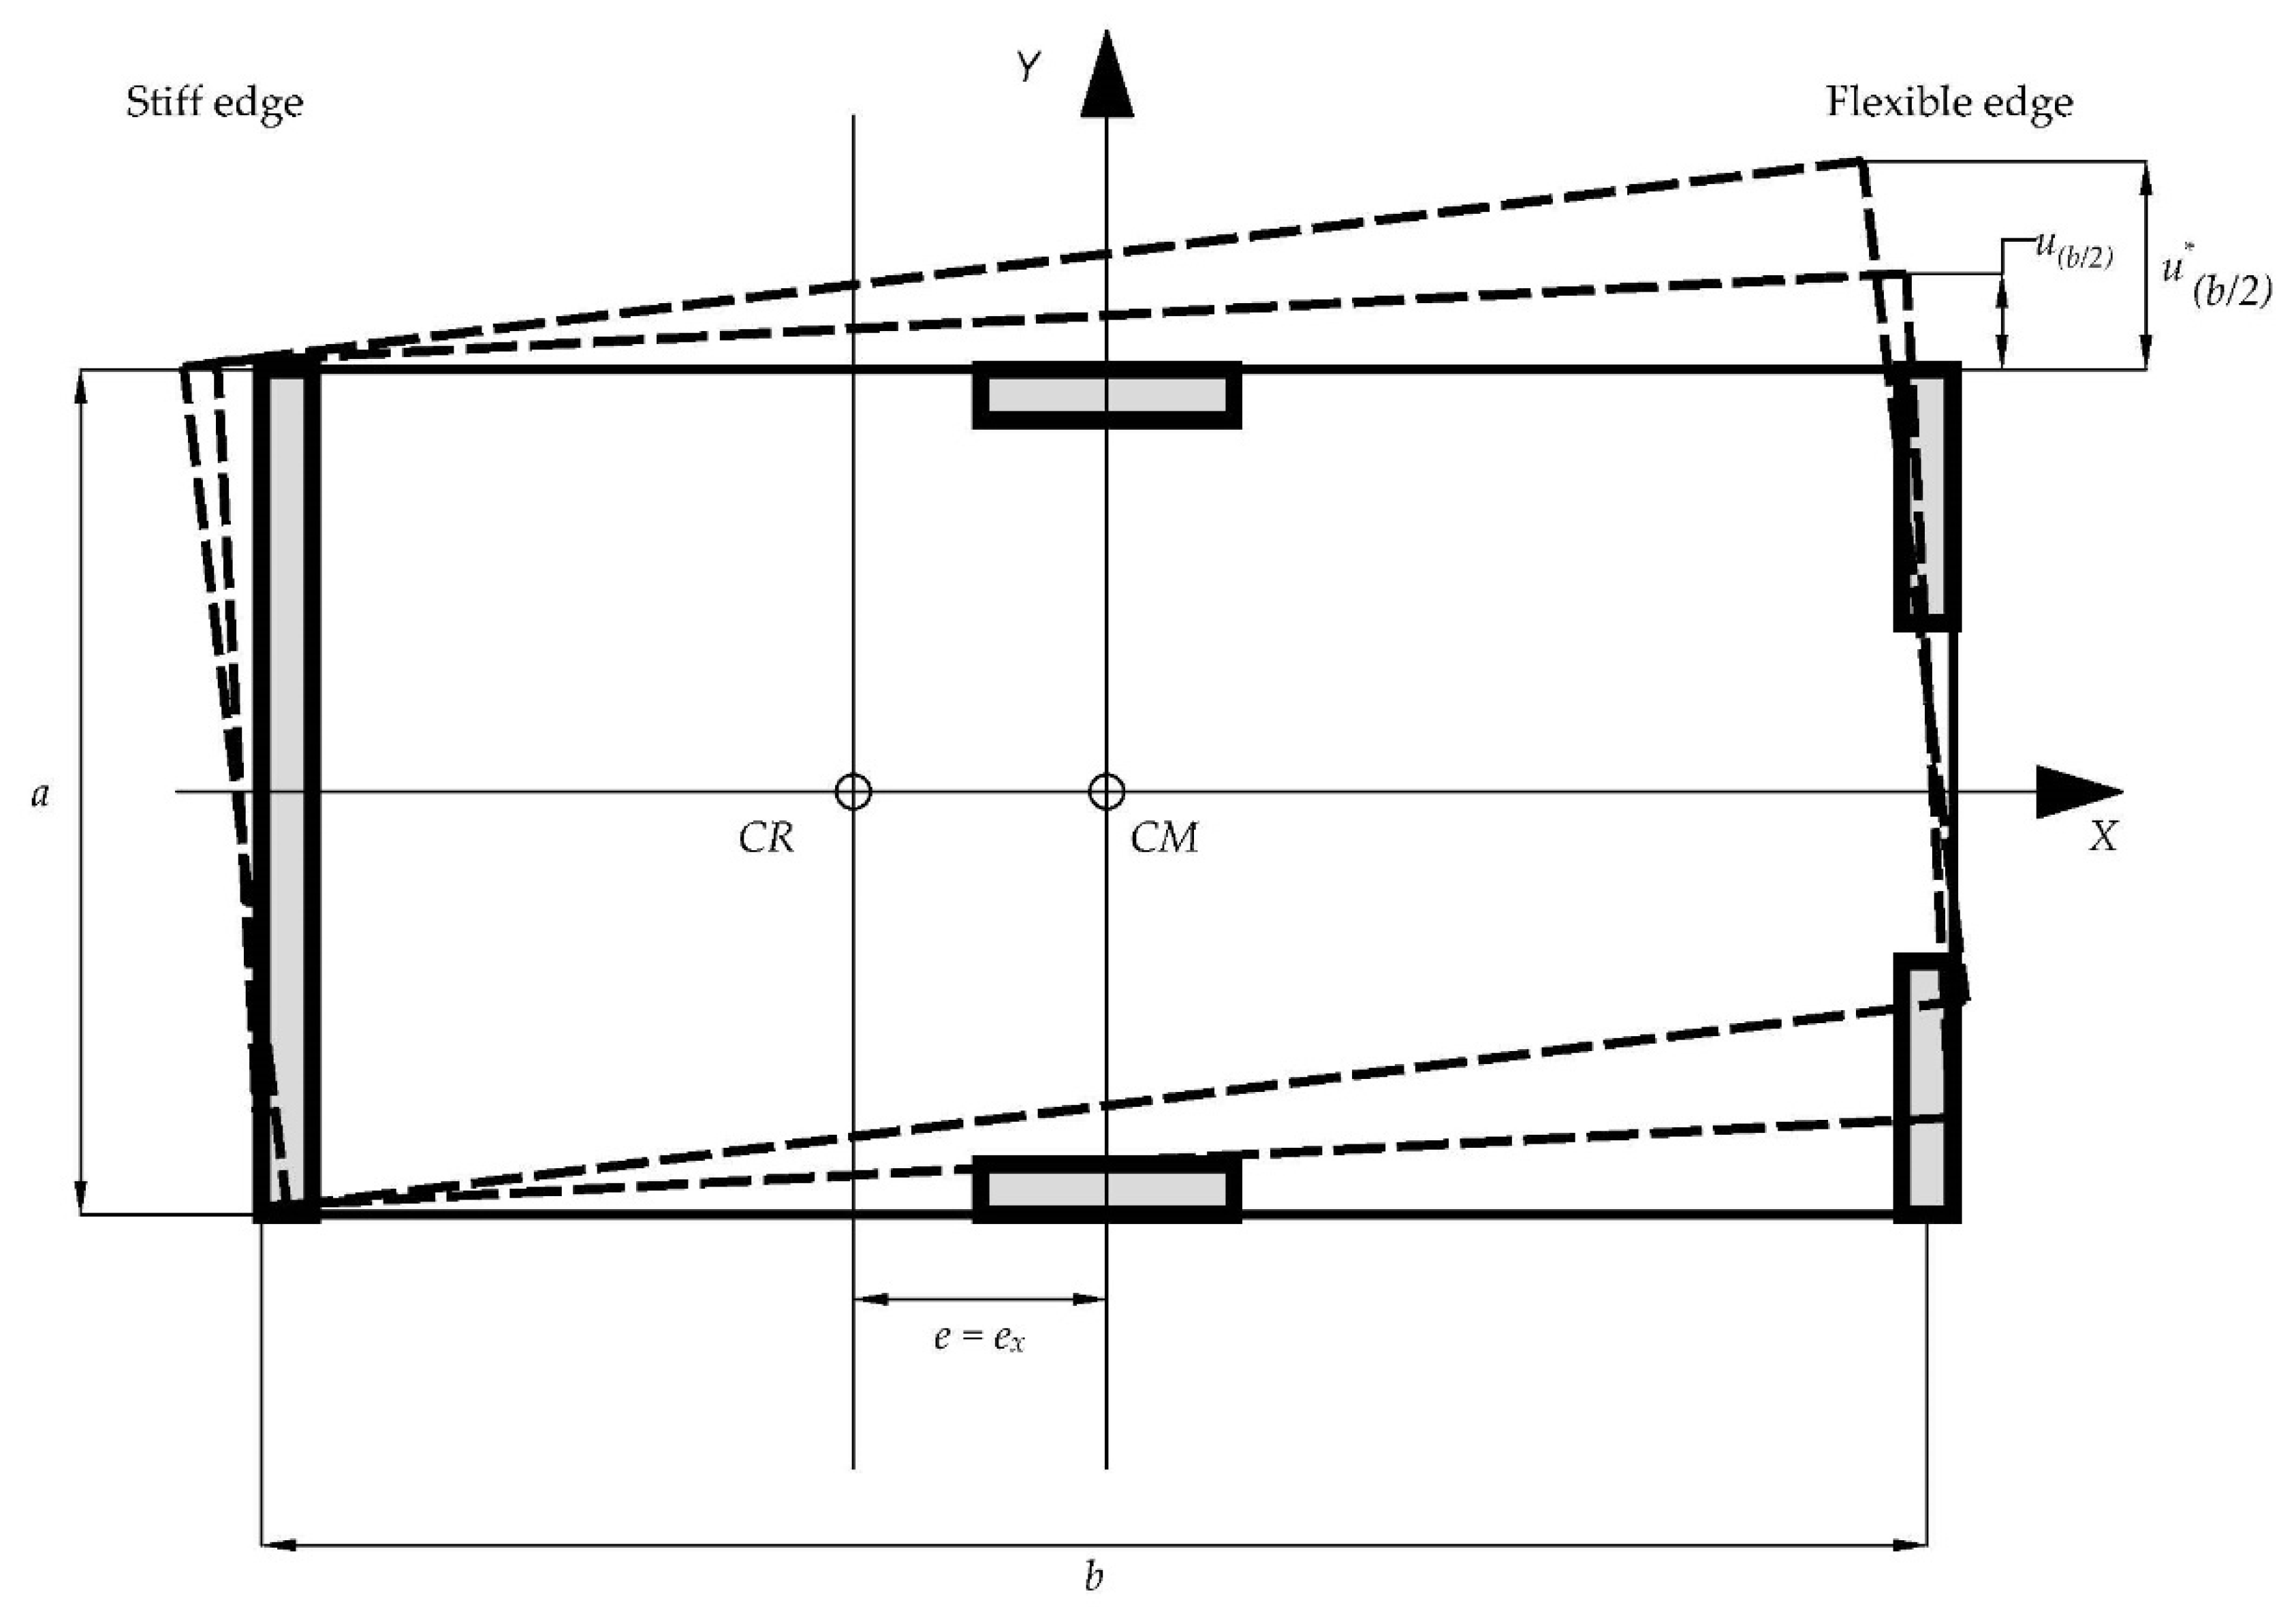
The most significant geometric parameter influencing torsional response of a building is the ratio of the length of the building in the direction perpendicular to the direction of seismic excitation to building radius of gyration. Radius of gyration is an important parameter needed for checking the regularity in plan as will be discussed later in this article. Mathematically, the radius of gyration is the square root of the ratio of the polar moment of inertia of the floor mass in plan to the floor mass. In the case of the rectangular floor area with plan dimensions a and b and with uniformly distributed mass over the floor, the radius of gyration, r, can be expressed by Equation (7).
r = ( a 2 + b 2 ) 12 ,
Dimensions “a”, and “b” in Equation (7) are building plan dimensions illustrated in Figure 1.
In the study presented in this paper, 72 multi-story building structures were analyzed to evaluate the torsional response using static and dynamic analysis methods, consistent with ASCE 7-16 standard. The objectives of the study include:
  • Evaluate the main parameters that influence the torsional response of a building subjected to seismic load. These parameters include; the ratio of the torsional frequency to the translational, Ω, as defined by Equation (6), floor plan aspect ratio b/r, and finally the magnitude of the building natural vibration period.
  • Examine the differences between torsional response calculated using static and dynamic analysis procedures.
  • Propose an approach to overcome discrepancies between torsional response evaluated using static and dynamic analysis procedures.

3. Methodology

3.1. Analysis Methods and Procedures

The methods and procedures followed in this paper to estimate the effect of accidental torsion on building response are in accordance to ASCE 7-16. The commentary of ASCE 7-16, Section C12.8.4, suggests that inherent torsional moment be accounted for in structures with rigid diaphragms. Although inherent torsion is dominant in irregular structures, torsional response in general has also been observed in structures that are symmetric in floor plan as well as in layout of seismic force-resisting systems [10,11]. The fundamental reason torsional response exists in torsionally regular structures is that eccentricity between the center of stiffness and center of mass might exist due to uncertainties or unintended errors in determining the mass of the structure and stiffness values/distribution of structural elements during the modelling/design phase. In addition, earthquake ground motions might have torsional components, depending on building orientation, that are not included explicitly in code-based designs [12]. Therefore, ASCE 7-16 justifiably requires that the effects of accidental torsion must be considered for every structure, in addition to the amplification of torsion effects that occurs with torsional irregular structures.
To account for accidental torsion, ASCE 7-16 prescribes the consideration of 5% the structure dimension perpendicular to the direction of ground motion, to any static eccentricity computed using idealized locations of the centers of mass and rigidity. Either static or dynamic analyses are recognized by this standard for consideration of torsional effects.

3.1.1. Consideration of Inherent Torsion-Static Analysis Method Based on ASCE 7-16

When floors are considered to act as rigid diagrams, the process involves nominal shifting of the center of mass each way from its calculated location and applying the seismic lateral force at each displaced center of mass as an independent seismic load case. The forces are calculated using the traditional ELF method. It is often conservatively assumed that the displacement of the center of mass at each floor happens at the same time and in the same direction. Applying the seismic force at the relocated center of mass generates an accidental static rotation, Mta, at each story. Modern commercial computer programs can automate this process in three-dimensional analyses. Clearly nominal sifting of the CM only, usually by 5% of the plan dimensions, only approximates the response and doesn’t change the actual dynamic properties of the structure, as would be the case if were to physically move the center of mass and alter the horizontal mass distribution and mass moment of inertia.
Accidental torsion generates forces in structural elements that must be combined with those generated by the seismic design story shears, Vx, including forces caused by inherent torsion. Each structural element must be designed for the maximum effects determined, taking into account accidental torsion that occurs by moving the center of mass to produce either positive or negative effects, as well as when the center of mass remains in the nominal position. In general, earthquake forces are applied concurrently in any two orthogonal directions. However, the accidental torsion effects considered through the 5% eccentricity of the center of mass is only necessary in the direction that produces the greatest effect, rather than both orthogonal directions. This will be the approach followed when analyzing the case studies examined in this article.
In the static analysis method, even if the seismic lateral forces are obtained from the Modal Response Spectrum Analysis MRSA, the lateral forces at storey-level are applied statically at an artificial point shifted from the center of mass, in order to incorporate the effects of accidental torsion. However, by its very nature, MRSA produces one positive response, therefore, unable to assess torsional response directly. One method to overcome this hurdle is to determine the maximum and average displacements for each mode participating in the direction being considered and then use a modal combination method, such as the complete quadratic combination CQC method, to obtain the total displacements used to check torsional irregularity and compute the torsional amplification factor. The torsional amplification factor A x = δ m a x 1.2 δ a v g , a function of the maximum displacement, δ m a x , at the floor level, and the average, δ a v g , of the displacements at the extreme points of the floor. Ax, which should be in the range of 1 to 3, is applied directly to amplify the accidental torsion moment, Mta, obtained from static analysis.

3.1.2. Consideration of Inherent Torsion-Dynamic Analysis Method Based on ASCE 7-16

Dynamic analysis is conducted on the three-dimensional structure and involves modifying the dynamic properties of the structural system, in order for the dynamic amplification of the accidental torsion to be considered directly. One way to modify the structural system for dynamic analysis is by reassigning the lumped mass for each floor to other points offset from the original identified center of mass, and by modifying the mass moment of inertia of structural system. Alternatively, the center of mass can be physically relocated on each floor by modifying the horizontal mass distribution, instead of the typical presumed uniform distribution. This approach is computationally expensive. This is because all possible configurations must be analyzed, primarily two additional analyses for each principal axis of the structure. However, this approach automatically produces the dynamic effects of direct loading and accidental torsion. Practical disadvantage is cumbersome calculations.
When dynamic analysis is conducted, amplification of the accidental torsion using the prescribed amplification factor Ax, in accordance with ASCE 7-16 Section 12.8.4.3 is not applicable. This is because repositioning the center of mass incorporates the expected coupling between the torsional and lateral modal responses and captures amplification of accidental torsion directly.
The computer program ETABS produced by CSI America, is used in this study to analyze the structure and include accidental torsion in a MRSA for static analysis, and then to conduct dynamic analysis where the center of mass is shifted physically.

3.2. System Parameters and Response Quantities Definitions

The selected response quantities to measure building torsional rigidity in this study is diaphragm edge displacements. Controlling the lateral displacement of the building subjected to torsion is a main obstacle facing a structural engineer in order to control building behavior due to accidental torsion. In addition, this parameter is giving an indication about the design forces induced in the structural elements due to accidental torsion.
The response of the buildings due to accidental moment is measured by calculating building normalized edge displacements, u ^ x , at a distance x from the center of mass. The increase in building response due to accidental torsion is estimated by defining the normalized displacement of the building plan at distance b/2 (see Figure 1) from the center of mass as the ratio between the displacement u b / 2 * of the system including the effect of accidental torsion and the displacement u b / 2 of the system without accidental torsion as shown in Figure 1, such that;
u ^ b / 2 = u b / 2 * u b / 2 .
Thus, a value of u ^ b / 2 > 1 implies an increased building displacement amplified by accidental torsion.
To measure the influence of each parameter under study on the response, the normalized edge displacements are measured for a series of buildings with different plan dimension ratio b/r, uncoupled frequency ratio Ω, and fundamental translation periods Tx or Ty in the direction of ground motion. Further discussion of each parameter under study are found in next sections.

3.2.1. Ratio of Plan Dimensions (b/r)

The response of the building due to accidental torsion varies according to building geometric configuration. To measure this response, the case study buildings evaluated are classified into three groups, two rectangular in floor plan and one square. The floor plan aspect ratio b/r is building width perpendicular to excitation direction divided by the radius of gyration as shown in Equation (8).
b / r = 12 [ 1 + ( a b ) 2 ] ,
The floor plan dimensions “a”, and “b” in Equation (8) are illustrated in Figure 1.

3.2.2. Ratio of Uncoupled Vibration Frequencies, Ω

Different values of the uncoupled frequency ratio Ω are obtained by altering the location of the main lateral resisting structural elements from the perimeter of the building to near the core as shown in Figure 2, Figure 3 and Figure 4. For symmetric buildings under study, the fundamental torsional and lateral frequencies ωθ, ωx and ωy depend on the torsional and lateral stiffness matrices Kθ, Kx, and Ky, respectively. These frequencies can be computed using Eigen value or Ritz methods of structural dynamics. However, for unsymmetrical buildings the standard procedures are not applicable as the results will show coupled translational-torsional motion in each mode. Llera et al. [7] proposed a method to calculate the uncoupled frequencies of unsymmetrical structures.
Once ωy and ωθ are known, the uncoupled angular frequency ratio Ω   = ω θ   ω y   is computed. Studies have shown that the resulting value of Ω is more accurate than ωy and ωθ separately, as the errors present in computation of the frequencies tend to decrease when their ratio is determined [6].
A large value of the ratio Ω, which may be viewed as a property of the building, indicates that the building is torsionally stiff, such as the case when stiff resisting structural elements are located near the perimeter of the building plan. On the other hand, a small value of Ω indicates the building is torsionally flexible, which is the case when stiff structural elements are located near the central core of the building but flexible elements are located at the perimeter. Accordingly, a boundary value between flexible and stiff torsional systems is defined at Ω = 1. From practical point of view, most buildings have value of Ω ranging between 0.7 and 1.5 [8].

3.2.3. Uncoupled Translational Vibration Period Tx and Ty

It has been reported that increase in edge displacement of building floor plan due to stiffness and mass uncertainty is not sensitive to change in the value of the uncoupled translation period Tx or Ty [6,9]. In the study presented in this paper, such observation is evaluated by varying the translation period and observing the corresponding edge displacement caused by accidental torsion.

3.3. Parametric Case Study

In order to investigate building response due to accidental torsion computed using both dynamic and static analysis as specified by building codes, a set of 72 of multi-story buildings are considered. All buildings are symmetric with respect to both X and Y axes. The horizontal rigid floor diaphragm is constrained in two lateral directions by vertical lateral resisting elements. Parameters relevant to site and buildings under consideration are summarized in Table 1.
Buildings modeled for investigation are classified into three groups based on floor plan aspect ratio b⁄r defined by Equation (8). The first group includes a set of buildings with b/r = 1.1, the second with b/r = 1.4, and third group with b/r = 2.45. Each of the three b/r values consists of a set of buildings having a range of frequency ratios Ω varying from flexible structural systems systems (Ω = 0.6~0.7) to stiffer systems (Ω = 1.4~1.7). This range of frequency ratios with each aspect ratio b/r is obtained by placing the lateral resisting elements at various locations from the building perimeter (stiffer system) to building core (flexible system). Each group of buildings having the same b/r ratio also includes three different ranges of lateral frequency in the direction of ground motion. The first range includes buildings with Ty < 1 s, the second range include buildings with 1 < Ty < 2 s, while the third range includes buildings with Ty > 2 s. Indicative floor plans of buildings are shown in Figure 2, Figure 3 and Figure 4 respectively. In summary, the 72 case study buildings are divided into three sets (b/r = 1.1, b/r = 1.4, and b/r = 2.45); in each of the three sets there are eight building sets with varying Ω from 0.7 to 1.4; and each building with a specific Ω is modelled with three different periods. The response is measured by calculating normalized edge displacements u ^ b / 2 using static and dynamic analyses implemented using the commercial program ETAB, produced by CSI America, Inc.

4. Results and Discussion

Accidental torsion, regardless of source, increases the seismic response of symmetric buildings, more than unsymmetrical buildings [7]. Therefore, the design case study building structure is chosen to be symmetric in this article. The results summarized in the following sections include:
  • Analyzing the parameters affecting the torsional response of the buildings using static and dynamic analysis methods.
  • Calculation of the normalized edge displacements u ^ b / 2 and determination of torsional irregularity taking into consideration effects of accidental torsion using static and dynamic analyses.
  • Proposal of a new method to consider accidental torsion in the analysis based on the comparison of response quantities determined using static and dynamic procedures.

4.1. Fundamental Period and Relative Modal Mass

Fundamental periods and relative modal masses for the case study buildings were calculated using Eigen Victor method [13]. Results are focusing on the Y and Z directions as they are the directions of interest for translation and rotation response. Also, for the sake of brevity; selected results for one building in each group of the buildings under study are tabulated in this section. The selected modal analysis results are related to building of frequency ratios Ω = 1.0, Ω < 1.0, and Ω > 1.0, in order to demonstrate the differences in torsional response.
The results show that stiff buildings of torsional to translation frequency ratio Ω ≥ 1.0 exhibit high relative modal mass in Y direction and little or zero in rotation around the Z-axis in the first and second fundamental modes. The third mode, representing floor twisting, is characterized by high mass torsional participation ratios around the Z-axis, along with zero participation in translation modes in X and Y directions, as seen in Table 2, Table 3, Table 4, Table 5 and Table 6. On the other hand, flexible buildings with Ω < 1.0 exhibit high relative modal mass in rotation around the Z-axis (floor twisting) in the first fundamental period. The second and third modes in flexible buildings are characterized with high relative modal mass in Y direction (or X direction) translation and nearly zero for rotation around the Z-axis, as shown in Table 4, Table 7 and Table 8. These results are consistent as buildings with Ω < 1.0 are torsionally flexible, and hence, have high torsional participation in first mode, which is consistent with published literature [8]. Table 9 and Table 10 show a consistent response where mass model participation is associated with the otherwise translation modes (1 and 2), for buildings that are torsionally stiff and having rectangular aspect ratio (b/r = 2.45).

4.2. Calculation of the Normalized Edge Displacement Using Dynamic and Static Analysis

Figure 5, Figure 6, Figure 7, Figure 8, Figure 9, Figure 10, Figure 11, Figure 12 and Figure 13 depict the normalized edge displacements u ^ b / 2 determined using static and dynamic analysis methods, for the three groups of buildings in the parametric study. It clear that static and dynamic analysis procedures predict different responses due to accidental torsion. The buildings’ responses calculated using static analysis are more conservative for flexible structures with torsional to translation frequency ratio Ω < 0.7~0.8, while for stiffer buildings results are less conservative. The conservative torsional response at Ω < 0.7~0.80 is attributed to the ASCE 7-16 static analysis method that utilizes an amplification factor, Ax, to increase accidental torsion response associated with the presence of torsional irregularity. Therefore, static analysis reliance on the amplification factor, Ax, makes accidental torsion response more conservative for flexible structures compared to dynamic analysis.
Figure 5c, Figure 6c, Figure 7c, Figure 8c, Figure 9c, Figure 10c, Figure 11c, Figure 12c and Figure 13c consistently show a decrease (dip) in accidental torsion amplification obtained through dynamic analysis for buildings with frequency ratio Ω = 1, regardless of vibration period or floor aspect ratio. Similar behavior was reported in the literature [6]. For buildings with large aspect ratio b/r = 2.45, the dynamic accidental torsion response curve exhibits a second peak (double hump), and as the vibration period increases to Ty > 2.0, a third peak appears for at large Ω (Figure 13c). It is clear however, regardless of peaks and valleys of the dynamic response curve, the accidental torsion response generally trends to a decrease with increase in Ω. The results offer structural designers the potential to select suitable the lateral force resisting system stiffness within each range of Ω in order to valley regions of the curves and hence minimize accidental torsion.

4.3. Comparing Accidental Torsion Response for Various Building Aspect Ratios using Static and Dynamic Analyses

Static analysis produces more conservative assessment of accidental torsion compared to dynamic analysis for building systems with Ω < 1.0, as shown in Figure 1, Figure 2, Figure 3, Figure 4, Figure 5, Figure 6, Figure 7, Figure 8, Figure 9, Figure 10, Figure 11, Figure 12 and Figure 13. Moreover, for buildings with floor plan aspect ratio of 1.0, i.e., roughly square floor plan (b/r = 2.45), and having Ω << 1.0, static analysis is very conservative compared to dynamic analysis.
Further examination of the response quantity u ^ b / 2 for structures with Ω = 1.0, indicates that buildings that are square in plan geometry (b/r = 2.45) are less susceptible to accidental torsion than buildings that are more rectangular in plan. Regardless of the fundamental period, the normalized edge displacement, u ^ b / 2 , for building with Ω = 1.0 are less in buildings with square geometry as shown in Figure 11, Figure 12, and Figure 13c, compared to buildings that are rectangular in plan (Figure 5c, Figure 6c, Figure 7c, Figure 8c, Figure 9c and Figure 10c).

4.4. The Drop in Accidental Torsion Response Obtained through Dynamic Analysis of Buildings with Uncoupled Frequency Ratio Ω = 1

Dynamic analysis in the previous sections of this article demonstrated that a consistent drop in accidental torsion response decreases as uncoupled frequency ratio approaches Ω = 1. It is worthy however to note that the accidental torsion response based on dynamic analysis, within the range of Ω values covered in this study, is characterized by a curve of consisting of two peaks and some valleys.
It is important to shed more light on the structural stiffness circumstances that would lead to the drop in accidental torsion response of building structures having uncoupled torsional frequency Ω = 1 when dynamic analysis is used. To this end, accidental torsion evaluation method stipulated in Eurocode 8 (EC 8) is presented and discussed. To this end, in next paragraphs we discuss the concepts of floor plan irregularity, torsional behavior, and torsional radius in Eurocode 8 (EC 8).
Similar to other codes, EC 8 requires that building floor plans should be classified as regular or non-regular for the purpose of seismic deigns. Some of the criteria for a building to be classified as regular in plan stipulated in EN 1998-1 (4.2.3.2) are:
  • The slenderness of the building floor plan, which is the ratio of larger to the smaller plan dimensions measured in orthogonal directions, shall not be higher than 4.
  • The structural eccentricity shall be smaller than 30% of the torsional radius.
  • In each analysis direction X- and Y-, the torsional radius, Tr, shall be larger than the radius of the gyration of the floor mass, r, in plan.

4.4.1. Determination of the Torsional Radii and Radius of Gyration

Torsional radius is proportional to square of the ratio of the torsional stiffness with respect to the center of stiffness to the lateral stiffness of the story. Equivalently, the torsional radii in the X- and Y- analysis directions, Trx and Try, are related to the torsional stiffness, Km, and lateral stiffness, Kfx (or Kfy), by Equation (9).
T r x = K m K f x ,   T r y = K m K f y
The lateral and torsional stiffnesses can be determined by applying independently static unit lateral forces ( F t x = 1 , F t y = 1 ) and unit rotation M t = 1 at the centre of stiffness. The corresponding translation and rotation values, U x , U y , R z are measured. The torsional and lateral stiffness are calculated using Equation (10).
K m = 1 R z ( M t = 1 ) ,   K f x = 1 U x ( F t x = 1 ) ,   K f y = 1 U y ( F t y = 1 )
The radius of gyration, r, was defined earlier in this article and can be computed using Equation (7).

4.4.2. Investigating Torsional Radius and Radius of Gyration on Torsional Response

The Torsional radius, Tr, and radius of gyration, r, were computed for the case study consisting of 72 floor plans, described earlier in this article. These properties were computed using lateral forces and moments about the center of stiffness such that Fxi = Fyi = 106 kN and Mt = 106 kN.m. The torsional radius, Tr, is plotted for the range of Ω covered in this study and the results are shown in Figure 14 (b/r = 1.1), Figure 15 (b/r = 1.4) and Figure 16 (b/r = 2.45). Each of the three figures shows the radius of gyration computed Equation (7).
Based on Figure 14, Figure 15 and Figure 16, the following observations are made:
  • Torsionally flexible buildings ( Ω < 1 ) have torsional radius that is less than the building radius of gyration. Conversely, stiff buildings ( Ω > 1 ) have torsional radius that is greater than building radius of gyration.
  • Torsional radius of the floor plan as defined in EC 8 serves the same purpose as the uncoupled frequency ratio Ω as indicator of susceptibility of the floor plan to accidental torsion.
  • Floor plans with unit frequency (Ω = 1) have torsional radius equal to the traditional building radius of gyration.
Clearly, the torsional radius increases with an increase in Ω, as this frequency ratio is in fact an indicator of the building torsional flexibility. Floor plan and its structural system may be viewed as torsionally rigid when the torsional radius is less than the radius of gyration which occurs when Ω < 1.0. On the other hand, a floor plan and its structural system is torsionally flexible when the torsional radius is larger than the radius of gyration which occurs when Ω > 1.0.
When Ω = 1, the floor plan and its structural systems falls in the boundary between torsionally rigid and flexible systems in terms of seismic response. If the translational and torsional stiffnesses of the floor plan are such that it the translation period T x (or T y ) is equal to the torsional period T θ , the structural response is neither rigid nor flexible and the drop in torsional response demonstrated in Figure 5, Figure 6, Figure 7, Figure 8, Figure 9, Figure 10, Figure 11, Figure 12 and Figure 13 is observed when dynamic analysis is performed.
It is worthy to note that classification of buildings as torsionally rigid or flexible based on the frequency ratio and/or torsional radius, as well as the presence of the boundary frequency ratio Ω = 1, are not sensitive to the fundamental period. This is confirmed by Figure 13, Figure 14 and Figure 15 where the translation periods were examined in three regions T < 1.0 s, 1.0 s < T < 2.0 s, and T > 2.0 s.

4.5. Accidental Torsion Design Factor–Design Correlation between Frequency Ratio and Accidental Torsion Response

As demonstrated earlier, predicting accidental torsion response quantities using static analysis based on ASCE 7-16 and dynamic analysis procedures produce, expectedly different results. While Figure 5, Figure 6, Figure 7, Figure 8, Figure 9, Figure 10, Figure 11, Figure 12 and Figure 13 confirm that accidental torsion response based on dynamic analysis follows specific patterns, the magnitudes of the response quantity u ^ b / 2 varied significantly based on the geometric floor plan ratio b/r, as well as the frequency ratio Ω. In this section, we propose an accidental torsion response spectrum, At, that is function of the floor plan ratio b/r and Ω.
The spectrum parameter At is a predictor for the accidental torsion response. Through examination of the accidental torsion response data that were presented graphically in Figure 5c, Figure 6c, Figure 7c, Figure 8c, Figure 9c, Figure 10c, Figure 11c, Figure 12c and Figure 13c, the following At response spectrum values are proposed:
  • The accidental torsion response factor, At will have a constant value for frequency ratios ranging from Ω = 0 to Ω = 1. The value of At is equal to the maximum response of the buildings for a specific b/r ratio. This a conservative simplification is shown in Figure 17, where the drop in response at Ω = 1 is avoided.
  • The maximum response parameter, At, will then will then decrease linearly to zero as the frequency ration Ω increase up to Ω = Ωc = 1.8. As shown in Figure 11c and Figure 13c, the normalized accidental torsion response at a frequency ratio of 1.8 is very small, as such buildings are torsionally stiff. This frequency ratio as characteristic of torsionally stiff buildings was also reported in the literature [6].
The two points above are summarized in Equation (11).
u ^ b / 2 = { A t where   0 Ω 1 [ ( A t 1 ) × ( Ω c Ω Ω c 1 ) ] + 1 where   1 < Ω < Ω c 0 where   Ω > Ω c
Through statistical analysis of the normalized accidental torsion response data presented in Figure 5, Figure 6, Figure 7, Figure 8, Figure 9, Figure 10, Figure 11, Figure 12 and Figure 13, Equation (12) is developed to correlate the response parameter At as a function of the floor plan ratio b/r. Equation (12) is represented graphically by Figure 18.
A t = 0.8263 e 0.1873 ( b r ) ,

4.6. Discussion

In this study accidental torsion response of buildings subjected to earthquake ground motion is evaluated. A parametric investigation is carried out on different multi-story symmetrical buildings configurations having different ratio of uncoupled torsional to translation frequency and different floor plan geometric aspect ratios. Accidental torsion response for the case study structures was determined using dynamic analysis as well as ASCE 7-16 static analysis.
Dynamic analysis results of accidental torsion response showed that for all building translation periods, b/r ratios, the coupled frequency ratio, Ω, gives an indication of buildings torsional rigidity. Buildings with uncoupled torsional to translational uncoupled frequency ratio Ω > 1 are torsionally stiff and exhibit high relative modal mass in horizontal Y-direction and little or zero rotation around the vertical Z-axis in the first or second fundamental mode. On the other hand, buildings with uncoupled torsional to translational uncoupled frequency ratio, Ω < 1, are torsionally flexible and exhibit high relative modal mass rotation around the vertical Z-axis and little or zero relative modal mass in the horizontal Y-direction in the first or second fundamental mode.
Accidental torsion response predicted using dynamic analysis procedures is different from response obtained using ASCE 7-16 static analysis. The buildings responses calculated using ASCE 7-16 static analysis are more conservative for flexible structures of torsional to translation frequency ratio Ω < 0.7~0.8, while for stiffer buildings results obtained using static analysis are less conservative. The response amplification factor, Ax, that characterizes the static analysis method appears to target structures with frequency ratio Ω < 0.7~0.8, particularly to address amplification of torsionally irregular floor diaphragms, but the results as shown in Figure 5, Figure 6, Figure 7, Figure 8, Figure 9, Figure 10, Figure 11, Figure 12, Figure 13 and Figure 14 are conservative compared to dynamic analysis. Static analysis provides unconservative prediction of accidental torsion response for stiffer structures with frequency ratios greater the range 0.7–0.8 as shown in Figure 5, Figure 6, Figure 7, Figure 8, Figure 9, Figure 10, Figure 11, Figure 12 and Figure 13, compared to dynamic analysis. The actual frequency ratio in the range 0.70–0.8 at which static analysis changes from conservative to unconservative depends on the specific frequency ratio of the floor plan.
The normalized edge displacements due accidental torsion for buildings that are rectangular in plan is higher than normalized edge displacement for square buildings regardless of translation period and uncoupled frequency ratio.
The general trend in rectangular buildings response demonstrated by Figure 5, Figure 6, Figure 7, Figure 8, Figure 9 and Figure 10 is that increase in torsional rigidity of the floor plan and its structural system decreases the accidental torsion response, except when the frequency ratio is Ω = 1.0 where a consistent decrease in response predicted using dynamic response occurs regardless of the building period. The same drop in accidental torsion response for floors with Ω = 1 is noted in square buildings as shown in Figure 11, Figure 12 and Figure 13. Static analysis was not able to capture this response drop due to the consistent approach of using the amplification factor, Ax, for all frequency ratios. The decrease in response captured by dynamic analysis was also noted in published literature [6,14]. When the frequency ratio equal unity, the torsion radius described earlier in this article equals to the radius of gyration. Eurocode 8 uses the torsional radius to classify floors and their structural systems as torsionally rigid or flexible. Torsionally flexible buildings will have frequency Ω < 1.0 or torsional radius less than the radius of gyration.

5. Conclusions

The following conclusions can be drawn from present study;
  • Dynamic analysis indicates that buildings with uncoupled torsional to translational uncoupled frequency ratio Ω > 1.0 are torsionally stiff while buildings with uncoupled torsional to translational uncoupled frequency ratio Ω < 1 are torsionally flexible.
  • The normalized edge displacements due accidental torsion for buildings that are square in floor plan are less than normalized edge displacement for rectangular buildings having the same period and uncoupled frequency ratio.
  • The static analysis based on ASCE 7-16 produces higher accidental torsion response compared to dynamic analysis for torsionally flexible buildings with frequency ratio 0.7 Ω 0.8 , depending on the ratio diaphragm plan ratio b/r. Conversely, for torsionally stiff buildings with frequency ratio higher than the indicated rate, dynamic analysis predicts higher accidental torsion response. This indicates that ASCE 7-16 amplification factor Ax is responsible for the conservative estimate of accidental torsional in torsionally flexible structures.
  • When dynamic analysis is used, a drop in building accidental torsional response is noted at frequency ratio Ω = 1 disrupting the generic trend of decreasing response with increase in torsional stiffness. In addition, at this frequency ratio, the torsional radius equal to building radius of gyration. Static analysis using ASCE 7-16 does not capture the drop in torsion response at Ω = 1.
  • Buildings with uncoupled frequency ratio Ω > 1.8 or torsional radius Tr > 1.8 times the radius of gyration r, are torsionally very stiff buildings and either static or dynamic analysis methods predict similar accidental torsion.

Author Contributions

Conceptualization, O.A.M. and M.S.M.; methodology, M.S.M.; software, M.S.M.; validation, O.A.M.; formal analysis, O.A.M.; investigation, O.A.M.; resources, M.S.M.; data curation, M.S.M.; writing—original draft preparation, M.S.M.; writing—review and editing, O.A.M.; visualization, M.S.M.; supervision, O.A.M.; project administration, O.A.M.; funding acquisition, M.S.M. All authors have read and agreed to the published version of the manuscript.

Funding

Funding was provided by the Office of Research and Sponsored Programs (ORSP) at Abu Dhabi University under grant #19300376.

Acknowledgments

We thank College of Engineering in Abu Dhabi University for the administrative and technical support given.

Conflicts of Interest

The authors declare no conflict of interest.

References

  1. American Society of Civil Engineers. Minimum Design Loads for Buildings and Other Structures; ASCE: Reston, VA, USA; SEI: Oaks, PA, USA, 2017; pp. 7–16. [CrossRef]
  2. Ryall, M.J.; Hewson, N.; Parke, G.A.R.; Harding, J.E. (Eds.) The Manual of Civil Structures (MOC); Thomas Telford: London, UK, 2008. [Google Scholar]
  3. Associate Committee on the National Building Code. National Building Code of Canada; National Research Council of Canada: Ottawa, ON, Canada, 2005. [Google Scholar]
  4. Basu, D.; Constantinou, M.C.; Whittaker, A.S. An equivalent accidental eccentricity to account for the effects of torsional ground motion on structures. Eng. Struct. 2014, 69, 1–11. [Google Scholar] [CrossRef]
  5. De-la-colina, J.; Gonzalez-Perez, C.A.; Valdes-Gonzalez, J. Accidental eccentricities, frame shear forces and ductility demands of buildings with uncertainties of stiffness and live load. Eng. Struct. 2016, 124, 113–127. [Google Scholar] [CrossRef]
  6. De la Llera, J.C.; Chopra, A.K. Estimation of Accidental Torsion Effects for Seismic Design of Buildings. J. Struct. Eng. 1995, 121, 102–114. [Google Scholar] [CrossRef]
  7. De la Llera, J.C.; Chopra, A.K. Using accidental eccentricity in code-specified static and dynamic analyses of buildings. Earthq. Eng. Struct. Dyn. 1994, 23, 947–967. [Google Scholar] [CrossRef]
  8. Mehana, M.S.; Mohamed, O.A.; Isam, F. Torsional Behavior of Irregular Buildings with Single Eccentricity. In Proceedings of the IOP Conference Series: Materials Science and Engineering, Bangkok, Thailand, 17–19 May 2019; Volume 603, p. 052028. [Google Scholar] [CrossRef]
  9. De la Llera, J.C.; Chopra, A.K. Accidental torsion in buildings due to stiffness uncertainty. Earthq. Eng. Struct. Dyn. 1994, 23, 117–136. [Google Scholar] [CrossRef]
  10. DeBock, D.J.; Liel, A.B.; Haselton, C.B. Importance of seismic design accidental torsion requirements for building collapse capacity. Earthq. Eng. Struct. Dyn. 2014, 43, 831–850. [Google Scholar] [CrossRef]
  11. De la Llera, J.C.; Chopra, A.K. Evaluation of Code Accidental-Torsion Provisions from Building Records. J. Struct. Eng. 1994, 120, 597–616. [Google Scholar] [CrossRef]
  12. Newmark, N.M. Fundamentals of Earthquake Engineering; Prentice Hall: Upper Saddle River, NJ, USA, 1974. [Google Scholar]
  13. Computers and Structures Inc. ETABS-Integrated Analysis, Design, and Drafting of Buildings System, Analysis Manual; Computers and Structures Inc: California, CA, USA, 2015. [Google Scholar]
  14. De la Llera, J.C.; Chopra, A.K. Accidental torsion in buildings due to base rotational excitation. Earthq. Eng. Struct. Dyn. 1994, 23, 1003–1021. [Google Scholar] [CrossRef]
Figure 1. Typical single eccentric system showing center of mass (CM) and eccentric center of rigidity (CR).
Applsci 10 05509 g001
Figure 2. Building plans for first group of parametric study (with b/r = 1.1): (a) Building frequency ratio Ω = 1.4; (b) Building frequency ratio Ω = 1.3; (c) Building frequency ratio Ω = 1.2; (d) Building frequency ratio Ω = 1.1; (e) Building frequency ratio Ω = 1.0; (f) Building frequency ratio Ω = 0.9; (g) Building frequency ratio Ω = 0.8; (h) Building frequency ratio Ω = 0.7.
Applsci 10 05509 g002
Figure 3. Building plans for second group of parametric study (with b/r = 1.4): (a) Building frequency ratio Ω = 1.4; (b) Building frequency ratio Ω = 1.3; (c) Building frequency ratio Ω = 1.2; (d) Building frequency ratio Ω = 1.1; (e) Building frequency ratio Ω = 1.0; (f) Building frequency ratio Ω = 0.9; (g) Building frequency ratio Ω = 0.8; (h) Building frequency ratio Ω = 0.7.
Applsci 10 05509 g003
Figure 4. Building plans for third group of parametric study (with b/r = 2.45): (a) Building frequency ratio Ω = 1.5; (b) Building frequency ratio Ω = 1.4; (c) Building frequency ratio Ω = 1.3; (d) Building frequency ratio Ω = 1.15; (e) Building frequency ratio Ω = 1.1; (f) Building frequency ratio Ω = 1.0; (g) Building frequency ratio Ω = 0.85; (h) Building frequency ratio Ω = 0.7.
Applsci 10 05509 g004
Figure 5. Normalized flexible edge displacement (with b/r = 1.1, Ty < 1 s): (a) Static edge displacement; (b) Dynamic edge displacement; (c) Static vs. dynamic edge displacement.
Applsci 10 05509 g005
Figure 6. Normalized flexible edge displacement (with b/r = 1.1, 1 < Ty < 2 s): (a) Static edge displacement; (b) Dynamic edge displacement; (c) Static vs. dynamic edge displacement.
Applsci 10 05509 g006
Figure 7. Normalized flexible edge displacement (with b/r = 1.1, Ty > 2 s): (a) Static edge displacement; (b) Dynamic edge displacement; (c) Static vs. dynamic edge displacement.
Applsci 10 05509 g007
Figure 8. Normalized flexible edge displacement (with b/r = 1.4, Ty < 1 s): (a) Static edge displacement; (b) Dynamic edge displacement; (c) Static vs. dynamic edge displacement.
Applsci 10 05509 g008
Figure 9. Normalized flexible edge displacement (with b/r = 1.4, 1 < Ty < 2 s): (a) Static edge displacement; (b) Dynamic edge displacement; (c) Static vs. dynamic edge displacement.
Applsci 10 05509 g009
Figure 10. Normalized flexible edge displacement (with b/r = 1.4, Ty > 2 s): (a) Static edge displacement; (b) Dynamic edge displacement; (c) Static vs. dynamic edge displacement.
Applsci 10 05509 g010
Figure 11. Normalized flexible edge displacement (with b/r = 2.45, Ty < 1 s): (a) Static edge displacement; (b) Dynamic edge displacement; (c) Static vs. dynamic edge displacement.
Applsci 10 05509 g011
Figure 12. Normalized flexible edge displacement (with b/r = 2.45, 1 < Ty < 2 s): (a) Static edge displacement; (b) Dynamic edge displacement; (c) Static vs. dynamic edge displacement.
Applsci 10 05509 g012
Figure 13. Normalized flexible edge displacement (with b/r = 2.45, Ty > 2 s): (a) Static edge displacement; (b) Dynamic edge displacement; (c) Static vs. dynamic edge displacement.
Applsci 10 05509 g013
Figure 14. Torsional radius for buildings with (r = 21.9 m & b/r = 1.10): (a) Building period T < 1 s; (b) Building period 1 < T < 2 s; (c) Building period T > 2 s.
Applsci 10 05509 g014
Figure 15. Torsional radius for buildings with (r = 22.7 m & b/r = 1.40): (a) Building period T < 1 s; (b) Building period 1 < T < 2 s; (c) Building period T > 2 s.
Applsci 10 05509 g015
Figure 16. Torsional radius for buildings with (r = 19.6 m & b/r = 2.45): (a) Building period T < 1 s; (b) Building period 1 < T < 2 s; (c) Building period T > 2 s.
Applsci 10 05509 g016
Figure 17. De la Llera Juan C. and Chopra Anil K. [6] proposed method and dynamic analysis normalized edge displacement.
Applsci 10 05509 g017
Figure 18. De la Llera Juan C. and Chopra Anil K. [6] proposed design factor to calculate normalized edge displacement, (At).
Applsci 10 05509 g018
Table 1. Site and Building Parameters.
Site and Building DataValue
Site classC
Seismic design categoryC
0.2 s spectral acceleration (Ss)0.6
1 s spectral acceleration (S1)0.18
Risk categoryII
Response modification factor (R)5
Deflection amplification factor (Cd)4.5
Table 2. Modal Participating Mass Ratio Buildings (with b/r = 3.28, 1 < Ty < 2 s, Ω = 1.4).
ΩModePeriod (Sec.)UXUYUZRXRYRZ
1.411.23400.668700.345200
21.010.66930000.34410
30.889000000.6615
Table 3. Modal Participating Mass Ratio Buildings (with b/r = 3.28, 1 < Ty < 2 s, Ω = 1.0).
ΩModePeriod (Sec.)UXUYUZRXRYRZ
1.011.18200.67300.341300
21.178000000.6715
31.0070.66950000.34390
Table 4. Modal Participating Mass Ratio Buildings (with b/r = 3.28, 1 < Ty < 2 s, Ω = 0.7).
ΩModePeriod (Sec.)UXUYUZRXRYRZ
0.711.475000000.6818
21.12700.676700.339400
30.9550.6760000.33940
Table 5. Modal Participating Mass Ratio Buildings (with b/r = 3.16, 1 < Ty < 2 s, Ω = 1.4).
ΩModePeriod (Sec.)UXUYUZRXRYRZ
1.411.3270.66160000.34960
21.28100.670600.341700
30.886000000.6639
Table 6. Modal Participating Mass Ratio Buildings (with b/r = 3.16, 1 < Ty < 2 s, Ω = 1.0).
ΩModePeriod (Sec.)UXUYUZRXRYRZ
1.011.3210.66190000.34920
21.19800.677400.335500
31.172000000.6733
Table 7. Modal Participating Mass Ratio Buildings (with b/r = 3.16, 1 < Ty < 2 s, Ω = 0.7).
ΩModePeriod (Sec.)UXUYUZRXRYRZ
0.711.491000000.6801
21.2140.67050000.3430
31.15200.680200.334400
Table 8. Modal Participating Mass Ratio Buildings (with b/r = 2.45, 1 < Ty < 2 s, Ω = 0.8).
ΩModePeriod (Sec.)UXUYUZRXRYRZ
0.811.354000000.6754
21.2550.67210000.34020
31.08500.687300.326600
Table 9. Modal Participating Mass Ratio Buildings (with b/r = 2.45, 1 < Ty < 2 s, Ω = 1.3).
ΩModePeriod (Sec.)UXUYUZRXRYRZ
1.311.3870.66220000.3480
21.22500.675400.336400
30.96000 00.6672
Table 10. Modal Participating Mass Ratio Buildings (with b/r = 2.45, 1 < Ty < 2 s, Ω = 1.0).
ΩModePeriod (Sec.)UXUYUZRXRYRZ
1.011.3360.66610000.3460
21.08400.687400.326500
31.067000000.6762

