Abstract
In order to improve the inadequacy of the current research on oil droplet size distribution in aero-engine bearing chamber, the influence of oil droplet size distribution with the oil droplets coalescence and breakup is analyzed by using the computational fluid dynamics-population balance model (CFD-PBM). The Euler–Euler equation and population balance equation are solved in Fluent software. The distribution of the gas phase velocity field and the volume fraction of different oil droplet diameter at different time are obtained in the bearing chamber. Then, the influence of different initial oil droplet diameter, air, and oil mass flow on oil droplet size distribution is discussed. The result of numerical analysis is compared with the experiment in the literature to verify the feasibility and validity. The main results provide the following conclusions. At the initial stage, the coalescence of oil droplets plays a dominant role. Then, the breakup of larger diameter oil droplet appears. Finally, the oil droplet size distribution tends to be stable. The coalescence and breakup of oil droplet increases with the initial diameter of oil droplet and the air mass flow increasing, and the oil droplet size distribution changes significantly. With the oil mass flow increasing, the coalescence and breakup of oil droplet has little change and the variation of oil droplet size distribution is not obvious.
1. Introduction
The bearing chamber is an important part in the aero-engine lubrication system. The lubricating oil is shed into the bearing chamber in the form of oil droplet via under-race lubrication method [1]. After the high-speed moving oil droplets collide with the wall, some of them are deposited to form the oil film, and others are splashed to form a large number of secondary oil droplets. Then, the complex air–oil two phase flow and heat transfer state of air, oil droplet, and oil film coexist in the bearing chamber. Because the oil droplet size is very small, many secondary oil droplets are suspended in the bearing chamber under the action of the air phase flow field. Furthermore, the interaction between oil droplets induces many dynamic events, such as collision, coalescence, deposition, evaporation, breakup, etc. The coalescence and breakup of oil droplets will affect the size distribution of secondary oil droplets and further restrict the research of flow and heat transfer in the bearing chamber. Moreover, the oil droplet size distribution directly affects the mixture state of oil and gas. Previously the Rosin–Rammler (R–R) distribution is widely used for the calculation of oil droplet size distribution in bearing chamber. However, experimental research indicates that R–R distribution is not consistent with the actual condition. Therefore, the study of droplet diameter distribution of the secondary oil droplets, which considers the coalescence and breakup of oil droplets, is of great significance in the aero-engine lubrication design.
At present, the research on coalescence and breakup of oil droplets mostly adopts the population balance model, which is earliest used in chemical process by Hulbert et al. [2]. Since then it has become a general method to analyze the particle diameter distribution of dispersed phase in multiphase system. The population balance model describes the time and space distribution of discrete phase by tracing the change of number density function of discrete phase with convection, diffusion and the source term of coalescence and breakup in the flow field. This method has been widely used because it remains part of the size information of discrete phase, and uses the averaging method to describe the motion of continuous phase, which reduces computation greatly. The core of population balance model lies in the profound understanding of coalescence and breakup mechanism of oil droplets. The coalescence and breakup of oil droplets is affected by the flow field around the droplets and the physical parameters (such as surface tension) of the oil droplet, which involves a very complicated multi-level and multiscale physical mechanism. The mechanism description of oil droplet breakup can be divided into three categories: (1) the droplet breakup caused by turbulence, (2) the droplet breakup caused by viscous shear force, and (3) the droplet breakup caused by the instability of the liquid–liquid interface. The coalescence mechanism of oil droplet is more complex. Moreover, the probability model is used more often, as the coalescence rate of oil droplet is equal to the product of collision frequency and coalescence efficiency between oil droplet. The collision mechanism of oil droplet can be divided into four categories: (1) collision caused by random turbulence fluctuation, (2) collision caused by buoyancy, (3) collision caused by shear force, and (4) collision induced by wave vortex. The coalescence efficiency model can be divided into three categories: energy model, velocity model, and liquid membrane drainage model.
During the past decades, many scholars have done many researches on the coalescence and breakup of bubbles/droplet and the size distribution of bubbles/droplet. Liao and Lucas et al. [3,4] reviewed the coalescence and breakup model of liquid, and introduced the research process of oil droplet coalescence and breakup mechanism. Ramkrishna et al. [5] investigated the effect of coalescence and breakup of oil droplet on the size distribution by using the population balance model, and further studied the flow behavior of liquid–liquid system from mechanism. Coulaloglou and Tavlarides et al. [6] assumed that the oscillating droplet will break up when the turbulent kinetic energy transmitted by the turbulent vortex to the droplet exceed the surface energy of the droplet, but the two droplets will coalesce when the contact time exceed the film discharge time of the two droplets. Tsouris and Tavlarides et al. [7] studied the droplet coalescence behavior in the turbulent using high-speed imaging technology and population balance model, proposed a novel collision frequency model, and compared the predicted droplet diameter with the experimental data. The results show that the model is applicable under different discrete phase fraction. Luo and Svendsen et al. [8] established a bubble breakup model, in which the bubble breakup rate is equal the product of the collision frequency with the turbulent vortex and the bubble breakup efficiency.
Regarding the solution of the population balance equation, Li et al. [9] used the quadrature method of moments (QMOM) to study the droplet breakup and coalescence behavior of the liquid–liquid dispersion system in the stirred reactor. The results show that the droplet coalescence behavior occurs with some difficultly in the low discrete phase fraction, due to the small probability of droplet collision. Li et al. [10] reviewed the CFD-PBM simulation in extraction column, and the principles and advantages and disadvantages of different solving methods of population balance model were compared. Xing et al. [11] used the experimental method and CFD-PBM coupled model to analyze the influence of viscosity in the bubble bed on the hydrodynamic behavior in the bubble area, such as the total gas holdup, the big and small bubble holdup, and the bubble size distribution. The results show that the CFD-PBM coupled model has a good prediction ability for the hydrodynamic behavior of the bubble bed in a wide range of gas velocities and viscosities. Wang et al. [12,13] used the population balance model to describe the bubble size distribution in the gas–liquid system, considered the different mechanism of bubble coalescence and breakup, established a relatively mature bubble coalescence and breakup model, and calculated the bubble size distribution in the gas–liquid system by numerical solution of PBM. Zhao et al. [14] used a multi-Monte Carlo algorithm to simulate the collision and coalescence process of particles in nanoparticle flow, and the simulation results were in good agreement with the direct numerical simulation results. Chen et al. [15] analyzed the parameter relationship between the structural condition of bearing chamber and the oil droplet size distribution, clarified the oil droplet mass distribution based on the continuous oil drop size distribution, and introduced the concept of continuous oil droplet diameter into the analysis of oil droplet movement. Glahn et al. [16] measure the size distribution of oil droplet using the phase Doppler particle analyzer (PDPA) technology under various operating condition in the rotating disk chamber. In conclusion, the population balance theory has been widely applied in the analysis of coalescence and breakup between bubbles and droplets. However, no relevant research work has been done to consider the influence of coalescence and breakup on the oil droplet size distribution in the bearing chamber.
Therefore, based on the population balance model, the coalescence and breakup behaviors of oil droplets are described through the coalescence and breakup model of the oil droplet. Then, the air–oil two-phase flow model and the population balance model are solved by Fluent software. The numerical simulation of the coalescence and breakup processes of the oil droplet in a bearing chamber is performed. The air phase velocity distribution and the volume fraction of the oil droplets at different times are discussed. Moreover, the variation rules of oil droplet size distribution are obtained in different initial oil droplet diameter, air inflow, and oil inflow. The coalescence and breakup of oil droplets can change the size distribution of secondary oil droplets. Moreover, the oil droplet size distribution directly affects the mixture state of oil and gas. The research work in this paper can improve the accuracy of air–oil two-phase flow and heat transfer analysis, and provide reference for further research on oil mist concentration test in the aero-engine bearing chamber.
2. Numerical Model
2.1. Geometric Model and Physical Parameters
The geometric structure of the bearing chamber is shown in Figure 1. The structural parameters and values of the bearing chamber involved in the analysis mainly include the rotor radius of the bearing, rs = 60 mm; the height of the bearing chamber, hb = 30 mm; the width of the bearing chamber, wb = 30 mm; and the diameter of oil scavenge ds (scavenge is shown in Figure 2) and the air vent dv are both 16 mm. Seal air flows into the bearing chamber from air inlet and discharges through vent. The gap of oil inlet is 2 mm. Moreover, the lubricating oil is shed into the bearing chamber from the clearance between the bearing outer ring and the cage (oil inlet in Figure 1) and discharges through scavenge. The equivalent size of oil inlet is 4 mm (oil inlet in Figure 2).
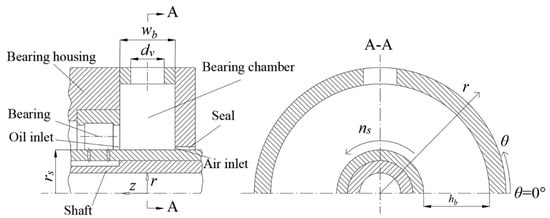
Figure 1.
The structural diagram of aero-engine bearing chamber.
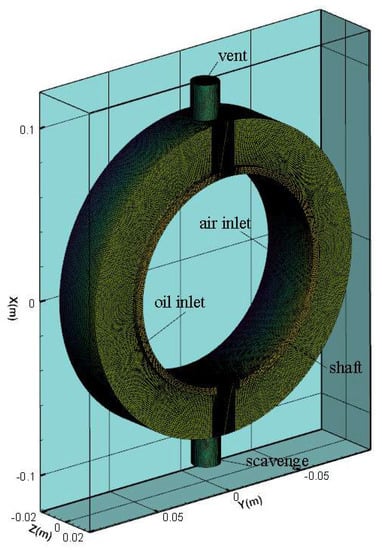
Figure 2.
Grid model of the bearing chamber.
In the analysis, the oil brand [17] is aviation lubricating oil 4109. The oil density ρl is 926 kg/m3, the oil dynamic viscosity μl is 0.007 Pa·s, and the oil surface tension coefficient σl is 0.035 N/m. The gas density ρg is 1.225 kg/m3 and the air dynamic viscosity μg is 1.789 × 10⁻⁵ Pa·s.
2.2. Mesh Model and Grid Independence Verification
According to the structural parameters of the bearing chamber, Gambit software is used to build up the geometric model of the flow region, hexahedral grids are used to discrete the flow region, and the grid of air inlet and oil inlet is refined. The grid model is shown in Figure 2.
In order to eliminate the influence of mesh on the calculation, three groups mesh with different size are generated on the gambit platform, and the number of meshes is 487,585, 609,719, and 1,530,258, respectively. Under the condition of air inflow 12 g/s, the air phase velocities at four position are extracted on the section z = 0, and the four coordinate points are as follows; (−0.11,0,0), (−0.09,0,0), (0.09,0,0), (0.11,0,0). The calculation results are shown in Figure 3. From the figure, the velocities at four position obtained by three groups mesh are approximate. In order to save computing cost, the grid model of 609,719 is chosen in this paper.
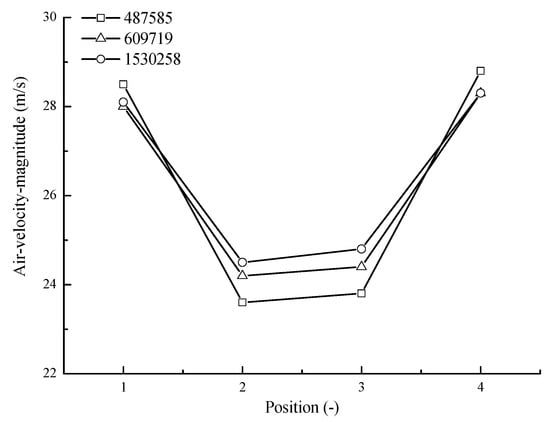
Figure 3.
Verification of grid independence, the number of meshes is 487,585, 609,719, and 1,530,258, respectively, when air inflow is 12 g/s, the air phase velocities at four positions (−0.11,0,0), (−0.09,0,0), (0.09,0,0), and (0.11,0,0) in z = 0 plane.
2.3. Mathematical Model
In the air–oil two-phase flow, the dynamic events of oil droplet include collision, coalescence, breakup, deposition, etc. Under the combined effect of these dynamic events, the oil droplet diameter distribution changes with time. Under a series of physical actions, not only do the conservation of mass, momentum, and energy between oil droplet and air need to be considered, but also the population balance equation needs to describe the oil droplet diameter distribution. Especially, the characteristics of oil droplet collision, coalescence, and breakup are significant in the bearing chamber. It is necessary to focus on the change of oil diameter before and after coalescence and breakup. Therefore, the parameters, such as the volume fraction and velocity of each phase, are obtained by solving the Eulerian–Eulerian two-fluid model, and the dynamic events of oil droplet are described by using the population balance model. The oil droplet diameter distribution with the change of time and space is obtained by combining the two models. The Eulerian–Eulerian two-fluid model and the population balance model in this paper are as follows.
2.3.1. Two-Fluid Model
In two-fluid model [18], the air and oil phase are both treated as interconnected continuous media. As the volume occupied by one phase cannot be occupied by the other, the phase volume fraction is introduced. The volume fraction is a continuous function of space and time, and the sum of the volume fractions of each phase is 1. The volume fraction equation is as follows,
where V is the total volume of air oil two-phase, Vq is the volume of the q phase, αq is the volume fraction of the q phase, and n has two phases: gas is labeled as phase 1 and oil droplet is labeled as phase 2. It should be noted that a two-fluid model can be considered a valid approximation only up to Stokes number ~0.1–0.2. A similar set of continuity equations and momentum equations can be derived for each phase.
The continuity equation is
where is the density of the q phase; is the velocity vector of the q phase.
The momentum equation is
where is the viscous-stress tensors of the q phase, p is the pressure share by gas phase and the liquid phase, is the Reynolds stress tensors, is the gravitational acceleration vector, and is the interfacial force term between the gas phase and liquid phase. When q is oil droplet, is positive; when q is air, is negative. The term is usually composed by three forces: drag, virtual mass, and lift. In present work, only the drag force is taken into account, whereas the others are neglected. The drag force is calculated as follows,
where is the slip velocity and , are the average vector of the air and oil, respectively. CD is the drag coefficient; d32 is the mean Sauter diameter, calculated as the ratio between the moments of order three and two of the droplet size distribution.
In the two-fluid model, the turbulent Reynolds stress should be closed. The Reynolds stress arises from the operation of Reynolds averaging on the momentum equation. In this paper, the k-ε turbulence model [19,20] is selected to close the turbulence term in two fluid model. The turbulence model k-ε can be represented by the following equations,
where k is turbulent kinetic energy; ε is turbulent energy dissipation term; is turbulent viscosity, which can be expressed as , , , , , and are model constants; and is the generating terms of turbulent kinetic energy.
2.3.2. Population Balance Model
The application of the population balance model [21] is used to calculate the oil droplet diameter distribution in the bearing chamber. The transport equation of the oil droplet number density function can be expressed as
In the right-hand side of the equation in turn are the source term (I) generated by coalescence, the sink term (II) generated by coalescence, the source term (III) generated by breakup, and the sink term (IV) generated by breakup. Where is the number distribution function (1/m6), which means the number of oil droplets in the range of V and in unit volume is ; is the coalescence rate function (m3/s) of oil droplets in volume V and V′ due to collision. is the breakup rate function (1/s) of oil droplets in volume V′. is the probability distribution density function (1/m3) of oil droplets in volume , which breaks up from oil droplets in volume V′.
The population balance equation (PBE) is a hyperbolic integral-partial differential equation; only a few simple cases have an analytical solution, so it is necessary to use a numerical method to solve the PBE. At present, the usually used methods include the discrete method, moment method, and Monte Carlo method. Based on the calculation cost and accuracy, the discrete method is used to solve the population balance equation in this paper.
The basic idea of the discrete method is dividing the continuous diameter distribution of oil droplets into N discrete subintervals, and the size of all the droplets in the subinterval is equal to the node value . Meanwhile, the distribution function of the oil droplet number can be approximately as follows,
where Ni is the number of droplets in unit volume.
In most cases, the oil droplet size calculated by the coalescence and breakup model is not consistent with the node value of the subinterval, so it is necessary to allocate such droplets to the node value of the interval in a certain proportion, and the same time guarantee the conservation of the total oil droplet mass and the total number of oil droplet. Based on the above principles, Ramkishna proposes that the ratio of the newly generated droplets in the interval to the node and is and , and satisfies that
By substituting Equations (9), (11), and (12) into Equation (8) and through a series of algebraic transformations, the discrete droplet transport equation is given by Equation (13).
where
After the droplet is broken up, the distribution proportion of each sub interval is expressed as
Luo coalescence model [8] is adopted in this paper. The coalescence rate in model is defined as the frequency of new droplets generated after the collision of two droplets, and the volume of the two oil droplets is and . The coalescence rate is given by
where is the collision frequency; is the probability of coalescence. The collision frequency is obtained by
where is the characteristic velocity of collision between two oil droplets with diameter and , and the number density is and , which is defined as
where is constant, is the density of each phase.
Laakkonen breakup model [22] is adopted in this paper, which considers that the breakup of oil droplet is affected by both surface tension and viscous force; the degree of influence depends on the magnitude of two forces; and the collision model can be expressed as
where .
The probability distribution function of sub droplets is given by
The final breakup frequency is
2.4. Initial and Boundary Conditions
In the transient analysis, the boundary conditions include the inlet and outlet conditions of gas phase and lubricating oil, as well as the relevant wall conditions. The boundary conditions are treated as follows.
- (1).
- Inlet boundary conditions: mass flow is adopted at the air inlet and oil inlet. At the air inlet, the initial air mass flow is 12 g/s. At the oil inlet, the initial oil mass flow is 20 g/s, and initial oil droplet diameter is 28 μm.
- (2).
- Outlet boundary conditions: outlet boundary conditions adopt pressure-outlet and set the liquid reflux rate as 0 to ensure the stability of calculation.
- (3).
- Wall boundary conditions: all walls adopt a no-slip velocity boundary condition. The shaft wall adopts a moving wall and the rotor speed is 16,000 r/min.
The calculation in this paper does not consider the effect of temperature. The oil droplets collision, coalescence, breakup, evaporation and deposition, nucleation and other dynamic events, as well as the geometry of the bearing chamber will affect the oil droplet size distribution in the bearing chamber. However, taking all the factors into account at the same time can make the analysis more complicated. Therefore, the calculation in this paper assumes that the temperature is constant and does not take into account the evaporation of oil droplets and the change of fluid properties.
2.5. Calculation Method
The coalescence and breakup model of the oil droplet in the bearing chamber is solved by using ANSYS Fluent 17.0. The 3D unsteady model is adopted, the first-order upwind scheme is used, and the phase Coupled SIMPLE algorithm modified by pressure and velocity is employed for solving the transient equation. The coalescence and breakup model are as follows. The coalescence model uses the Luo model; the breakup model uses Laakkonen breakup model, in which both surface tension and viscous force are considered; and the oil droplet breakup is combine constrained by two forces, which is closer to the reality. The computation is performed on a Microsoft Windows 10 enterprise 64-bit operation system, and the simulations are run using 40 cores with 192 GB RAM machine.
3. Experimental Verification and Comparison
In order to verify the correctness of the calculation method, the result in this paper is compared with the relevant test in literature [16]. In the literature, the Phase Doppler Particle Analyzer (PDPA) is used to sample 3000 oil droplet diameters in the aero-engine bearing chamber, and the histogram of oil diameter distribution is obtained. The distribution of droplet diameter is in a range of 14 to 120 μm. The operating condition in literature is air inflow mg = 10 g/s and oil inflow VL = 100 L/h. The oil droplet diameter distribution is calculated under these conditions. It should be noted here that in the calculation, the oil droplets larger than 120 μm in diameter are not considered, so only the oil droplet diameter distribution in a range of 10 to 120 μm is calculated. The calculation results are compared with the results in the literature in Figure 4. Through comparison, the calculation results are consistent with the experimental results in the literature, which verifies the rationality of the research method in this paper. The calculation results given in this paper can provide more accurate initial conditions for the analysis of the flow and heat transfer, and also can provide reference for the further test of oil mist concentration in the bearing chamber.
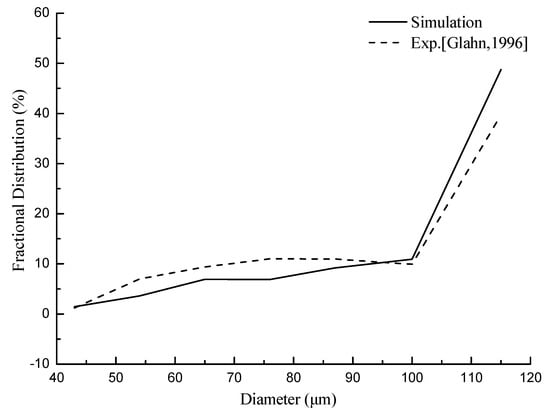
Figure 4.
Comparison and verification of oil drop size distribution.
4. Results and Discussion
In this paper, the distribution of air phase velocity field and the change of oil droplet volume fraction with time in the bearing chamber at different times are analyzed when the air inflow is 12 g/s, oil inflow is 15 g/s and initial oil droplet diameter is 28 μm. Moreover, the influences of different initial oil droplet diameter, air inflow, and oil inflow on the oil droplet diameter distribution are further analyzed. The operating condition parameters are shown in Table 1.

Table 1.
Operating condition.
4.1. The Distribution of Air Phase Velocity Field and the Volume Fraction of Different Oil Droplet Diameter at Different Time
According to the mechanism of oil droplet coalescence and breakup, the turbulence of air phase flow field has a great influence on the coalescence and breakup of oil droplet. Therefore, the velocity of air phase in the bearing chamber is firstly analyzed. Figure 5 shows the distribution of air phase velocity in the bearing chamber at different time when the air inflow is 12 g/s, oil inflow is 15 g/s, and the initial oil droplet diameter is 28 μm. As can be seen from the figure, the velocity near the outlet of the bearing chamber is largest, and the other region is smaller. Because the seal air enters into the bearing chamber from the air inlet, it first moves along the axial direction. When the air is blocked by the wall surface, the velocity changes, which results in an uneven velocity distribution of the flow field. The air velocity in the middle region is significantly lower than that in the inner wall surface and the outer wall surface. Meanwhile, many vortices with different size existed in the bearing chamber. With the passage of time, the flow field structure tends to stable.
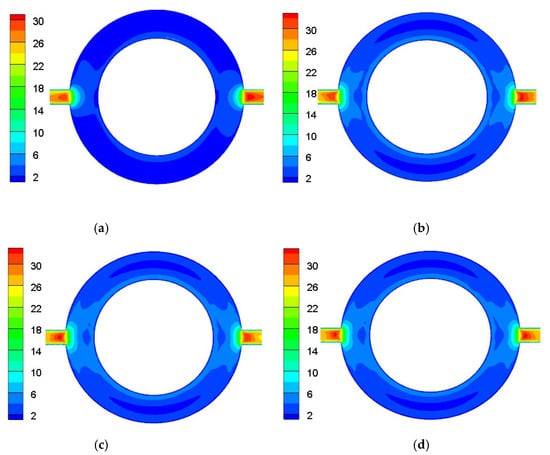
Figure 5.
The velocity (m/s) distribution of air at different time when the air inflow is 12 g/s, oil inflow is 15 g/s, and the initial oil droplet diameter is 28 μm at z = 0 plane (the far left is vent; the far right is scavenge). (a) t = 50 ms; (b) t = 100 ms; (c) t = 200 ms; (d) t = 400 ms.
Figure 6 and Figure 7 show the volume fraction of oil diameter in the range of 56 to 80 μm and 28 to 40 μm when the air inflow is 12 g/s, oil inflow is 15 g/s, and initial oil droplet diameter is 28 μm, respectively. In Figure 6, the volume fraction of the large diameter oil droplet on the outer wall surface of the bearing chamber is large, that near the inlet is relatively low, and gradually increases along the z axial direction. The volume fraction of large diameter oil droplet near the outer wall of the bearing chamber increases gradually with the passage of time. The reason is that the oil droplet flow with the air phase, and enter the bearing chamber from inlet. During the flow process, the oil droplets with smaller diameter constantly gather. When the air phase flow field reaches the wall that is opposite to the inlet, the flow direction of air phase changes and flows along the wall. During the movement of the oil droplet with the air phase flow field, the oil droplets constantly gather again. Therefore, the volume fraction of oil droplets at the external wall surface of the bearing chamber is large. It can also be seen from the figure that when the oil droplet with larger diameter runs to the entrance with larger velocity, the breakup will occur. The oil droplets are coalesced and broken in the bearing chamber, and finally reach a steady state. In Figure 7, the small diameter oil droplet is mainly distributed near the inlet, and this distribution gradually decreases along the axial direction. It can be seen that the size of the oil droplet in the bearing chamber is different because of the coalescence of oil droplets. The small diameter oil droplet is mainly concentrated near the inlet, while the large diameter oil droplet is mainly concentrated on the outer wall of the bearing chamber.
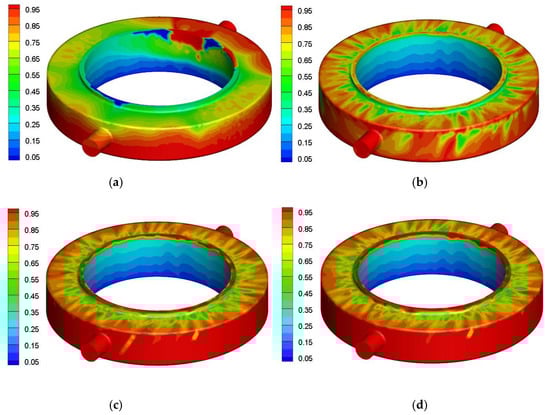
Figure 6.
Oil droplet volume fraction (%) at different time with diameter in the range of 56 to 80 μm when the air inflow is 12 g/s, oil inflow is 15 g/s, and initial oil droplet diameter is 28 μm (the oil inlet is on the bottom, the vent is in front and the z axial direction is up). (a) t = 50 ms; (b) t = 100 ms; (c) t = 200 ms; (d) t = 400 ms.
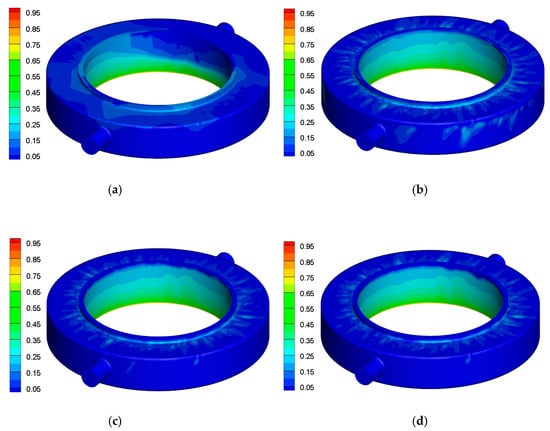
Figure 7.
Oil droplet volume fraction (%) at different time with diameter in the range of 28 to 40 μm when the air inflow is 12 g/s, oil inflow is 15 g/s, and initial oil droplet diameter is 28 μm (the oil inlet is on the bottom, the vent is in front and the z axial direction is up). (a) t = 50 ms; (b) t = 100 ms; (c) t = 200 ms; (d) t = 400 ms.
4.2. The Change Rule of Droplet Size Distribution with Time
The change of oil droplet diameter distribution in the bearing chamber with time when the air inflow is 12 g/s, the oil inflow is 15 g/s, and the initial oil droplet diameter is 28 μm is shown in Figure 8. The oil droplets enter into the bearing chamber, due to the flow field development is not sufficient oil droplets coalesce firstly in the initial stage. Moreover, the volume fraction of large diameter droplets increases simultaneously. Then, the breakup of the oil droplet emerges prominently under the action of gas phase turbulence, and the volume fraction of big diameter droplets decreases. At last oil droplet diameter distribution tends to stable and the size of oil droplet mainly concentrates in the vicinity of 50 μm and 80 μm. From another angle, it shows that the oil droplet size distribution in the bearing chamber is not a simple R–R distribution
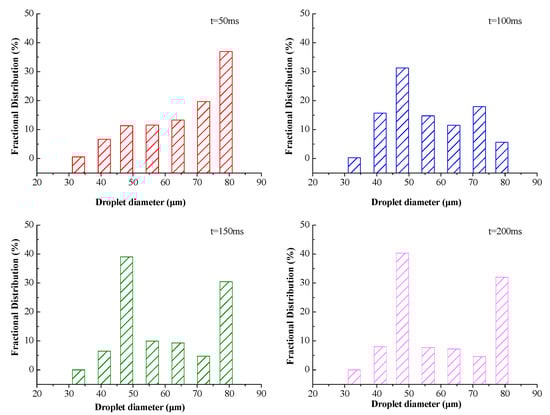
Figure 8.
Droplet size distribution at different time when the air inflow is 12 g/s, the oil inflow is 15 g/s, and the initial oil droplet diameter is 28 μm.
4.3. The Influence of Difference Initial Diameter of Oil Droplet on the Size Distribution
Figure 9 shows the influence of different initial diameter on the oil droplet size distribution in the bearing chamber when the air inflow is 12 g/s and the oil inflow is 15 g/s at t = 250 ms. It can be seen that the influence of the initial diameter of the oil droplet on the volume fraction of different diameter oil droplet is obvious, and the peak diameter moves in the direction of large diameter. When the initial diameter increases to 56 μm, the peak value of oil droplet diameter increases to 70–80 μm. The size of the oil droplet diameter determines the value of the inertia force. The small diameter oil droplet is greatly affected by the air flow field, while the large diameter oil droplet is the opposite. The increasing of the inertia force of oil droplet weakens the moving velocity of the oil droplet, so the coalescence of oil droplet strengthens. Therefore, the proportion of large oil droplet is larger with the initial diameter of oil droplet increasing in the bearing chamber.
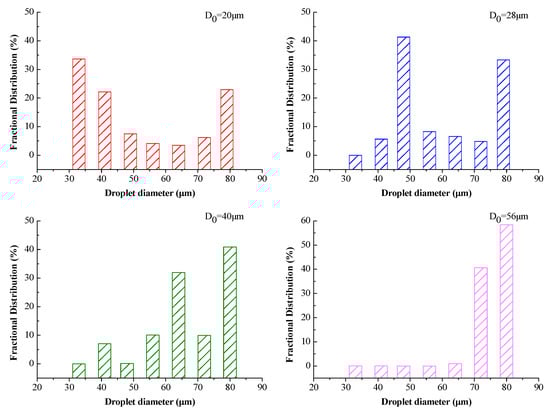
Figure 9.
The influence of initial diameter on oil droplet size distribution when the air inflow is 12 g/s and the oil inflow is 15 g/s at t = 250 ms.
4.4. The Influence of Air Inflow on the Oil Droplet Size Distribution
The change of oil droplet size distribution under different air inflow is shown in Figure 10; when the oil inflow is 15 g/s, the initial oil droplet diameter is 28 μm at t = 250 ms. It can be seen that the peak value of oil droplet diameter is mainly concentrated around 50–80 μm. When the air flow is small, the proportion of oil droplet with 50 μm is larger than that with diameter of 80 μm. With air inflow increasing, the effect of turbulence intensity increases, and the strong disturbance in the flow field and the entrainment of vortices enhance the mutual collision between oil droplets. After the oil droplets collide with each other, the proportion of large diameter oil droplets increases in the oil droplet group due to the adhesion. Meanwhile, the increase of air inflow leads to the increase of oil droplet velocity, which promotes the coalescence between oil droplets. The smaller diameter oil droplet coalesces into larger diameter oil droplets. When the air inflow is 20 g/s, the peak value of oil droplet diameter distribution is mainly around 80 μm. This shows that the air inflow has a significant effect on the oil droplet diameter distribution.
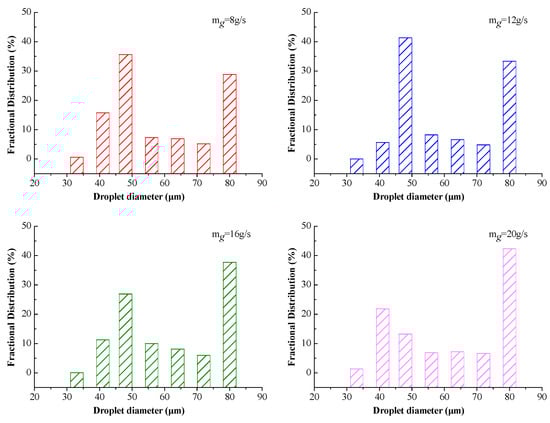
Figure 10.
The influence of air inflow on the oil droplet size distribution when the oil inflow is 15 g/s, the initial oil droplet diameter is 28 μm at t = 250 ms.
4.5. The Influence of Oil Inflow on the Oil Droplet Size Distribution
The oil droplet diameter distribution under different oil inflow when the air inflow is 12 g/s, the initial oil droplet diameter is 28 μm at t = 250 ms is shown in Figure 11. It can be seen that the peak value of oil droplet diameter distribution is concentrated at 45–80 μm. The effect of oil inflow on the distribution is not obvious because the increasing oil inflow only increases the volume fraction of oil in the bearing chamber, but does not change the size distribution of the oil droplets.
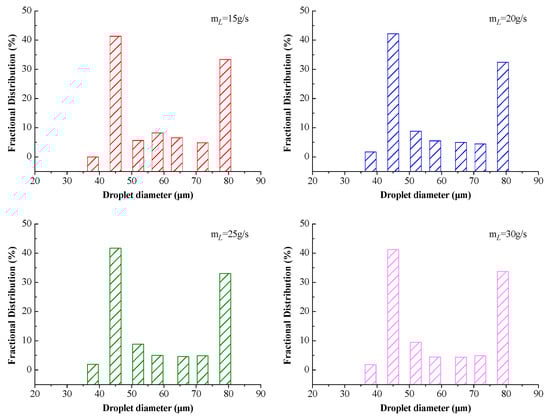
Figure 11.
The influence of oil inflow on the oil droplet diameter distribution when the air inflow is 12 g/s, the initial oil droplet diameter is 28 μm at t = 250 ms.
5. Conclusions
- (1).
- In the initial stage, the oil droplets were mainly coalesced, which makes the volume fraction of the oil droplets with large diameter increase. However, with time elapsing, the oil droplet with large diameter breaks up again, which reduces the volume fraction of the large oil droplet, and the oil droplet size distribution finally tends to stable.
- (2).
- With initial oil droplet diameter and air flow increasing, the enhancement of coalescence and breakup between oil droplets has a significant effect on the oil droplet size distribution. However, the coalescence and breakup between oil droplets did not change significantly with the oil inflow increasing, and the effect on the oil droplet diameter distribution is not notable.
- (3).
- Compared with the experimental results in the literature, the rationality of considering the influence of oil droplet coalescence and breakup on the oil droplet size distribution in the bearing chamber is verified.
The oil droplet size distribution directly affects the mixture state of oil and gas in the bearing chamber. Compared with the R–R distribution, the oil droplet size distribution obtained in this paper is more consistent with the real situation by considering the influence of coalescence and breakup of oil droplets. It can provide more accurate initial conditions for the future calculation of heat transfer coefficient internal and external the bearing chamber.
Author Contributions
Conceptualization, F.W.; Methodology, F.W.; Software, F.W.; Validation, F.W.; Formal Analysis, F.W. Investigation, F.W. and L.W. Writing—original draft preparation, F.W.; Writing—review and editing, F.W., L.W., G.C., and D.Z.; Supervision, G.C.; Project Administration, G.C.; Funding Acquisition, L.W. All authors have read and agreed to the published version of the manuscript.
Funding
This research was funded by the National Natural Science Foundation of China, grant number 51975475, and the Fundamental Research Funds for the Central Universities, grant number 31020200503002.
Conflicts of Interest
The authors declare no conflict of interest.
Nomenclature
| ρl | oil density |
| ρg | gas density |
| μl | oil dynamic viscosity |
| σl | oil surface tension coefficient |
| μg | air dynamic viscosity |
| ds | diameter of oil scavenge |
| dv | diameter of air vent |
| hb | height of the bearing chamber |
| wb | width of the bearing chamber |
| rs | rotor radius |
| αq | volume fraction of the q phase |
| Vq | volume of the q phase |
| Rq | the Reynolds- stress tensors |
| τq | the viscous- stress tensors of the q phase |
| k | turbulent kinetic energy |
| ε | turbulent energy dissipation term |
| νt | turbulent viscosity |
| Gk | generating term of turbulent kinetic energy |
| n | number distribution function |
| a | coalescence rate function |
| b | breakup rate function |
| β | probability distribution density function |
| Ni | number of oil droplets in unit volume |
| Mq | the interfacial force term between the gas phase and liquid phase |
| Ur | the slip velocity |
| Cd | the drag coefficient |
Abbreviations
| PBM | Population Balance Model |
| PDPA | Phase Doppler Particle Analyzer |
| PBE | Population Balance Equation |
| QMOM | Quadrature Method of Moments |
References
- Chen, G.D.; Chen, B.; Wang, J. Research into configuration and flow of wall oil film in bearing chamber based on droplet size distribution. Chin. J. Aeronaut. 2011, 24, 355–362. [Google Scholar] [CrossRef]
- Hulburt, H.; Katz, S. Some problems in particle technology, A statistical mechanical formulation. Chem. Eng. Sci. 1964, 19, 555–574. [Google Scholar] [CrossRef]
- Liao, Y.X.; Lucas, D. A literature review of theoretical models for drop and bubble breakup in turbulent dispersions. Chem. Eng. Sci. 2009, 64, 3389–3406. [Google Scholar] [CrossRef]
- Liao, Y.X.; Lucas, D. A literature review on mechanisms and models for the coalescence process of fluid particles. Chem. Eng. Sci. 2010, 65, 2851–2864. [Google Scholar] [CrossRef]
- Kumar, S.; Ramkrishna, D. On the solution of population balance equations by discretization—I. A fixed pivot technique. Chem. Eng. Sci. 1996, 51, 1311–1332. [Google Scholar] [CrossRef]
- Coulaloglou, C.A.; Tavlarides, L.L. Description of interaction processes in agitated liquid-liquid dispersions. Chem. Eng. Sci. 1977, 32, 1289–1297. [Google Scholar] [CrossRef]
- Tsouris, C.; Tavlarides, L.L.; Bonnet, J.C. Application of the ultrasonic technique for real-time holdup monitoring for the control of extraction columns. Chem. Eng. Sci. 1990, 45, 3055–3062. [Google Scholar] [CrossRef]
- Luo, H.; Svendsen, H.F. Theoretical model for drop and bubble breakup in turbulent dispersions. AIChE J. 1996, 42, 1225–1233. [Google Scholar] [CrossRef]
- Li, D.; Gao, Z.; Buffo, A.; Podgorska, W.; Marchisio, D.L. Droplet breakage and coalescence in liquid–liquid dispersions: Comparison of different kernels with EQMOM and QMOM. AIChE J. 2017, 63, 2293–2311. [Google Scholar] [CrossRef]
- Li, S.-W.; Jing, S.; Zhang, Q.; Wu, Q.-L. Advances in simulation of liquid-liquid two-phase flow in extraction columns with CFD-PBM. Chin. J. Process Eng. 2012, 12, 702–711. (In Chinese) [Google Scholar]
- Xing, C.; Wang, T.; Wang, J. Experimental study and numerical simulation with a coupled CFD–PBM model of the effect of liquid viscosity in a bubble column. Chem. Eng. Sci. 2013, 95, 313–322. [Google Scholar] [CrossRef]
- Wang, T.F.; Wang, J.F.; Jin, Y. A novel theoretical breakup kernel function for bubbles/droplets in a turbulent flow. Chem. Eng. Sci. 2003, 58, 4629–4637. [Google Scholar] [CrossRef]
- Wang, T.F.; Wang, J.F.; Jin, Y. Population balance model for gas-liquid flows, Influence of bubble coalescence and breakup models. Ind. Eng. Chem. Res. 2005, 44, 7540–7549. [Google Scholar] [CrossRef]
- Xu, Z.; Zhao, H.; Zhao, H. CFD-population balance Monte Carlo simulation and numerical optimization for flame synthesis of TiO2 nanoparticles. Proc. Combust. Inst. 2015, 36, 1099–1108. [Google Scholar] [CrossRef]
- Chen, G.D.; Chen, B.; Wang, J. Oil droplet size distribution and deposition properties in bearing chamber. J. Mech. Eng. 2011, 47, 139–144. (In Chinese) [Google Scholar] [CrossRef]
- Glahn, A.; Kurreck, M.; Willman, M.; Wittig, S. Feasibility study on oil droplet flow investigation inside aero-engine bearing chambers-pdpa techniques in combination with numerical approaches. J. Eng. Gas Turbines Power 1996, 118, 749–755. [Google Scholar] [CrossRef]
- LIN, J.H. Aero Engine Design Manual-Transmission and Lubrication Systems; Aviation Industry Press: Beijing China, 2002. (In Chinese) [Google Scholar]
- Drew, D. Mathematical modeling of two–phase flow. Annu. Rev. Fluid Mech. 1982, 15, 261–291. [Google Scholar] [CrossRef]
- Gosman, A.; Lekakou, C.; Politis, S.; Issa, R.; Looney, M. Multidimensional modeling of turbulent two–phase flows in stirred vessels. AIChE J. 1992, 38, 1946–1956. [Google Scholar] [CrossRef]
- Behzadi, A.; Issa, R.; Rusche, H. Modelling of dispersed bubble and droplet flow at high phase fractions. Chem. Eng. Sci. 2004, 59, 759–770. [Google Scholar] [CrossRef]
- Yeoh, G.H.; Cheung, C.P.; Tu, J. Multiphase Flow Analysis Using Population Balance Modeling: Bubbles, Drops and Particles; Butterworth-Heinemann, Elsevier: Oxford, UK, 2014; pp. 69–90. [Google Scholar]
- Laakkonen, M.; Alopaeus, V.; Aittamaa, J. Validation of bubble breakage, coalescence and mass transfer models for gas-liquid dispersion in agitated vessel. Chem. Eng. Sci. 2006, 61, 218–228. [Google Scholar] [CrossRef]


© 2020 by the authors. Licensee MDPI, Basel, Switzerland. This article is an open access article distributed under the terms and conditions of the Creative Commons Attribution (CC BY) license (http://creativecommons.org/licenses/by/4.0/).