1. Introduction
Currently, there is an increasing interest in smart systems, e.g., smart metering or smart spaces, for which active sensing plays an important role. In such systems, a signal (acoustic, infrared, radio-frequency) is transmitted through a medium with the aim of measuring some particular parameters or characteristics from the received or reflected signal, which is captured by the corresponding transducers. Usually, spreading sequences are used to enhance the behavior of these systems, for instance to increase the signal-to-noise ratio (SNR) [
1] or to contribute to the minimization of the Crámer–Rao lower bound [
2]. At the low-level processing stage, three approaches can be used: optimizing the receiving filter [
3], building the transmitted signals suitably [
4], or jointly affording the optimization of both [
5]. In a higher-level processing, some efforts have been done to extract task-relevant information from a sequence of observations and to launch the actions that lead to the most relevant observations [
6].
If several emitters are using the same propagation medium, a multiple access technique, such as the Coded-Division Multiple Access (CDMA), may be required. Then, the system can deal with the simultaneous transmission of all the signals and the source separation at the receiver’s processing stage [
7]. Furthermore, using correlation techniques allows the receiver to determine the amount of energy received from each emitter, by quantifying the main correlation peaks.
In the particular case of positioning systems, it is necessary to improve the positioning of people or devices in places where global navigation satellite systems (GNSS) have attenuation problems and multi-path effects that limit their performance. Throughout the years, different local positioning techniques have been developed to solve this problem, such as those based on optical, magnetic, acoustic, mechanical and radio-frequency (RF) signals [
8]. In particular, the use of optical signals as a means of transmission has considerably spread due to the deployment of the light emitting diode (LED) technology. This type of technology has a low cost, long life and is present in the majority of the current infrastructure [
9], characteristics that increase its interest.
In local positioning systems (LPS) based on visible light or infrared, whereas the transmitter is typically a LED array, the receiver can be an imaging sensor or a photodetector. Those based on imaging sensors take advantage of the cameras available in commercial smartphones [
10] or CMOS cameras [
11], but they require image-processing algorithms that can slow down computation. If the receptor is a photodetector, it often uses an array of photodiodes [
12], whose currents when the light impacts them can be used to estimate the position of the receiver. Typical receivers are position-sensitive detectors (PSD) with lenses [
13] or quadrant photodiode angular diversity aperture (QADA) with apertures [
14].
The majority of the systems are based on measurements of the angle-of-arrival (AoA), so they do not have to deal with the speed of light, which is required when using time-of-flight (ToF) measurements [
15]. Additionally, they do not require an exhaustive analysis of the possible reflections of light or the multipath effect, which is the case when they use the received signal strength (RSS) measurements [
16]. With the AoAs, the positioning algorithms are typically based on triangulation techniques, which result in a better accuracy than other approaches [
9]. If the corresponding points of the emitters in the image plane are obtained and the calibration matrix of the camera-like receiver is available, perspective n-points (PnP) algorithms can be also used to obtain the pose of the receiver [
17].
In the search for a centimeter-precise positioning system, it is important to consider the implemented medium access technique, often related to the modulation scheme used in the transmissions. Whereas there is a majority of works that uses on-off keying (OOK) modulations due to their simplicity, in [
18] a better performance in visible light communications was obtained by using binary phase shift keying (BPSK) modulation.
In the case of a simultaneous transmission, in addition to the modulation used, it is crucial to encode the signals emitted by the beacons so that the receiver is able to identify and separate them. In particular, in [
19] it was shown that loosely synchronous (LS) codes have a better behavior against pseudo-random (PR) sequences, such as Kasami codes [
20], in a system like the one proposed in this work. The use of coding techniques is associated with an increase in the computational load of the receiving system due to the algorithms involved in the calculation of the correlation functions. In addition, the receiver system should be fast enough to acquire those signals and process them, as well as light, compact, of low consumption, and easy to transport. Therefore, it is interesting the use of solutions based on ARM or STM32 architectures, compared to specific architectures designed with field-programmable gate arrays (FPGAs) devices, since, although the last ones are ideal for massive and parallel data processing, they usually present a higher power consumption.
This work is focused on the implementation issues and the experimental validation of an infrared positioning system based on a set of four transmitting LEDs, acting as beacons at known positions, and on a unique QADA sensor, acting as the receiver to be positioned. Regarding previous works, this system has been intended for long-distance measurements (more than 3 m) and includes an ad hoc synchronization module that allows the receiver module to acquire only when new data are available, thus facilitating real-time operation. The system is based on the reception and further processing of the different encoded signals, emitted simultaneously by the aforementioned beacons. The receiver’s processing stage separates and processes the received signal to obtain the correlation peaks of the received signal with each one of the codes used. From these peaks, it estimates the angle of incidence of each one of the transmissions on the surface of the QADA by means of non-linear least squares (NLS) and Gauss–Newton minimization techniques. After obtaining these incidence points, firstly, the rotation of the receiver in the Z axis is obtained by means of trigonometric equations and, finally, the position of the receiver is obtained using an least squares estimator (LSE) and some geometrical considerations [
20,
21]. These previous references already developed the positioning algorithm with the geometrical constraints considered hereinafter, so no further analysis will be done here. A real prototype has been assembled to satisfactorily validate the proposal in an experimental setup, where the distance between the plane of the transmitters in the ceiling and the receiver on the floor is 3.4 m (height of the room).
The rest of the document is organized as follows:
Section 2 provides a description of the proposed system (transmitting beacons, receiver module and synchronization system);
Section 3 shows the results obtained in some selected points of the coverage area; and, finally, conclusions are discussed in
Section 4.
2. Description of the Proposed System
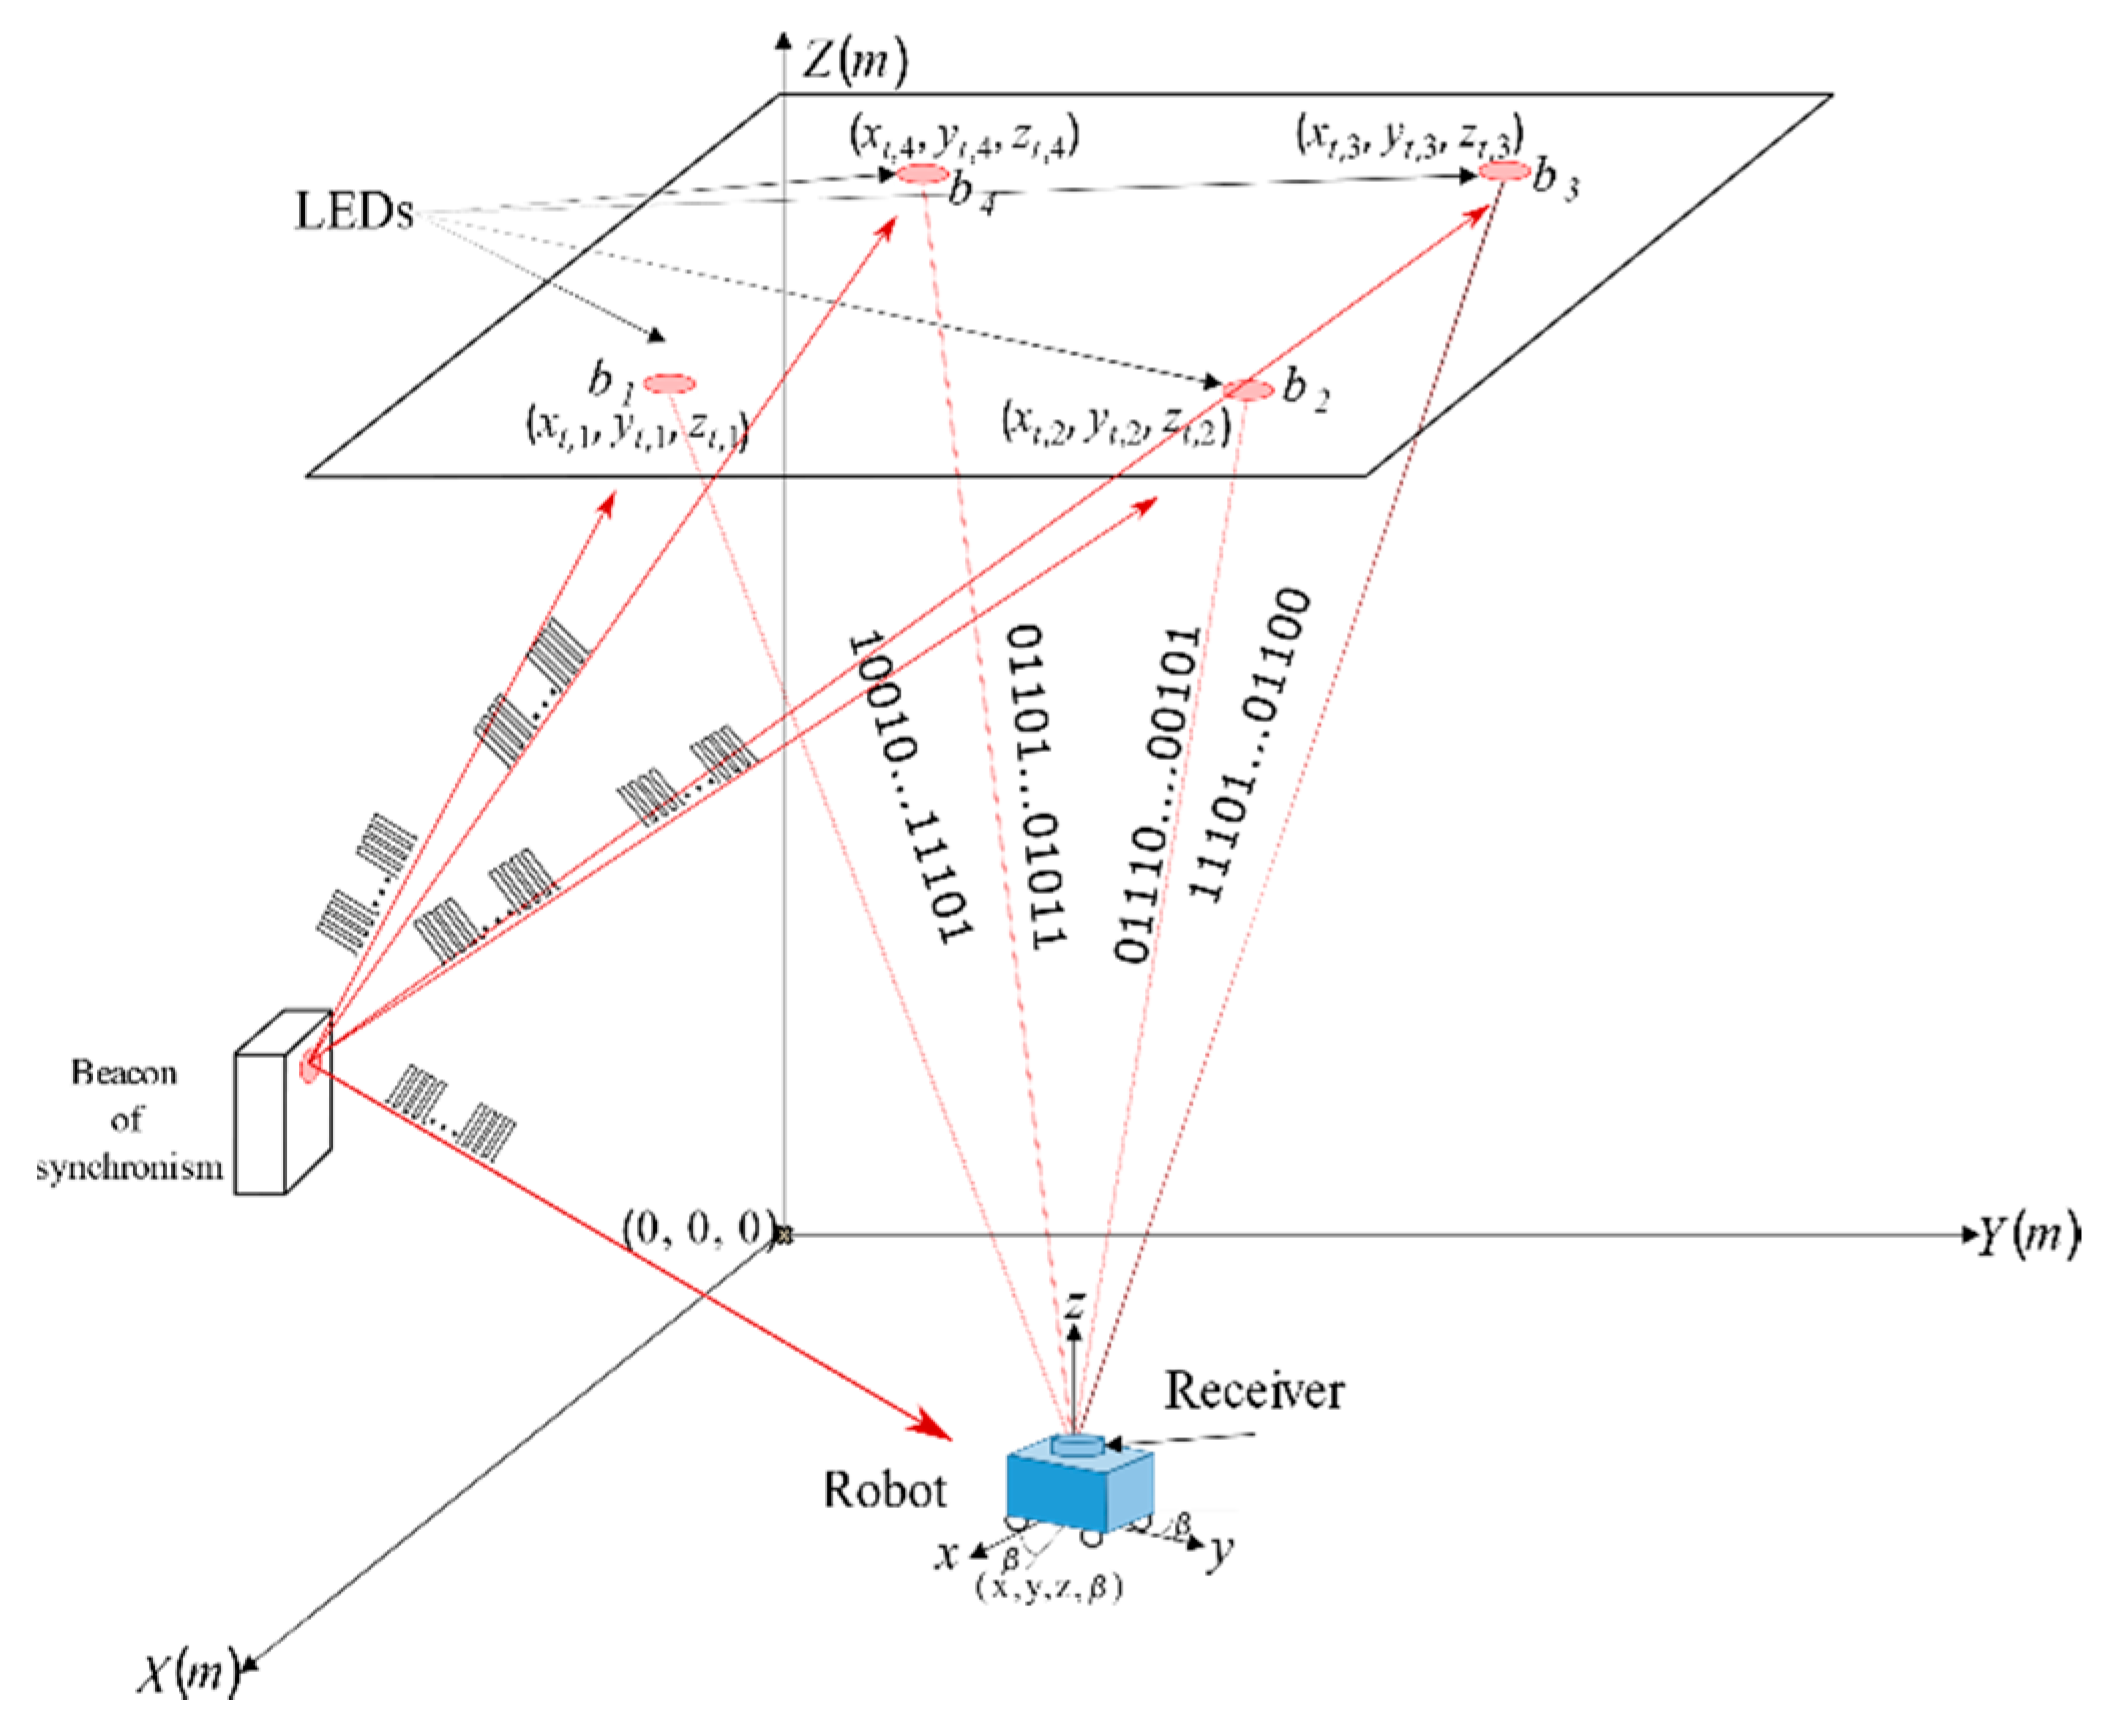
The proposed infrared positioning system is based on a set of four LEDs (at 3D positions
bi), located at known points in the environment, as well as a receiver and a synchronization module. The overall system is shown in
Figure 1.
The system consists of a synchronism system (a special beacon), which emits a 455 kHz IR carrier during 1 ms, periodically every 0.5 s. This signal is received by each one of the beacons, as well as by the reception module. When a synchronization pulse is captured by both systems, transmissions and acquisition start simultaneously. Note that, as the speed of the light is very high, the transmissions from the beacons and the corresponding acquisition at the receiver happen at the same time for practical purposes. After the signal is acquired, it is transmitted through an USB port to a computer, where it is processed to estimate the position of the receiver. This procedure allows the system to update the receiver position every 0.5 s.
At the first stage, the received signal is processed to obtain the central points (
xri,
yri) of incidence from the transmitters on the surface of the QADA, where
I = {1, 2, 3, 4} is the order of the transmitter. This procedure is based on the correlation of the received signal with the transmitted codes
ci. The resulting correlation peaks are used to estimate the signal level from each transmitting beacon
bi. In [
20], the reader can find out how to obtain the central point of incidence for each transmitted code
ci on the surface of the QADA by means of the non-linear least squares (NLS) and Gauss–Newton minimization algorithms. Afterwards, the corresponding algorithm detects the rotation of the receiver around the Z axis, and continues with the estimation of the final coordinates (
x,
y,
z) of the receiver position using a least squares estimator (LSE) and some trigonometric considerations, as can be also observed in [
20,
21].
The following sections include a detailed description of each module used in this proposal, separately.
2.1. Synchronization System
The infrared synchronization system consists of a special synchronism beacon (which emits a 1ms-long pulse every 0.5 s) and of the synchronism photodetectors located both in the receiver and in the transmitters. The infrared transmitter located in the synchronism beacon is the ILH-IW01–85NL–SC201-WIR200 [
22], which has a 150° radiation angle and a central wavelength response of 850 nm. On the other hand, the synchronism receivers are based on the TSOP7000 infrared detector [
23], which is centered at a frequency
fcSYN = 455 kHz. After receiving the carrier from the synchronization beacon, the detector generates a pulse with the same length (i.e., 1 ms).
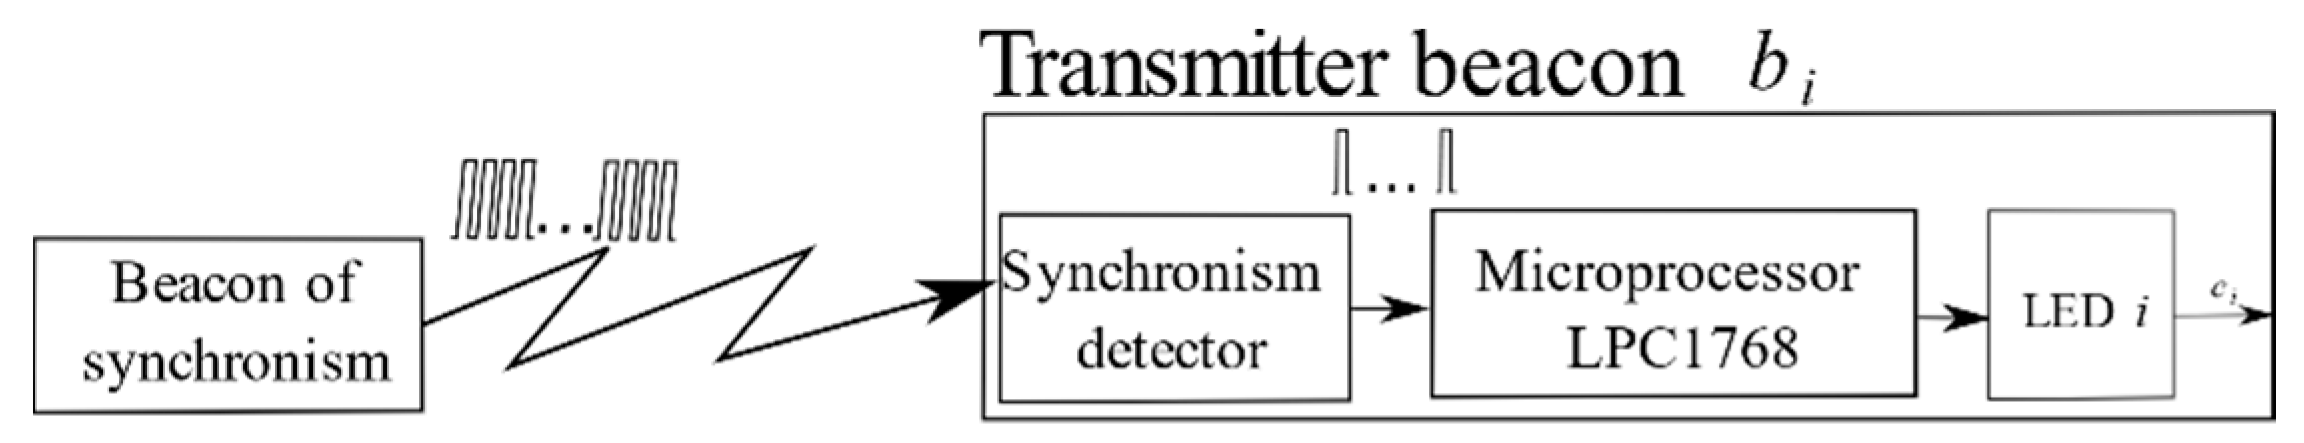
2.2. Transmission System
The transmitter system consists of four beacons (see
Figure 2), each one incorporating an infrared LED and a sync detector. The infrared emitters located in the transmission system are the same as those used in the synchronism module [
22]. The general operation of the system for the beacon
bi is presented in
Figure 2, where each transmitter is individually driven by a microprocessor [
24], whose input signal is the pulse generated by the infrared detector whereas the output is the sequence
ci to be transmitted. Every time the synchronism detector receives the carrier from the synchronization beacon, the transmission begins.
The code
ci used for the
ith LED beacon is an 1151 bit LS sequence with a BPSK modulation. The frequency carrier is
fcLED = 25 kHz, whereas the sampling frequency is
fsLED = 250 kHz. The four codes
ci are emitted simultaneously by each LED, with a relative delay of 10 samples regarding the previous one, giving a total duration of 46.3 ms for the whole transmitted signal. The suitability of an 1151 bit LS sequence with a 10-sample displacement was studied in [
20]. The use of LS sequences with a 10-sample relative displacement is preferable to Kasami sequences in order to minimize the multiple access interference (MAI) effect, produced by the simultaneous transmission and reception of all the sequences.
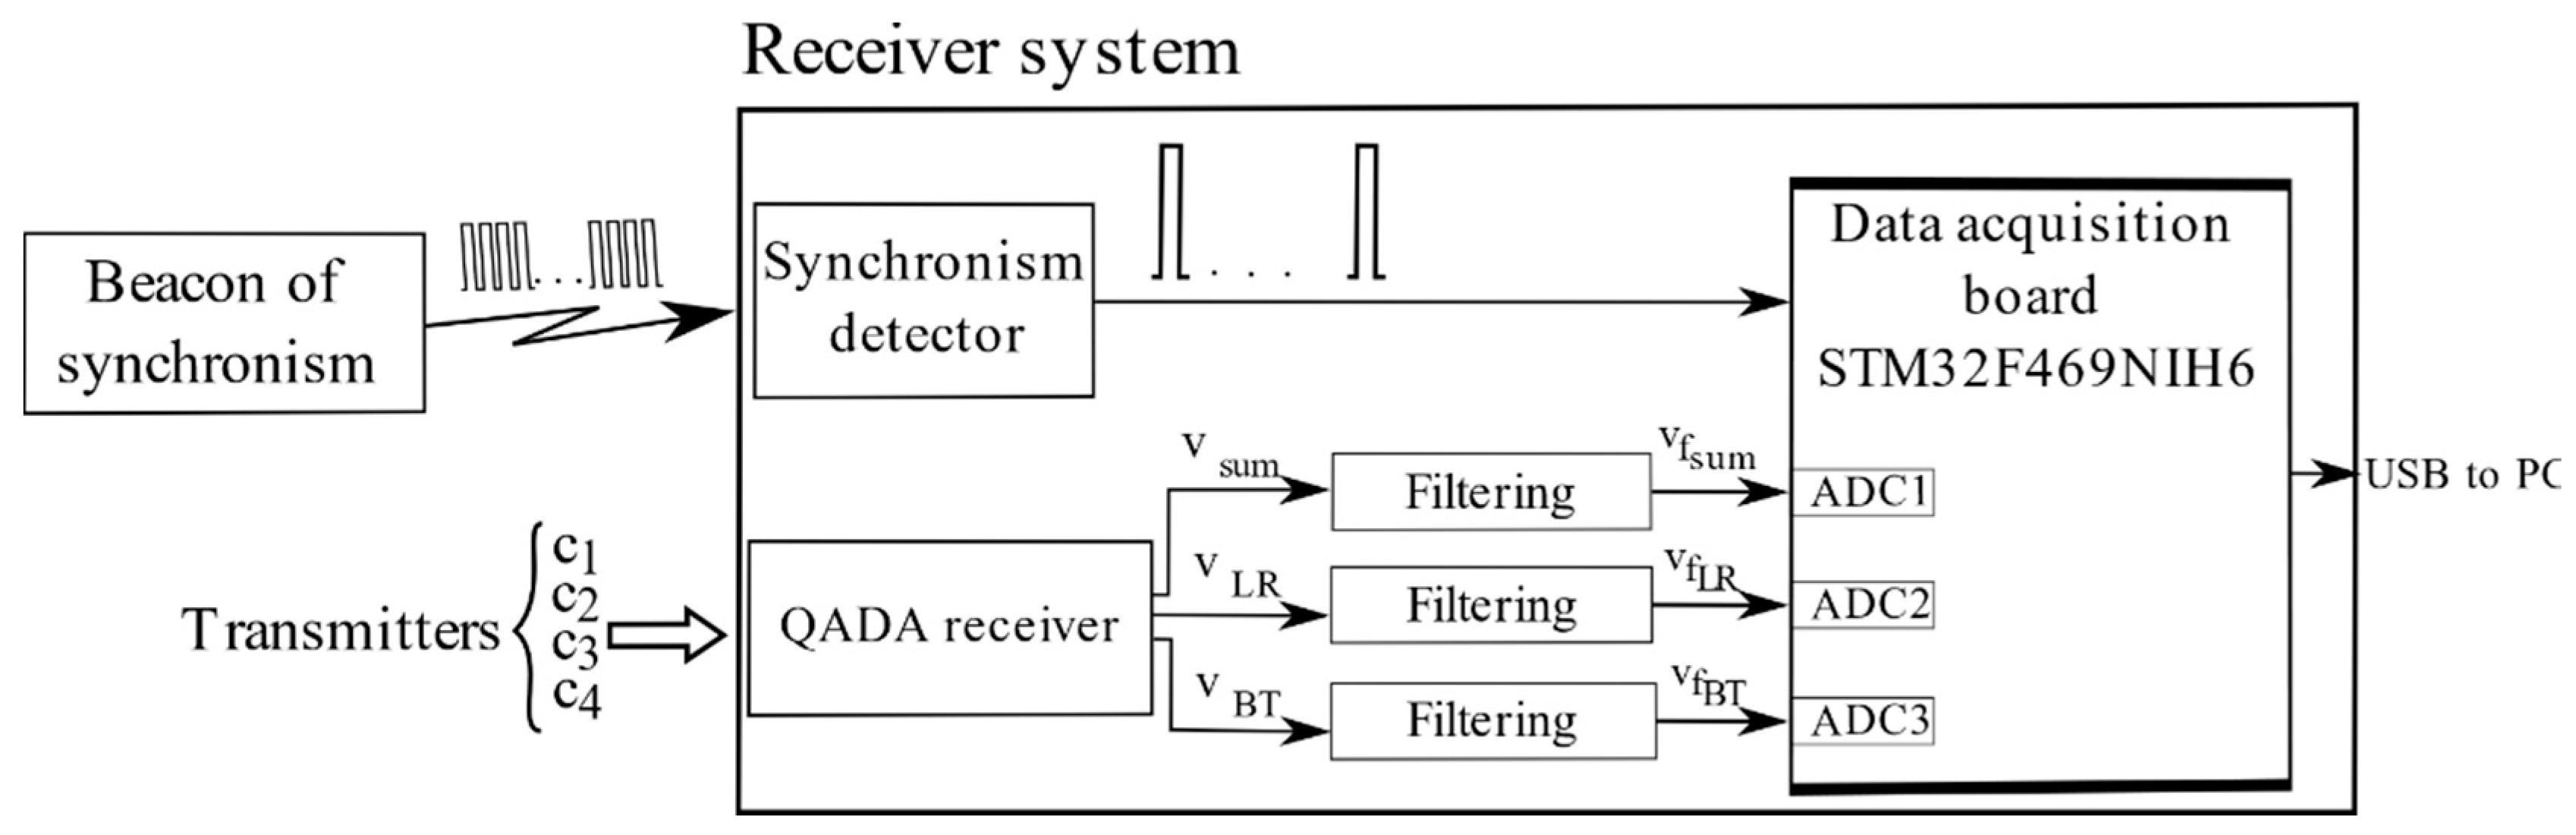
2.3. Reception System
The reception system consists of a QADA circular photoreceptor QP50–6–18u–TO8 [
25], a filtering system, a synchronism signal detector and an acquisition system STM32F469I Discovery [
26]. The general operation of the receiver system is shown in
Figure 3. Note that the acquisition system starts acquiring at the instant it receives the synchronism pulse from the synchronism detector. The signals to be acquired come from the signals measured by the QADA after being filtered. The acquired signals are sent through an USB port for further processing on a computer.
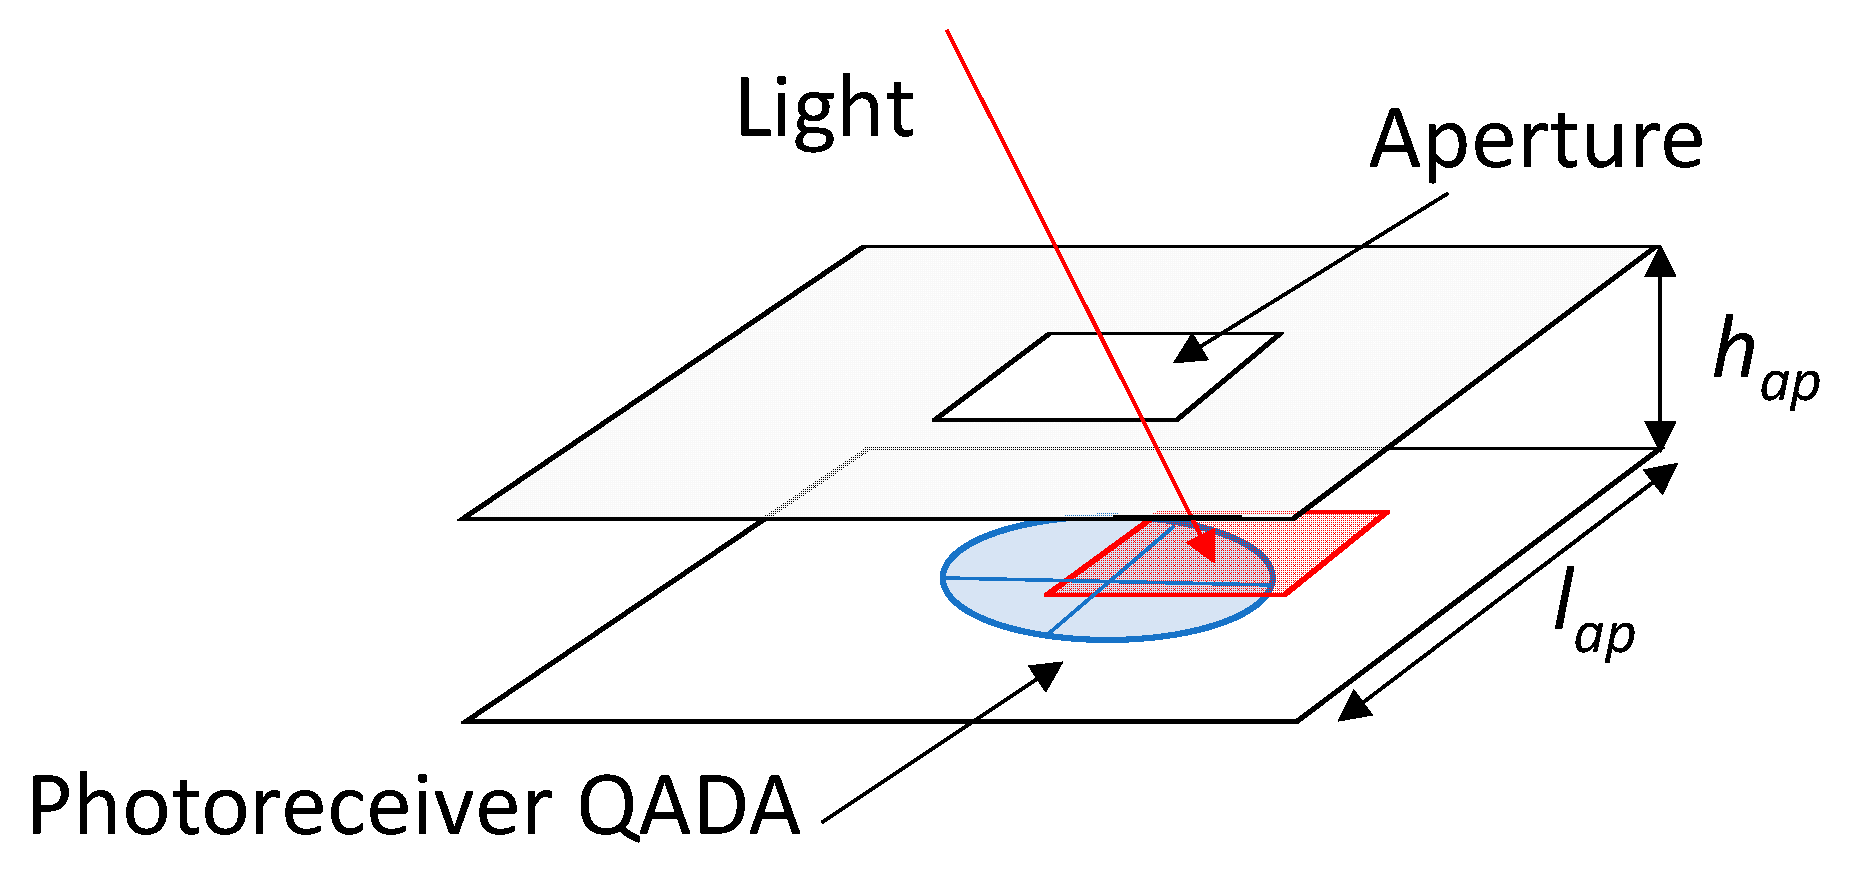
Firstly, the signals transmitted by the beacons added in the transmission medium are received by the QADA, to which a square aperture has been added so that the incident signal goes through the center of the aperture and illuminates part of its surface (see
Figure 4) [
21]. The QADA is a photoreceptor divided into four quadrants, so that it generates three output signals according to the area illuminated in each of the quadrants, which depend on the angle of incidence from the received signal. These three signals are the global sum of the incident energy,
vsum; the voltage difference on the X-axis (left-right),
vLR; and the voltage difference on the Y-axis (bottom-top),
vBT. Since the QADA has a radius of
r = 3.9 mm and the aperture height and length are
hap = 2.6 mm and
lap = 7.8 mm, in order to have all the quadrants illuminated, the light must have an angle of incidence below 56.3°. Therefore, if a transmitter is placed at a height of 3.4 m from the receiver, the QADA could be placed at a maximum distance of 5.1 m from the projection of the transmitter.
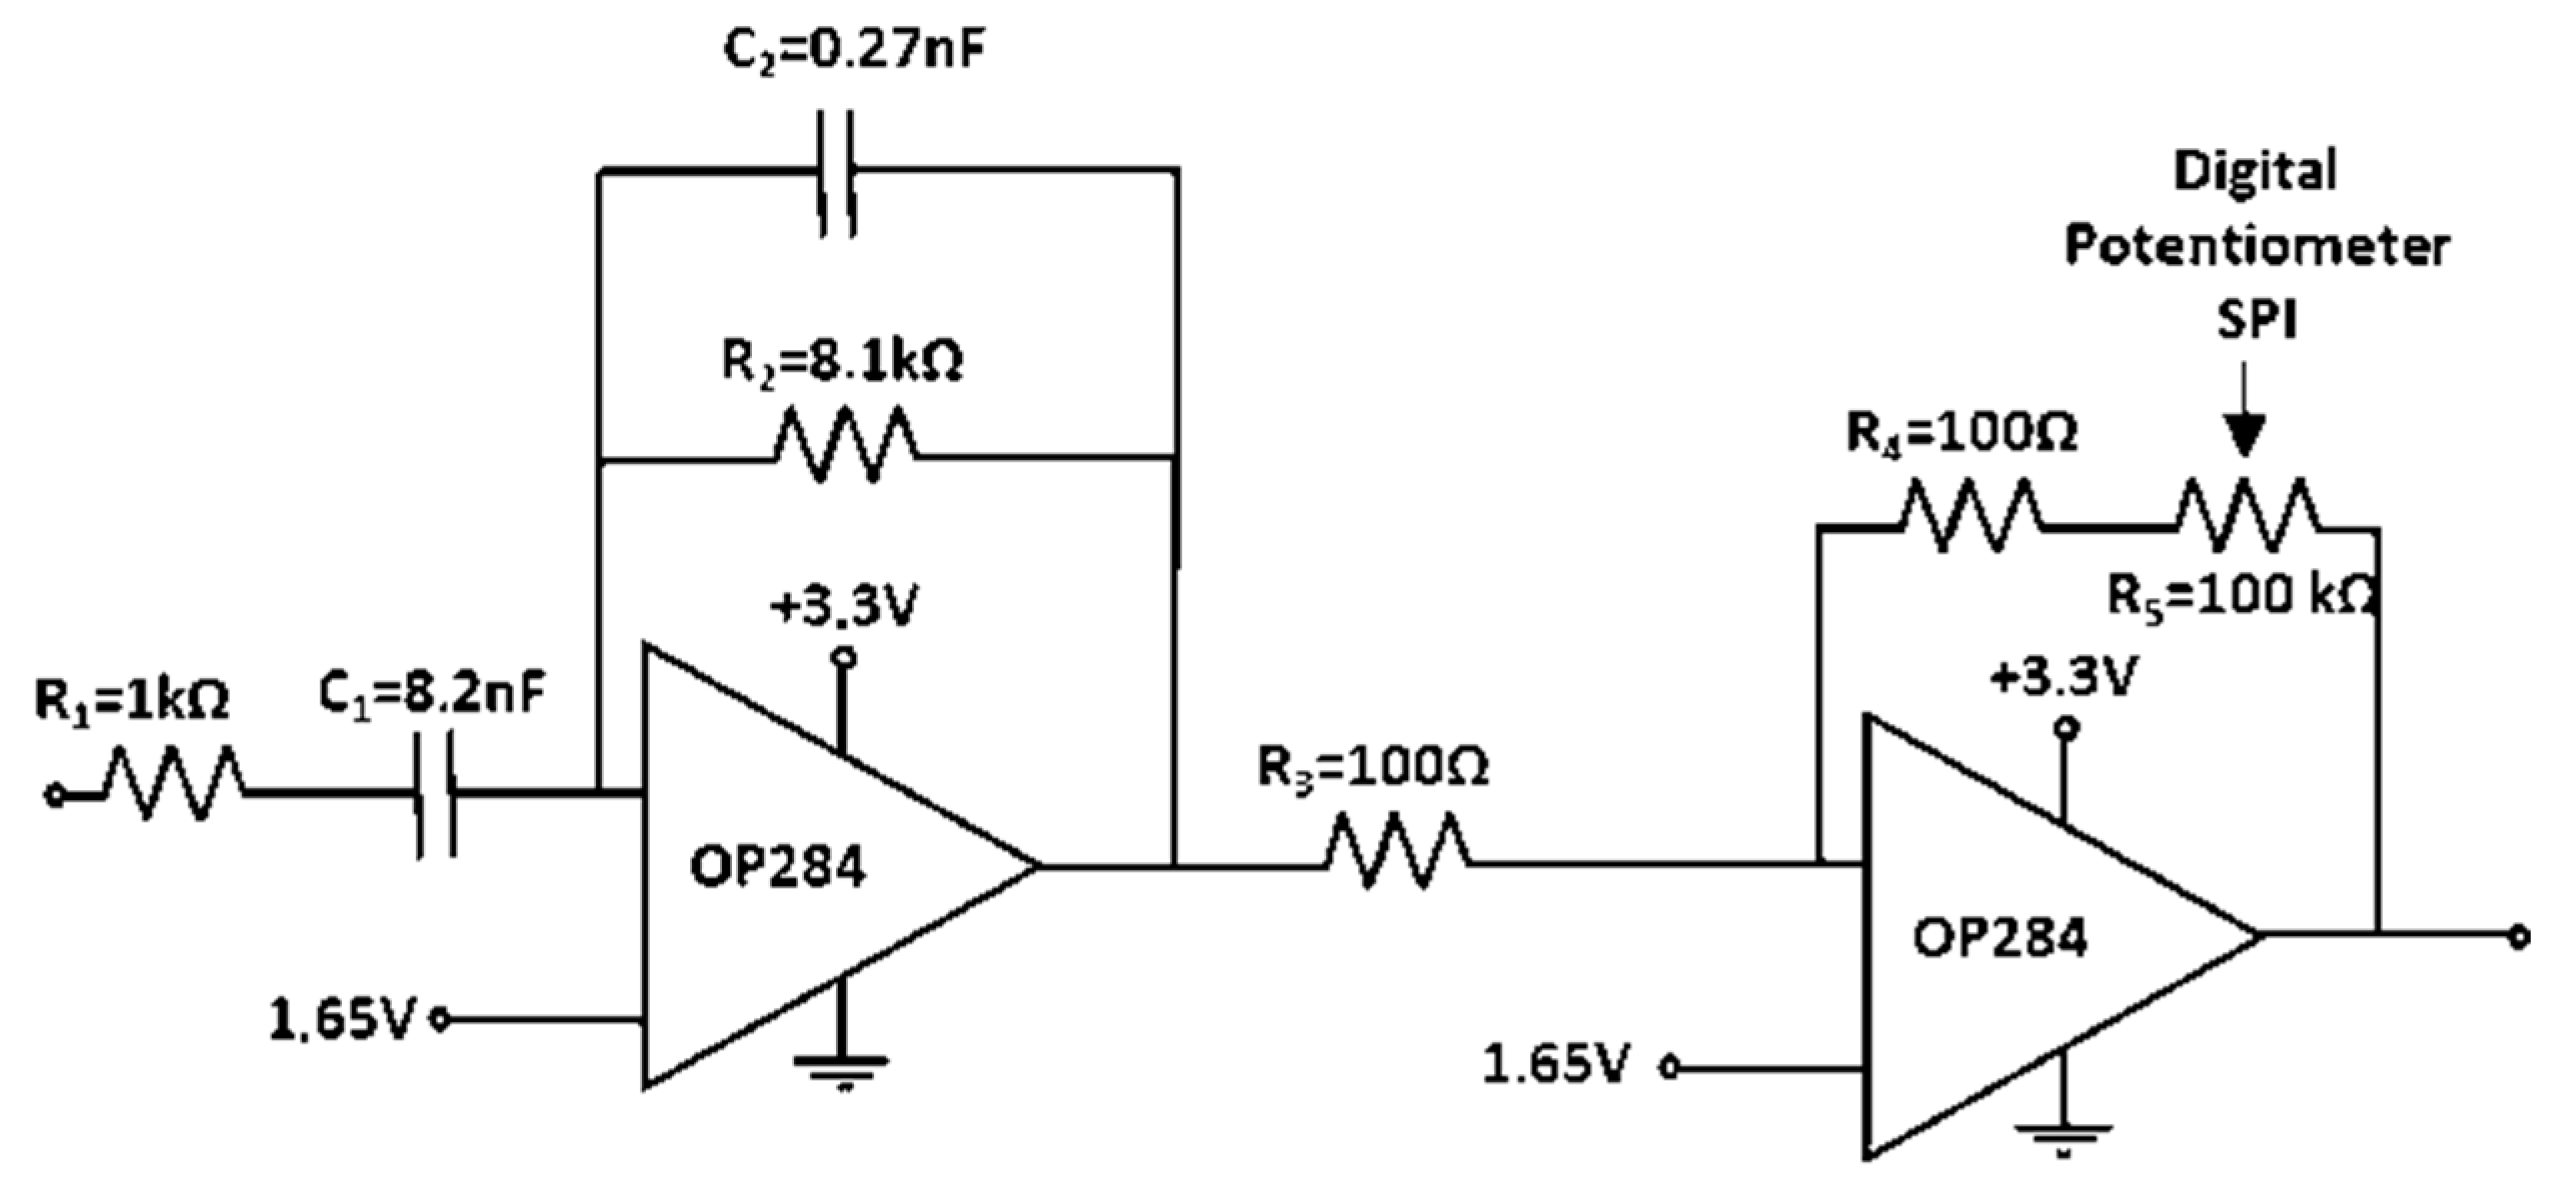
Secondly, a filtering and amplification stage is required before starting the acquisition process, with the aim of maximizing the amplitude of the received signals, as well as to reduce possible interferences in the desired signal with the light coming from the windows and the room’s own illumination. The diagram of the filtering and amplification stage for the signal
vsum can be observed in
Figure 5. Similar circuits are used for the signals
vLR and
vBT.
The acquisition system is based on a microcontroller STM32F469NIH6U, which manages an adjustable potentiometer [
27] included in the filtering and amplification system. Depending on the received signal amplitude (
maxValue), the circuit gain is adjusted with this digital potentiometer controlled by a SPI bus, increasing or decreasing the internal resistance (
StepValue).
As was shown in
Figure 3, three 12-bit ADCs are used in the acquisition of the signals, which have a maximum dynamic range of 4096, reduced to 4000 for security and to avoid introducing higher voltages than the maximum allowed at the input of the acquisition system.
With this objective, three ranges are defined to increase the gain of the signal to be filtered: the first range covers signal amplitudes up to 3000, where StepValue is increased by 20; the second range covers amplitudes from 3000 to 3500, where StepValue is increased by 10; and, finally, the third range contains amplitudes between 3500 and 4000, where StepValue is increased by 1. This process is independent for each channel, vfsum, vfLR and vfBT, and is implemented in order to maximize the dynamic range of the used acquisition module.
Note that the acquisition does not start and, therefore, the programmable resistance does not vary until the sync pulse is detected. The flowchart explaining the interrupt service routine is presented in
Figure 6.
The complete reception system has a power consumption of 0.23 A, with a voltage supply of 5 V. It is worth mentioning that, when the acquired signals are transmitted via the USB, the value of the gain used in the capture of those signals is also transmitted. These data are necessary to adequately weigh the peak values after the correlation process and then estimate the point of incidence for each LED infrared signal on the surface of the QADA.
3. Experimental Results
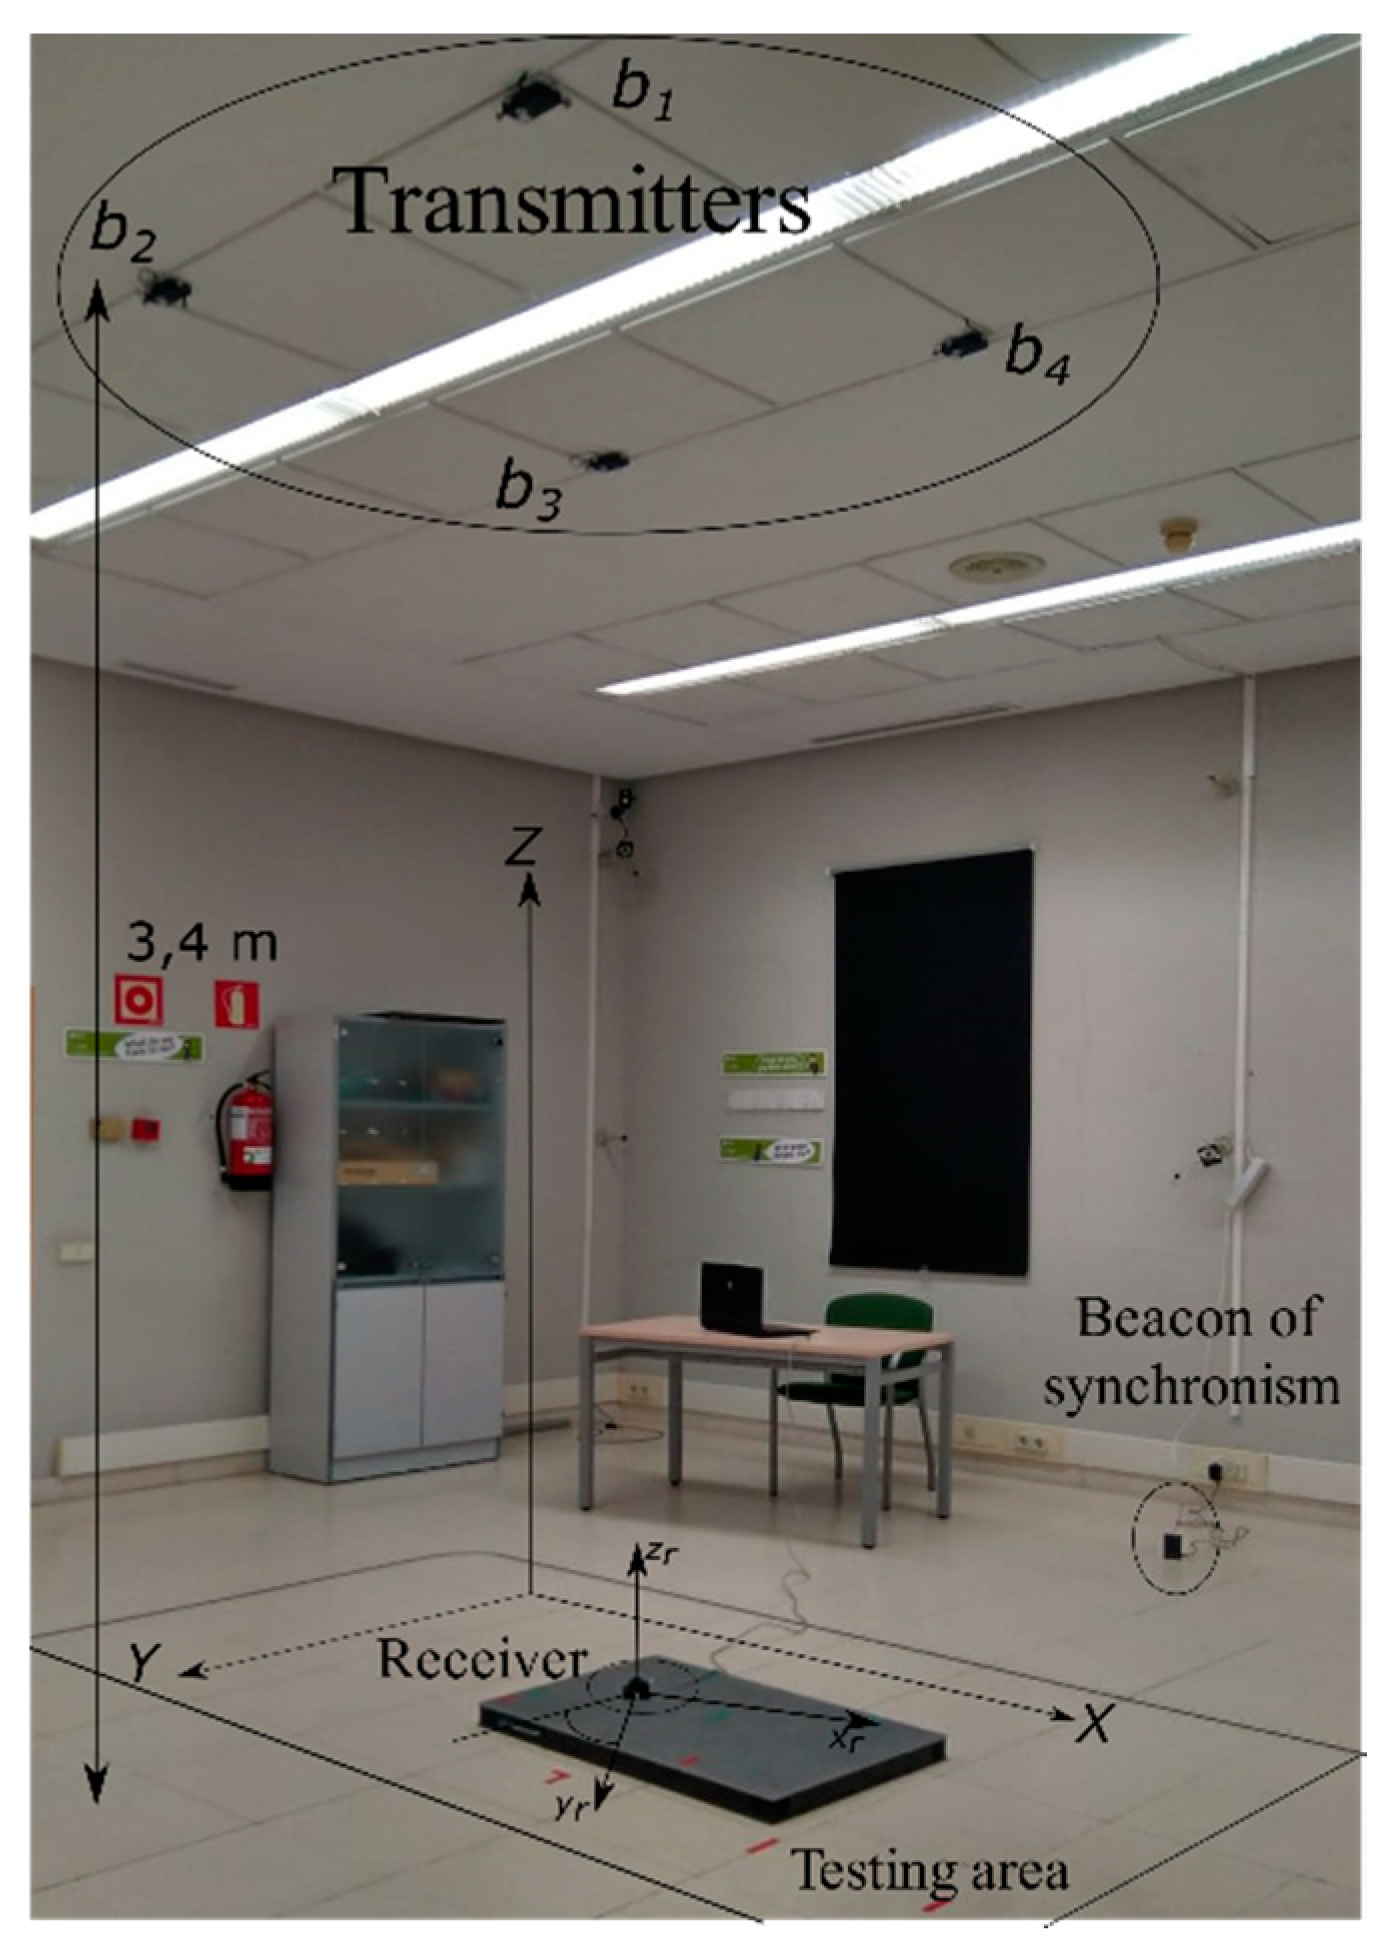
The environment where the experimental tests were carried out is a room with a surface of 55 m
2 and a height of 3.4 m. The LED transmitters were located in the ceiling of the room, distributed in the four corners of a square with a side of 1.2 m, and the receiver was placed at different locations on the floor. Therefore, emitters and receiver were placed at a distance of more than 3.4 m. The effective testing area below the transmitters was a surface of 3 × 3 m
2. The synchronization beacon was placed on the floor, as shown in
Figure 7.
In [
21], it was shown that the algorithm used in this proposal obtains the best and worst results when the receiver is rotated the angles
β = 5° and
β = 45° on the Z axis, respectively. Note that the emitters are aligned with the X and Y axes (see
Figure 7). Furthermore, it was also shown that those angles that meet 90°·
n ±
β, where
n is an integer and
β is the rotation angle of the receiver, obtain similar performance results and, therefore, the study of the rotation of the receptor can be simplified to a single octant. Considering the square formed by the projections of the emitters on the floor, the experimental measurements were obtained hereinafter in seven points (P1 to P7) on the floor distributed in one of the octants of this square (P1, P2 and P5 inside the square, P3, P4, P6 and P7 outside, as is shown after in Figure 11a). At each point, the measurements were taken with the receiver rotated at angles
β = {5°, 15°, 30°, 45°}.
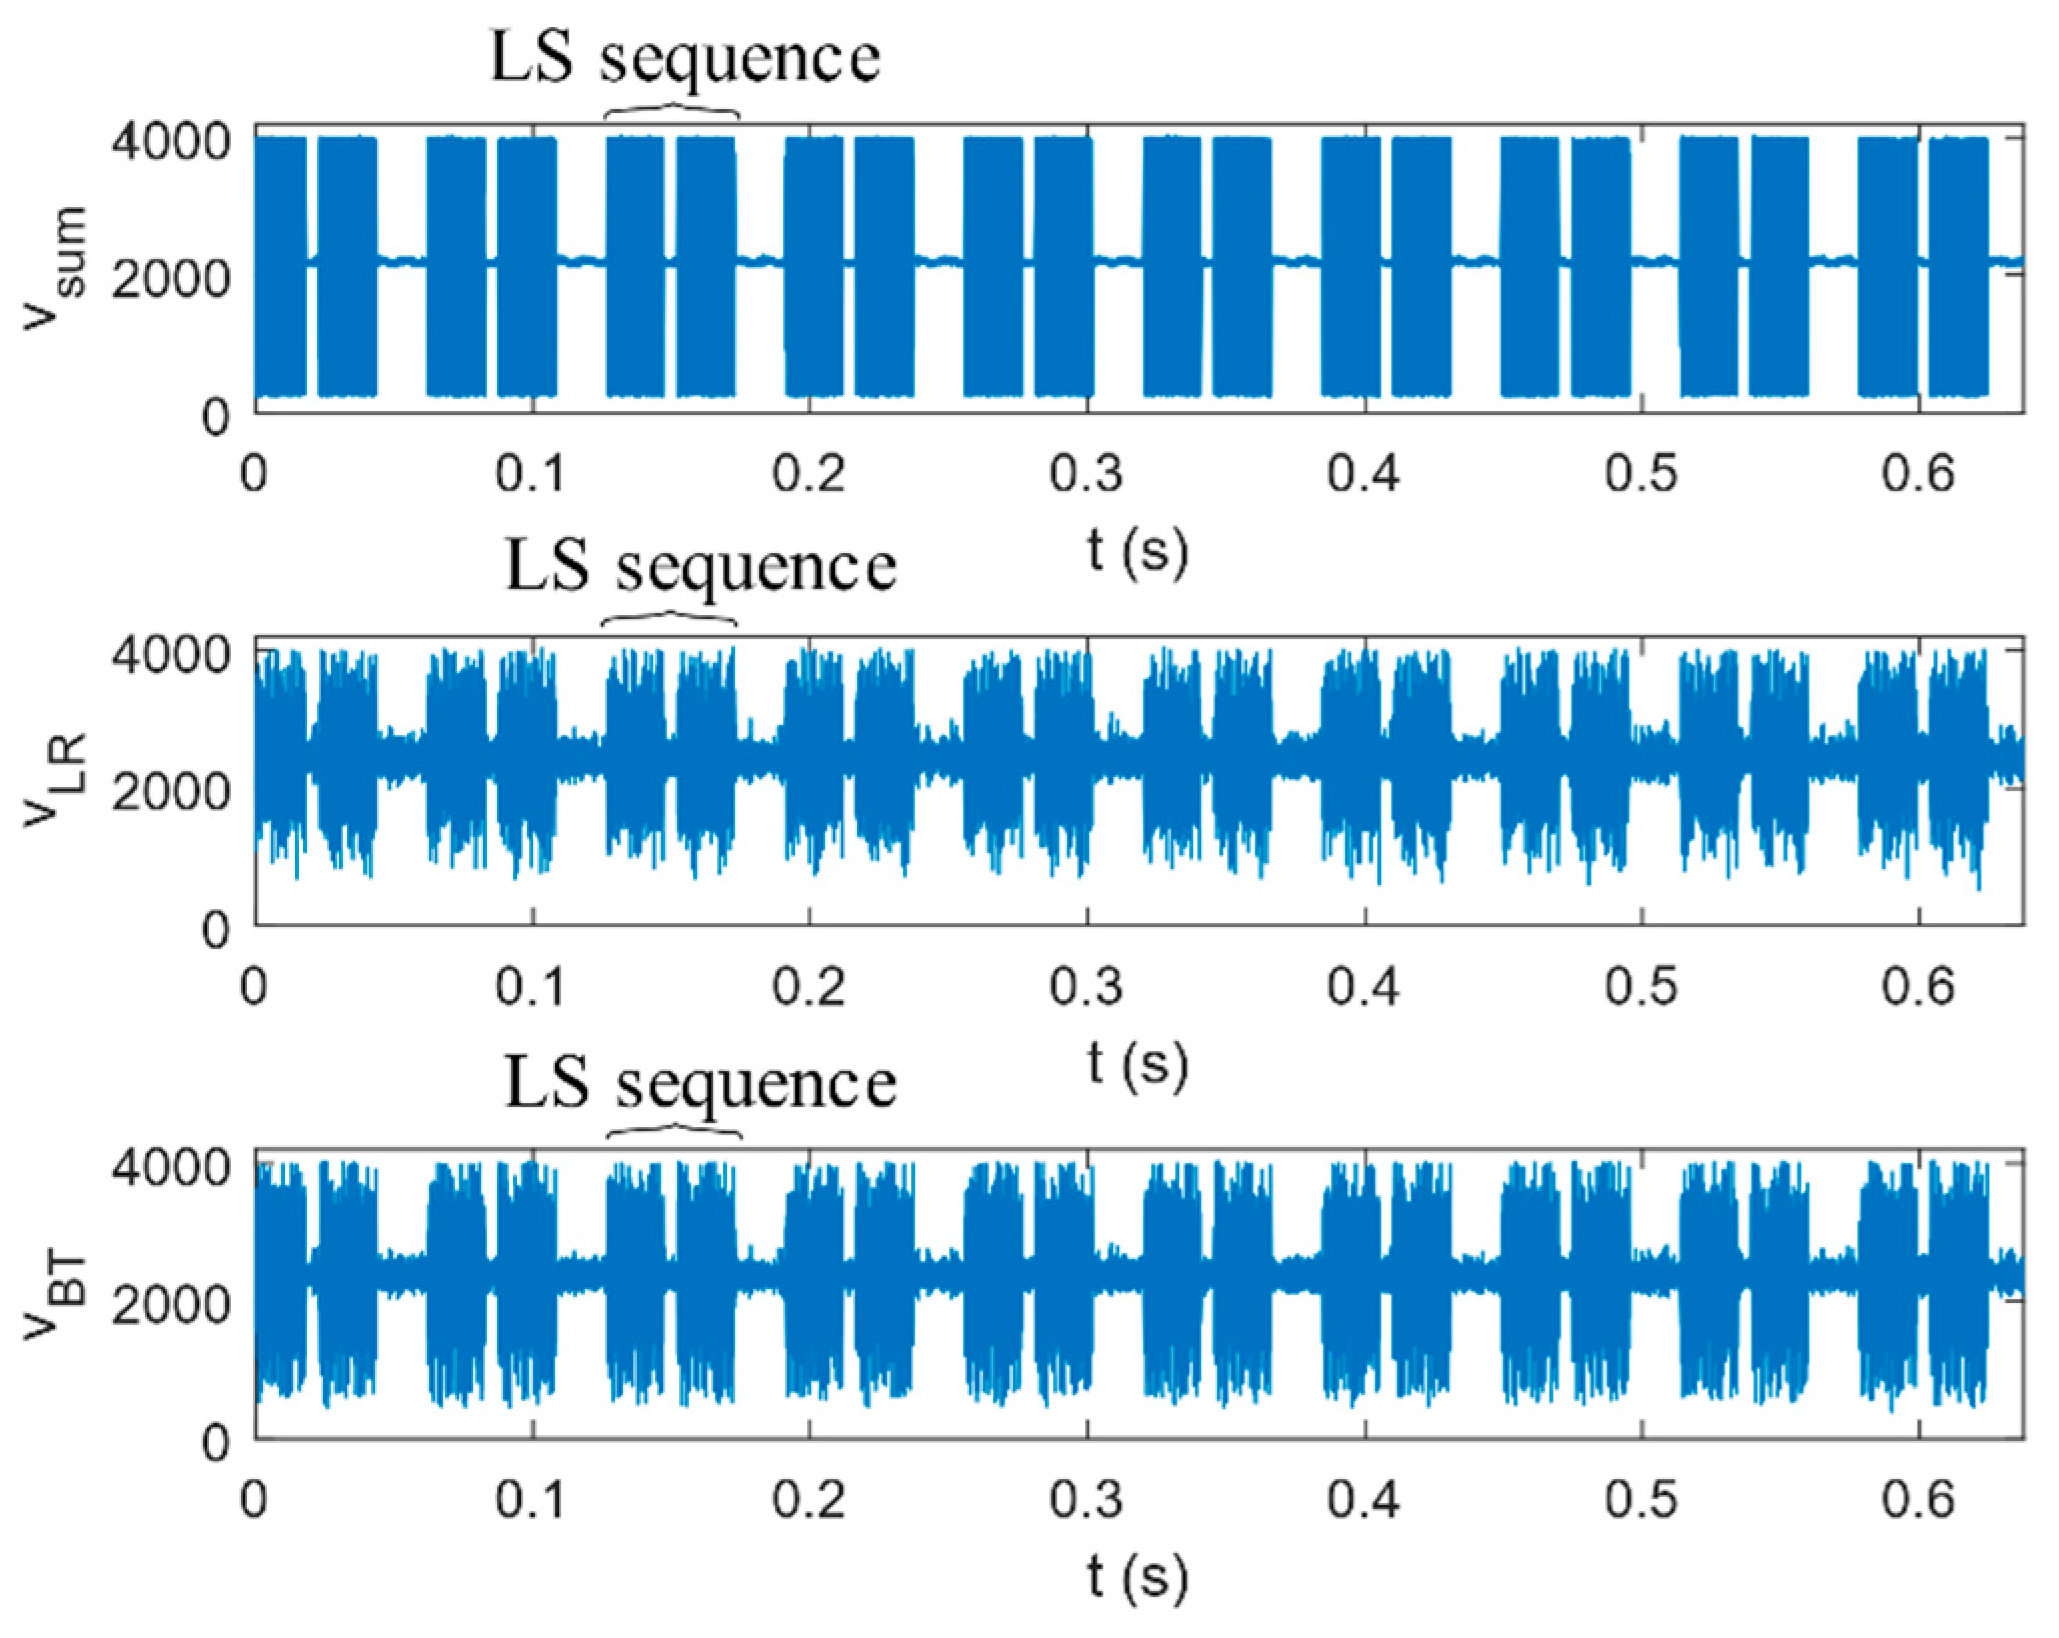
A real signal received after the acquisition of the three channels can be observed in
Figure 8: channels
vfsum,
vfLR,
vfBT. It shows a total of ten LS consecutive sequences and each LS sequence has 16,200 samples (corresponding 46.02 ms).
The correct operation of the variable gain is relevant, since the signals maximize the dynamic range of the acquisition modules, reaching the value of 4000. Note also that the signal vsum is better adapted to the automatic gain amplification than the signals vLR and vBT, since vsum collects the sum of all the energy received by the QADA, whereas vLR and vBT represent the difference in energy received between left/right and upper/lower half-planes, respectively.
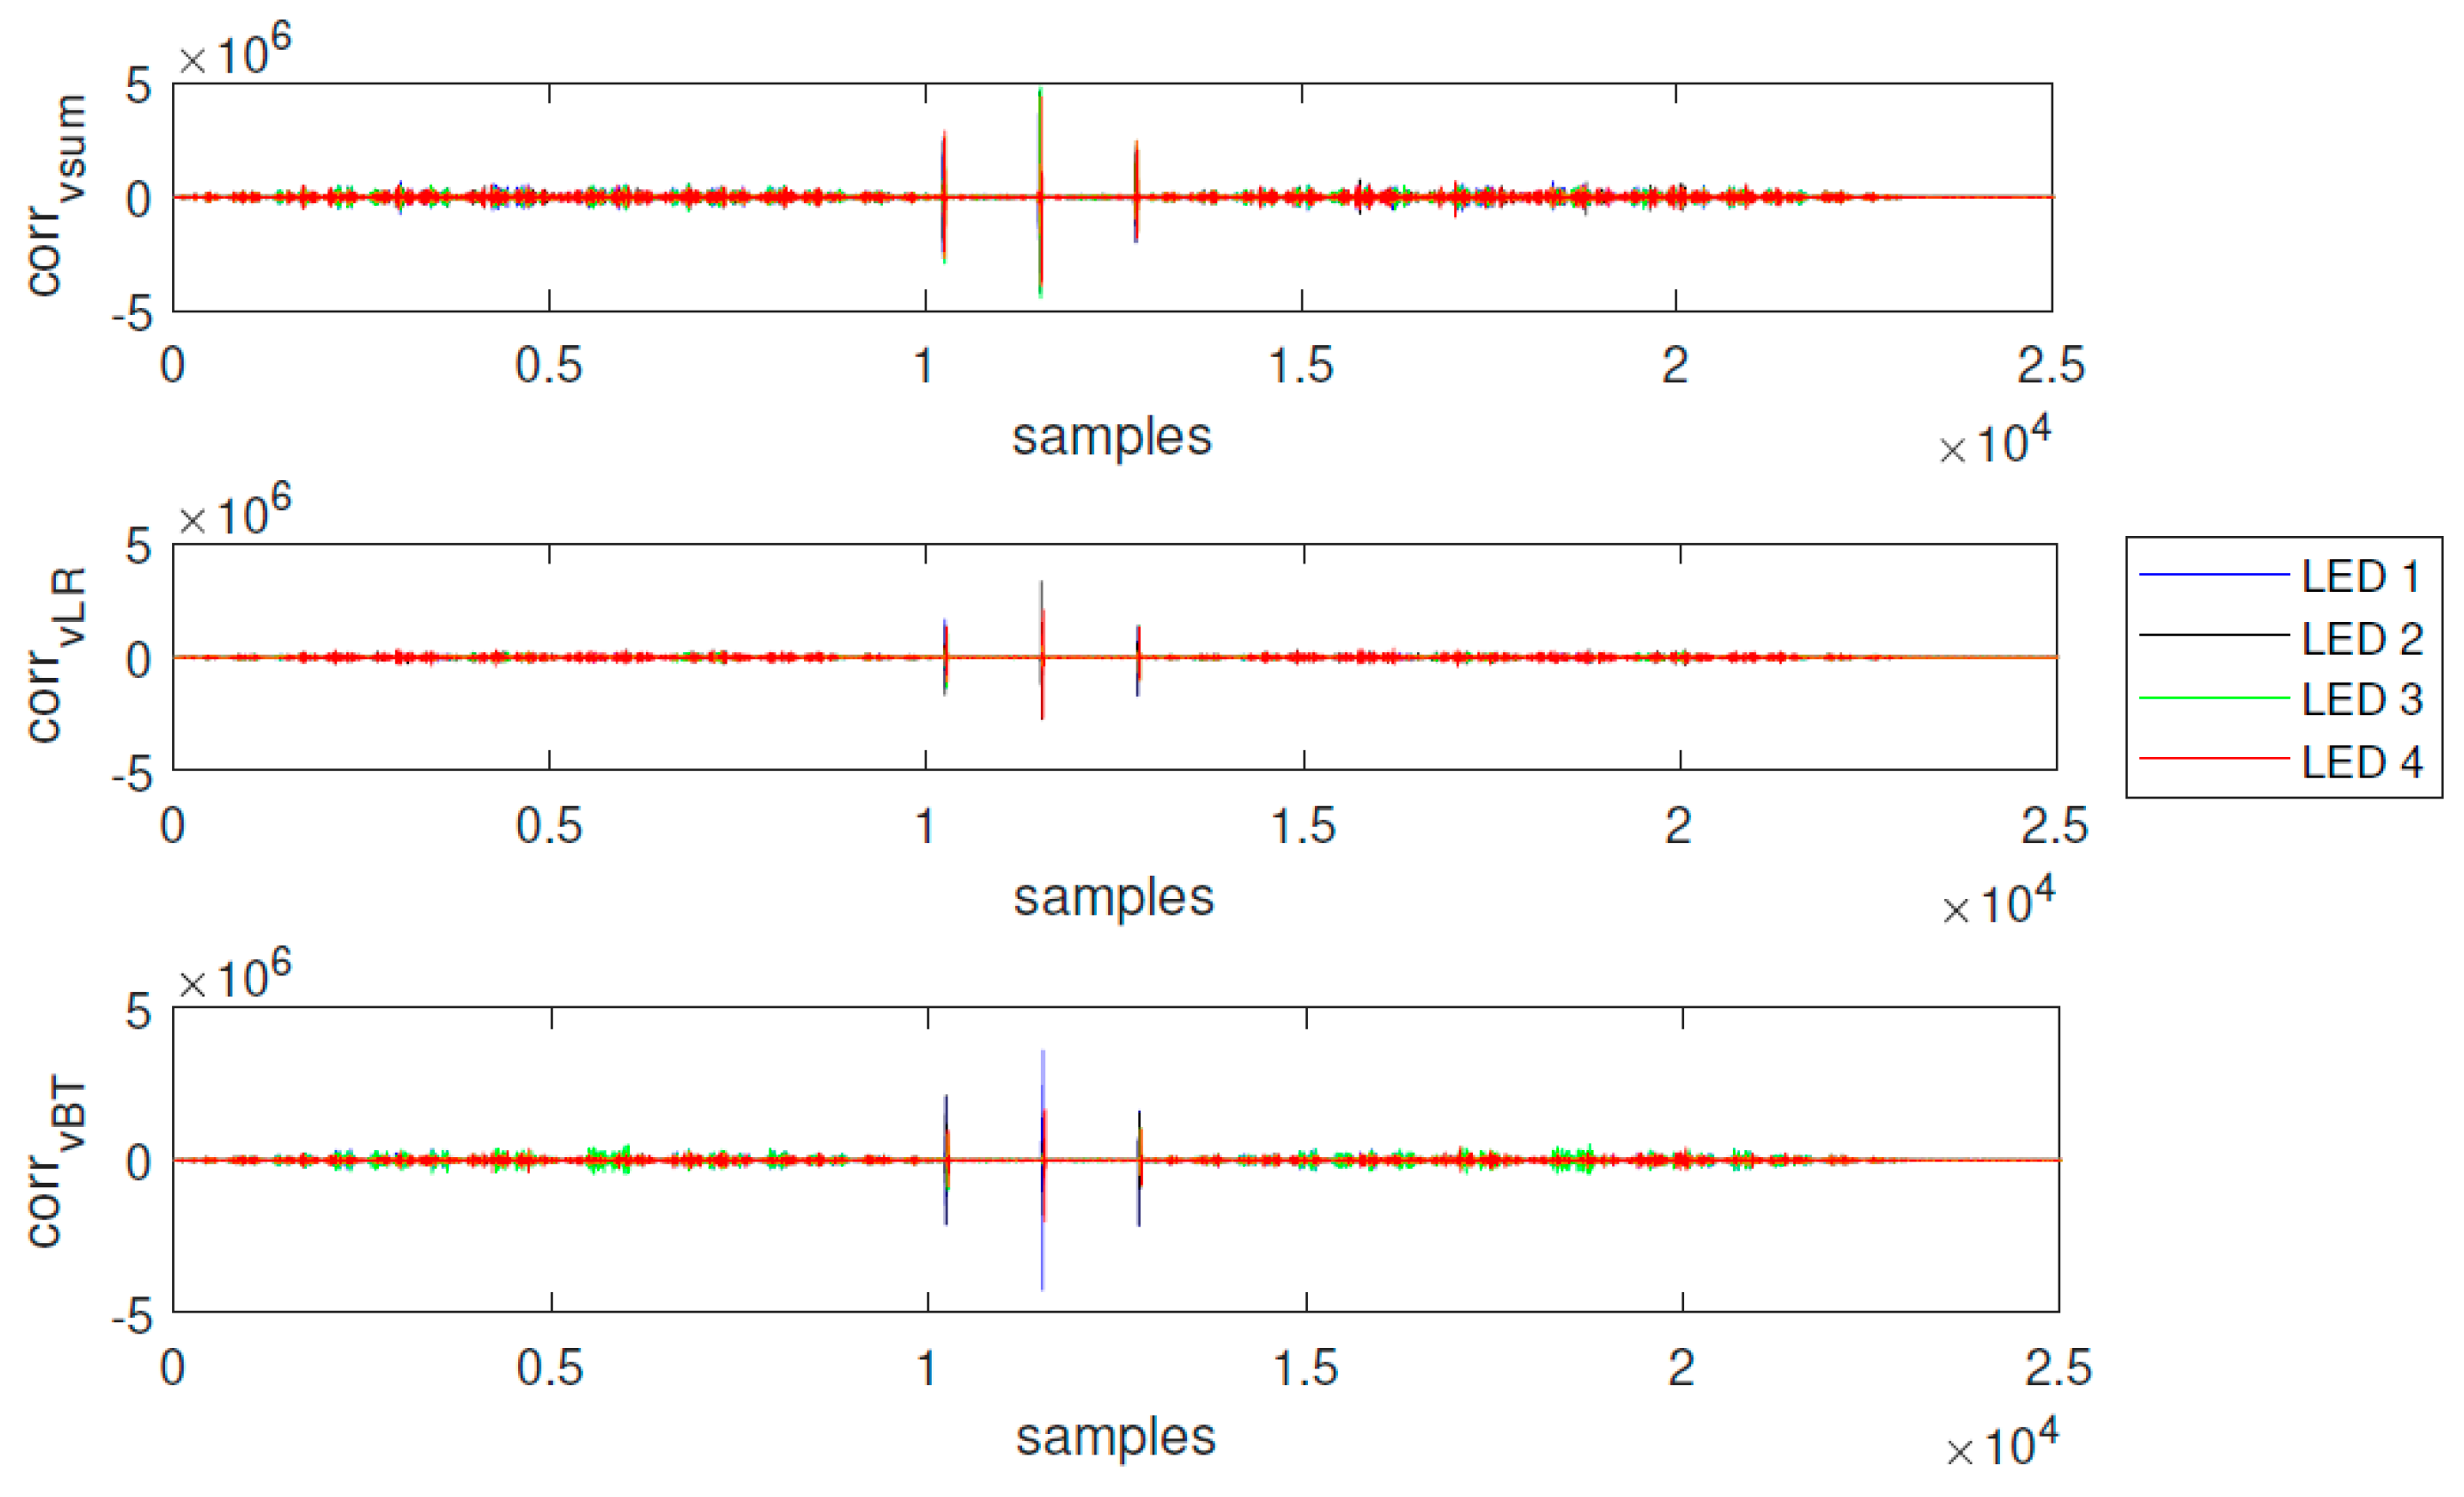
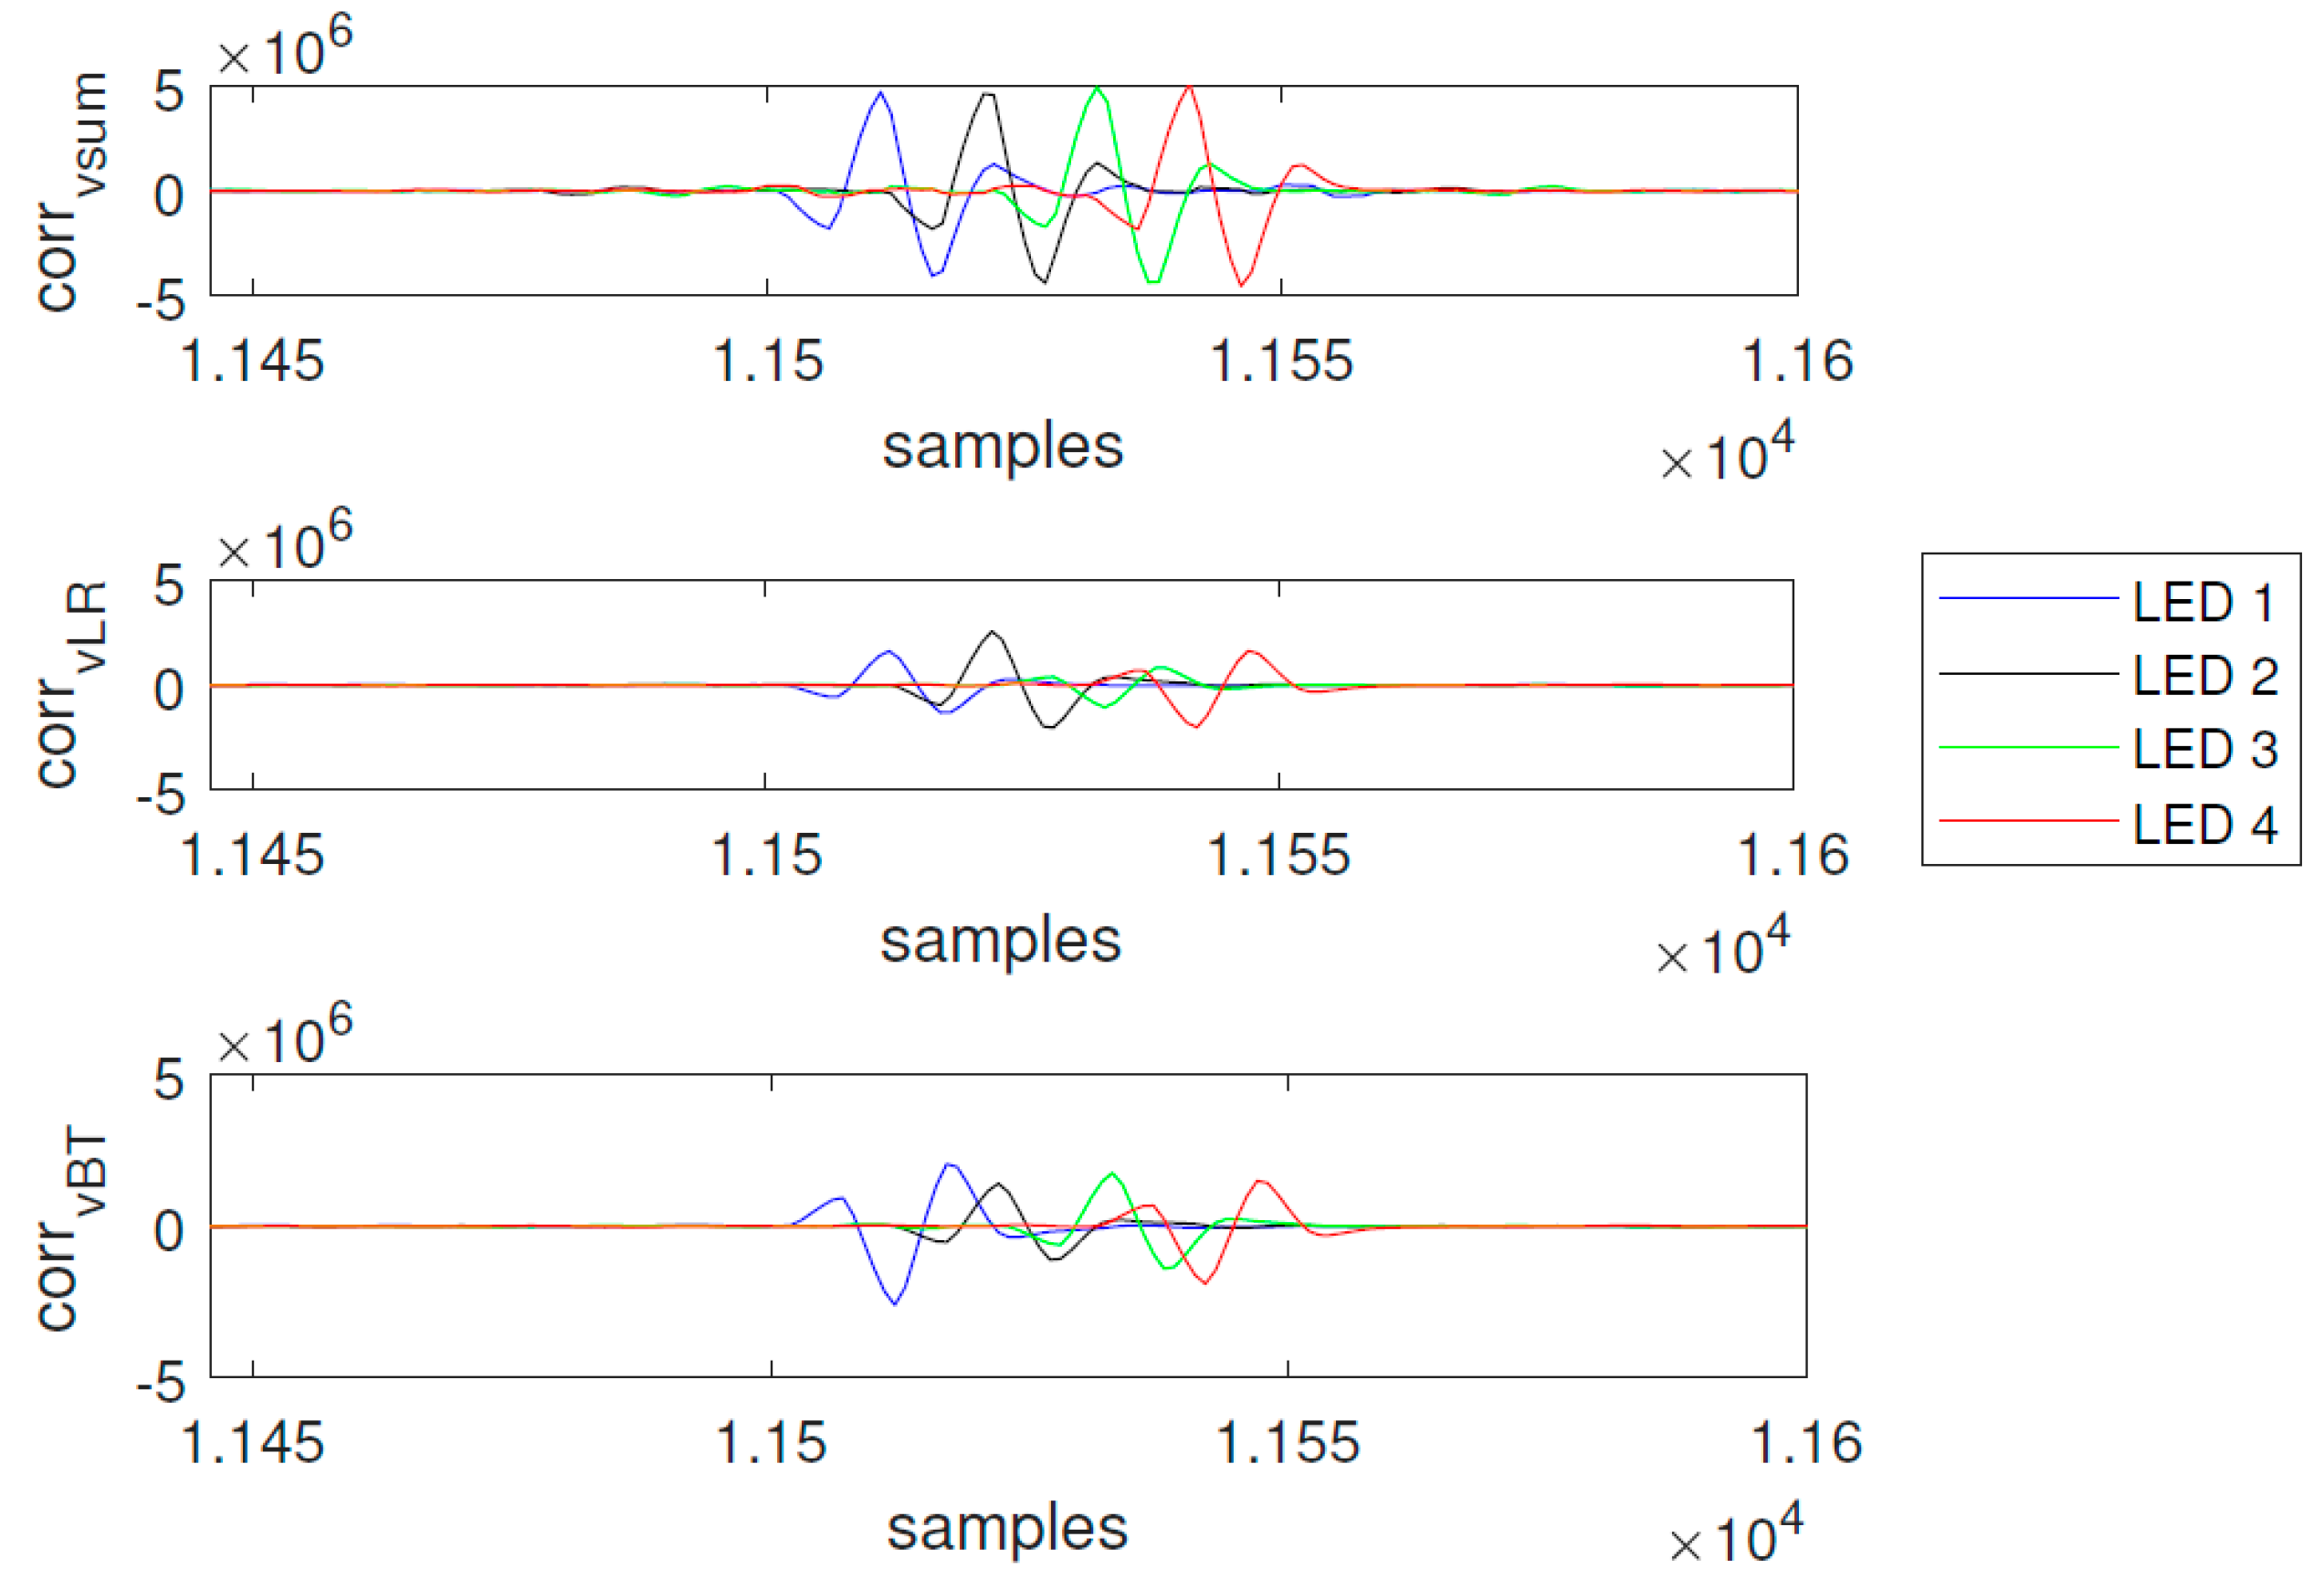
Figure 9 and
Figure 10 show the correlations of the experimentally received signals corresponding to all the beacons
i = {1, 2, 3, 4} for each of the channels
vfsum,
vfLR,
vfBT, and for every LS sequence. The correct simultaneous emission of the different LS codes by each of the transmitting beacons, the acquisition and USB transmission, and the simultaneous detection of the three channels have been verified. The zoom in
Figure 10 shows the displacement of 10 samples between the different transmissions. Remember that the LS sequences are broadcasted simultaneously by each LED
i, with a 10-sample offset with regard to the previous one.
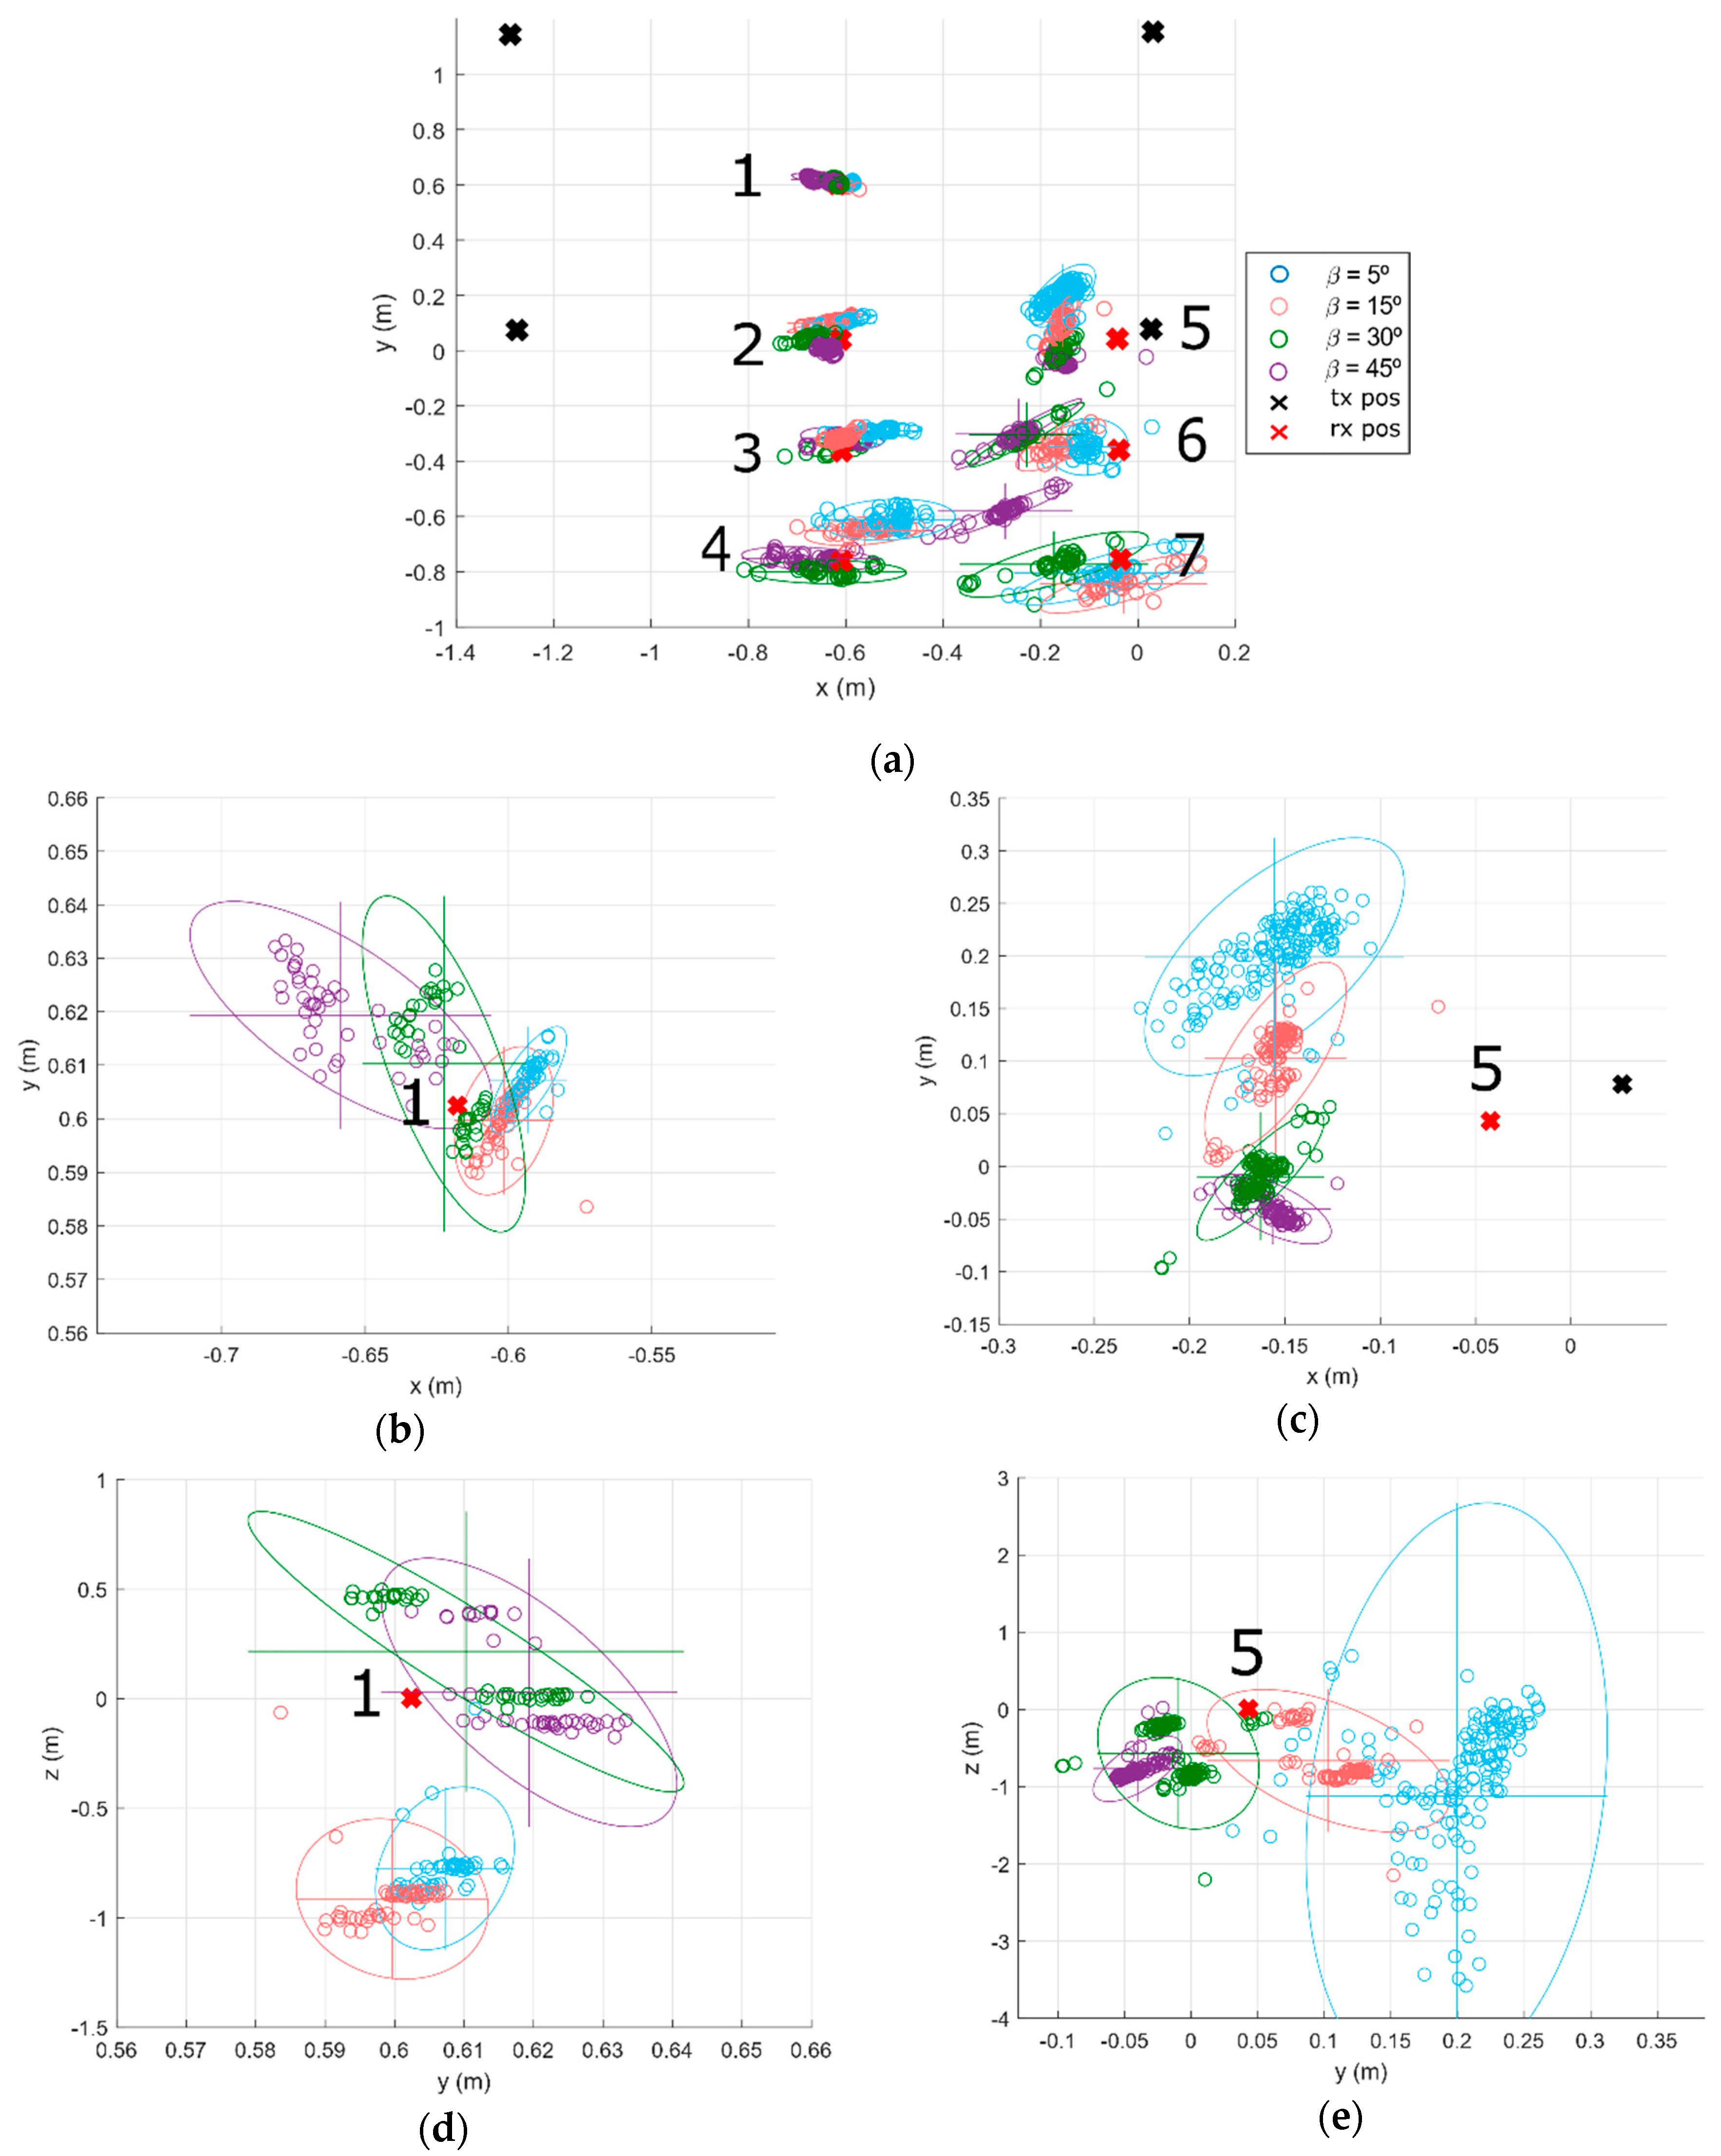
Finally,
Figure 11 shows the estimated positions for each of the points analyzed with the rotation angles
β = {5°, 15°, 30°, 45°}. The projections of the transmitters on the ground are represented by black crosses, the different positions of the receiver are represented by red crosses and the point cloud represents the 100 measurements taken for every point and angle. An error ellipse with a confidence of 95% has also been drawn.
The system has a higher precision and less dispersion in the center of the exploration area (P1) in contrast with the results obtained below a transmitting beacon (P5) or in the corner of the grid (P7). An Optitrack system [
28] was used to obtain the real positions (ground-truth) of the transmitting beacons and the different positions at which the receiver was placed. This system consists of a set of cameras distributed throughout the room that allow the position of the desired object to be obtained with an accuracy of 0.1 mm.
Table 1 shows the numerical results obtained and presented in
Figure 11. The average errors obtained are 1.5 and 10 cm, and the standard deviation is less than 1 and 1.5 cm in the XY plane at P1 and P5, respectively. It can also be observed that the angle of rotation where the greatest errors are obtained in the XY plane is
β = 45° for P1 and
β = 5° for P5. The greatest errors appear where the transmitting beacons and the axes of the QADA photoreceptor are aligned.
4. Conclusions
The implementation of an infrared local positioning system has been described in this work. The transmitter system is based on four transmitter beacons, each one of them emitting a particular LS code; on a reception module, which consists of a QADA photoreceptor, a filtering system and an acquisition system; and on a synchronism system built with a particular IR beacon and a photodetector. Synchronism detectors are located in the receiving module and in each of the transmitting beacons, thus allowing a simultaneous reception and transmission.
The processing stage at the receiver module performs the correlations of the acquired signal with the different codes used in each transmitter. From the correlation peaks, the global sum of energy received in the QADA, as well as the differences in energy between the left-right side and the bottom-top one, are obtained. Furthermore, the relations between those peaks allow the system to obtain the incidence angles from each beacon on the QADA surface. From these angles, the position of the receiver is estimated, provided that the beacons’ positions are known.
The proposal has been characterized experimentally with a real setup installed in a room with a surface area of 55 m2 and a height of 3.4 m. The beacons were installed in the ceiling in a square with a side of 1.2 m and the receiver on the floor (the effective testing area was 3 × 3 m2, below the transmitters). Acquired experimental signals and their correlations with the different transmitted codes have been presented. Additionally, the estimation of the position of the receiver in that environment for seven particular points (P1 to P7), with P1 at the center of the emitters’ projection on the floor and the other covering one of the octants of this projection, has been performed for one hundred trials, using an Optitrack system to determine the ground-truth. The obtained absolute average errors, considering all the points, are 7.1, 5.4, and 47.3 cm in the X, Y and Z axes, respectively. As for future works, it is intended to carry out a fine calibration of the intrinsic parameters of the QADA with its aperture in order to apply PnP algorithms and to estimate the complete 3D receiver pose.

 ,
, 


