Dynamic Analysis of a Spring-Asphalt Three-Dimensional Isolation System Based on Cyclic Simple Shear and Shaking Table Tests

Abstract
:1. Introduction
2. Experimental Study of HCC-Modified Asphalt
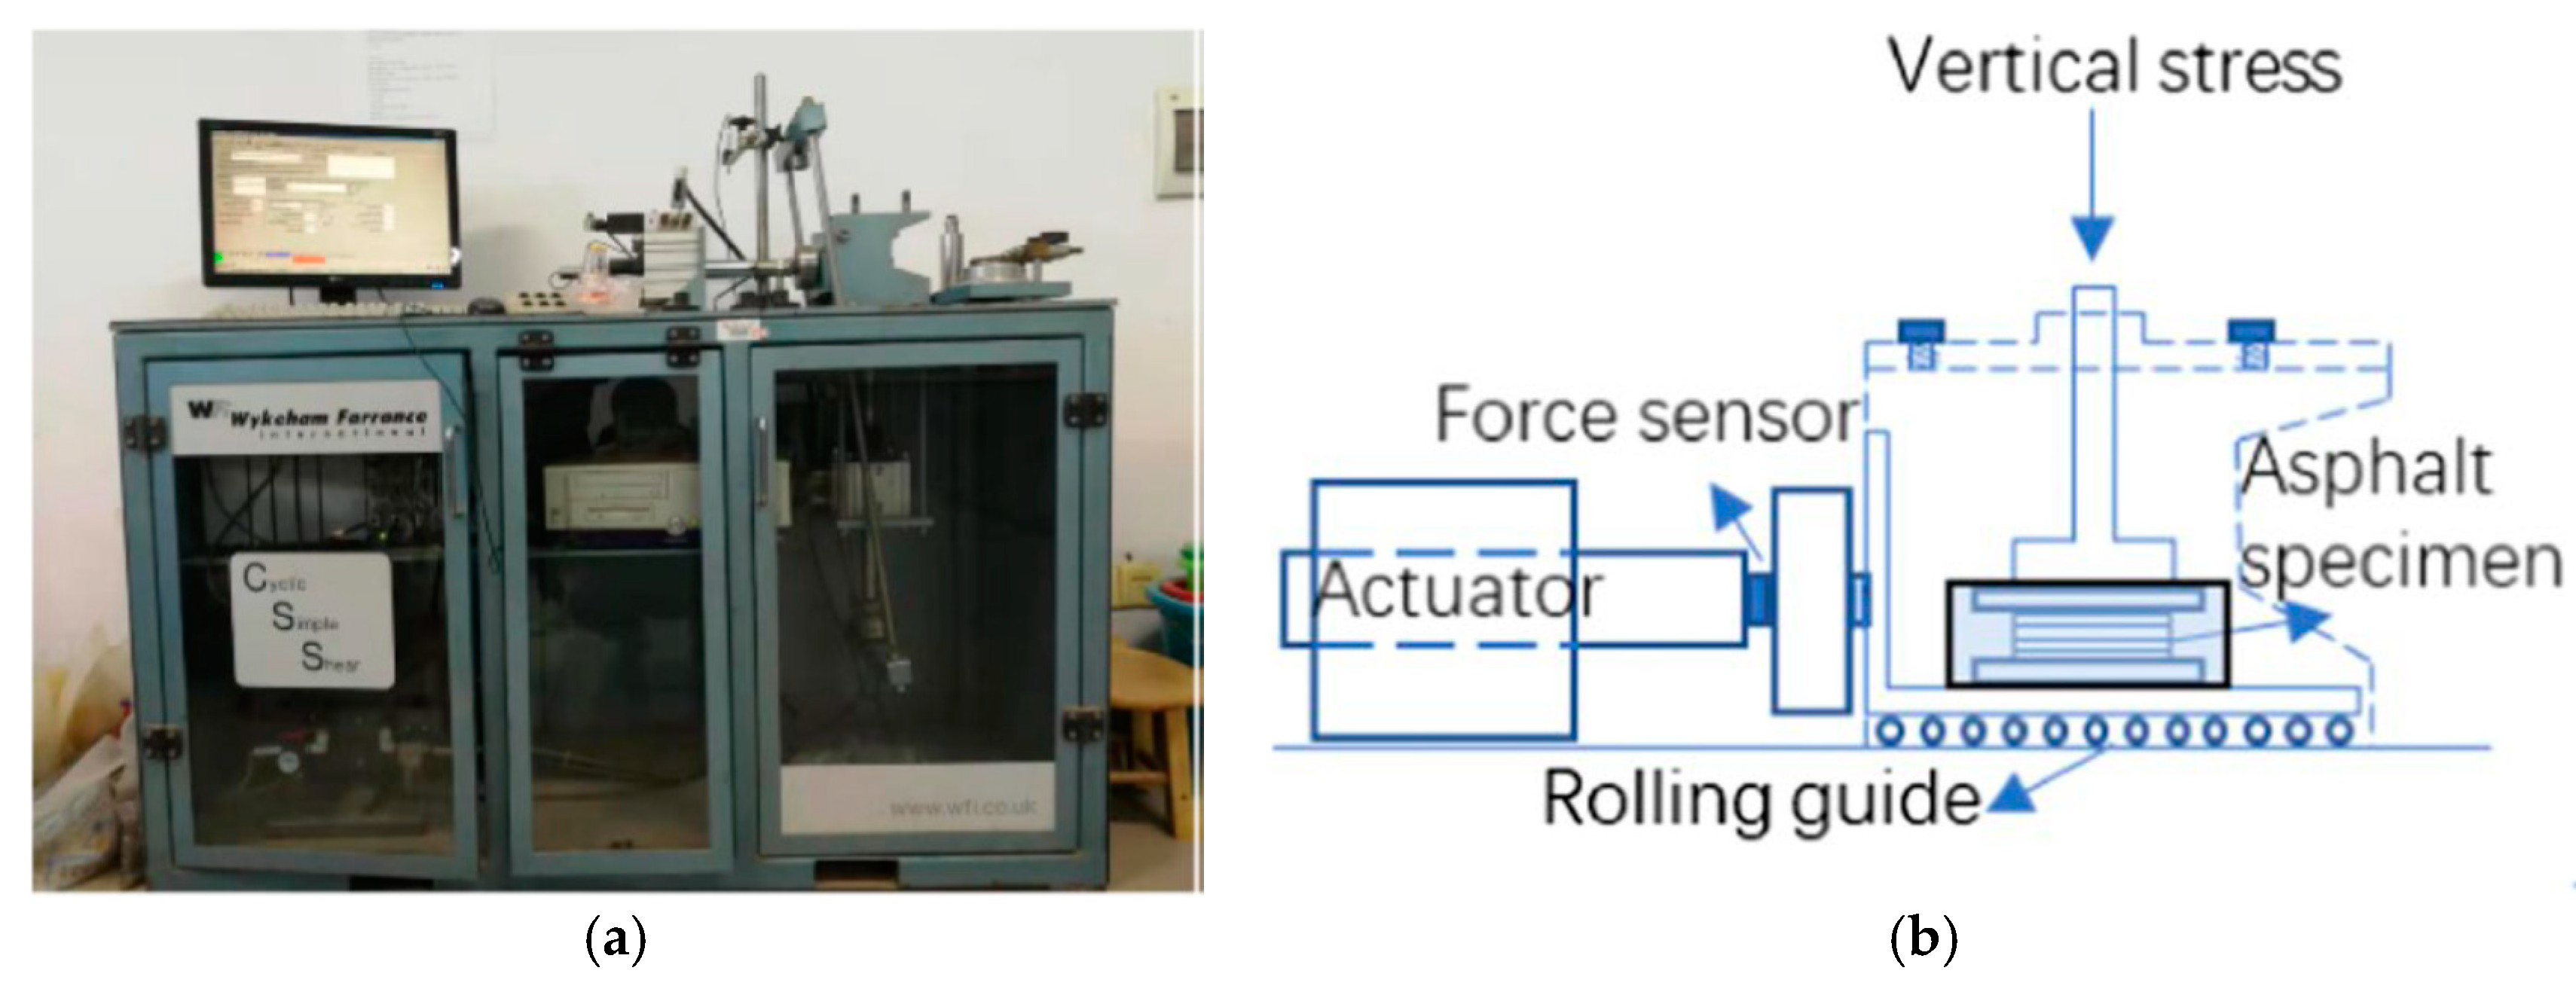
2.1. Test Design and Procedure
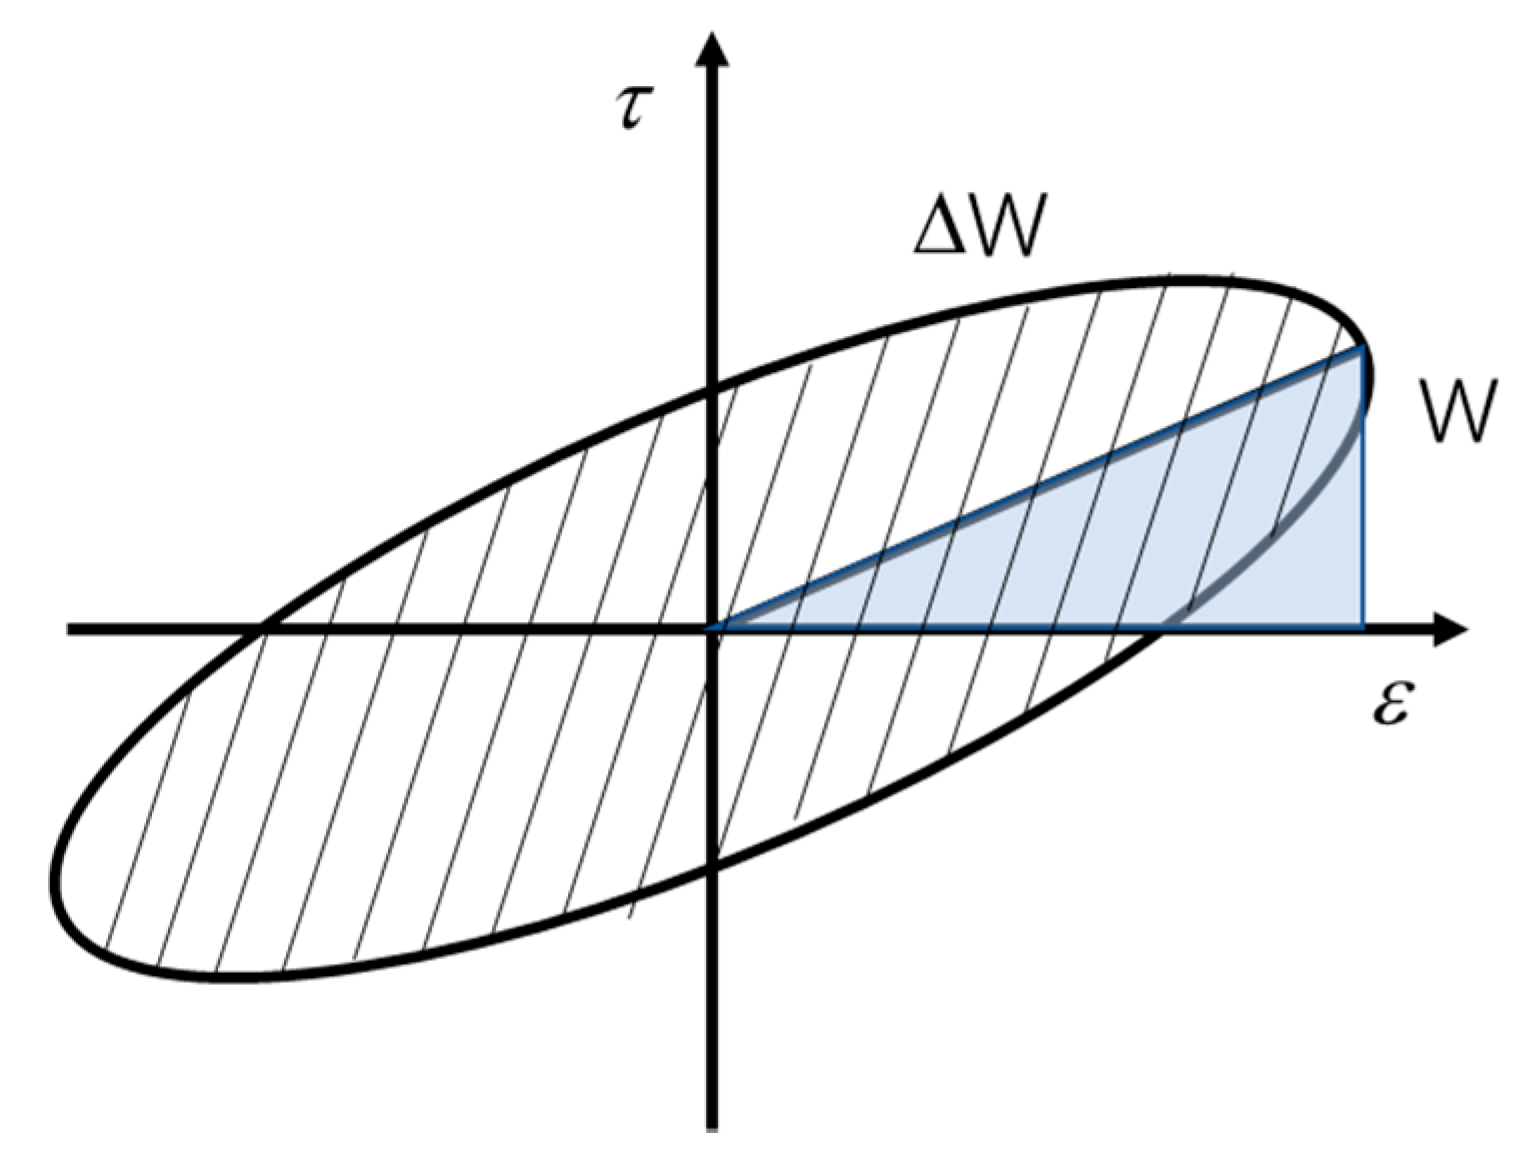
2.2. Parameter Identification
2.3. Effect of Repeated Loadings
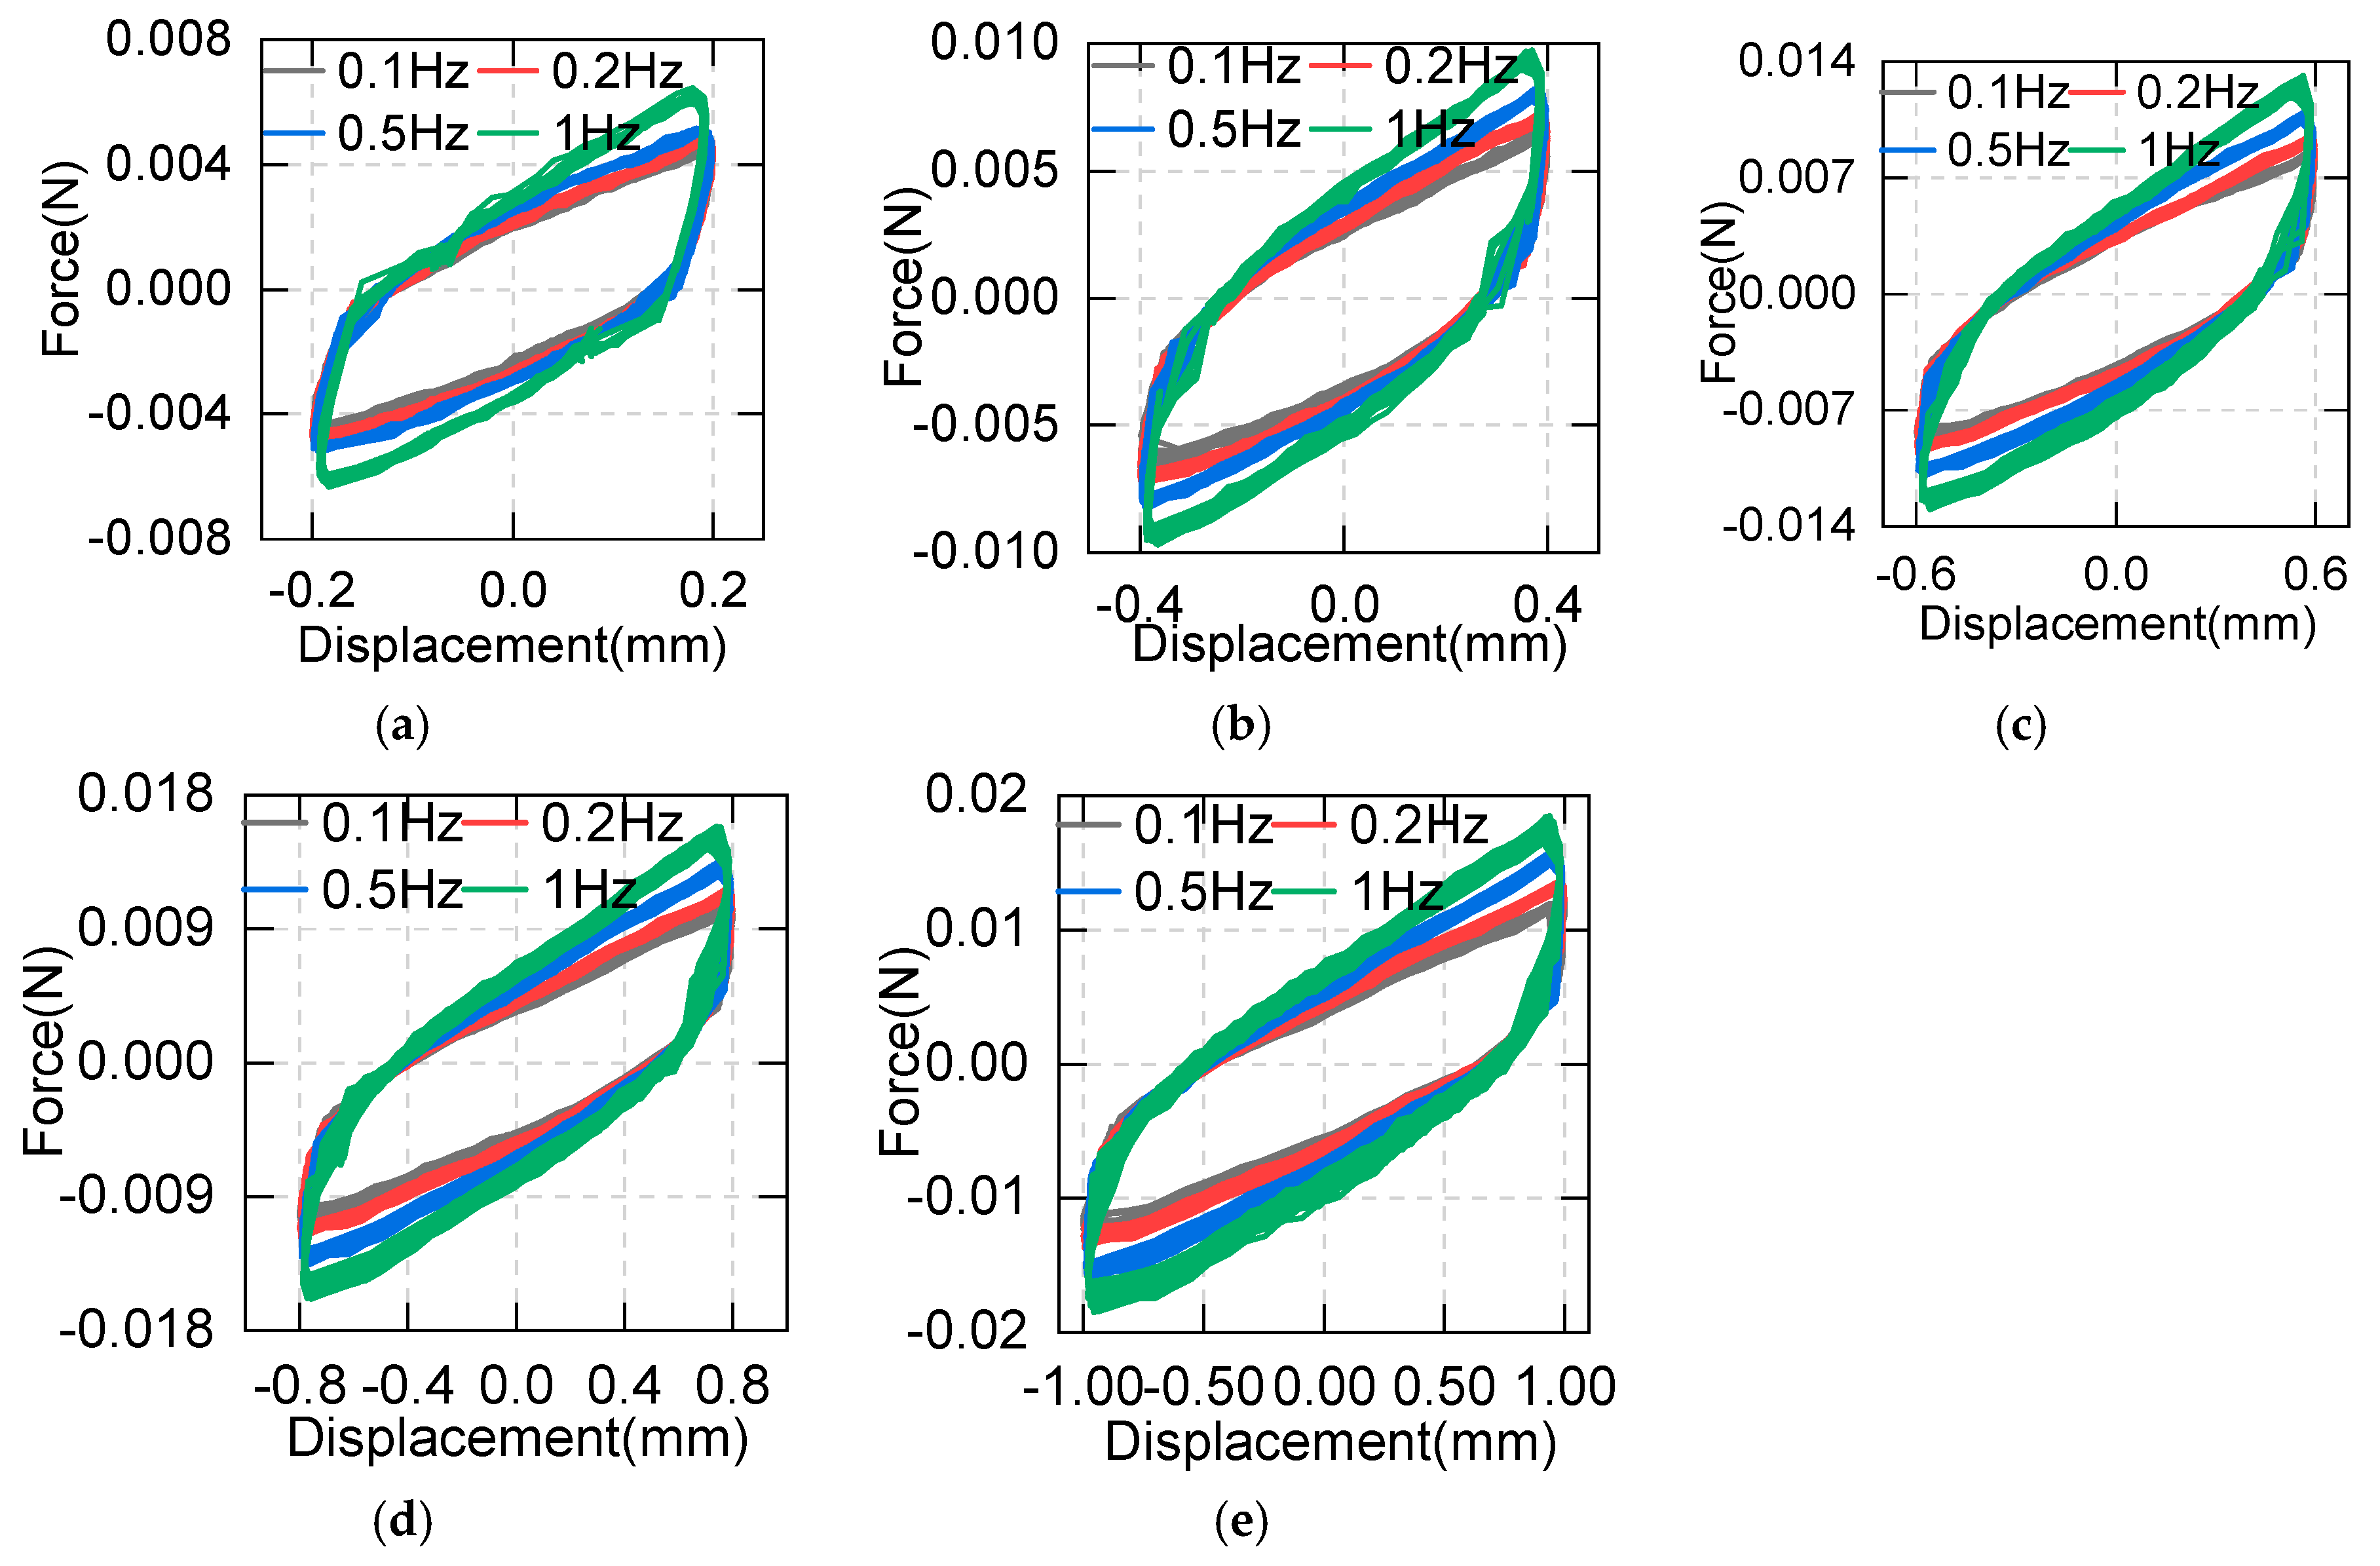
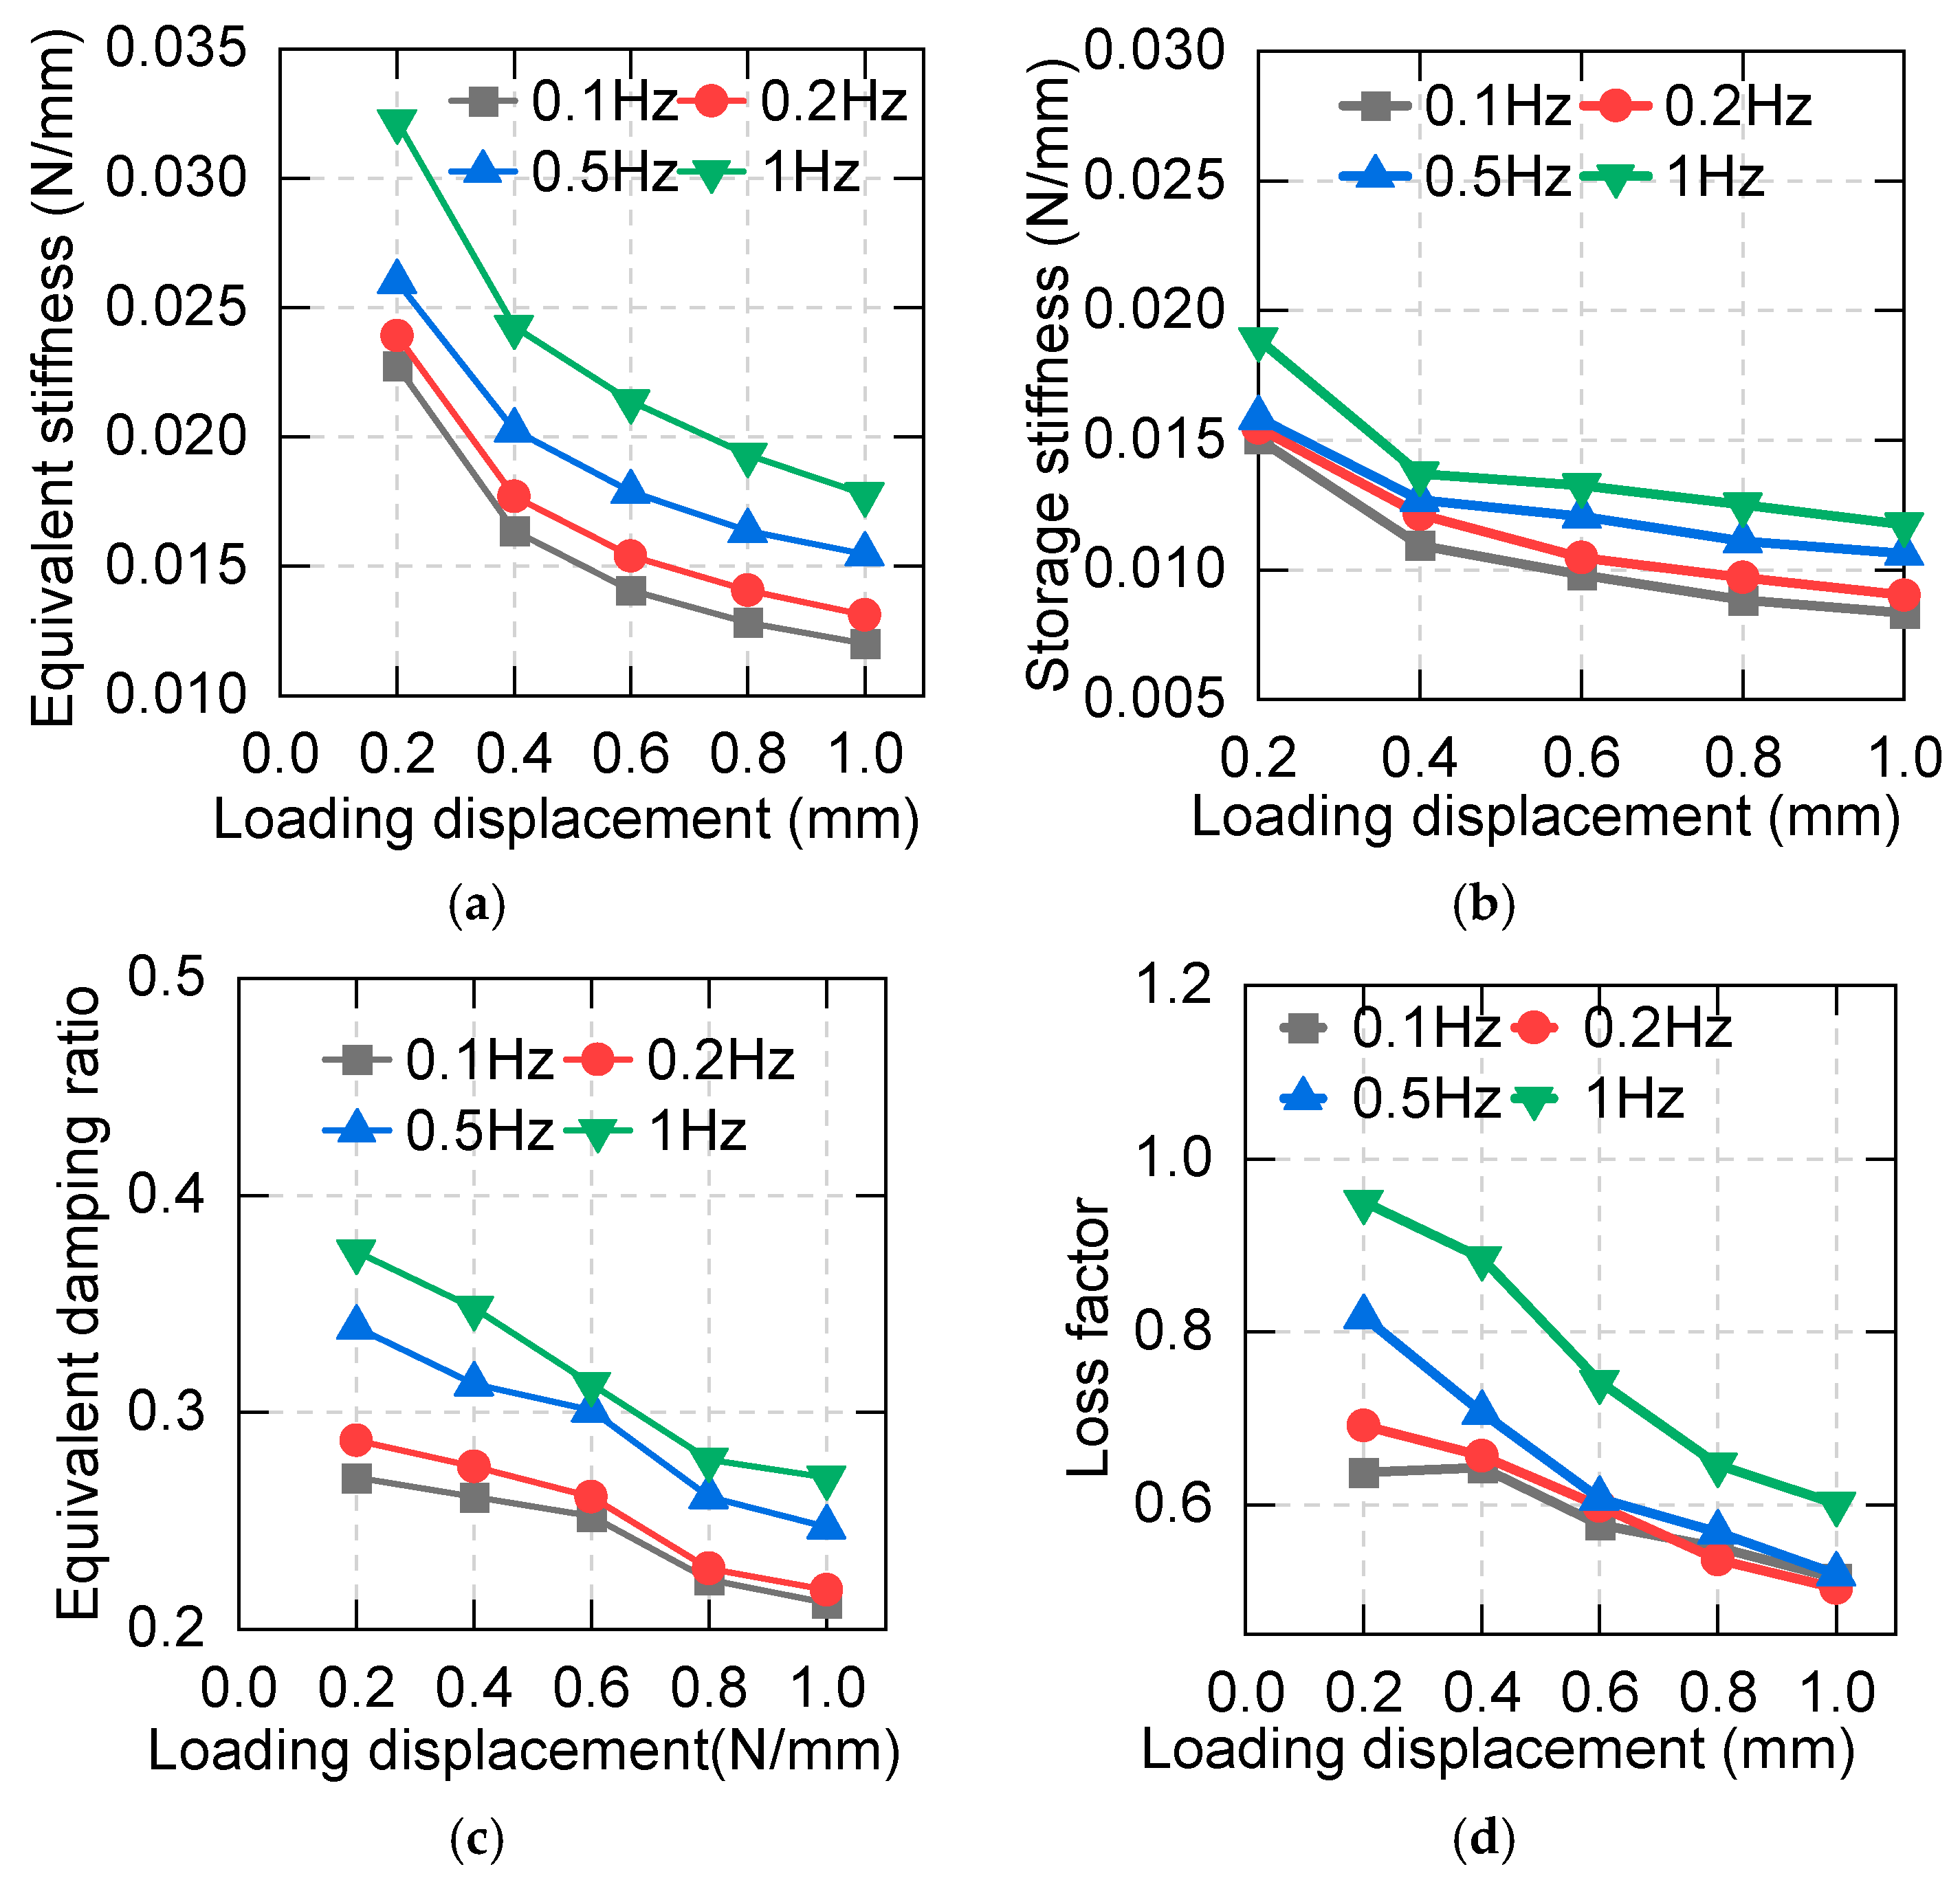
2.4. Effect of the Loading Frequency
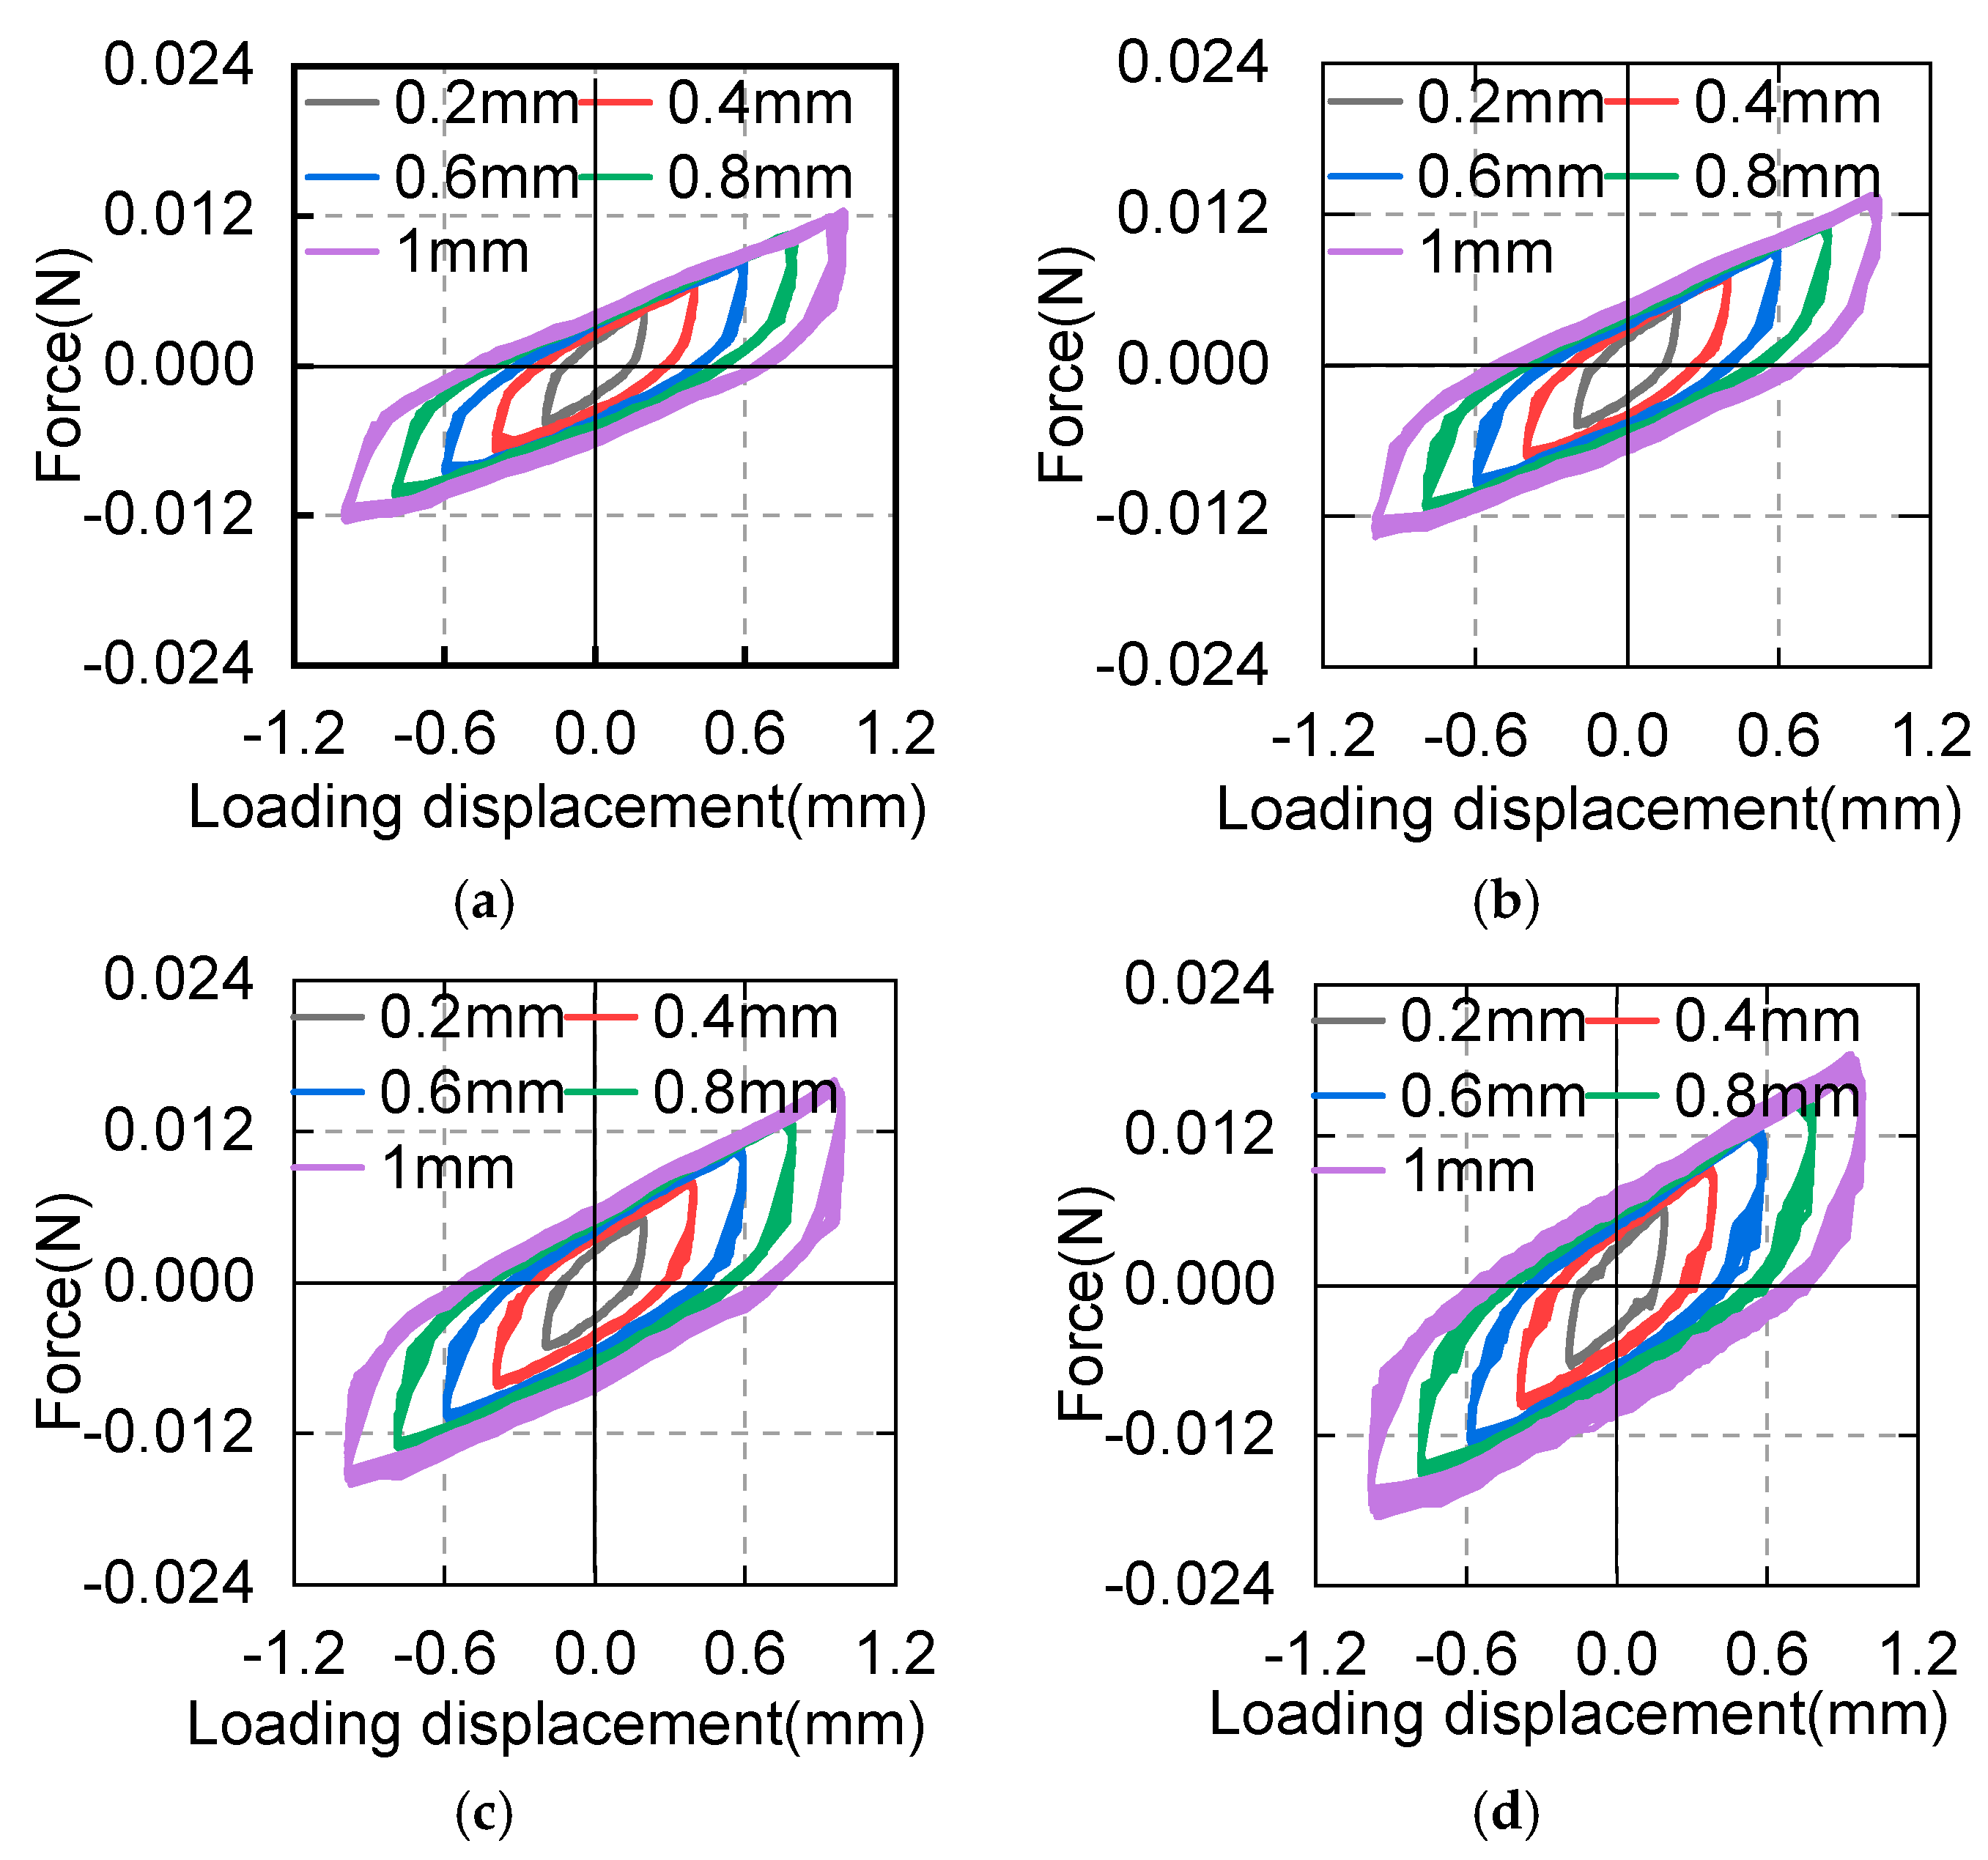
2.5. Effect of the Loading Displacement Amplitude
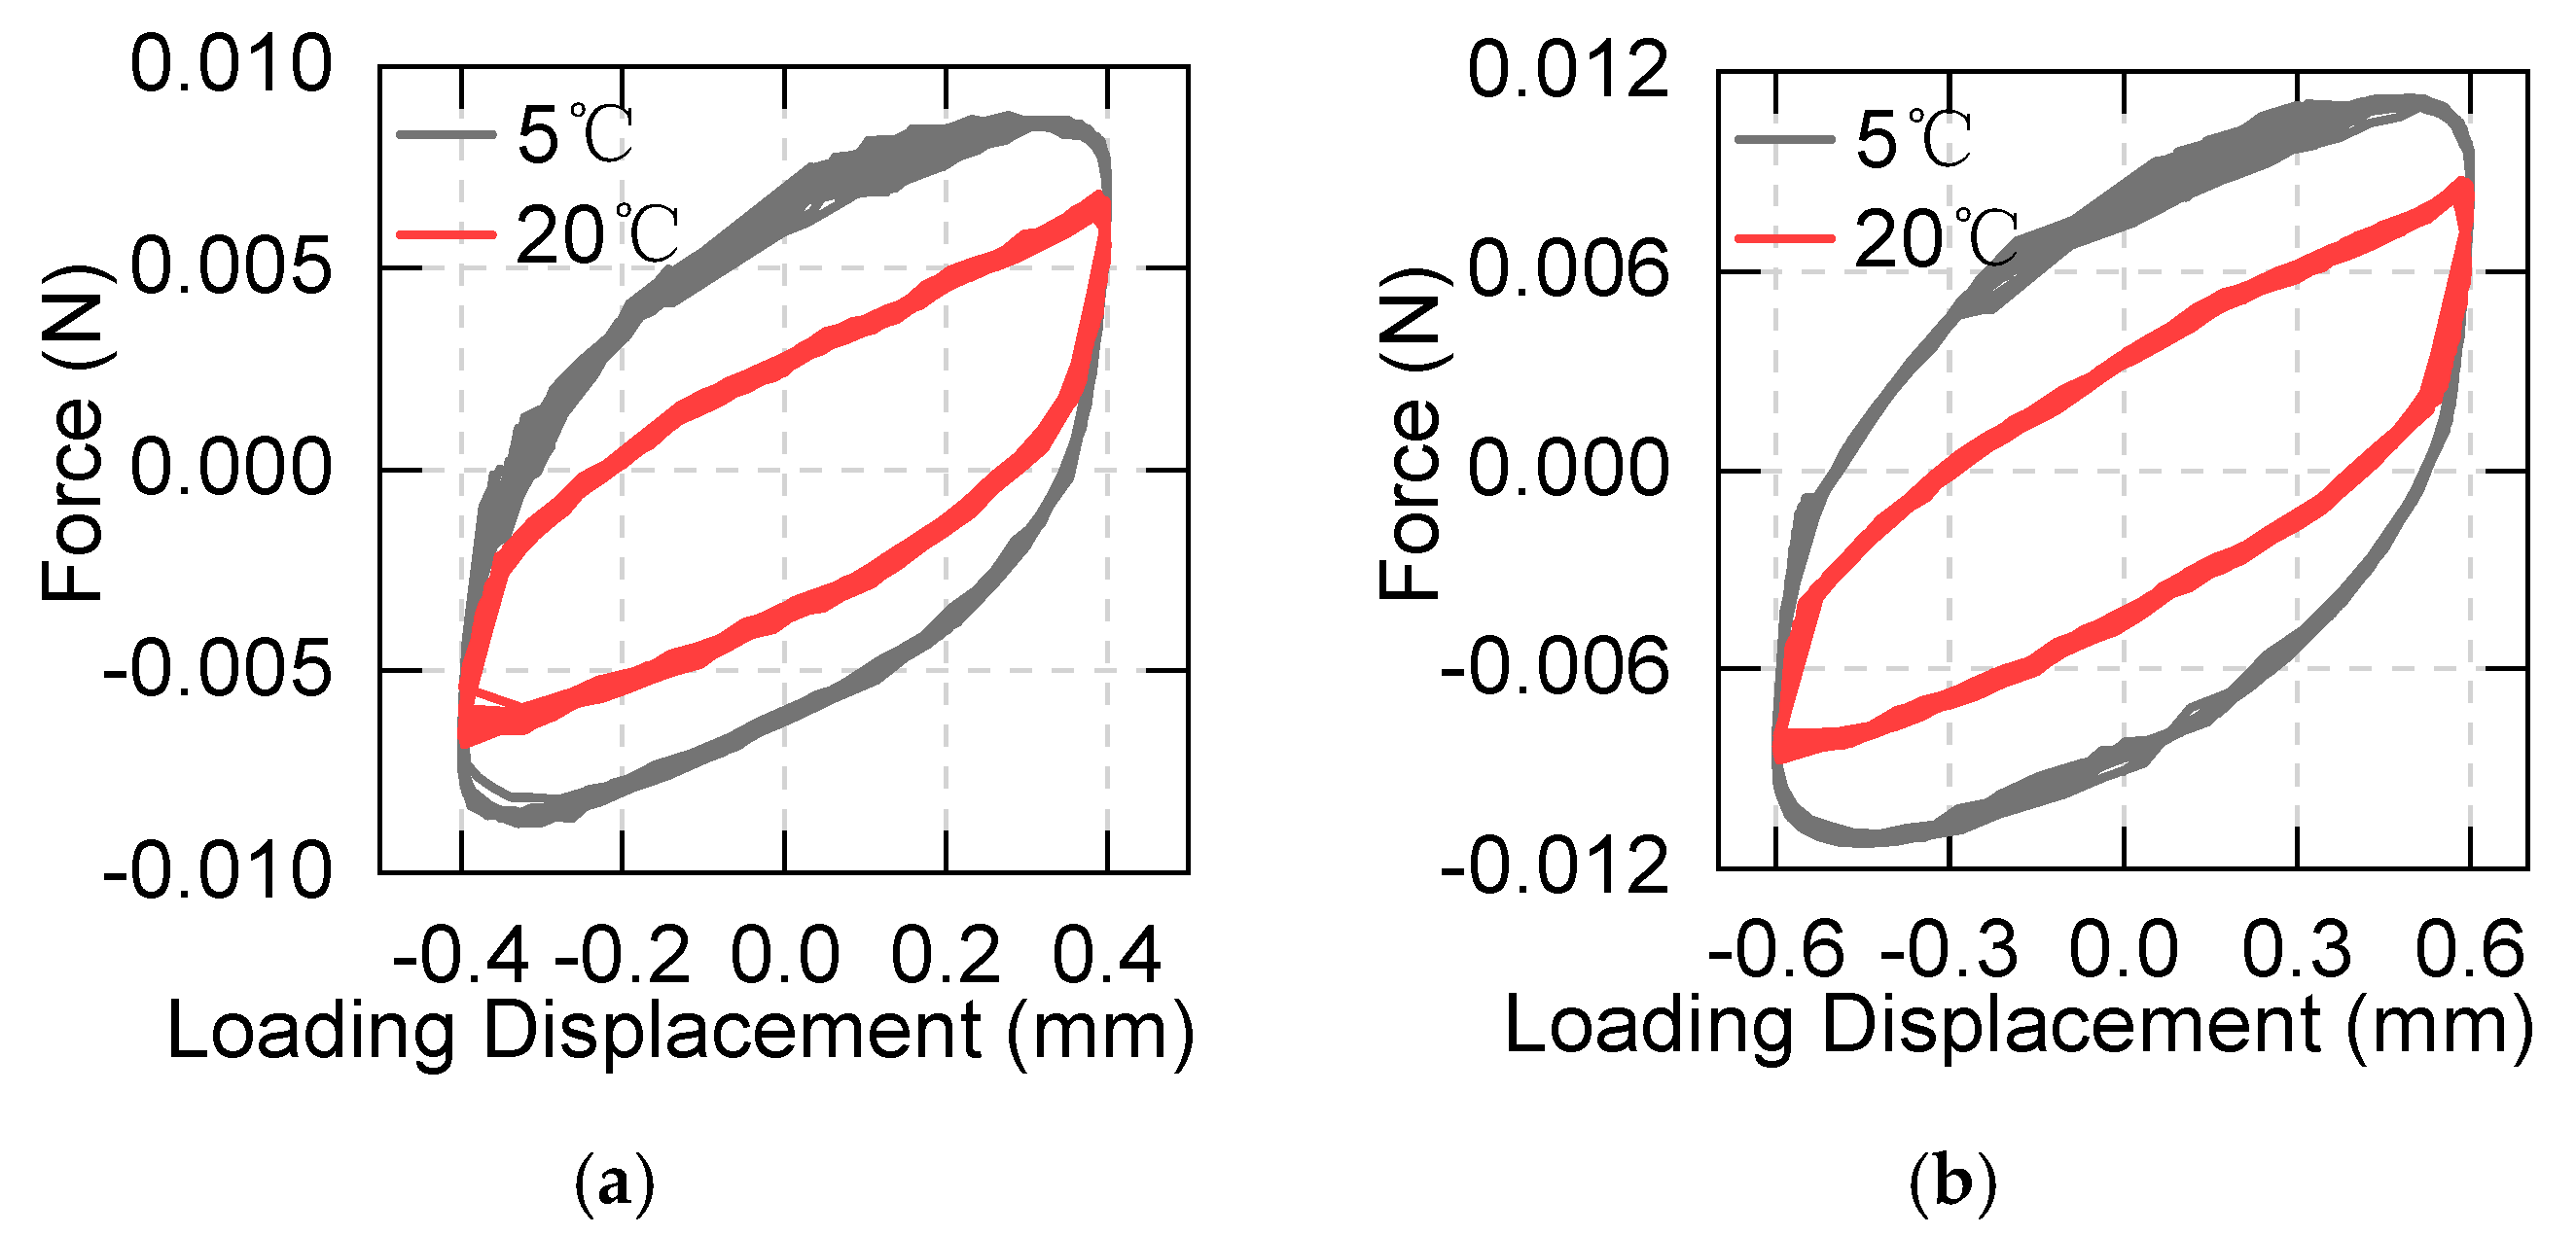
2.6. Effect of the Temperature
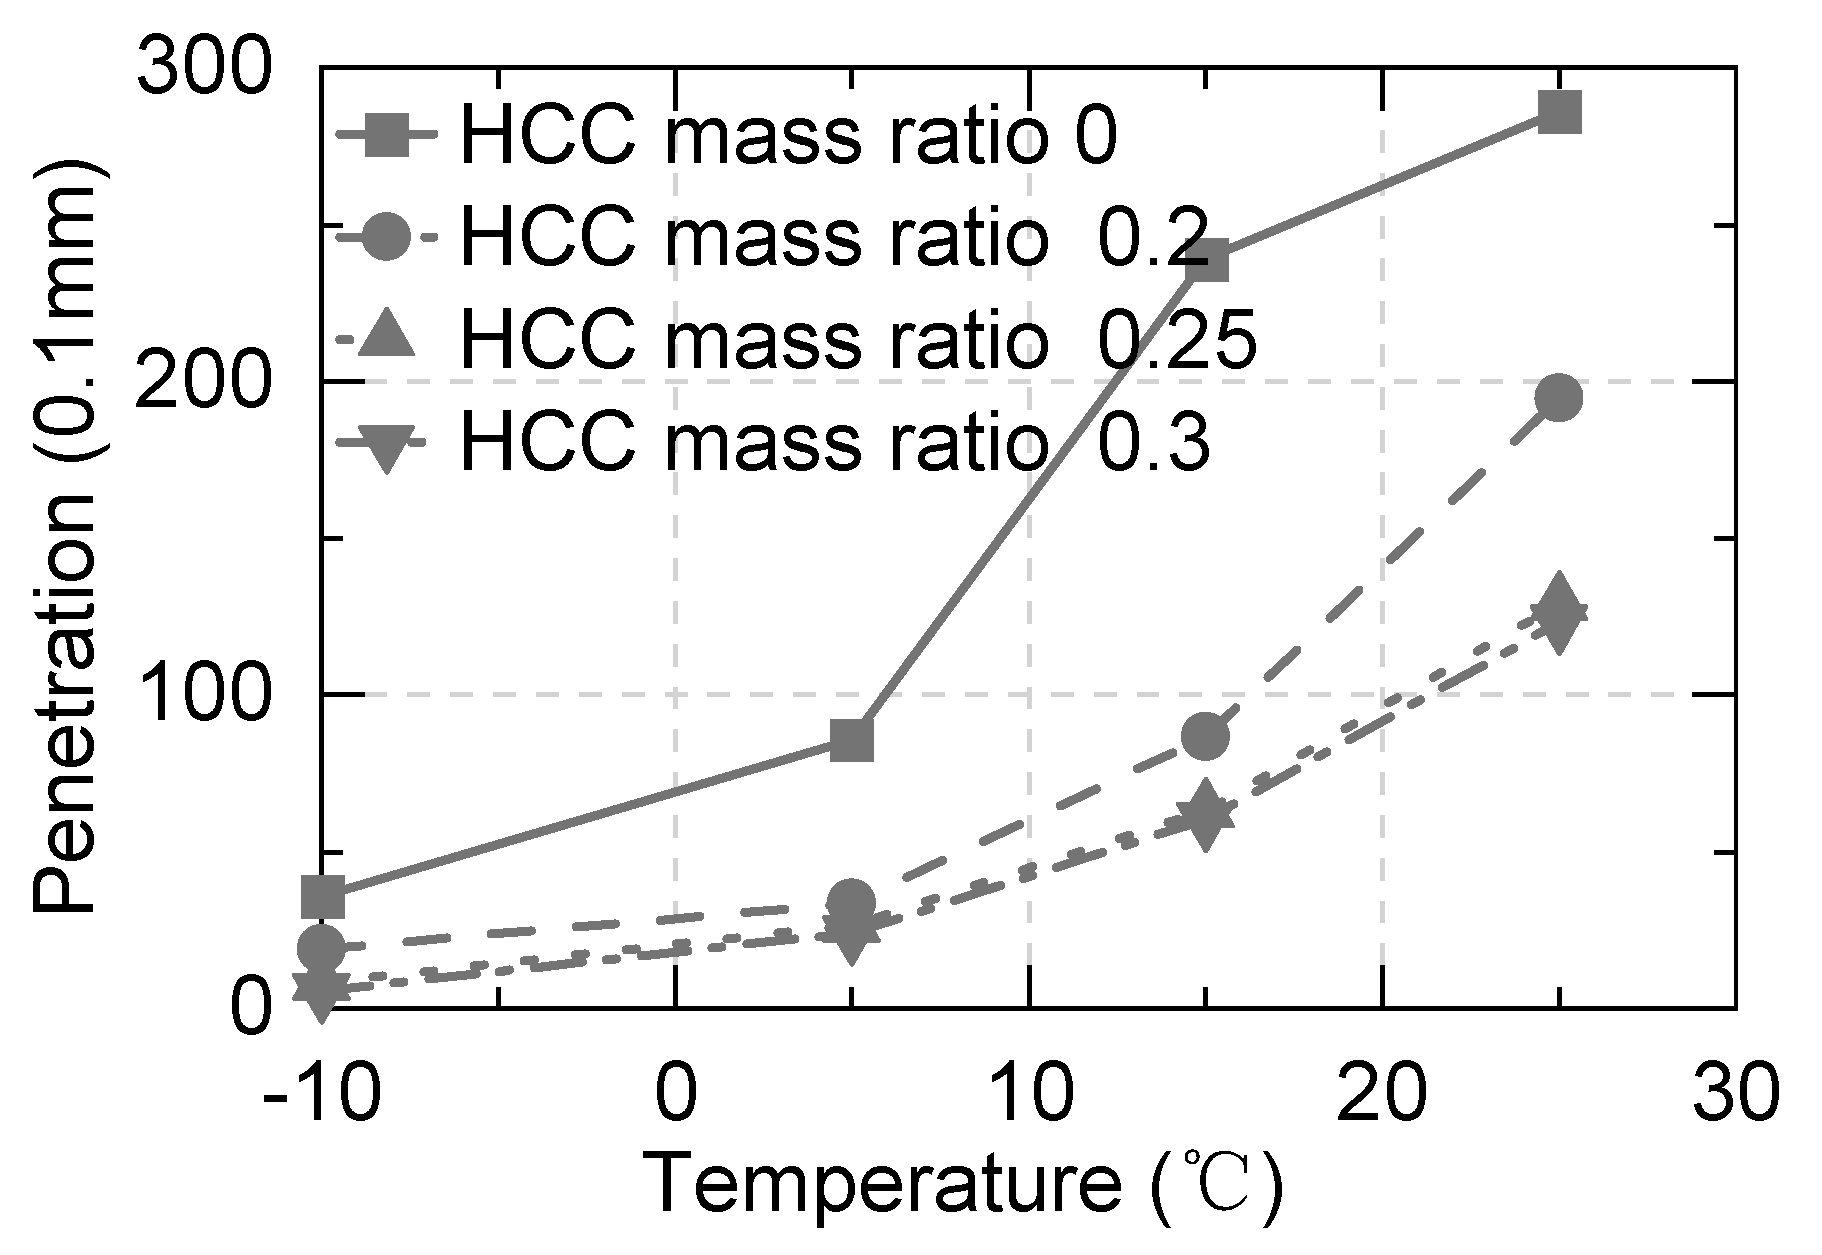
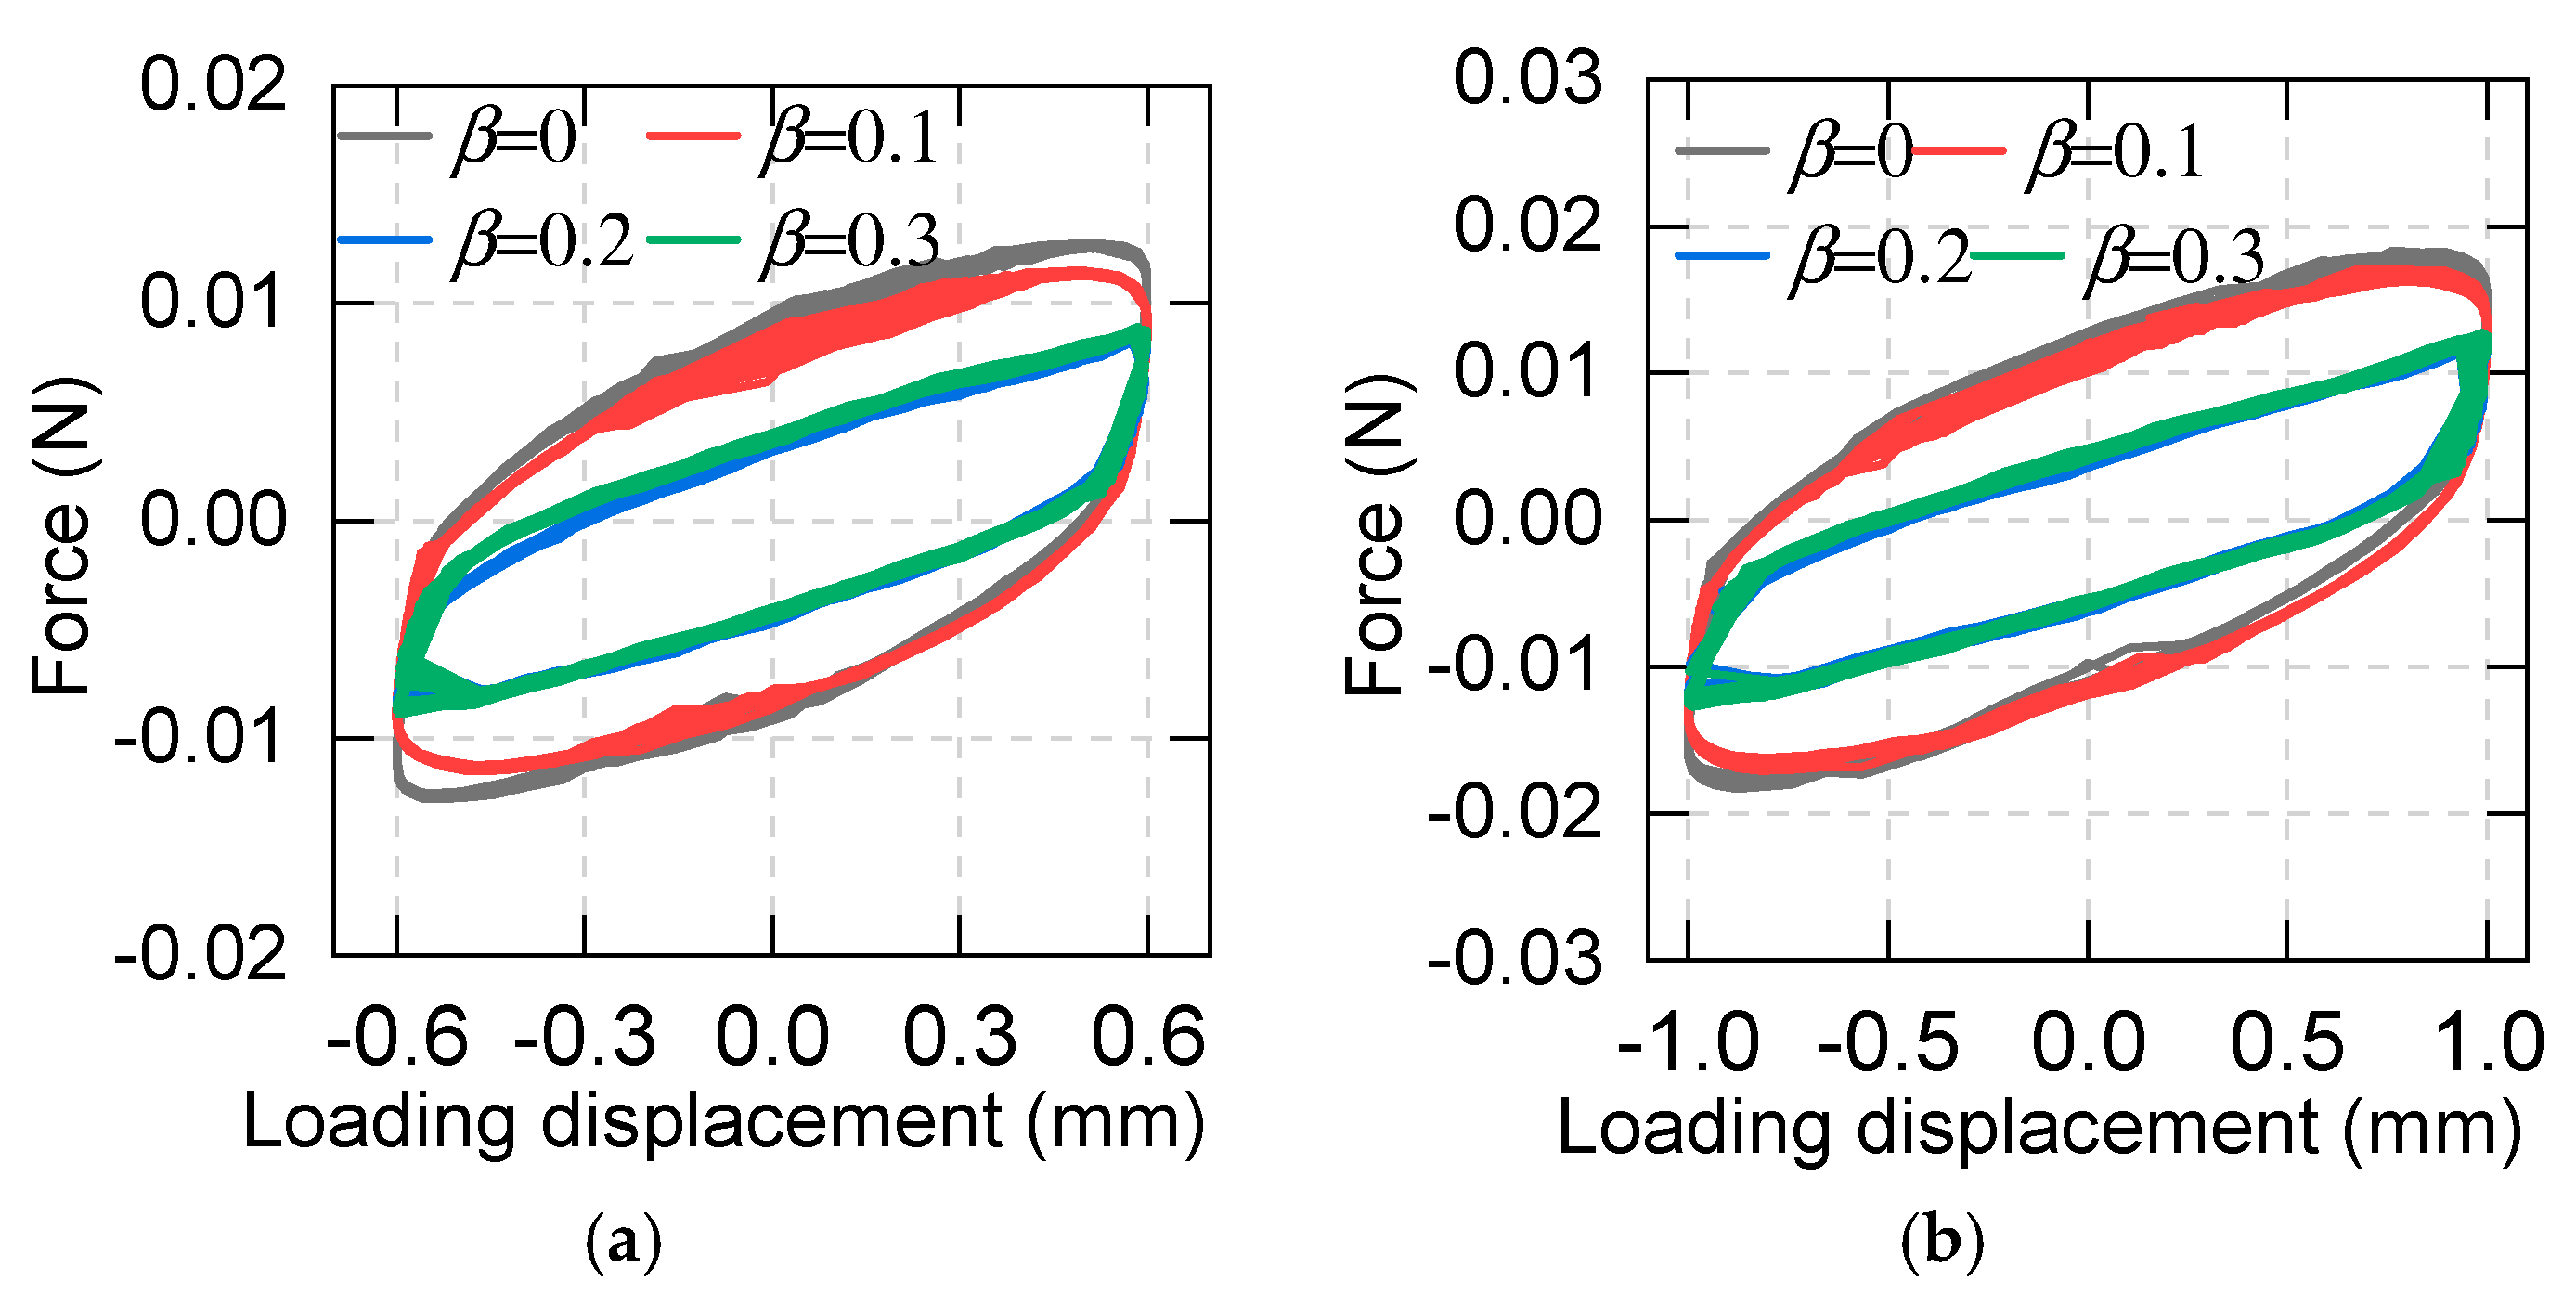
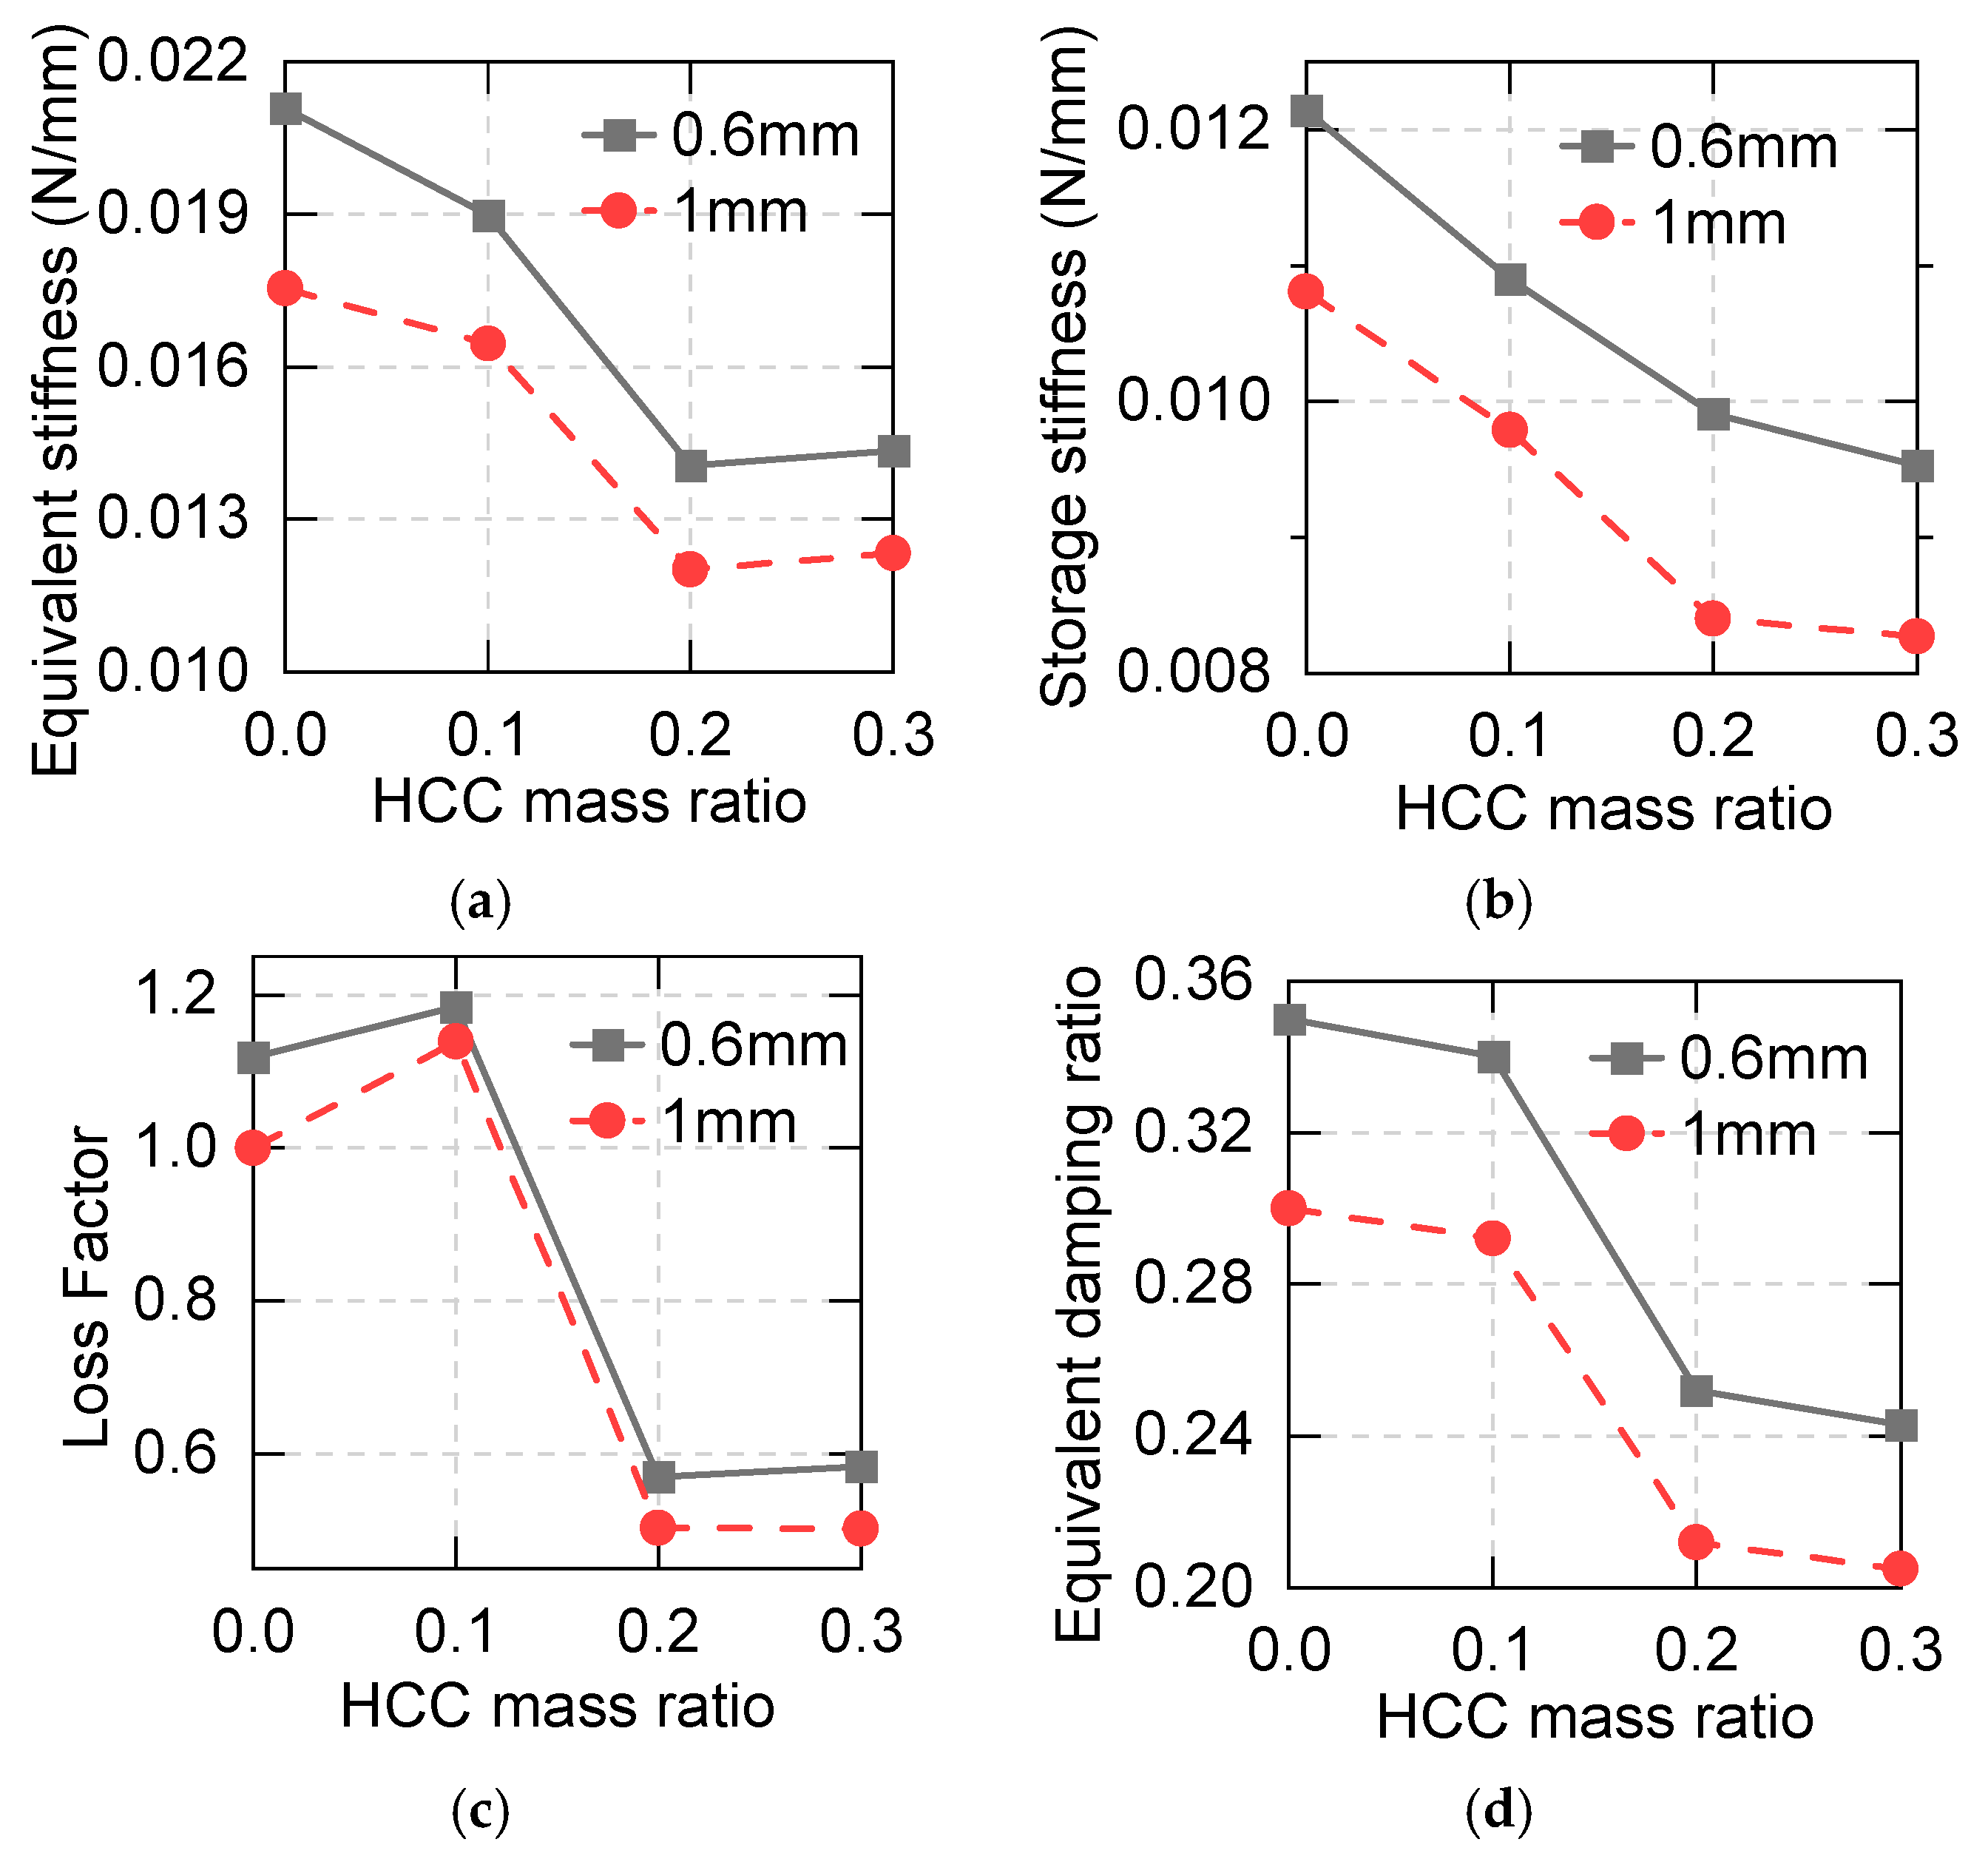
2.7. Effect of the HCC Content
2.8. Discussion
3. Shaking Table Test
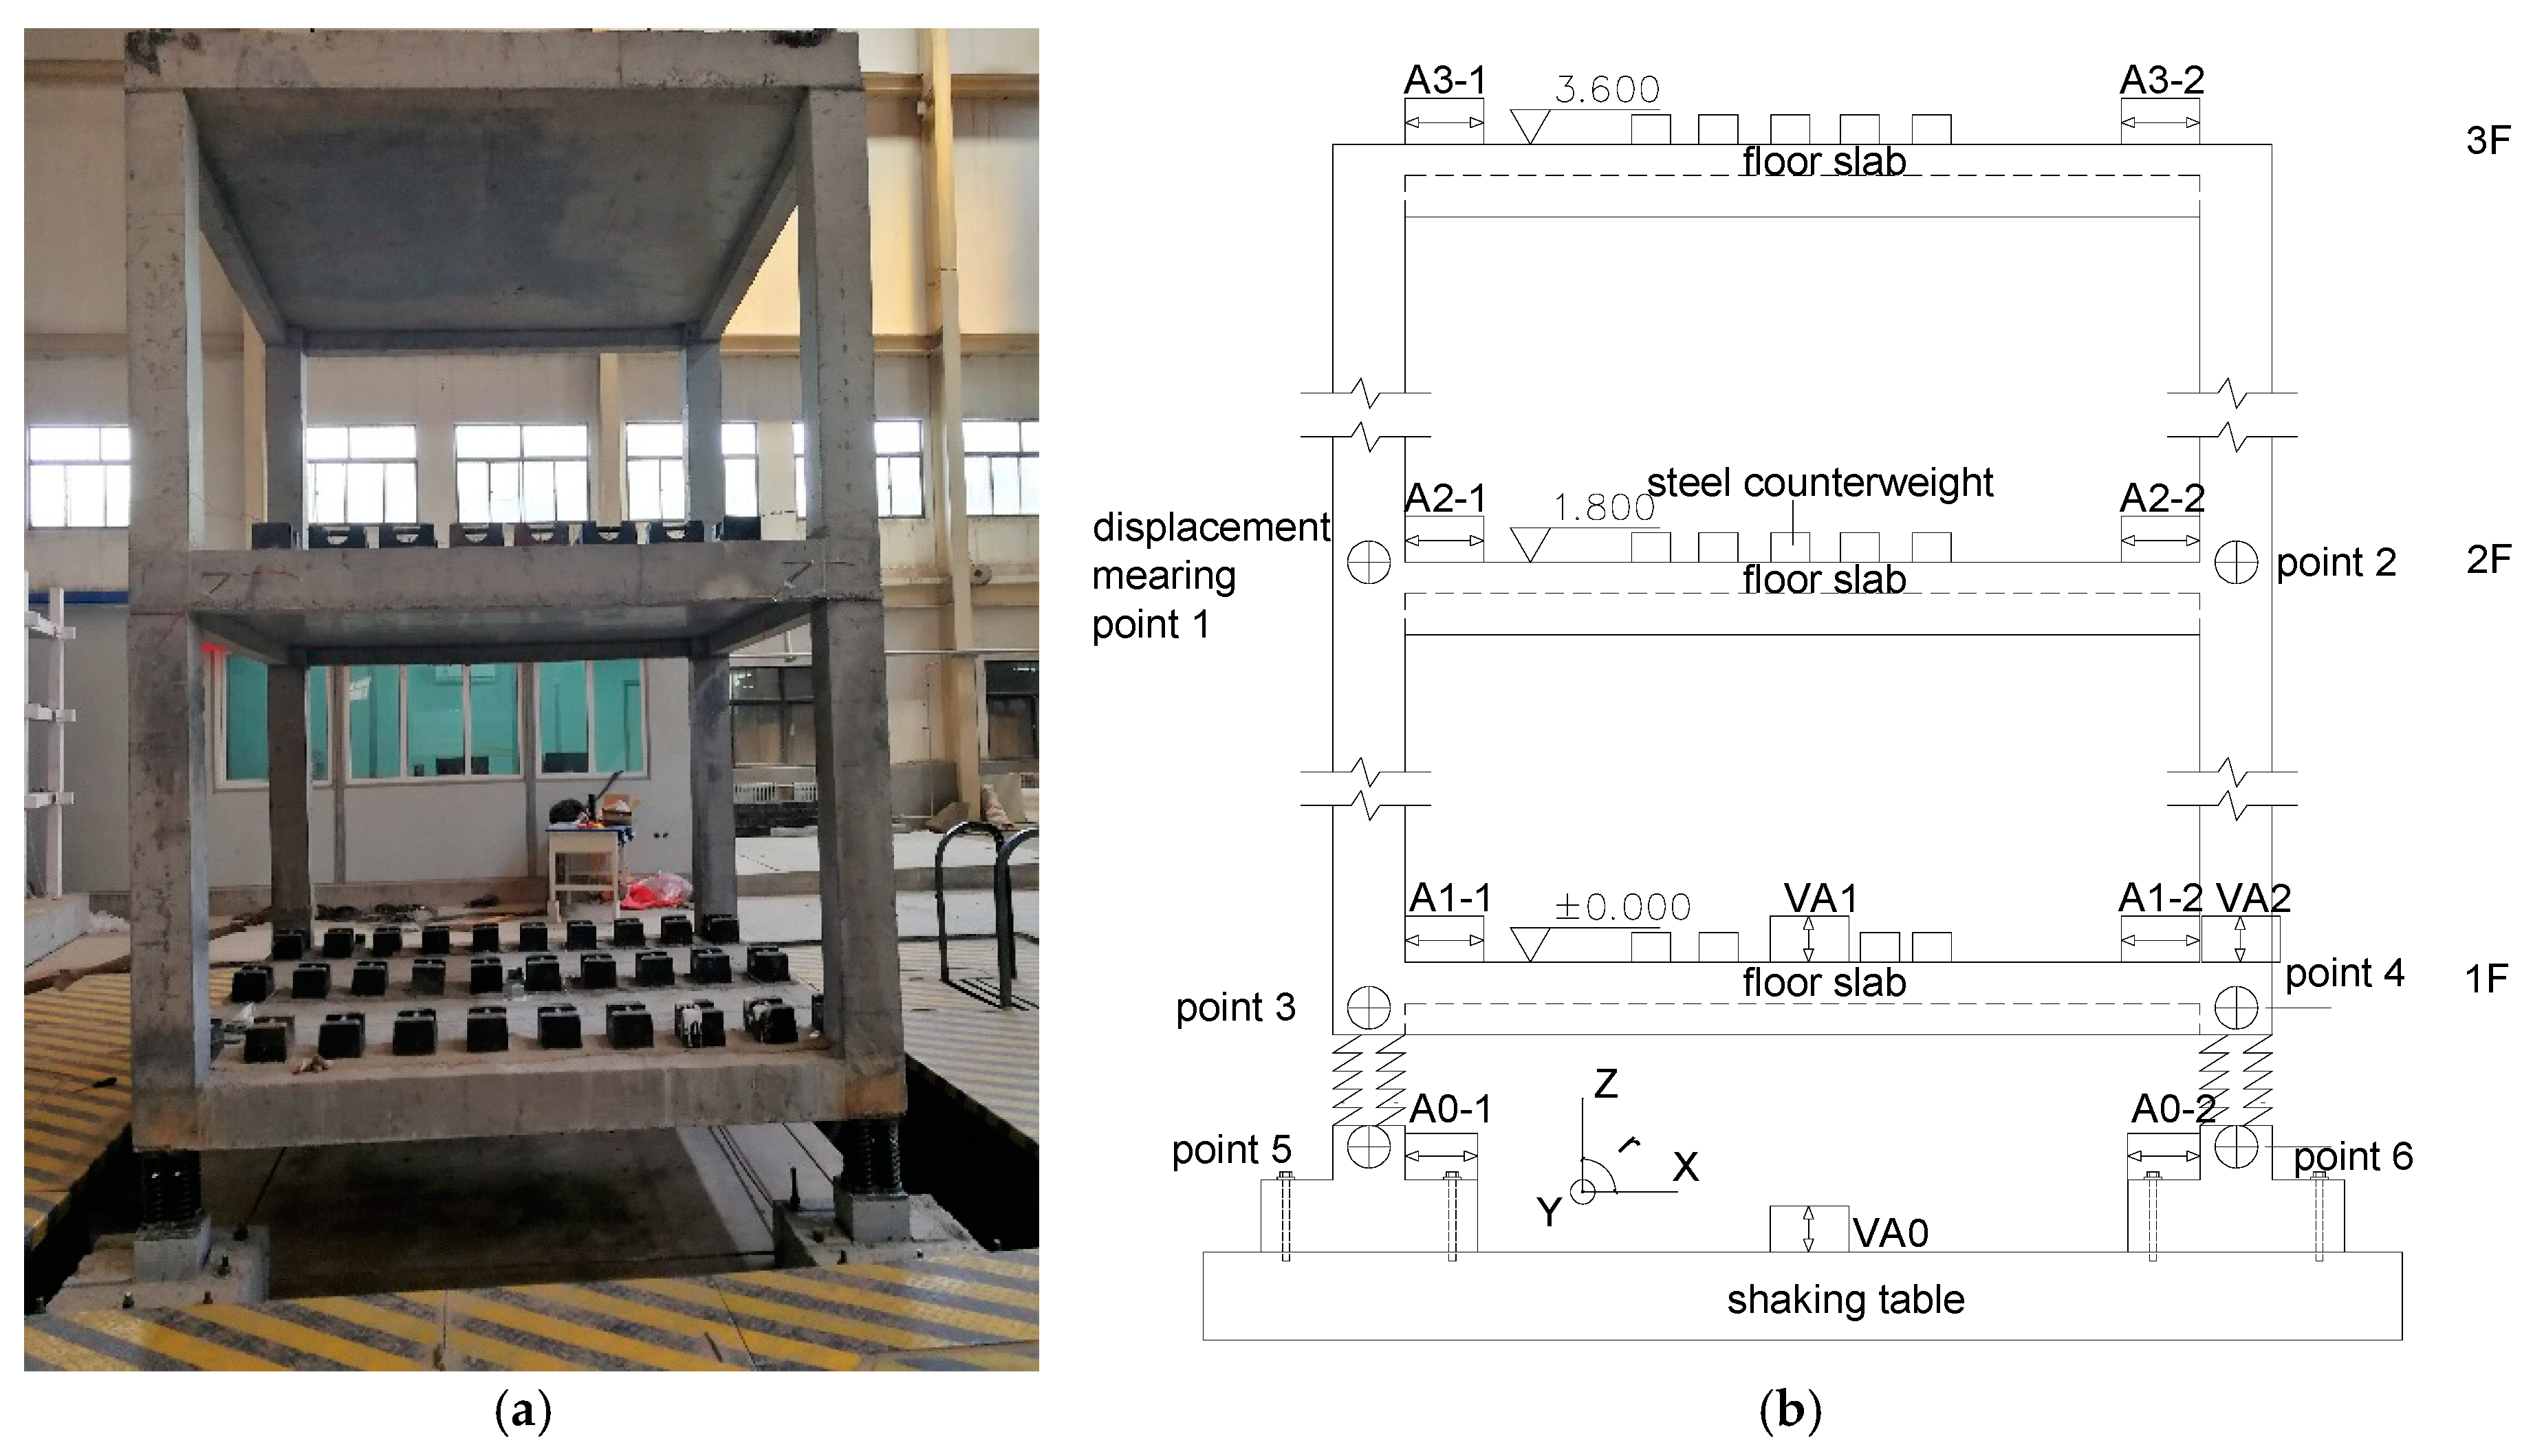
3.1. Test Information
3.1.1. Model Information
3.1.2. Loading Schedule
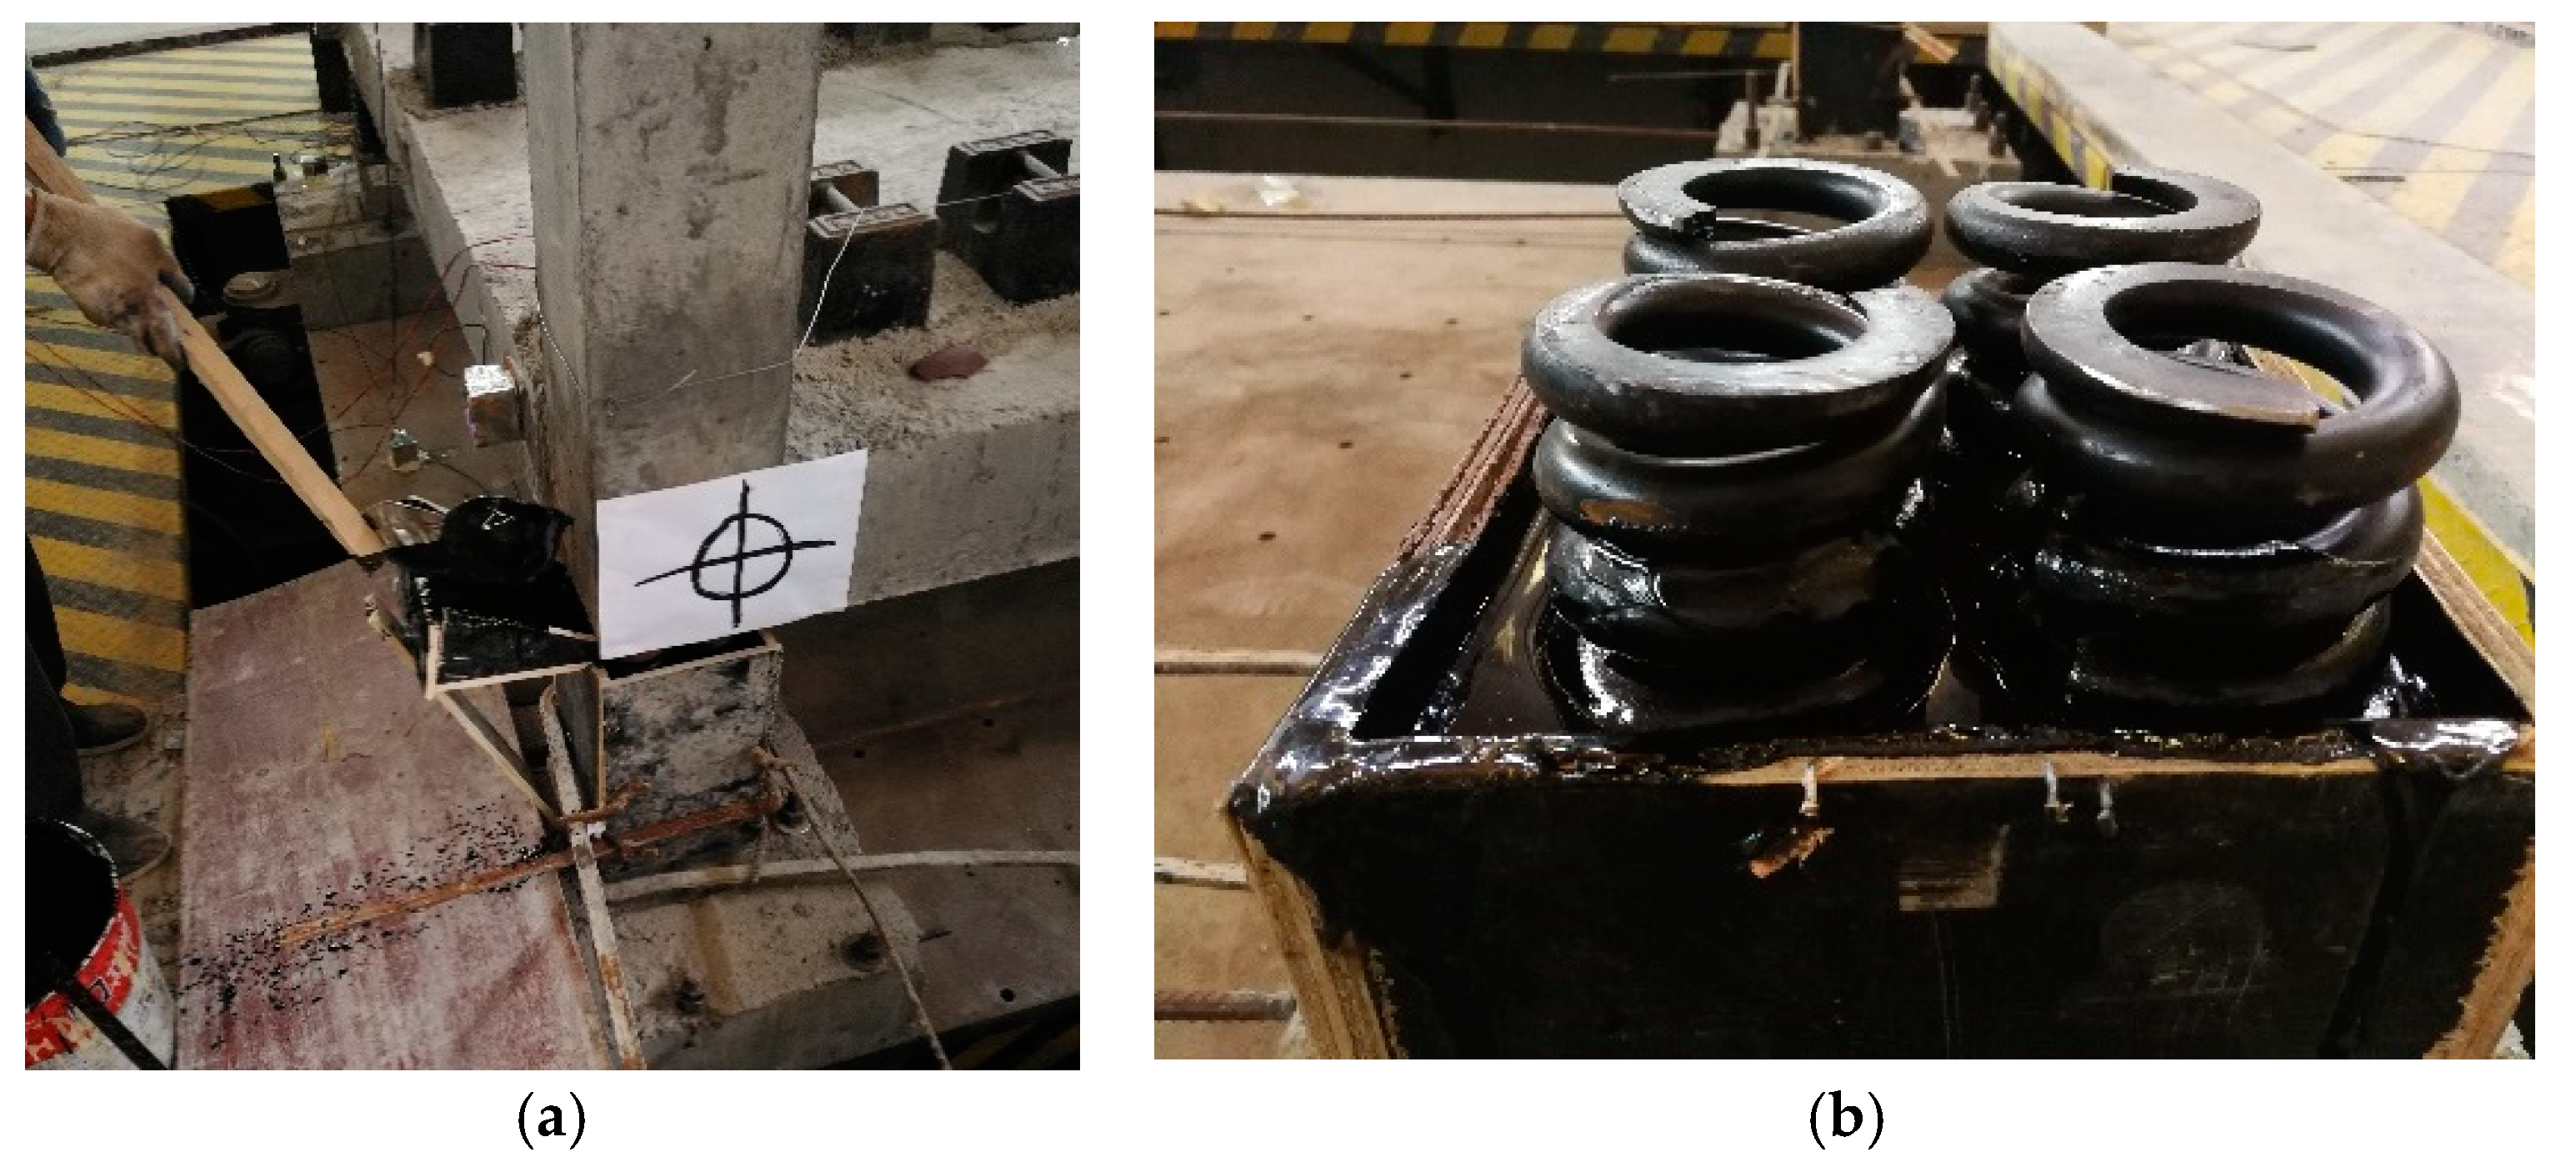
3.1.3. Measurement Scheme
3.2. Experimental Results and Analysis
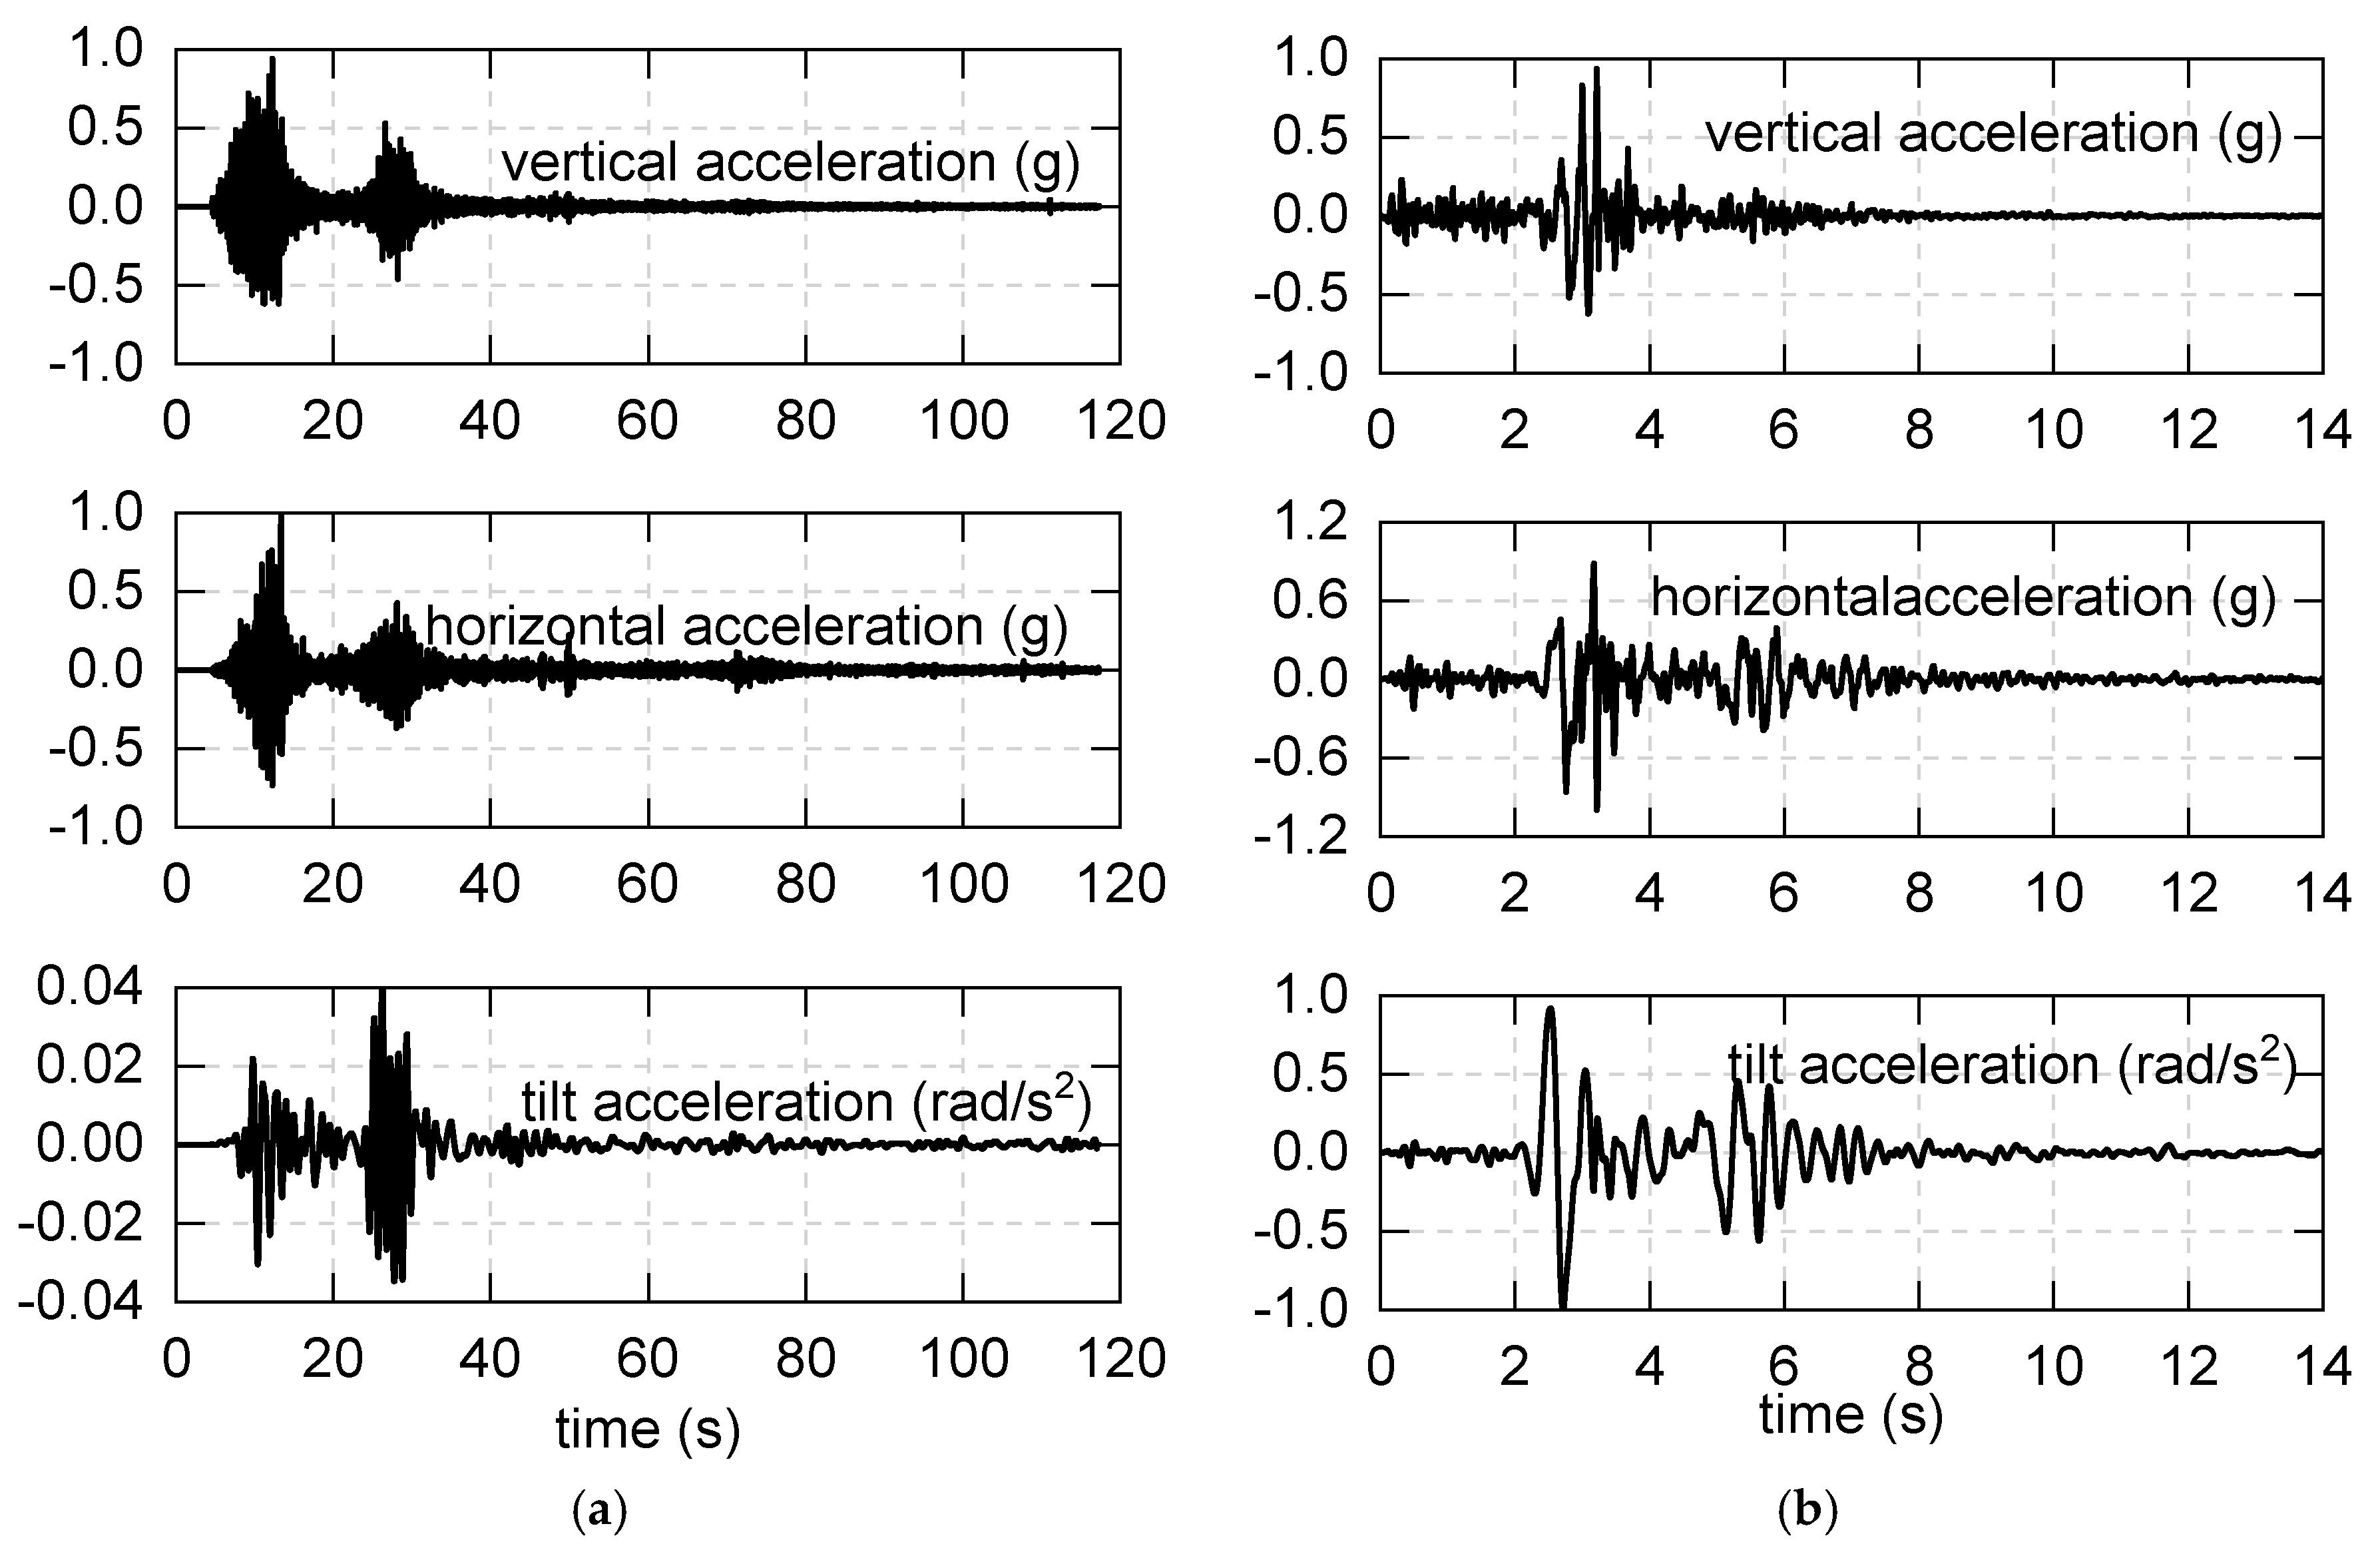
3.2.1. Acceleration and Displacement Responses
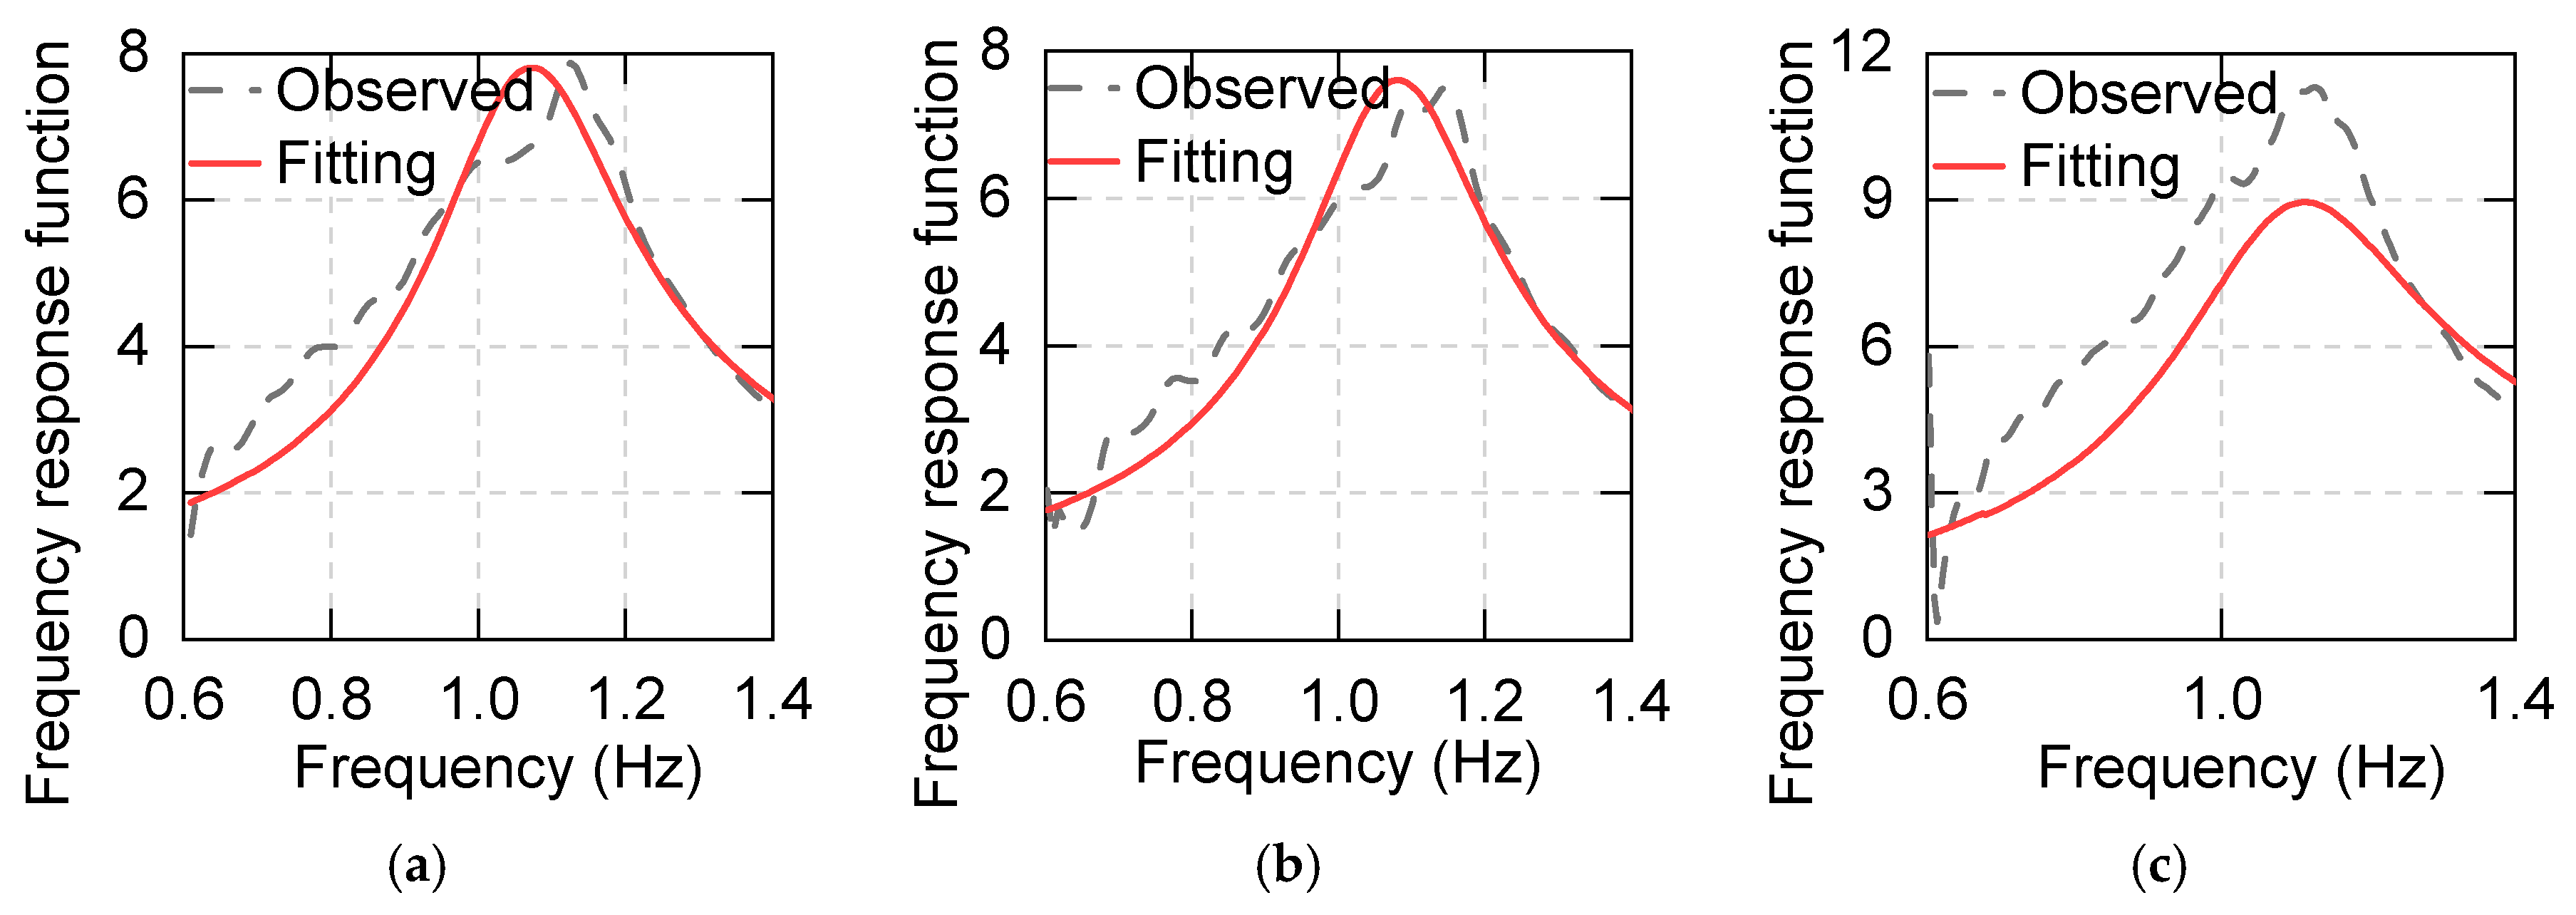
3.2.2. Parameter Identification
4. Discussion
- (1)
- According to the results of cyclic simple shear tests, the storage stiffness, the loss factor, equivalent stiffness and the equivalent damping ratio decrease with increasing displacement and temperature. Meanwhile, the above damping parameters increase with increasing frequency. These results demonstrate that when the ambient temperature is low, the displacement is small, the loading frequency is high, and the damping of the structure is larger.
- (2)
- Damping tests are qualitative tests, so the results are not the real parameters in practice because the test used scaled and simplified test specimens. However, the results can reveal the variation law of the damping characteristics of isolation bearings with this kind of asphalt.
- (3)
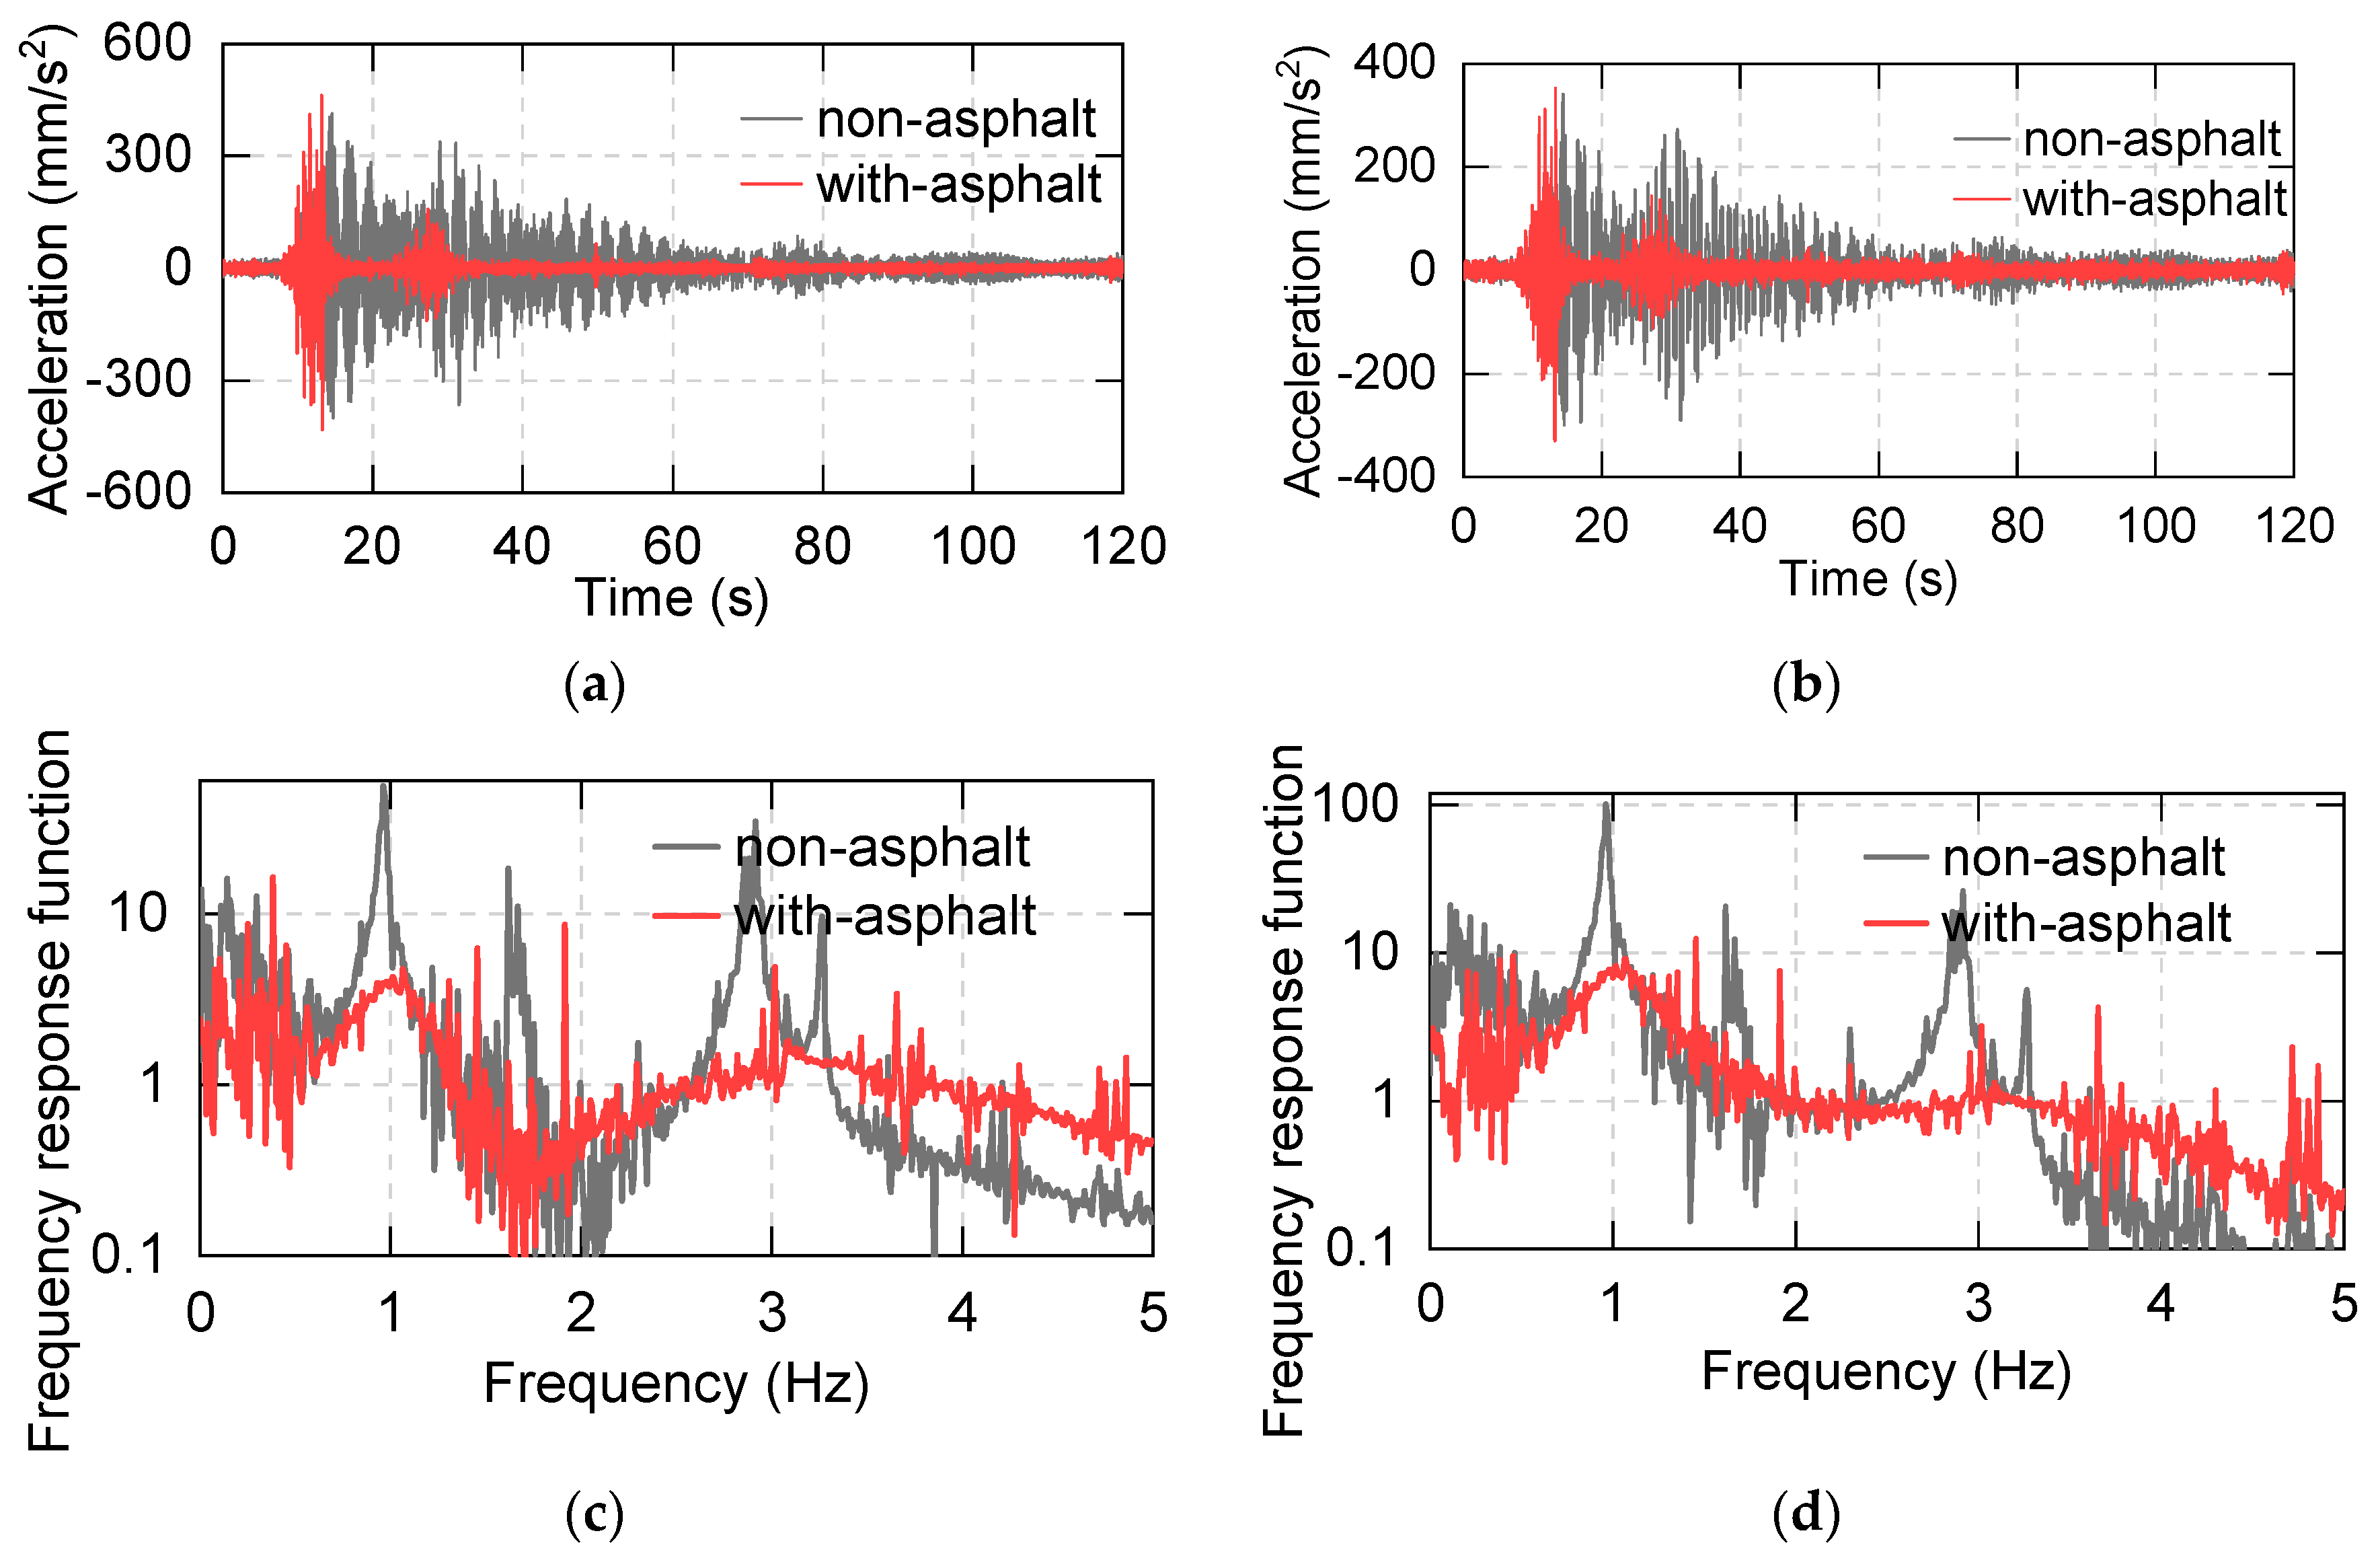
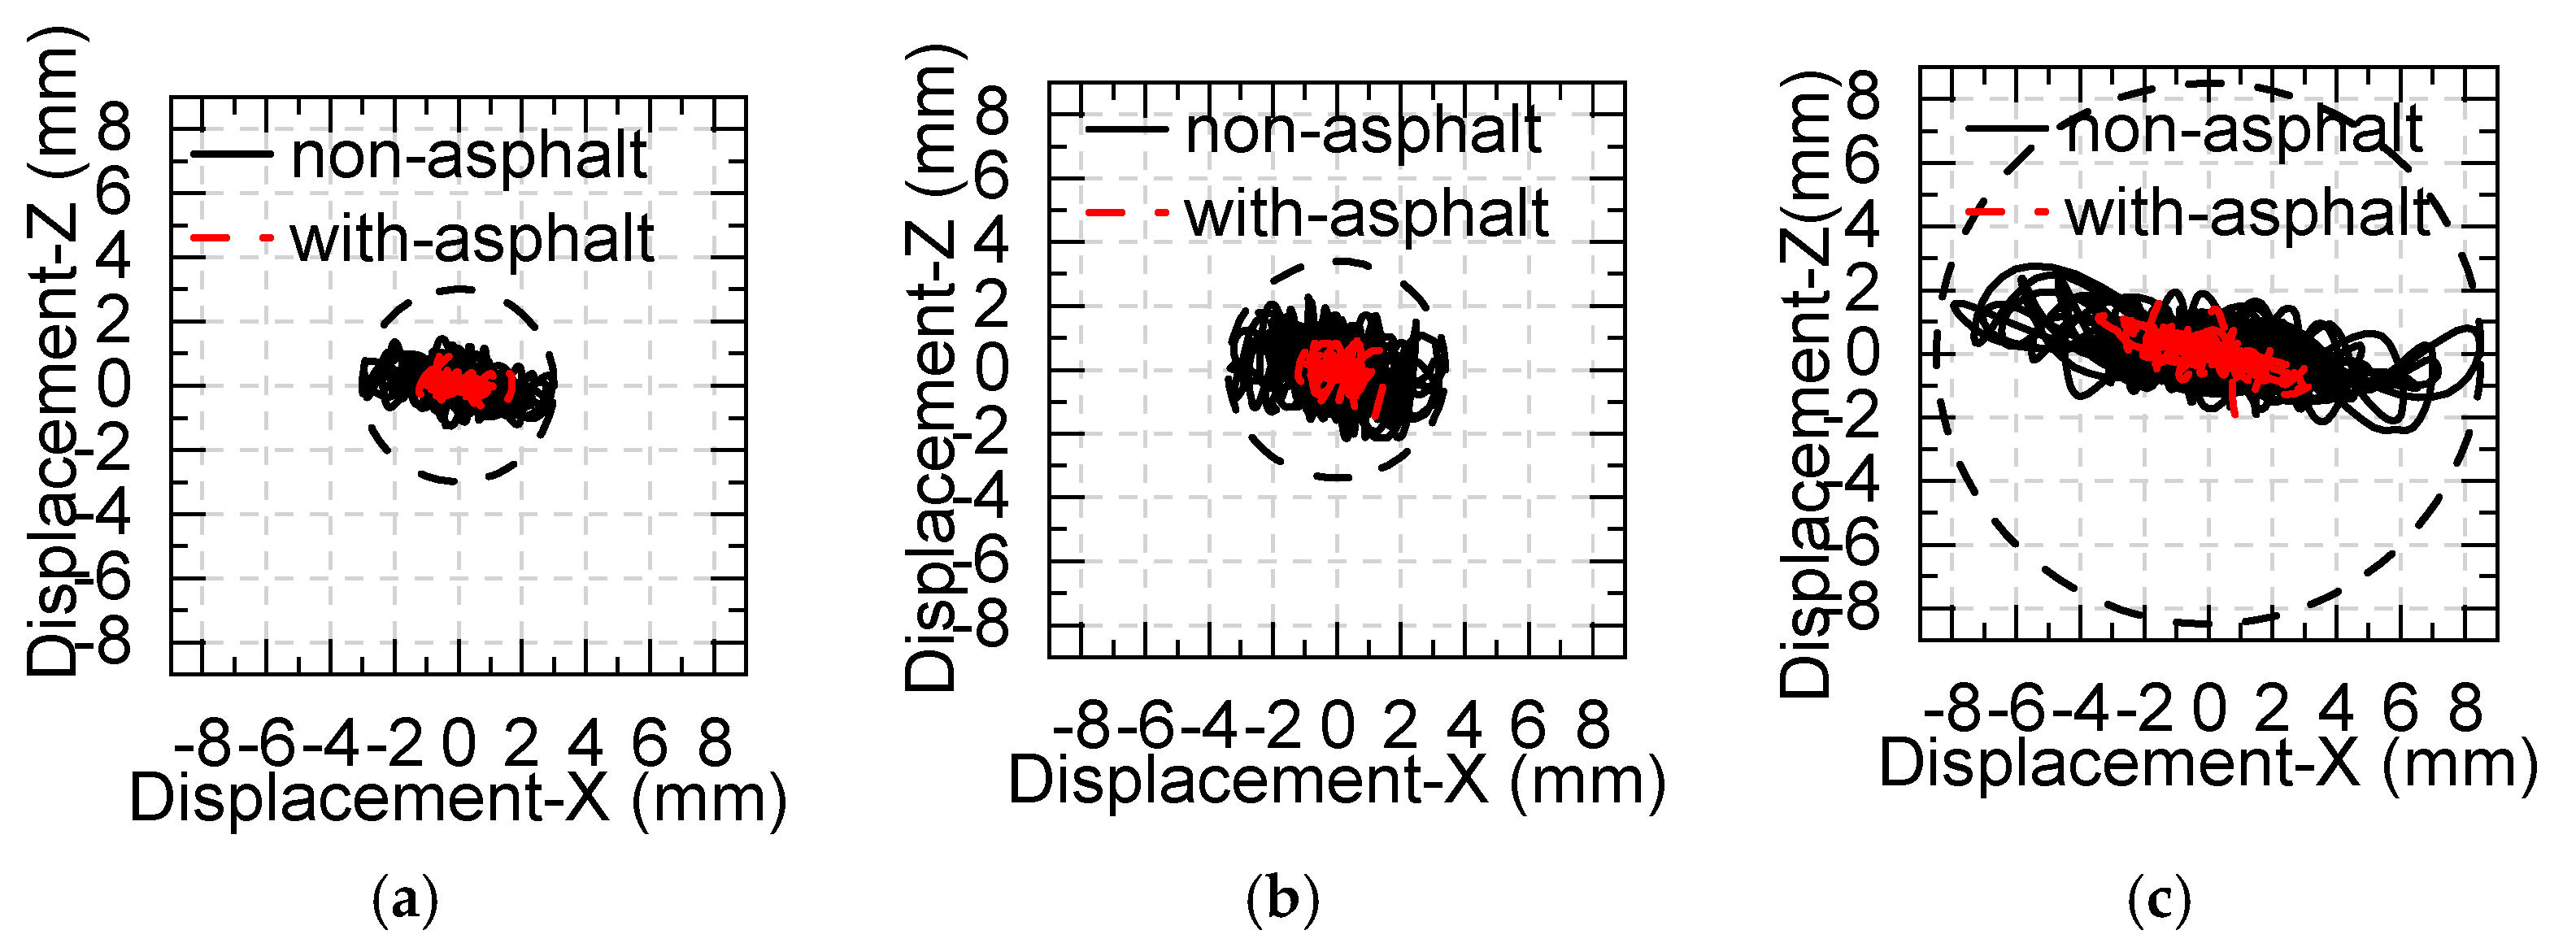
- The results of the modal analysis of the shaking table indicate that the damping effect is pronounced. Compared with non-asphalt tests, the duration and peak value of the acceleration responses in the with-asphalt tests are reduced by varying degrees, and the displacement is reduced to about 50% of that in the non-asphalt test.
- (4)
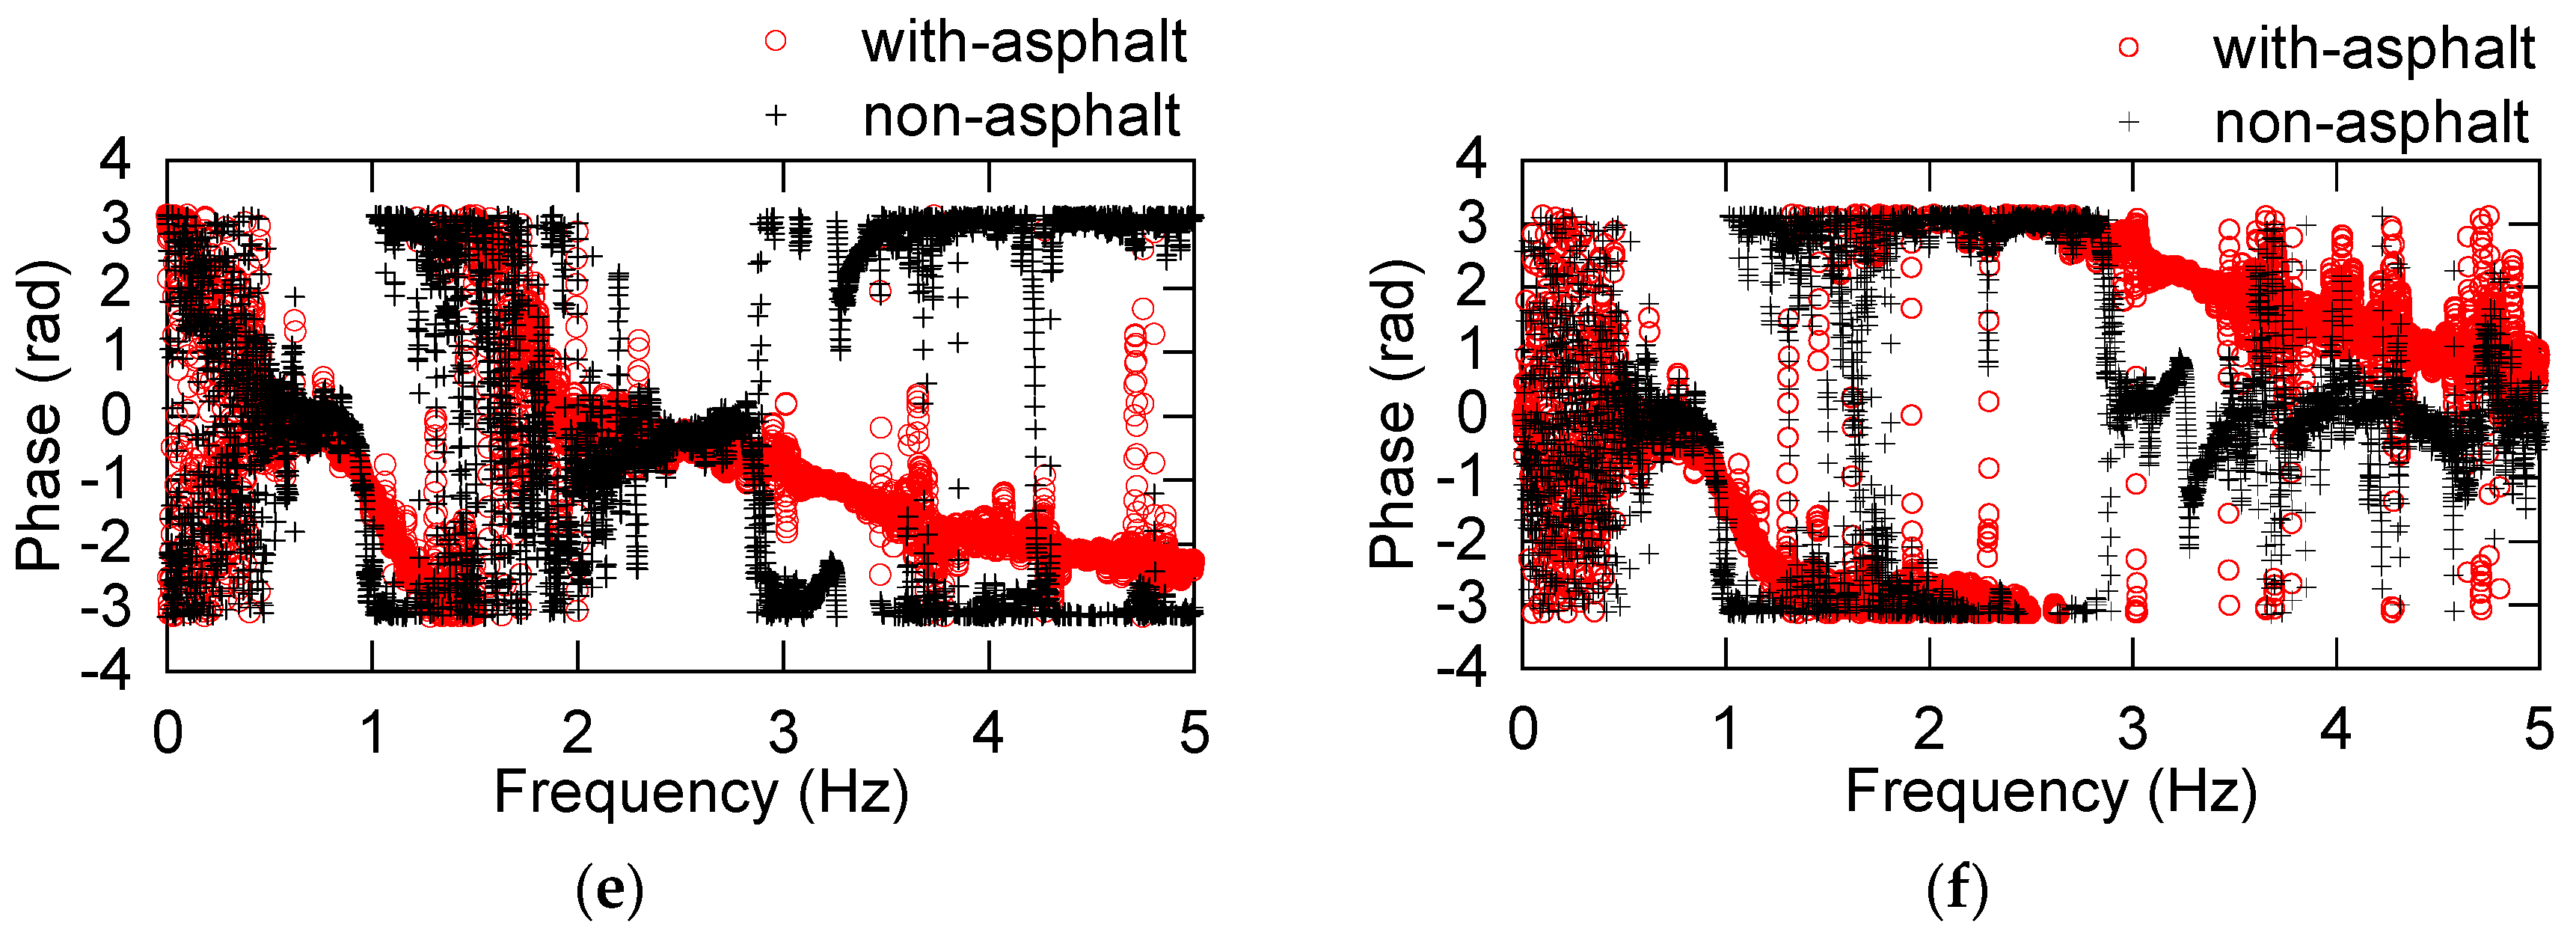
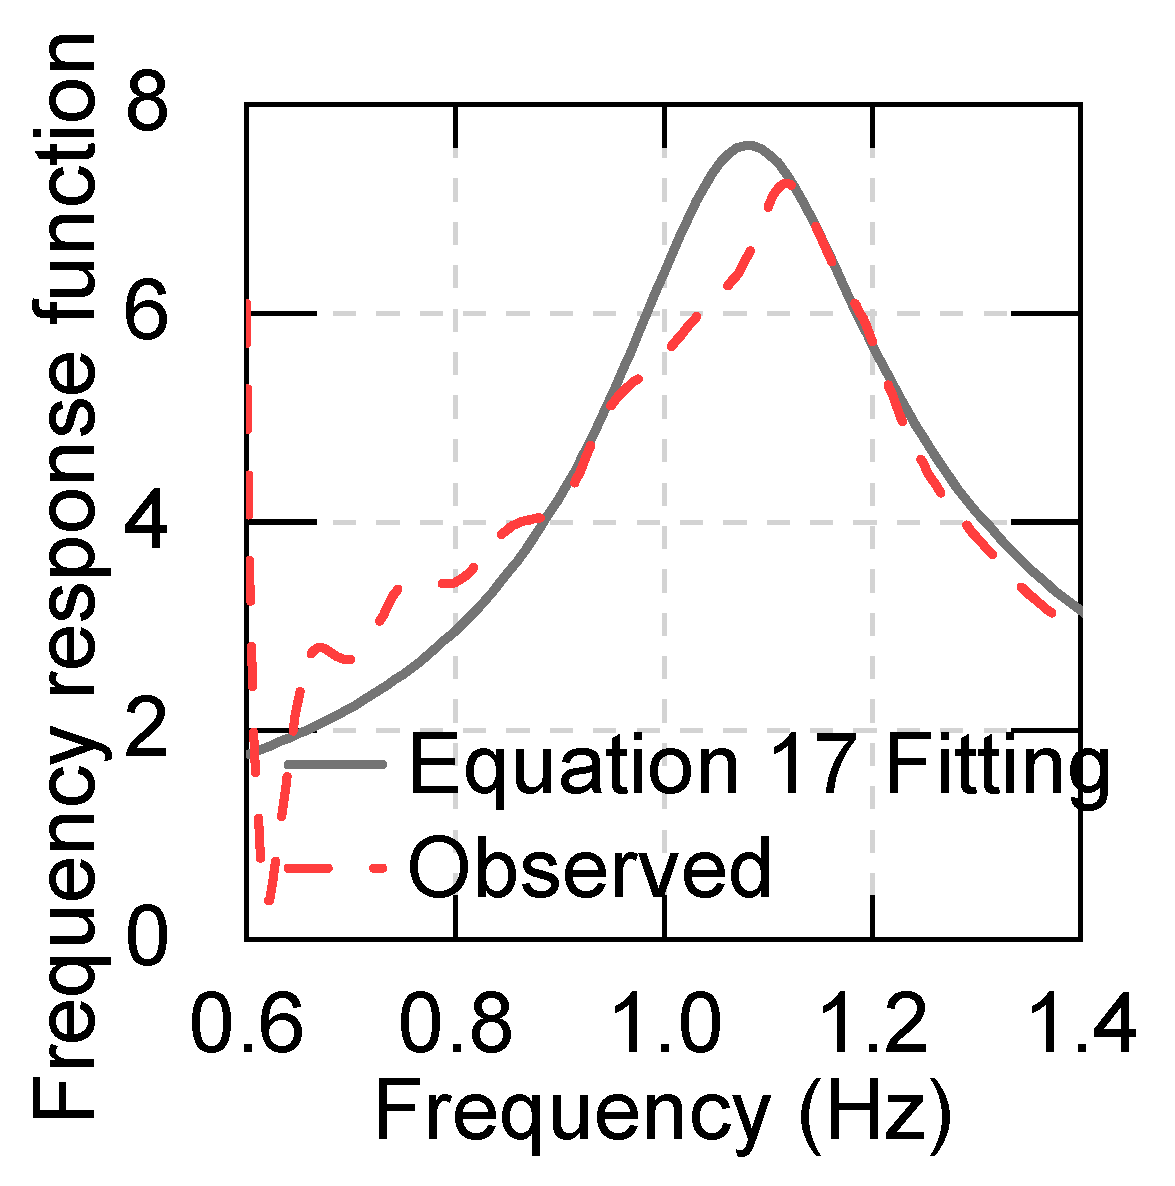
- A vertical earthquake will not change the frequency response function of the structure, but a rocking earthquake will markedly change it. Therefore, a modal analysis method for multi-dimensional seismic input is proposed. It is concluded that the analytical value agrees well with the experimental results.
- (5)
- The damping characteristics of the structure change with time, and a modal analysis method that is suitable for an invariant structure may cause errors. Therefore, the time-varying characteristics of the structure should be further studied in the future.
5. Patents
Author Contributions
Funding
Acknowledgments
Conflicts of Interest
References
- Fujita, T.A. Three-Dimensional Isolation Floor for Earthquake and Ambient Micro-Vibration Using Multi-Stage Rubber Bearing. Trans. Jpn. Soc. Mech. Eng. 1995, 61, 1615–1622. [Google Scholar]
- Fujita, S.; Kato, E.; Kashiwazaki, A.; Kashiwazaki, A.; Shimoda, I.; Sakaki, K. Shake table tests on three-dimensional vibration isolation system comprising rubber bearing and coil springs. In Proceedings of the Eleventh World Conference on Earthquake Engineering, Acapulco, Mexico, 23–28 June 1996. [Google Scholar]
- Tsutsumi, H.; Yamada, H.; Mori, K.; Ebisawa, K.; Shibata, K. Characteristics and Dynamic Response of 3-D Component Base Isolation System Using Ball Bearings and Air Springs; Japan Atomic Energy Research Institute: Ibaraki, Japan, 2001.
- Mori, S.; Suhara, I.; Saruta, M.; Okada, K.; Tomizawa, T.; Tsuyuki, Y.; Fujita, T. Simulation analysis of free vibration test in a building “Chisuikan” using three-dimensional seismic base isolation system. In Proceedings of the 15th World Conference on Earthquake Engineering, Lisbon, Portugal, 24–28 September 2012. [Google Scholar]
- Lee, D.; Constantinou, M.C. Combined horizontal–vertical seismic isolation system for high-voltage–power transformers: Development, testing and validation. Bull. Earthq. Eng. 2018, 16, 4273–4296. [Google Scholar] [CrossRef]
- Makris, N.; Constantinou, M.C. Spring-viscous damper systems for combined seismic and vibration isolation. Earthq. Eng. Struct. Dyn. 1992, 21, 649–664. [Google Scholar] [CrossRef]
- Yao, F.; Shang, S.; Liu, K. Shake table tests of a new steel–asphalt composite layer system for the seismic base isolation of housing units. Soil Dyn. Earthq. Eng. 2014, 59, 1–7. [Google Scholar] [CrossRef]
- Wang, J.C.; Zeng, X. Influence of temperature and pressure on the dynamic properties of rubber-modified asphalt concrete. J. Mater. Civ. Eng. 2006, 18, 125–131. [Google Scholar] [CrossRef]
- Tavassoti-Kheiry, P.; Solaimanian, M.; Qiu, T. Characterization of high RAP/RAS asphalt mixtures using resonant column tests. J. Mater. Civ. Eng. 2016, 28, 04016143. [Google Scholar] [CrossRef]
- Islam, M.R.; Faisal, H.M.; Tarefder, R.A. Determining temperature and time dependent Poisson’s ratio of asphalt concrete using indirect tension test. Fuel 2015, 146, 119–124. [Google Scholar] [CrossRef]
- Jiang, Z.; Hu, C.; Easa, S.; Zheng, X.; Abd El Halim, A.O. Identifying optimal polymer type of modified asphalt based on damping characteristics. Constr. Build. Mater. 2018, 173, 308–316. [Google Scholar] [CrossRef]
- Makris, N.; Constantinou, M.C.; Reinhorn, A.M. Viscous Dampers: Testing, Modeling and Application in Vibration and Seismic Isolation; National Center for Earthquake Engineering Research: Buffalo, NY, USA, 1990. [Google Scholar]
- Makris, B.N.; Constantinou, M.C. Fractional-derivative Maxwell model for viscous dampers. J. Struct. Eng. 1992, 117, 2708–2724. [Google Scholar] [CrossRef]
- Clough, W.; Penzien, J. Dynamics of Structures, 3rd ed.; Computers & Structures, Inc. University Ave.: Berkeley, CA, USA, 1995; pp. 52–58. [Google Scholar]
- Xu, Z.D.; Gai, P.P.; Zhao, H.Y.; Huang, X.H.; Lu, L.Y. Experimental and theoretical study on a building structure controlled by multi-dimensional earthquake isolation and mitigation devices. Nonlinear Dynam 2017, 89, 723–740. [Google Scholar] [CrossRef]
- Xu, Z.D.; Liao, Y.X.; Ge, T.; Xu, C. Experimental and theoretical study of viscoelastic dampers with different matrix rubbers. J. Eng. Mech. 2016, 142, 04016051. [Google Scholar] [CrossRef]
- Fitzgibbon, A.; Pilu, M.; Fisher, R.B. Direct least square fitting of ellipses. IEEE Trans. Pattern Anal. 1999, 21, 476–480. [Google Scholar] [CrossRef] [Green Version]
- Ahn, S.J.; Rauh, W.; Warnecke, H.J. Least-squares orthogonal distances fitting of circle, sphere, ellipse, hyperbola, and parabola. Pattern Recognit. 2001, 34, 2283–2303. [Google Scholar] [CrossRef]
- Shang, S.; Wang, Z.; Xiao, Y.; Cui, X. Experimental and numerical study of the spring-asphalt 3D isolation structures under multi-component ground motions. Bull. Earthq. Eng. 2020, 18, 2461–2496. [Google Scholar] [CrossRef]
- Ewins, D.J. Modal Testing: Theory, Practice and Application; Research Studies Press: Taunton, UK, 1984; pp. 20–30. [Google Scholar]
- Xiao, S.J.; Xu, L.H.; Li, Z.X. Design and experimental verification of disc spring devices in self-centering reinforced concrete shear walls. Struct. Control Health Monit. 2020, 27, e2549. [Google Scholar] [CrossRef]
- Olmos, B.A.; Roesset, J.M. Evaluation of the half-power bandwidth method to estimate damping in systems without real modes. Earthq. Eng. Struct. Dyn. 2010, 39, 1671–1686. [Google Scholar] [CrossRef]
- Zhang, J.; Li, Q. Identification of modal parameters of a 600-m-high skyscraper from field vibration tests. Earthq. Eng. Struct. Dyn. 2019, 48, 1678–1698. [Google Scholar] [CrossRef]
- Curadelli, R.O.; Riera, J.D.; Ambrosini, D.; Amani, M.G. Damage detection by means of structural damping identification. Eng. Struct. 2008, 30, 3497–3504. [Google Scholar] [CrossRef]
- Tobita, J. Evaluation of nonstationary damping characteristics of structures under earthquake excitations. J. Wind. Eng. Ind. Aerodyn. 1996, 59, 283–298. [Google Scholar] [CrossRef]


| Density | Curing Time | Service Temperature | Penetration (20 °C) |
|---|---|---|---|
| 1.53 g/cm3 | 2 h | −50~120 °C | 25 mm |
| No. | Earthquake Excitation | Horizontal PGA (m/s2) | Vertical PGA (m/s2) | Max Angular Acceleration (rad/s2) | Direction | Asphalt |
|---|---|---|---|---|---|---|
| 1 | Wolong | 0.78 | -- | -- | X | non |
| 2 | Wolong | 0.86 | 0.378 | -- | XZ | non |
| 3 | Wolong | 0.55 | 0.25 | 0.03 | XZR | non |
| 4 | Pacoima | 0.86 | -- | -- | X | non |
| 5 | Pacoima | 0.59 | 0.26 | -- | XZ | non |
| 6 | Pacoima | 0.6 | 0.26 | 0.053 | XZR | non |
| 7 | Wolong | 0.76 | -- | -- | X | non |
| 8 | Wolong | 0.95 | 0.66 | -- | XZ | non |
| 9 | Wolong | 0.92 | 0.64 | 0.04 | XZR | non |
| 10 | Pacoima | 1.1 | -- | -- | X | non |
| 11 | Pacoima | 1.06 | 0.59 | -- | XZ | non |
| 12 | Pacoima | 1.02 | 0.59 | 0.077 | XZR | non |
| 13 | Wolong | 0.93 | -- | -- | X | Yes |
| 14 | Wolong | 0.86 | 0.81 | -- | XZ | Yes |
| 15 | Wolong | 0.83 | 0.81 | 0.03 | XZR | Yes |
| 16 | Pacoima | 1.26 | -- | -- | X | Yes |
| 17 | Pacoima | 1.14 | 1.03 | -- | XZ | Yes |
| 18 | Pacoima | 1.09 | 1.04 | 0.122 | XZR | Yes |
| 19 | Wolong | 1.32 | -- | -- | X | Yes |
| 20 | Wolong | 1.28 | 0.95 | -- | XZ | Yes |
| 21 | Wolong | 1.3 | 0.94 | 0.04 | XZR | Yes |
| 22 | Pacoima | 2.05 | -- | -- | X | Yes |
| 23 | Pacoima | 2 | 1.17 | -- | XZ | Yes |
| 24 | Pacoima | 2.02 | 1.06 | 0.178 | XZR | Yes |
| Test No. | Damping Ratio | Natural Frequency (Hz) | Participation Factor | Error |
|---|---|---|---|---|
| 1 | 0.013 | 0.962 | 2.16 | 8.34% |
| 2 | 0.016 | 0.96 | 2.18 | 9.26% |
| 3 | 0.008 | 0.963 | 3.58 | 11.09% |
| 4 | 0.011 | 0.96 | 1.95 | 3.54% |
| 5 | 0.015 | 0.957 | 2.01 | 6.84% |
| 6 | 0.016 | 0.95 | 3.67 | 17.29% |
| 7 | 0.009 | 0.962 | 1.97 | 5.49% |
| 8 | 0.009 | 0.96 | 1.87 | 6.07% |
| 9 | 0.008 | 0.961 | 2.42 | 3.73% |
| 10 | 0.006 | 0.958 | 1.63 | 2.83% |
| 11 | 0.007 | 0.955 | 1.52 | 3.16% |
| 12 | 0.01 | 0.954 | 2.11 | 7.51% |
| 13 | 0.135 | 1.027 | 2.1 | 1.86% |
| 14 | 0.135 | 1.037 | 1.97 | 2.20% |
| 15 | 0.129 | 1.052 | 3.28 | 24.00% |
| 16 | 0.115 | 1.058 | 1.86 | 0.96% |
| 17 | 0.119 | 1.027 | 1.9 | 1.65% |
| 18 | 0.12 | 1.1 | 2.2 | 4.01% |
| 19 | 0.145 | 1.029 | 2.12 | 1.26% |
| 20 | 0.145 | 1.04 | 2.03 | 1.60% |
| 21 | 0.135 | 1.063 | 3.4 | 23.88% |
| 22 | 0.12 | 1.075 | 1.87 | 0.75% |
| 23 | 0.12 | 1.081 | 1.8 | 0.69% |
| 24 | 0.153 | 1.107 | 2.72 | 1.85% |
© 2020 by the authors. Licensee MDPI, Basel, Switzerland. This article is an open access article distributed under the terms and conditions of the Creative Commons Attribution (CC BY) license (http://creativecommons.org/licenses/by/4.0/).
Share and Cite
Shang, S.; Wang, Z. Dynamic Analysis of a Spring-Asphalt Three-Dimensional Isolation System Based on Cyclic Simple Shear and Shaking Table Tests. Appl. Sci. 2020, 10, 6530. https://doi.org/10.3390/app10186530
Shang S, Wang Z. Dynamic Analysis of a Spring-Asphalt Three-Dimensional Isolation System Based on Cyclic Simple Shear and Shaking Table Tests. Applied Sciences. 2020; 10(18):6530. https://doi.org/10.3390/app10186530
Chicago/Turabian StyleShang, Shouping, and Zhen Wang. 2020. "Dynamic Analysis of a Spring-Asphalt Three-Dimensional Isolation System Based on Cyclic Simple Shear and Shaking Table Tests" Applied Sciences 10, no. 18: 6530. https://doi.org/10.3390/app10186530