Article

Applying Real-Time Travel Times to Estimate Fire Service Coverage Rate for High-Rise Buildings

School of Civil Engineering, Central South University, Changsha 410075, China
*
Authors to whom correspondence should be addressed.
Appl. Sci. 2020, 10(19), 6632; https://doi.org/10.3390/app10196632
Submission received: 23 July 2020 / Revised: 5 September 2020 / Accepted: 21 September 2020 / Published: 23 September 2020
(This article belongs to the Section Civil Engineering)

Abstract

:
Frequent high-rise building fires have posed serious threats to urban public safety. In this study, real-time travel times extracted from online maps were applied to estimate fire service coverage rates for high-rise buildings. Firstly, the minimum fire apparatus requirement for high-rise building “at least 1 water fire truck and 1 aerial fire truck should arrive at the fire scene of high-rise building within 240 s” was proposed. Then, a dynamic estimation model of fire service coverage rate for high-rise buildings was established. To validate the model, 5146 high-rise buildings, 61 water fire trucks, and 56 aerial fire trucks in Changsha were selected as case studies. The results show that the total effective coverage rate and total average travel time in Changsha are 20.43% and 421.95 s, respectively. There are 10,840 water fire trucks and 6192 aerial fire trucks in China. Based on the average number of water fire trucks and aerial fire trucks per high-rise building, it can be estimated that the total effective coverage rate in China may not exceed 60.00%. Due to limited fire resources and frequent traffic congestion, only partial high-rise buildings can be effectively covered by fire services, whether in Changsha or China.

1. Introduction

With the urbanization process, more and more high-rise buildings have appeared around the world [1,2,3,4]. In China, high-buildings contain residential buildings with a height greater than 27 m and non-single-story buildings (containing factories, warehouses, and other civil buildings) with a height greater than 24 m [5]. The number of high-rise buildings in China exceeded 347,000 in 2017 and is still increasing rapidly [6]. These have also led to frequent fires in high-rise buildings. Between 2007 and 2017, there were about 31,000 high-rise building fires in China [6]. The fire risk of high-rise buildings poses a serious threat to urban public safety. To mitigate fire risks, high-rise buildings should be able to obtain efficient and effective fire services. Can high-rise buildings be effectively covered by fire services? The present study was aimed at answering this question.
Different types of buildings have different fire risk characteristics (such as structural space, combustible, personnel density, etc.), and their fire apparatus requirements will be varied [7,8,9]. However, fire service coverage was mainly defined by the spatial relationships between fire stations and fire service demand points in previous studies [10,11,12,13]. In previous studies, “every fire station contained all types of fire apparatus” seems to have been assumed by default [10,11,12,13]. In fact, due to the constraints of economy and land space, the type and quantity of fire apparatus in a fire station are limited. In response to most fires, multiple types of fire apparatus need to be dispatched from multiple fire stations to the fire scene. If fire apparatuses required by a building cannot reach the fire scene in a specific time, it can be considered that the building cannot be effectively covered by fire services. In this study, the spatial-temporal relationships between fire apparatuses and high-rise buildings are used to determine whether high-rise buildings can be effectively covered by fire services.
The type, quantity, and location of fire apparatuses in a region were always clearly recorded by the regional fire department. Fire apparatus data can be gathered by the fire department, but the data on fire service demand points (mainly buildings) is very difficult to obtain. With the development of Internet technology, online maps have been widely used in various fields (such as navigation, route planning, traffic planning, urban planning, etc.) [14,15]. The big data of the point of interest (POI) containing various types of places or facilities are stored in online maps [16,17]. In previous studies, POI data was always used to identify spatial functions [18,19,20,21]. To the best of our knowledge, few studies have focused on the application of POI data to identify high-rise buildings. In this study, high-rise buildings were identified from POIs.
Calculating travel times from fire apparatuses to high-rise buildings is a critical step in determining whether high-rise buildings are effectively covered by fire services. In previous studies, the road network data and fire station data were imported into the geographic information system (GIS), and then the shortest path algorithm was used for network analysis to obtain the fire station service coverage [22,23]. However, the results calculated with this method may differ significantly from the actual situation, because real-time traffic conditions were not considered. With the rapid renewal of urban road networks, the increasing number of vehicles, and the constantly varied traffic conditions, it is necessary to calculate the travel time of fire truck according to the real-time traffic conditions [24,25,26]. Online maps can update traffic conditions in real-time by collecting data from crowdsourcing and transportation departments. This enables online maps to plan routes based on real-time traffic conditions. Moreover, the real-time travel time and travel distance between any two points can be extracted from online maps by calling its web service application programming interface (API) [15,17]. However, the real-time travel time was rarely used to estimate fire service coverage in previous studies.
The main objective of this study is to establish a dynamic estimation method of fire service coverage rate for high-rise buildings based on the big data of POI and real-time travel times extracted from online maps. In this study, the high-rise building data in Changsha, China are gathered and identified as case studies. Furthermore, based on the effective coverage rate of fire service for high-rise buildings in Changsha, that in China was discussed with national fire apparatus data and high-rise building data.

2. Methods

2.1. Fire Apparatus Requirement

Previous studies have shown that high-rise buildings have high fire risks [27,28]. There are many combustibles in high-rise buildings which are prone to fire [29]. After a fire in a high-rise building, smoke can spread rapidly due to the stack effect. Due to the multiple floors, long evacuation distances, and densely populated people in high-rise buildings, it is difficult for people to escape in the case of fire [30,31]. The property density of high-rise buildings is large, which is easy to cause great property loss after a fire. There are many high-rise buildings whose height far exceeds the working height of a fire truck. Therefore, it is difficult to put out the fire from the outside of the building. If firefighters carry out internal fire-fighting, they have to bear great pressure both physically and mentally. In essence, fire-fighting and the rescue of high-rise buildings have always been a difficult problem for fire departments worldwide.
Fire apparatus requirements of high-rise buildings are directly determined by their firefighting strategies and tactics. National Fire Protection Association (NFPA) 1710 stipulated that an effective water flow rate of 1892 L/m from two handlines on the fire floor in high-rise buildings should be established [7]. The Chinese standard of GA/T 1191-2014 stipulated that aerial fire trucks, high-power water fire trucks, compressed air foam fire trucks, and air-supply fire trucks should be deployed during high-rise building fire [32]. Zanenga et al. (2010) proposed a new concept of aerial fire-fighting with rotorcraft vehicles in high-rise buildings [33]. Min et al. (2016) designed a moveable fire pump apparatus system with low-cost for fire suppression in high-rise buildings [34]. Angle et al. (2016) proposed that the fire-fighting tactics of high-rise buildings should focus on internal fire-fighting and make good use of internal fire hydrants [9]. Qiu et al. (2017) invented a fire engine capable of launching fire-fighting missiles for high-rise building fire suppression [35]. Zelenkov et al. (2017) designed a hose-pump high-pressure system to deliver liquid fire extinguishing agents to firefighters in super high-rise buildings [36].
In general, the main fire-fighting strategy of high-rise buildings is to enter the building interior and use the fixed fire-fighting facilities (such as fire hydrant and automatic sprinkler system) to put out the fire. To ensure continuous water supply in the building, water fire trucks should be connected to pump adapters outside the building. During a long-term internal fire-fighting process, air respirators need to be used to assist firefighters in breathing, and air-supply fire trucks need to replenish air for air respirators. Foam fire trucks and water tower fire trucks should also be used to spray extinguishing agents on the outside of the building, and aerial ladder fire trucks and aerial platform fire trucks should be used to rescue people. In summary, water fire trucks, foam fire trucks, aerial fire trucks (water tower fire truck, aerial platform fire trucks, and aerial ladder fire trucks), and air-supply fire trucks should be deployed to the high-rise building fire scene.
In the case of a high-rise building fire, fire apparatuses are often dispatched from multiple fire stations, and their arrival times will be varied. Obviously, the shorter the response time, the faster the fire can be put out. The objective value of a 5 min response time (including 1 min for initiating action and 4 min of travel time) was stipulated in the Chinese standard of GB51080-2015 [37]. Similar response time objective values were applied in previous studies and other countries’ standards [7,22,38]. In this study, the objective value of a 5 min response time was also set. For each fire response process, the initiating action time is generally within 1 min, but the travel time varies greatly with the travel distance and traffic condition. Therefore, in this study, the fire service coverage rata was estimated based on the objective value of a 4 min travel time, which is equivalent to the objective value of a 5 min respond time.
Due to the economic constraints, it is impossible to build many fire stations and equip with many fire apparatuses for achieving the goal that all the fire apparatuses required by high-rise buildings can reach the fire scene within 4 min. Water fire trucks and aerial fire trucks can play an important role in fire-fighting and the rescue of high-rise buildings, and they have been widely deployed in fire stations. Therefore, we proposed that the minimum fire apparatus requirement for high-rise buildings is “at least one water fire truck and one aerial fire truck should arrive at the fire scene of high-rise building within 4 min (240 s)”. If the minimum fire apparatus requirement for a high-rise building can be met, it is considered that the high-rise building can be effectively covered by fire services.

2.2. Dynamic Estimation Model

Based on the minimum fire apparatus requirement for high-rise buildings, the dynamic model for estimating the effective coverage rate of the fire service for high-rise buildings can be established. Due to the economic constraints, some fire stations are not equipped with both water fire trucks and aerial fire trucks. Therefore, the travel times and distances of water fire trucks and aerial fire trucks arriving at the fire scene may be different. It is assumed that there are k water fire trucks, m aerial fire trucks, and n high-rise buildings in the region. Indeed, high-rise buildings can be regarded as fire service demand points. Pi represents the ith fire service demand point (high-rise building), and Tmin(Pi, WT) represents the travel time of the first arrived water fire truck to the Pi. Tmin(Pi, WT) can be obtained by searching for the minimum value of travel times of water fire trucks, as Equation (1). Once Tmin(Pi, WT) is searched, the corresponding travel distance D(Pi, WT) is also determined. Then the corresponding travel velocity V(Pi, WT) is equal to D(Pi, WT) divided by Tmin(Pi, WT) as Equation (2). Similarly, the travel time of the first arrived aerial fire truck to Pi (Tmin(Pi, AT)) can be obtained as Equation (3), and its corresponding travel distance is represented by D(Pi, AT). Subsequently, V(Pi, AT) is calculated as Equation (4).
T min ( P i , WT ) = min { T ( P i , W T 1 ) , T ( P i , W T 2 ) , T ( P i , W T 3 ) ... T ( P i , W T k ) }
V ( P i , W T ) = D ( P i , W T ) T min ( P i , W T )
T min ( P i , A T ) = min { T ( P i , A T 1 ) , T ( P i , A T 2 ) , T ( P i , A T 3 ) ... T ( P i , A T m ) }
V ( P i , A T ) = D ( P i , A T ) T min ( P i , A T )
The earlier the fire truck arrives at the fire scene, the more conducive it is to put out the high-rise building fire. In general, the fire truck arriving first at the fire scene plays a more important role than the fire truck arriving later. Therefore, the minimum value of Tmin(Pi, WT) and Tmin(Pi, AT) should contribute more to the complex travel time of a water fire truck and aerial fire truck (T(Pi, C)). In Equation (5), C1 and C2 represent the weight coefficients of Tmin(Pi, WT) and Tmin(Pi, AT), respectively. Both water fire trucks and aerial fire trucks are indispensable in fire-fighting and the rescue of high-rise buildings. Therefore, the difference between C1 and C2 should be small, and we assumed that the values of C1 and C2 are 0.4 or 0.6 in this study. Indeed, when the number of fire stations equipped with water fire trucks is similar to the number of fire stations equipped with aerial fire trucks, the difference between the values of C1 and C2 will have little effect on the final result. If Tmin(Pi, WT) ≤ Tmin(Pi, AT), C1 = 0.6 and C2 = 0.4. If Tmin(Pi, WT) > Tmin(Pi, AT), C1 = 0.4 and C2 = 0.6. Similarly, the complex travel distance of a water fire truck and aerial fire truck (D(Pi, C)) can be calculated as Equation (6), and the complex travel velocity of them (V(Pi, C)) equals D(Pi, C) divided by T(Pi, C) as Equation (7). Obviously, the average travel time (AT(C)), the average travel distance (AD(C)) and the average travel velocity (AV(C)) for all points can be calculated as Equations (8)–(10).
T ( P i , C ) = C 1 × T min ( P i , W T ) + C 2 × T min ( P i , A T )
D ( P i , C ) = C 1 × D ( P i , W T ) + C 2 × D ( P i , A T )
V ( P i , C ) = D ( P i , C ) T ( P i , C )
A T ( C ) = 1 n × i = 1 n T ( P i , C )
A D ( C ) = 1 n × i = 1 n D ( P i , C )
A V ( C ) = 1 n × i = 1 n V ( P i , C )
If T(Pi, C) ≤ 240 s, the ith point is effectively covered by fire services. If T(Pi, C) > 240 s, the ith point is not effectively covered by fire services. The effective coverage rate of fire services for high-rise buildings in the region (ECR(C)) can be calculated as Equation (11). In Equation (11), EC(C) represents the number of effectively covered points, and UC(C) represents the number of uncovered points.
E C R ( C ) = E C ( C ) E C ( C ) + U C ( C )
Due to the dynamic changes in traffic conditions, ECR(C) will be varied at different times. We assume that m estimation scenarios are set in a certain time-period (∆T), and ECR(C), AT(C), AD(C), and AV(C) at Tj are expressed as ECR(C, Tj), AT(C, Tj), AD(C, Tj), and AV(C, Tj), respectively. Then, the total effective coverage rate in ∆T (TECR(C, ∆T)) can be calculated based on time-weighted ECR(C, Tj) as Equation (12). Similarly, the total average travel time (TAT(C, ∆T)), the total average travel distance (TAD(C, ∆T)), and the total average velocity (TAV(C, ∆T)) can be calculated as Equations (13)–(15) based on the time-weighted method.
T E C R ( C , Δ T ) = 1 T m T 1 [ j = 2 m E C R ( C , T j ) + E C R ( C , T j - 1 ) 2 ( T j T j 1 ) ]
T A T ( C , Δ T ) = 1 T m T 1 [ j = 2 m A T ( C , T j ) + A T ( C , T j - 1 ) 2 ( T j T j 1 ) ]
T A D ( C , Δ T ) = 1 T m T 1 [ j = 2 m A D ( C , T j ) + A D ( C , T j - 1 ) 2 ( T j T j 1 ) ]
T A V ( C , Δ T ) = 1 T m T 1 [ j = 2 m A V ( C , T j ) + A V ( C , T j - 1 ) 2 ( T j T j 1 ) ]

2.3. Data Extracting and Processing

The Baidu Map is one of the most widely used online maps in China and stores more than 150 million POIs [17]. In this study, POIs, longitudes and latitudes of fire trucks, and travel times and travel distances were extracted from the Baidu Map (Baidu, Beijing, China) by calling its web service APIs using JavaScript program. The extracted data was stored in an SQLite database through Web SQL of the WebKit-based browser. Subsequent data processing and analysis were also performed by the JavaScript program. There are four steps (containing identifying high-rise buildings, geocoding fire apparatuses, extracting travel times and distances, and analyzing and calculating) in the flow of data extraction and processing as shown in Figure 1.
(1) Identifying high-rise buildings. The big data of POI stored on the online map covers the names, addresses, longitudes, and latitudes of almost all types of buildings. Obviously, most high-rise buildings are also covered. However, whether a POI is a high-rise building cannot be determined directly. When constructing a high-rise building, it is necessary to go through the administrative license procedures in the relevant government departments, among which the fire administrative license is handled in the fire department. Therefore, the high-rise building list in a region can be gathered from relevant government departments. The list often includes names, addresses, heights, areas, and other information about high-rise buildings. However, part of these names and addresses may not be accurately recorded, and they may not match the actual situation due to the updating of road networks and the renaming of buildings. However, accurate names, addresses, latitudes, and longitudes of high-rise buildings can be identified and obtained by matching the gathered high-rise building list with the POIs extracted from the Baidu Map. After matching with POIs, there may be some high-rise buildings that cannot be identified, and also these unidentified high-rise buildings cannot be used for estimation. From the view of sampling statistics, the impact of these unidentified and unused high-rise buildings on the overall estimated results can be neglected.
(2) Geocoding fire apparatuses. The names, types, quantities, and deployment addresses of fire apparatuses can be gathered from the fire department. By calling the Baidu Map web service APIs to geocode the deployment addresses of fire apparatuses, their corresponding longitudes and latitudes can be obtained.
(3) Extracting travel times and distances. It is very important to determine the appropriate route because different routes will lead to different travel times and distances. The shortest route considering the influence of traffic conditions was determined as the appropriate route in this study. In most cases, this determination tactic can minimize travel time. In addition, this determination tactic can be applied by calling the Baidu Map web service API. The calling parameters can be constructed with longitudes and latitudes of fire apparatuses and the identified high-rise buildings. Then, the real-time travel time and distance between each fire apparatus and each high-rise building can be extracted from the Baidu Map.
(4) Analyzing and calculating. During the execution of the task, the travel velocity, travel route, and driving direction of the fire truck are not restricted by traffic rules. Therefore, the speed of the fire truck should be faster than that of ordinary vehicles. The travel time calculated by the Baidu Map based on real-time traffic conditions is mainly for ordinary vehicles. According to our previous study, 80% of the travel time extracted from the Baidu Map is used as the travel time of the fire truck in this study [8]. Tmin(Pi, WT) and Tmin(Pi, AT) can be obtained by comparing circularly using JavaScript. Other parameters (including ECR(C), AT(C), TECR(C, ∆T), TAT(C, ∆T), etc.) can also be calculated with the JavaScript program.

3. Case Studies

3.1. Study Area and Study Data

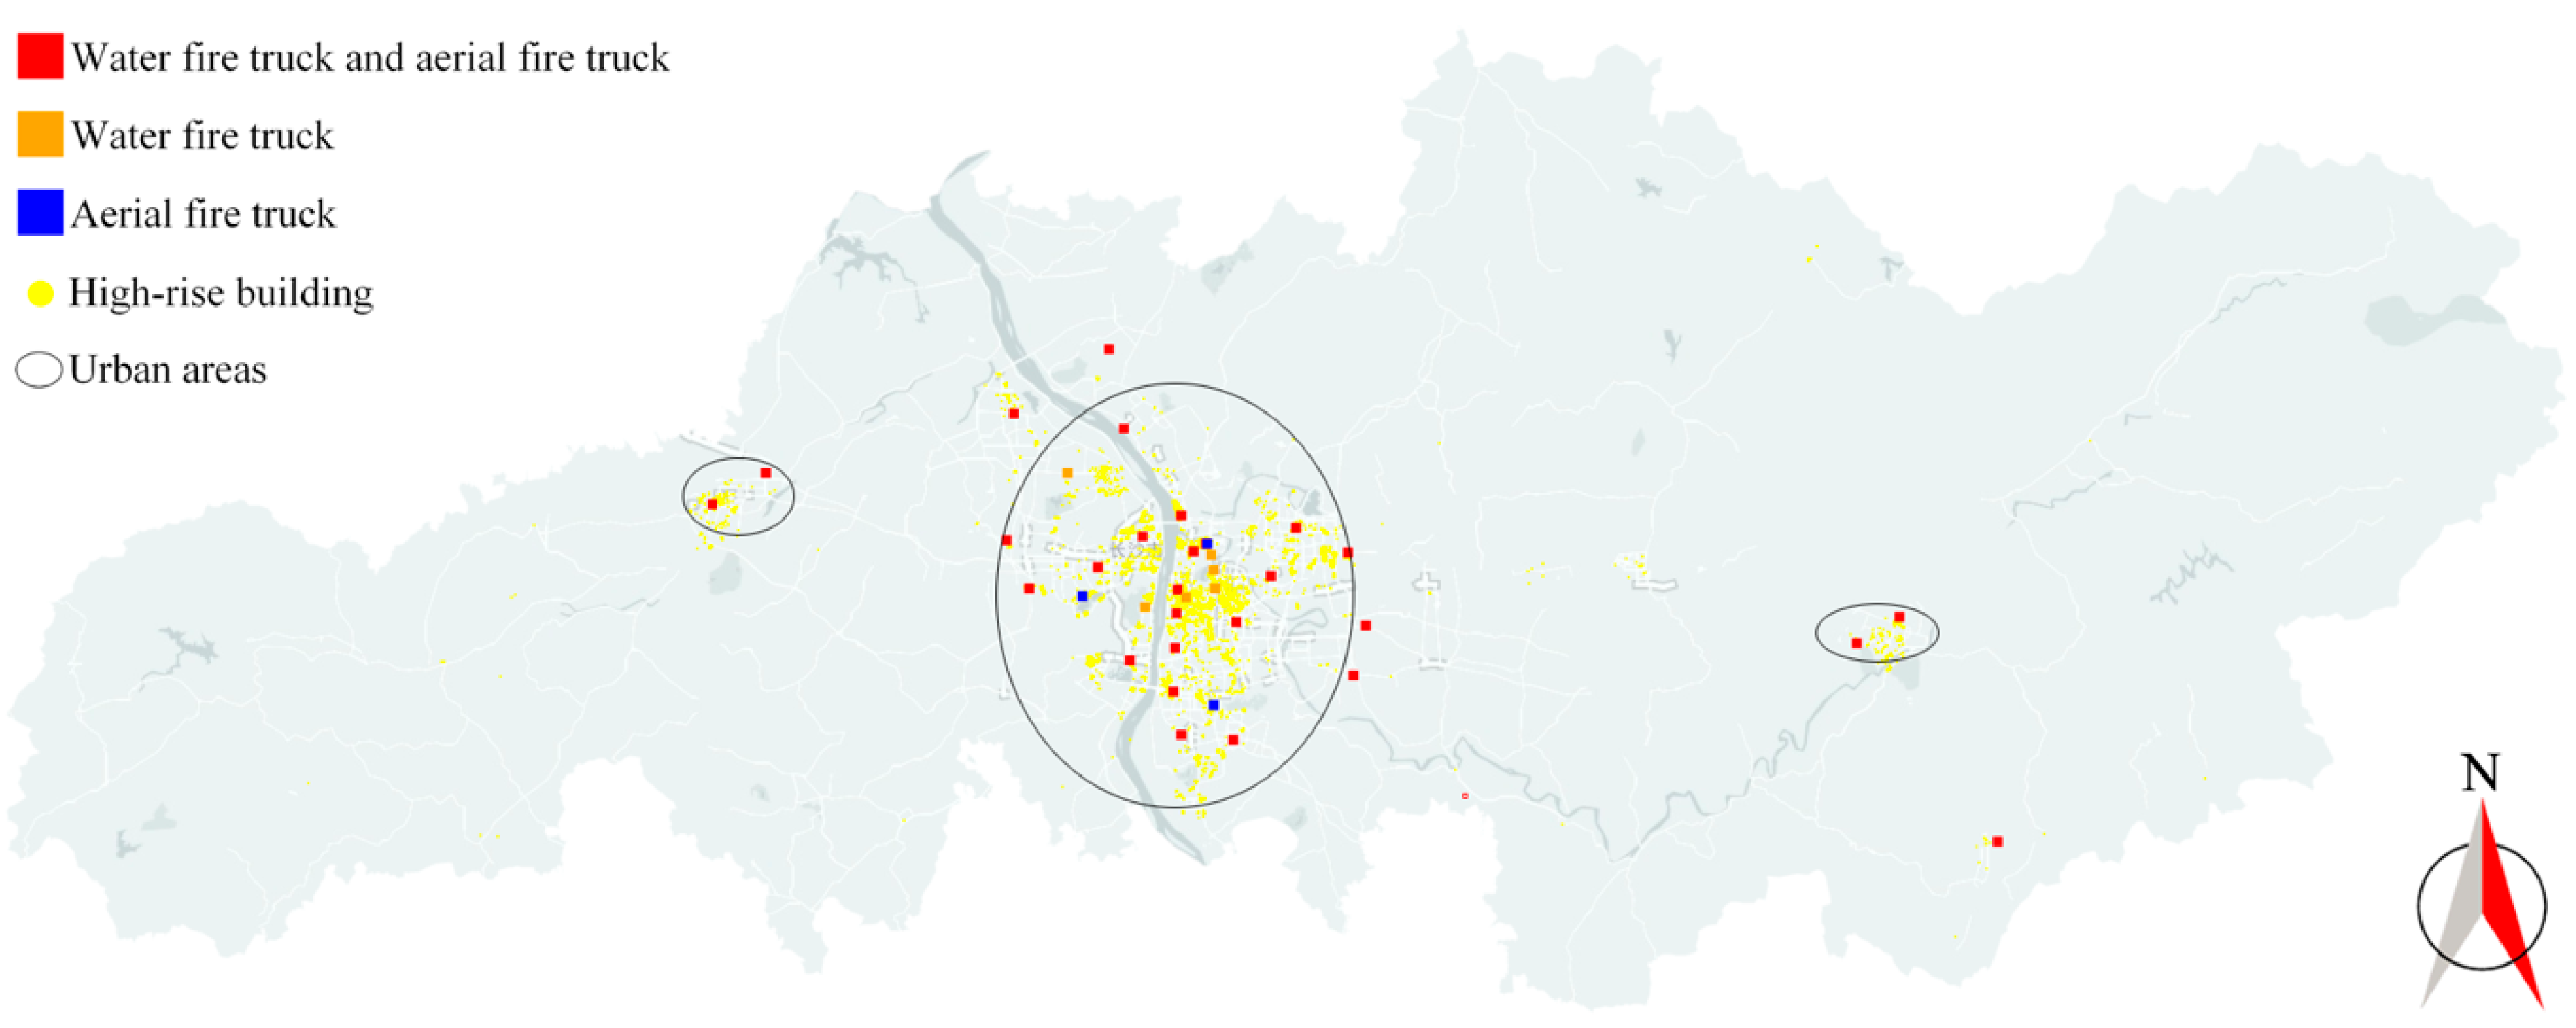
Changsha is a megacity in southern China. As of the end of 2018, the city’s resident population was 8.15 million, of which the urban population was 6.45 million, and its urbanization rate was 79.12% [39]. The area of Changsha is 11,816.0 km2. The oval areas in Figure 2 roughly show the extent of the urban areas.
As of 2017, there were 37 fire stations in Changsha, mainly distributed in urban areas (See Figure 2). There were 61 water fire trucks deployed in 34 fire stations. There were 56 aerial fire trucks (including water tower fire trucks, aerial platform fire trucks, and aerial ladder fire trucks) deployed in 31 fire stations. Among them, 28 fire stations were equipped with both water fire trucks and aerial fire trucks. All 37 fire stations were equipped with other fire apparatuses.
A dataset containing names and addresses of 6749 high-rise buildings in Changsha was gathered from the fire department. Unfortunately, the addresses in the dataset were only approximate and difficult to locate accurately. Therefore, 94,726 POIs of Changsha City were extracted from the Baidu Map by calling its web service API. Then, 5146 high-rise buildings were identified by matching names and addresses of POIs and those of 6749 high-rise buildings in the dataset. In this study, these 5146 high-rise buildings are used to represent all high-rise buildings in Changsha. They are mainly distributed in urban areas, as shown in Figure 2.

3.2. Estimation Scenarios

Traffic conditions are constantly changing, and the driving speed of fire trucks will also change at different times. In general, the traffic is the smoothest at around 04:00 a.m. (early in the morning) [8,40,41]. At around 08:00 and 18:00, there are the most vehicles on the road, and the traffic is very heavy, which often leads to traffic congestion. In addition, the traffic conditions on weekdays and non-weekdays are varied. At around 12:00 a.m., the traffic is neither smooth nor heavy. Therefore, 30 estimation scenarios in a complete week (from 2019–12–02 00:00 a.m. to 2019–12–09 00:00 a.m., including five weekdays and two non-weekdays) were set. At least four estimation scenarios (04:00 a.m., 08:00 a.m., 12:00 a.m., and 18:00 p.m.) were set every day. In the dynamic estimation model, TECR(C, ∆T) should be calculated with a complete evaluation time-period (from the first evaluation scenario to the last evaluation scenario). Therefore, another two estimation scenarios (2019–12–02 00:00 a.m. and 2019–12–09 00:00 a.m.) were set. Obviously, the accuracy of estimation results can be improved by setting more scenarios with a shorter time interval. This will consume more computing resources, and increase the number of calls to the Baidu Map web service API [17]. However, the limit of the calling number makes it difficult to set too many scenarios.

3.3. Results and Discussion

By calling the Baidu Map web service API, travel times and travel distances between 5146 high-rise buildings and the corresponding fire trucks were calculated, and a total of 308,760 valid data were obtained. Through data mining, ECR(C), AT(C), AD(C), and AV(C) in different scenarios were obtained (see Table 1). Further calculation and analysis show that TECR(C, ∆T) has a value of 20.43%, and TAT(C, ∆T) has a value of 421.95 s. On the whole, most of the high-rise buildings in Changsha cannot be effectively covered by fire services. It can be inferred that fire apparatus requirements for high-rise buildings in Changsha cannot be met, mainly due to the insufficient number of fire trucks and fire stations. Therefore, more fire stations equipped with water fire trucks and aerial fire trucks should be constructed.
The variances of ECR(C), ECR(C), AT(C), and AV(C) are calculated as seen in Table 1, which shows that the results of different scenarios are significantly different. Trends of ECR(C) and AT(C) are shown as Figure 3 and Figure 4. Both ECR(C) and AT(C) have an obvious variation period of one day. In comparison, at the time of daily traffic congestion (8:00 a.m. and 18:00 p.m.), values of ECR(C) are smaller, and values of AT(C) are larger. While at the time with the smoothest traffic of the day (04:00), the value of ECR(C) is the largest, and the value of AT(C) is the smallest. ECR(C) has a maximum value of 32.30% at 2019–12–07 04:00 a.m. concomitant with a minimum value of 11.62% at 2019–12–06 18:00 p.m. The maximum value of ECR(C) is 2.78 times its minimum value. AT(C) has a maximum value of 555.31 s at 2019–12–06 18:00 p.m. and a minimum value of 312.18 s at 2019–12–03 04:00 a.m. The maximum value of AT(C) is 1.78 times its minimum value. It can be inferred that the dynamic characteristics of ECR(C) and AT(C) were essentially determined by traffic conditions. Similarly, AD(C) and AV(C) also have an obvious variation period of one day (see Table 1, and Figure 5 and Figure 6). In summary, traffic congestion seriously affects the driving of fire trucks, and then affects the efficiency of fire-fighting and the rescue of high-rise buildings.
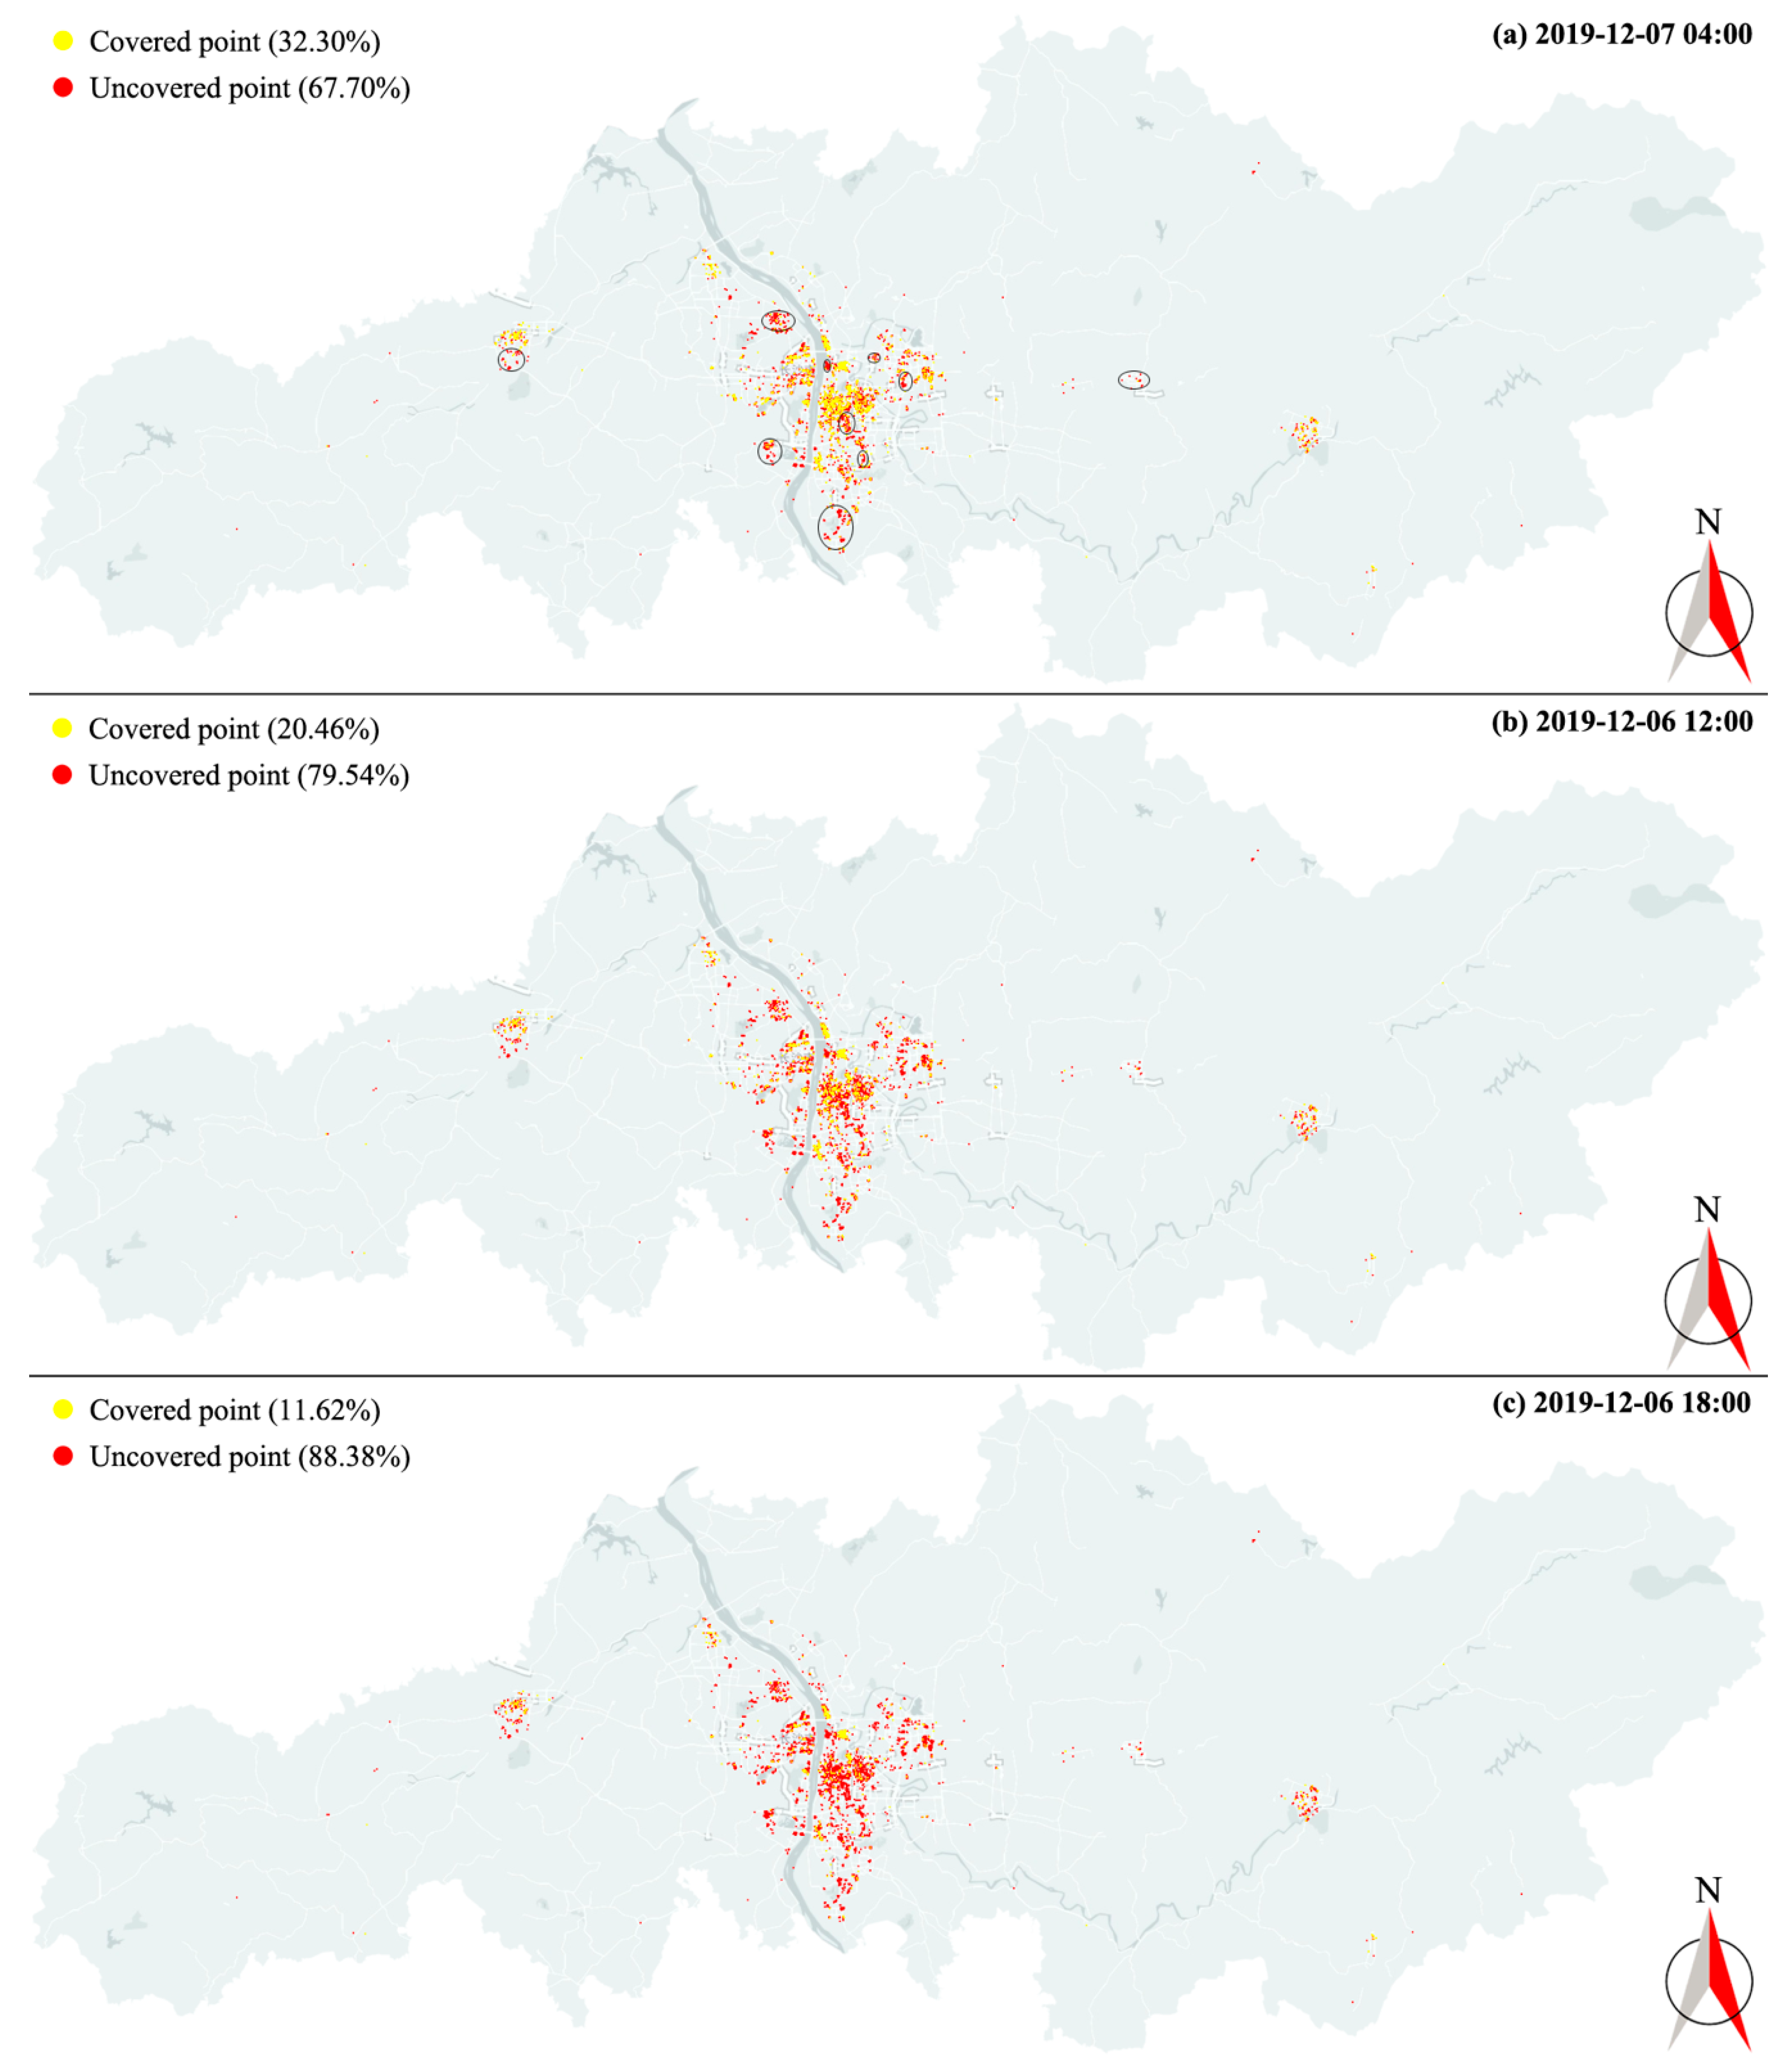
To formulate specific measures for spatial optimization of fire stations and fire apparatus, the estimation results were visualized (see Figure 7). ECR(C) has a maximum value at 2019–12–07 04:00 a.m. and a minimum value at 2019–12–06 18:00 p.m. In addition, ECR(C) at 2019–12–06 12:00 p.m. has a value of 20.46%, which is closest to the value of TECR(C, ∆T). Therefore, the estimation results in these three typical scenarios are selected for data visualization. Visualizations were generated by mapping covered and uncovered points with different colors into the satellite map of Changsha. However, it may lead to overlap phenomena, due to a large number of points and the limited resolution of the image. In these cases, the covered points will be shown first. From Figure 7a–c, the covered or uncovered status of a point may be varied in different scenarios, mainly due to the dynamic traffic conditions. However, there are many points in some areas that always had uncovered statuses (see black ellipses in Figure 7a). These areas are mainly new urban areas with smooth traffic and few fire stations. Although there are many fire stations in the main urban areas, traffic congestion leads to the reduction of the effective coverage of these fire stations. Therefore, many points in these areas can sometimes be covered, and sometimes cannot be covered. Therefore, a sufficient number of fire stations equipped with water fire trucks and aerial fire trucks should be built in the new urban areas. In urban areas susceptible to traffic congestion, fire stations should be built on the one hand, and measures should be taken to reduce traffic congestion on the other hand.

4. Discussion from a National Perspective

In 2017, there were 6043 high-rise building fires in China, resulting in 102 deaths [42]. As of 2017, there were approximately 347,000 high-rise buildings in China. During the same period, there were a total of 10,840 water fire trucks and 6192 aerial fire trucks (including 2671 water tower fire trucks, 2015 aerial platform fire trucks, and 1506 aerial ladder fire trucks) [42]. From a national perspective, each high-rise building had an average of about 0.031 water fire trucks and an average of about 0.018 aerial fire trucks. However, each high-rise building only had an average of about 0.009 water fire trucks and an average of about 0.008 aerial fire trucks in Changsha. Based on the average number of water fire trucks and aerial fire trucks per high-rise building, the national TECR(C, ∆T) should be between 2.25 and 3.44 times that of Changsha. The national TECR(C, ∆T) can be estimated to be between 45.97% and 70.27% (the median value is 58.12%).
TECR(C, ∆T) is essentially determined by the spatial distribution of high-rise buildings and the spatial distribution of fire trucks. However, the spatial distribution of high-rise buildings is not consistent with the spatial distribution of fire trucks. In any city or county in China, even if it has few high-rise buildings, it may have at least one fire station equipped with a water fire truck and an aerial fire truck. In some large cities (such as Changsha), there are a lot of high-rise buildings, and also many fire stations, but the average number of fire trucks per high-rise building may be less than in some counties. However, high-rise buildings are mainly distributed in large cities. Therefore, it can be inferred that the actual national TECR(C, ∆T) may not exceed 60.00%.
In summary, only partial high-rise buildings can be effectively covered by fire services, whether in Changsha or China. Considering the low value of TECR(C, ∆T) and the increasing number of high-rise buildings, more fire stations equipped with water fire trucks and aerial trucks should be built. Traffic congestion is a key problem in the process of urbanization in China. It can be expected that more high-rise buildings will be effectively covered if traffic congestion is reduced. It will take a long time and a lot of investment to build fire stations and reduce traffic congestion. Before there are sufficient fire-fighting resources (fire stations, water fire trucks, aerial fire trucks, etc.), the fire department can prioritize the deployment of fire trucks to areas with dense high-rise buildings. To prevent fires, people who live or work in high-rise buildings should further enhance the awareness and knowledge of fire safety. In addition, fire hydrants, automatic sprinkler systems, automatic fire alarm systems, smoke protection and exhaust systems, and other fire-fighting facilities should be installed in high-rise buildings according to the fire protection codes and standards.

5. Conclusions

This study was aimed to answer whether high-rise buildings can be effectively covered by fire services. Firstly, we proposed that the minimum fire apparatus requirement for high-rise buildings is “at least one water fire truck and one aerial fire truck should arrive at the fire scene of high-rise building within 4 min (240 s)”. Secondly, the dynamic estimation model of fire service effective coverage rate for high-rise buildings was established based on the minimum travel times of water fire trucks and aerial fire trucks. Thirdly, JavaScript was used to identify high-rise buildings in POIs, extracting real-time travel times from online maps, and analyzing and calculating based on the estimation model.
In this study, 5146 identified high-rise buildings, 61 water fire trucks, and 56 aerial fire trucks in Changsha were selected as case studies. A total of 308,760 valid data in 30 estimation scenarios were obtained. Further calculation and analysis showed that the total effective coverage rate had a value of 20.43%, and the total average travel time had a value of 421.95 s in Changsha. There were 10,840 water fire trucks and 6192 aerial fire trucks in China. Based on the average number of water fire trucks and aerial fire trucks per high-rise building, it can be estimated that the total effective coverage rate in China may not exceed 60.00%.
Due to limited fire resources and frequent traffic congestion, only partial high-rise buildings can be effectively covered by fire services, whether in Changsha or China. Therefore, more fire stations equipped with water fire trucks and aerial fire trucks should be built, and China should make great efforts to reduce traffic congestion.

Author Contributions

Conceptualization and methodology, D.L. and Z.X.; validation and visualization, D.L., L.Y. and F.W.; Writing—original draft preparation, D.L. and L.Y.; writing—review and editing, Z.X. and F.W. All authors have read and agreed to the published version of the manuscript.

Funding

This work was supported by the National Natural Science Foundation of China (Nos. 51676210, 51906261, and 51974362).

Conflicts of Interest

The authors declare no conflict of interest.

References

  1. He, Q.; Song, Y.; Liu, Y.; Yin, C. Diffusion or coalescence? Urban growth pattern and change in 363 Chinese cities from 1995 to 2015. Sustain. Cities Soc. 2017, 35, 729–739. [Google Scholar] [CrossRef]
  2. The Council on Tall Buildings and Urban Habitat. CTBUH Year in Review: Tall Trends of 2018. Available online: http://www.skyscrapercenter.com/research/CTBUH_ResearchReport_2018YearInReview.pdf (accessed on 2 January 2020).
  3. Cheema, A.R. High-rise buildings worsened heatwave. Nature 2015, 524, 35. [Google Scholar] [CrossRef] [Green Version]
  4. Zhou, L.; Guo, J.; Wen, X.; Ma, J.; Yang, F.; Wang, C.; Zhang, D. Monitoring and Analysis of Dynamic Characteristics of Super High-rise Buildings using GB-RAR: A Case Study of the WGC under Construction, China. Appl. Sci. 2020, 10, 808. [Google Scholar] [CrossRef] [Green Version]
  5. Ministry of Public Security of the People’s Republic of China (MPS). Code for Fire Protection Design of Buildings GB 50016-2014; China Planning Press: Beijing, China, 2014.
  6. An, M.; Wang, J. Fire Department of the Ministry of Public Security: Comprehensively Rectify Fire Hazards of High-Rise Buildings from July to December. Available online: http://news.cctv.com/2017/07/11/ARTIs8ahaS6bRhploCxR2k0y170711.shtml (accessed on 11 July 2017).
  7. National Fire Protection Association (NFPA). NFPA 1710: Standard for the Organization and Deployment of Fire Suppression Operations, Emergency Medical Operations, and Special Operations to the Public by Career Fire Departments; National Fire Protection Association (NFPA): Quincy, MA, USA, 2016. [Google Scholar]
  8. Liu, D.; Xu, Z.; Wang, Z.; Fan, C. Regional evaluation of fire apparatus requirements for petrol stations based on travel times. Process Saf. Environ. Prot. 2020, 135, 350–363. [Google Scholar] [CrossRef]
  9. Angle, J.; Gala, M.; Harlow, D.; Lombardo, W.; Maciuba, C. Firefighting Strategies and Tactics; Jones and Bartlett Learning: Burlington, NJ, USA, 2016. [Google Scholar]
  10. Chen, Z.; Li, J.; Lu, F.; Li, Q. Optimizing location of fire stations and it’s enlightenments for Xiongan New Area. J. Saf. Sci. Technol. 2018, 14, 12–17. [Google Scholar]
  11. Chevalier, P.; Thomas, I.; Geraets, D.; Goetghebeur, E.; Janssens, O.; Peeters, D.; Plastria, F. Locating fire stations: An integrated approach for Belgium. Socioecon. Plann. Sci. 2012, 46, 173–182. [Google Scholar] [CrossRef] [Green Version]
  12. Murray, A.T. Optimising the spatial location of urban fire stations. Fire Saf. J. 2013, 62, 64–71. [Google Scholar] [CrossRef]
  13. Yeboah, G.; Park, P.Y. Using survival analysis to improve pre-emptive fire engine allocation for emergency response. Fire Saf. J. 2018, 97, 76–84. [Google Scholar] [CrossRef]
  14. Veenendaal, B.; Brovelli, M.A.; Li, S. Review of Web Mapping: Eras, Trends and Directions. ISPRS Int. J. Geo-Inf. 2017, 6, 317. [Google Scholar] [CrossRef]
  15. Xiang, Y.; Gao, S.; Chen, Y.; Huang, J.; Xu, X. A Comparative Study of Baidu Map API, Lbs Amap Api and Google Maps API. Softw. Guid. 2017, 16, 19–21. [Google Scholar]
  16. Jonietz, D.; Zipf, A. Defining Fitness-for-Use for Crowdsourced Points of Interest (POI). ISPRS Int. J. Geo-Inf. 2016, 5, 149. [Google Scholar] [CrossRef] [Green Version]
  17. Baidu. Baidu Maps API SDK. Available online: http://lbsyun.baidu.com/ (accessed on 2 January 2019).
  18. Wang, S.; Xu, G.; Guo, Q. Street Centralities and Land Use Intensities Based on Points of Interest (POI) in Shenzhen, China. ISPRS Int. J. Geo-Inf. 2018, 7, 425. [Google Scholar] [CrossRef] [Green Version]
  19. Jiang, J.; Dai, F.; Zhang, J. Urban Functional Zone Recognition and Green Space Evaluation of Shanghai Based on POI Data. Chin. Landsc. Archit. 2019, 35, 113–118. [Google Scholar]
  20. Lu, T.; Lansing, J.; Zhang, W.; Bechle, M.J.; Hankey, S. Land Use Regression models for 60 volatile organic compounds: Comparing Google Point of Interest (POI) and city permit data. Sci. Total Environ. 2019, 677, 131–141. [Google Scholar] [CrossRef] [PubMed]
  21. Cai, M.; Lan, Z.; Zhang, Z.; Wang, H. Evaluation of road traffic noise exposure based on high-resolution population distribution and grid-level noise data. Build. Environ. 2019, 147, 211–220. [Google Scholar] [CrossRef]
  22. Kc, K.; Corcoran, J.; Chhetri, P. Spatial optimisation of fire service coverage: A case study of Brisbane, Australia. Geogr. Res. 2018, 56, 270–284. [Google Scholar] [CrossRef]
  23. Echeverria, F.; Abrego, A.; de Audicana, M.G.; Lopez-Maestresalas, A.; Arazuri, S.; Ciriza, R.; Jaren, C. Analysis of fire services coverage in Spain. DYNA 2018, 93, 247–251. [Google Scholar]
  24. Gu, C. Urbanization: Positive and negative effects. Sci. Bull. 2019, 64, 281–283. [Google Scholar] [CrossRef] [Green Version]
  25. Han, F.; Xie, R.; Lai, M. Traffic density, congestion externalities, and urbanization in China. Spat. Econ. Anal. 2018, 13, 400–421. [Google Scholar] [CrossRef]
  26. Lin, C.; Yu, Y.; Wu, D.; Gong, B. Traffic Flow Catastrophe Border Identification for Urban High-Density Area Based on Cusp Catastrophe Theory: A Case Study under Sudden Fire Disaster. Appl. Sci. 2020, 10, 3197. [Google Scholar] [CrossRef]
  27. Nimlyat, P.S.; Audu, A.U.; Ola-Adisa, E.O.; Gwatau, D. An evaluation of fire safety measures in high-rise buildings in Nigeria. Sustain. Cities Soc. 2017, 35, 774–785. [Google Scholar] [CrossRef]
  28. Wang, M.; Zhang, J.; Yang, L.; Yunwei, Y. Fire safety resilience assessment of high-rise buildings facing resilient city. Build. Sci. 2020, 5, 115–119. [Google Scholar]
  29. Shi, L.; Chew, M.Y.L.; Liu, X.; Cheng, X.; Wang, B.; Zhang, G. An experimental and numerical study on fire behaviors of charring materials frequently used in buildings. Energy Build. 2017, 138, 140–153. [Google Scholar] [CrossRef]
  30. Nguyen, K.T.Q.; Mendis, P.; Fernando, S. Novel modelling approach for evacuation strategies of tall towers—A case study of Lotus Tower. J. Build. Eng. 2019, 25, 100763. [Google Scholar] [CrossRef]
  31. Zeng, Y.; Song, W.; Huo, F.; Fang, Z.; Cao, S.; Vizzari, G. Effects of Initial Distribution Ratio and Illumination on Merging Behaviors During High-Rise Stair Descent Process. Fire Technol. 2018, 54, 1095–1112. [Google Scholar] [CrossRef]
  32. Wang, C.; Xia, D.; Jiang, L.; Shang, K.; Liu, H.; Xue, C.; Wu, L.; Ma, H.; Wei, H.; Zhu, X.; et al. Guidelines for Fire Fighting of High-Rise Buildings GA/T1191-2014; China Standards Press: Beijing, China, 2014. [Google Scholar]
  33. Zanenga, E.; Leonello, D.; Bottasso, C.L. Feasibility Study of Rotorcraft Fire Fighting for High-Rise Buildings. J. Aerosp. Eng. 2010, 23, 166–175. [Google Scholar] [CrossRef]
  34. Min, S.; Park, J.; Kwon, Y. A Study on the Fire Suppression in Ultra High-Buildings using Fire Department Connection. J. Korean Soc. Hazard Mitig. 2016, 16, 195–201. [Google Scholar] [CrossRef] [Green Version]
  35. Qiu, X.; Shen, Y.; Han, S.; Liu, H.; Qin, Y.; Zhang, X. Fire Engine Suitable for Fire-Fighting in High-Rise and Super High-Rise Buildings. U.S. Patent 9,566,459, 14 February 2017. [Google Scholar]
  36. Zelenkov, S.A.; Podgrushnyy, A.V.; Denisov, A.N.; Bordik, R.I. Combined method of extinguishing fires in high-rise buildings using hose-pump high pressure system. Fire Explos. Saf. 2017, 26, 56–64. [Google Scholar] [CrossRef] [Green Version]
  37. Ministry of Housing and Urban-Rural Development of the People’s Republic of China (MOHURD); Ministry of Public Security of the People’s Republic of China (MPS). Code for Planning of Urban Fire Control GB51080-2015; China Architecture & Building Press: Beijing, China, 2015.
  38. KC, K.; Corcoran, J.; Chhetri, P. Measuring the spatial accessibility to fire stations using enhanced floating catchment method. Socioecon. Plann. Sci. 2018, 69, 100673. [Google Scholar] [CrossRef]
  39. Changsha Bureau of Statistics. 2018 Changsha Statistical Yearbook. Available online: http://tjj.changsha.gov.cn/tjnj/2019/ (accessed on 25 January 2019).
  40. Guo, J.; Li, C.; Qin, X.; Huang, W.; Wei, Y.; Cao, J. Analyzing distributions for travel time data collected using radio frequency identification technique in urban road networks. Sci. China Technol. Sci. 2019, 62, 106–120. [Google Scholar] [CrossRef]
  41. Liu, D.; Xu, Z.; Wang, Z.; Zhou, Y.; Fan, C. Estimation of effective coverage rate of fire station services based on real-time travel times. Fire Saf. J. 2020, 103021. [Google Scholar] [CrossRef]
  42. Fire Department of Ministry of Public Security of the People’s Republic of China. 2018 China Fire Yearbook; Yunnan People’s Publishing House: Kunming, China, 2018.
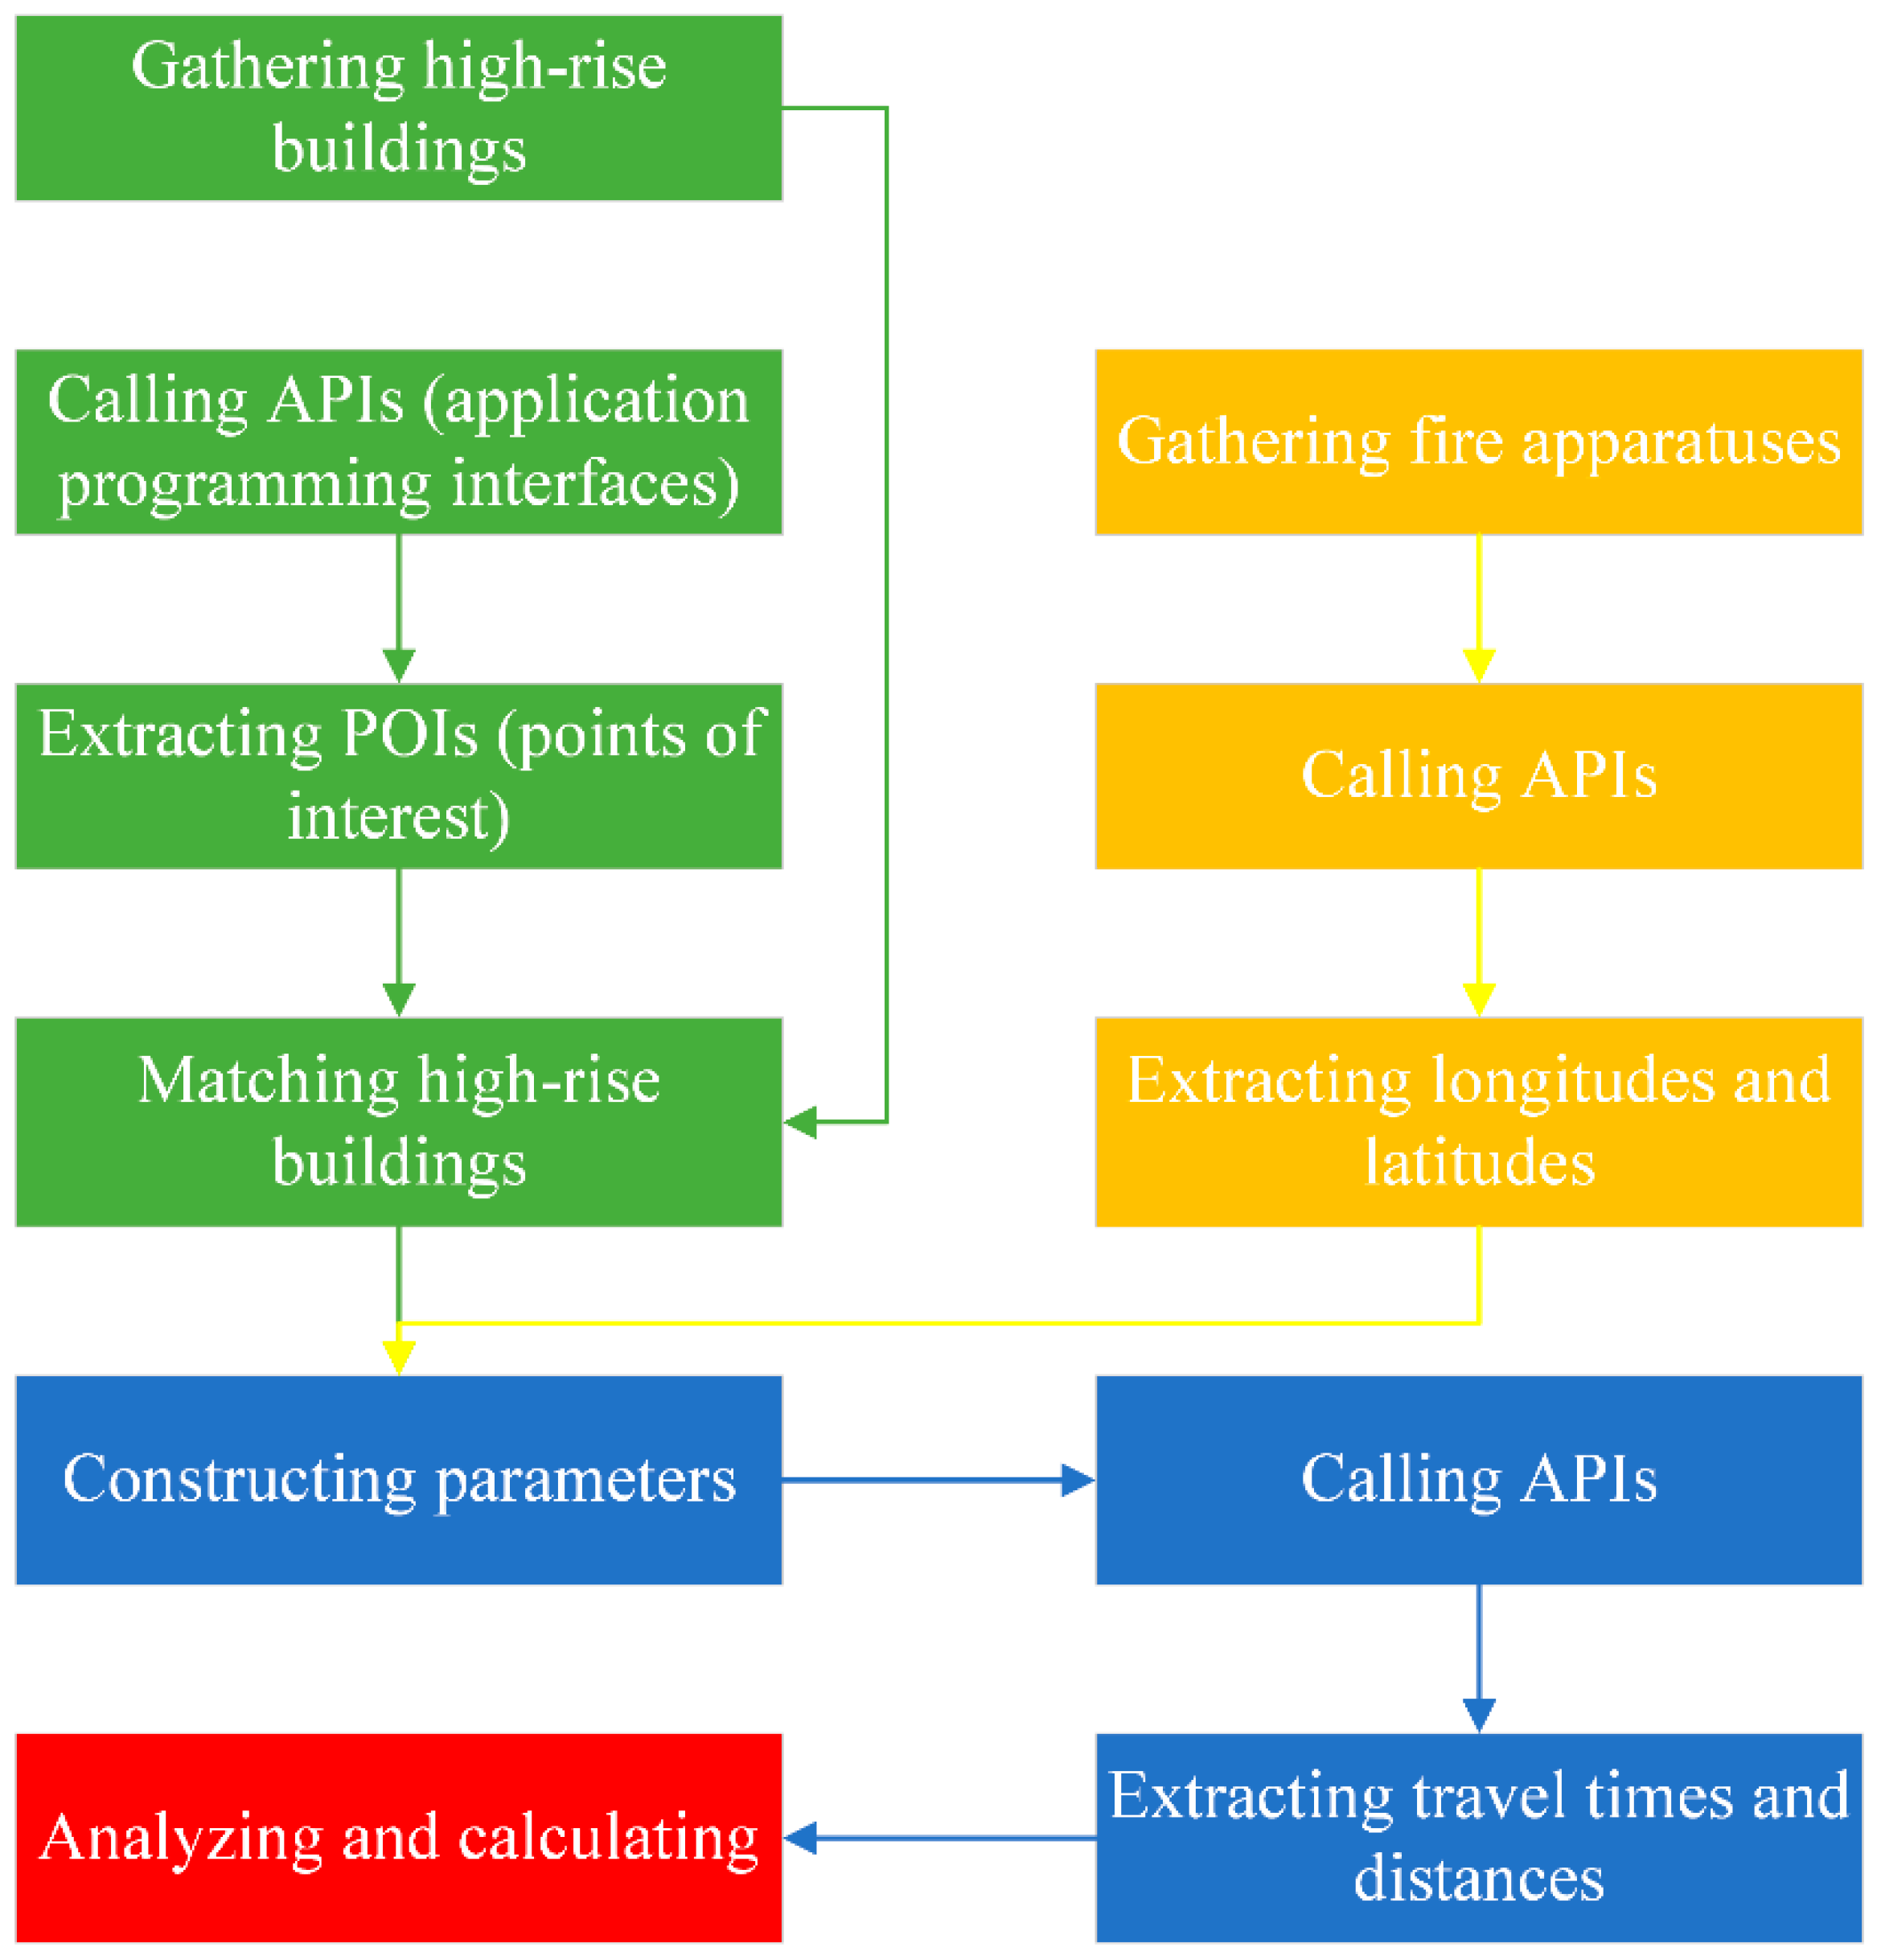
Figure 1. Flow chart of data extraction and processing.
Applsci 10 06632 g001
Figure 2. Distribution of high-rise buildings and fire stations in Changsha City. Yellow dots represent high-rise buildings. Red squares represent fire stations equipped with both a water fire truck and an aerial fire truck. Orange squares represent fire stations only equipped with a water fire truck. Blue squares represent fire stations only equipped with an aerial fire truck. Urban areas are in black ellipses.
Applsci 10 06632 g002
Figure 3. Trend chart of ECR(C).
Applsci 10 06632 g003
Figure 4. Trend chart of AT(C).
Applsci 10 06632 g004
Figure 5. Trend chart of AD(C).
Applsci 10 06632 g005
Figure 6. Trend chart of AV(C).
Applsci 10 06632 g006
Figure 7. Visualizations of estimation results in typical scenarios. (a) At 2019–12–07 04:00 a.m. (b) At 2019–12–06 12:00 a.m. (c) At 2019–12–06 18:00 p.m. Black ellipses represent areas which always had uncovered statuses.
Applsci 10 06632 g007
Table 1. ECR(C), AD(C), AT(C), AV(C), EC(C), and UC(C) in different evaluation scenarios. ECR(C): effective coverage rate of fire services. AD(C): average travel distance. AT(C): average travel time. AV(C): average travel velocity. EC(C): number of effectively covered points. UC(C): number of uncovered points.
No.TjECR(C)AD(C)(m)AT(C)(s)AV(C)(m/s)EC(C)UC(C)
12019–12–02 00:00:0026.60%3206.29343.449.3413693777
22019–12–02 04:00:0029.83%3201.96320.449.9915353611
32019–12–02 08:00:0013.00%3239.20495.136.546694477
42019–12–02 12:00:0019.39%3205.19401.587.989984148
52019–12–02 18:00:0013.43%3235.86515.546.286914455
62019–12–03 04:00:0032.04%3200.63312.1810.2516493497
72019–12–03 08:00:0013.86%3234.02466.566.937134433
82019–12–03 12:00:0018.66%3211.08402.047.999604186
92019–12–03 18:00:0012.79%3254.32533.206.106584488
102019–12–04 04:00:0031.75%3195.80312.4910.2316343512
112019–12–04 08:00:0014.57%3230.85462.946.987504396
122019–12–04 12:00:0019.94%3213.55397.658.0810264120
132019–12–04 18:00:0012.16%3245.46520.466.246264520
142019–12–05 04:00:0031.69%3198.34315.2310.1516313515
152019–12–05 08:00:0014.34%3239.00466.376.957384408
162019–12–05 12:00:0020.17%3211.08392.828.1710384108
172019–12–05 18:00:0013.86%3233.48502.946.437134433
182019–12–06 04:00:0031.19%3213.59316.6210.1516053541
192019–12–06 08:00:0015.58%3228.94460.677.018024344
202019–12–06 12:00:0020.46%3226.81400.548.0610534093
212019–12–06 18:00:0011.62%3268.52555.315.895984548
222019–12–07 04:00:0032.30%3204.39315.2710.1616623484
232019–12–07 08:00:0018.91%3225.22412.067.839734173
242019–12–07 12:00:0019.06%3244.01414.457.839814165
252019–12–07 18:00:0013.78%3269.92493.236.637094437
262019–12–08 04:00:0031.34%3218.67317.6310.1316133533
272019–12–08 08:00:0019.78%3223.77404.527.9710184128
282019–12–08 12:00:0018.48%3228.30414.967.789514195
292019–12–08 18:00:0014.85%3264.71483.186.767644382
302019–12–09 00:00:0026.95%3216.11345.069.3213873759
31Variance0.50%414.50 5666.30 2.08 133,547 133,547