Article

Approach for Optimisation of Tunnel Lining Design

1
Department of Geotechnics and Underground Engineering, Faculty of Civil Engineering, VSB—Technical University of Ostrava, Ludvika Podeste 1875/17, 708 00 Ostrava-Poruba, Czech Republic
2
Department of Telecommunications, Faculty of Electrical Engineering and Computer Science, VSB—Technical University of Ostrava, 17. listopadu 15, 708 33 Ostrava-Poruba, Czech Republic
*
Authors to whom correspondence should be addressed.
Appl. Sci. 2020, 10(19), 6705; https://doi.org/10.3390/app10196705
Submission received: 24 August 2020 / Revised: 20 September 2020 / Accepted: 21 September 2020 / Published: 25 September 2020
(This article belongs to the Special Issue Advances in Design, Repair and Materials of Structural Concrete)

Abstract

:
This paper presents an approach that enables the specific characteristics of a primary tunnel lining implemented using numerical modelling to be taken into account during its design. According to the fundamental principles of the New Austrian Tunnelling Method, the primary lining undergoes time-dependent deformation, which is determined by its design. The main design element is shotcrete, which, shortly after its application, interacts with the surrounding rock mass and steel arch frame. The primary lining ensures the equilibrium stress–strain state of “rock mass–tunnel lining” during excavation. The structural interaction varies depending on the hardening of the shotcrete, the rheological properties of the rock mass, and other factors. The proposed approach uses the Homogenisation software application, which was developed by the Faculty of Civil Engineering at the Department of Geotechnics and Underground Engineering of the VSB—Technical University of Ostrava. This software allows the heterogeneous structure of the lining to be considered by replacing it with a homogenous structure. The parameters of the homogeneous primary lining, which take into account the steel reinforcement elements and the time-dependent property of the shotcrete, are included in numerical models.

1. Introduction

A major portion of current underground line construction in Central Europe is implemented partially or fully in accordance with the principles of the New Austrian Tunnelling Method (NATM). The tunnel lining based on the NATM principles is implemented with a double-shell tunnel lining consisting of a primary lining (temporary), as shown in Figure 1, and a secondary (definitive) lining [1].
The purpose of the primary lining is to temporarily secure the excavation and create suitable conditions in the rock mass for proper secondary-lining function. The primary lining allows partial release of the original stress in the rock mass in the form of radial deformations, resulting in improved utilisation of the shear strength of the massif and ensuring that the optimum load on the secondary lining is achieved. Thus, the primary lining efficiently utilises the stability potential of the rock mass. Correct application of the primary lining forms a load-bearing ring in the rock mass. It is important for the working characteristics of the primary lining to suitably respond to rheological processes occurring in the rock mass and allow certain deformations while preventing the development of critical deformations that may cause secondary impairment and loosening of the rock mass [1,2]. This interaction between the lining and the rock mass can be influenced by the following factors:
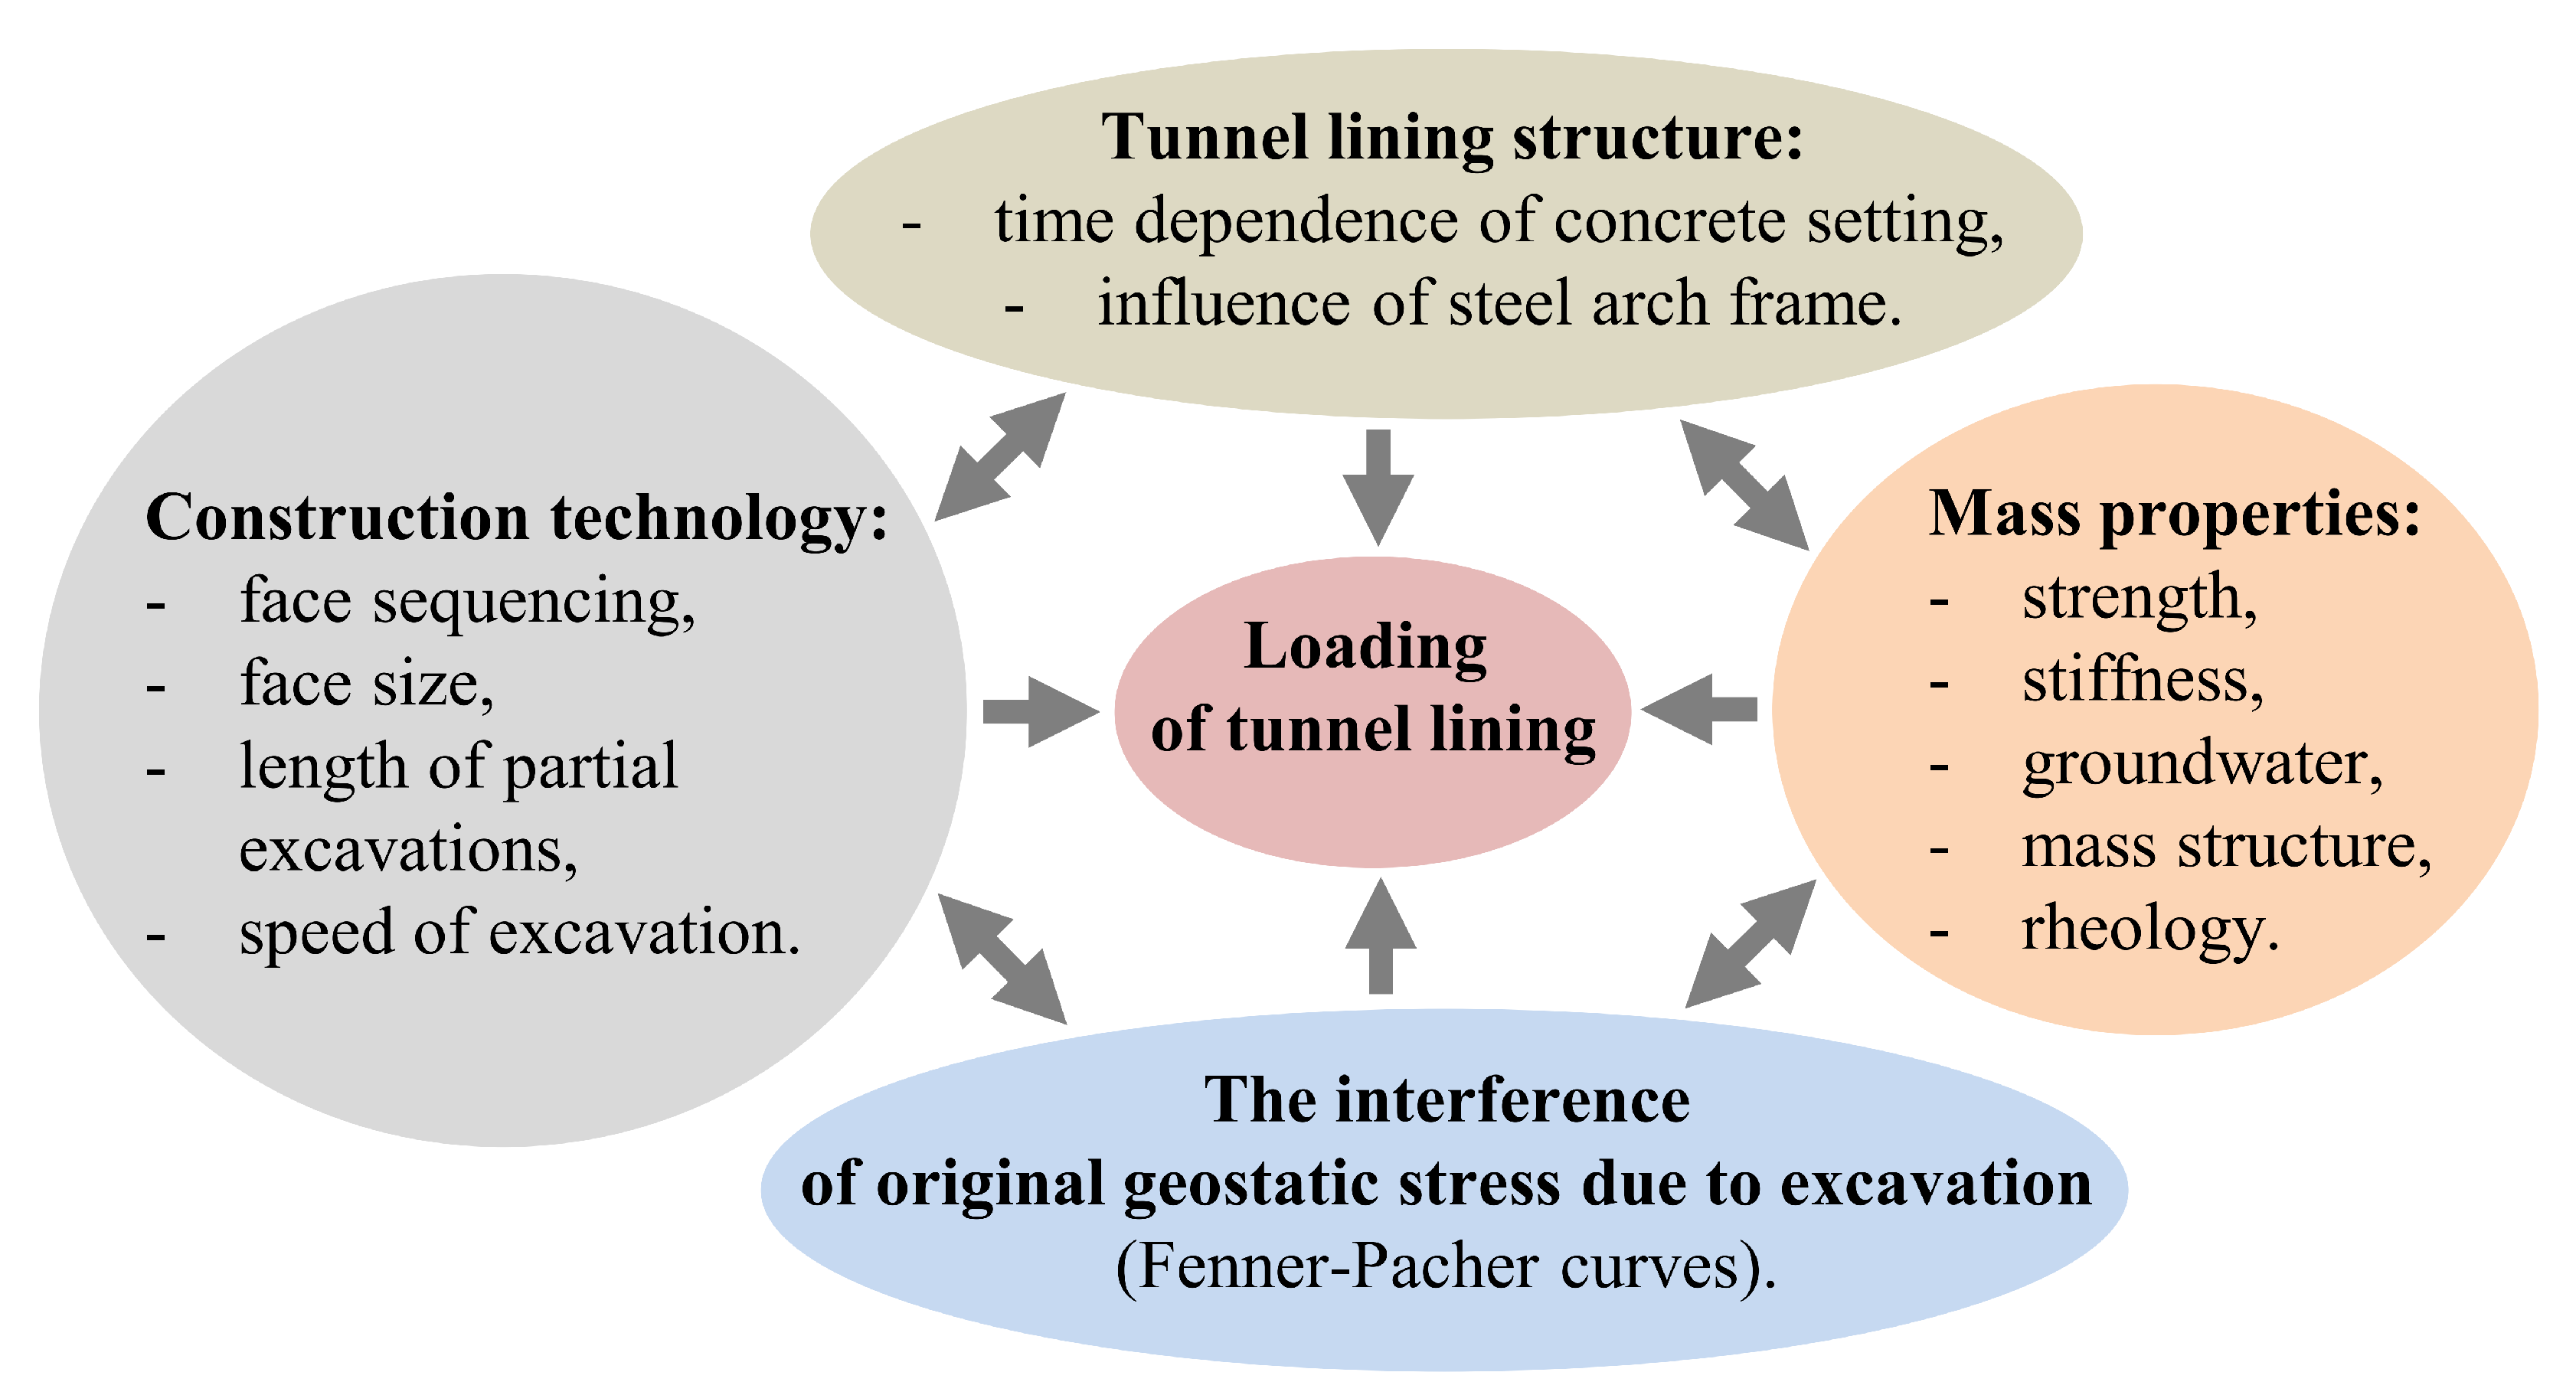
  • a delay between partial excavation and the installation of the primary lining, which is known as the “time factor”;
  • the stiffness of the lining and its development in time, which depend on the time-dependent parameters of the shotcrete [3,4].
The primary lining is a unique structure in many aspects. The main structural elements of the primary lining include shotcrete, steel arch frames (rolled profiles, triangular lattice girder, etc.), reinforcement grids and bolts. The structure made of shotcrete and steel arches differs from conventional reinforced-concrete structures with regard to its composition and loading characteristics. Another important difference is the magnitude and impact of the load over time. A conventional reinforced-concrete structure is exposed to load only after the concrete has cured, whereas the primary lining in an underground construction is exposed to load immediately after the shotcrete is applied when NATM principles are used [5]. These differences should be considered in the design and assessment of the lining.
The load on the primary lining is determined by the interaction of the lining with the surrounding soil or rock mass. This interaction depends on numerous factors. Before excavation and the building of the tunnel lining, the rock mass is in an original equilibrium state of strain–stress. This equilibrium is disrupted by tunnel construction, and the strain–stress changes itself to a new equilibrium status. The purpose of the primary lining is to allow a certain amount of radial deformation in the excavation, which reduces the final load on the lining. This interaction and its input factors are presented in Figure 2, which indicate that the load on the primary lining is highly complex and affected by many factors.
In a real situation involving construction of the primary lining, the factors significantly influence the interaction between the lining and the rock mass and the stress development in the primary lining [6,7,8]. It is generally difficult (and often impossible) to capture in detail all the factors in structural–strength calculations using numerical models, as some of the factors cannot be accurately described. Many factors must be simplified either replaced using analytical, empirical relationships or completely disregarded during design to simplify the numerical model. However, simplification of the model should not affect the fundamental behaviour of the master model. A numerical model, albeit with extensive simplifications, may provide results of sufficient quality, as long as the simplifications are considered in the evaluation of the results [9,10] (Svoboda and Masin, 2010; Karakus, 2007). In this study, stress redistribution was applied to the structural elements of the primary lining, and the effects of the following factors were examined:
  • the work construction technology (amount of excavation, length of the burden and “rate of progress”);
  • the geological conditions in the rock mass related to the structural strength and deformability;
  • the specific load on the structure of the lining caused by the interaction between the rock mass and the primary lining;
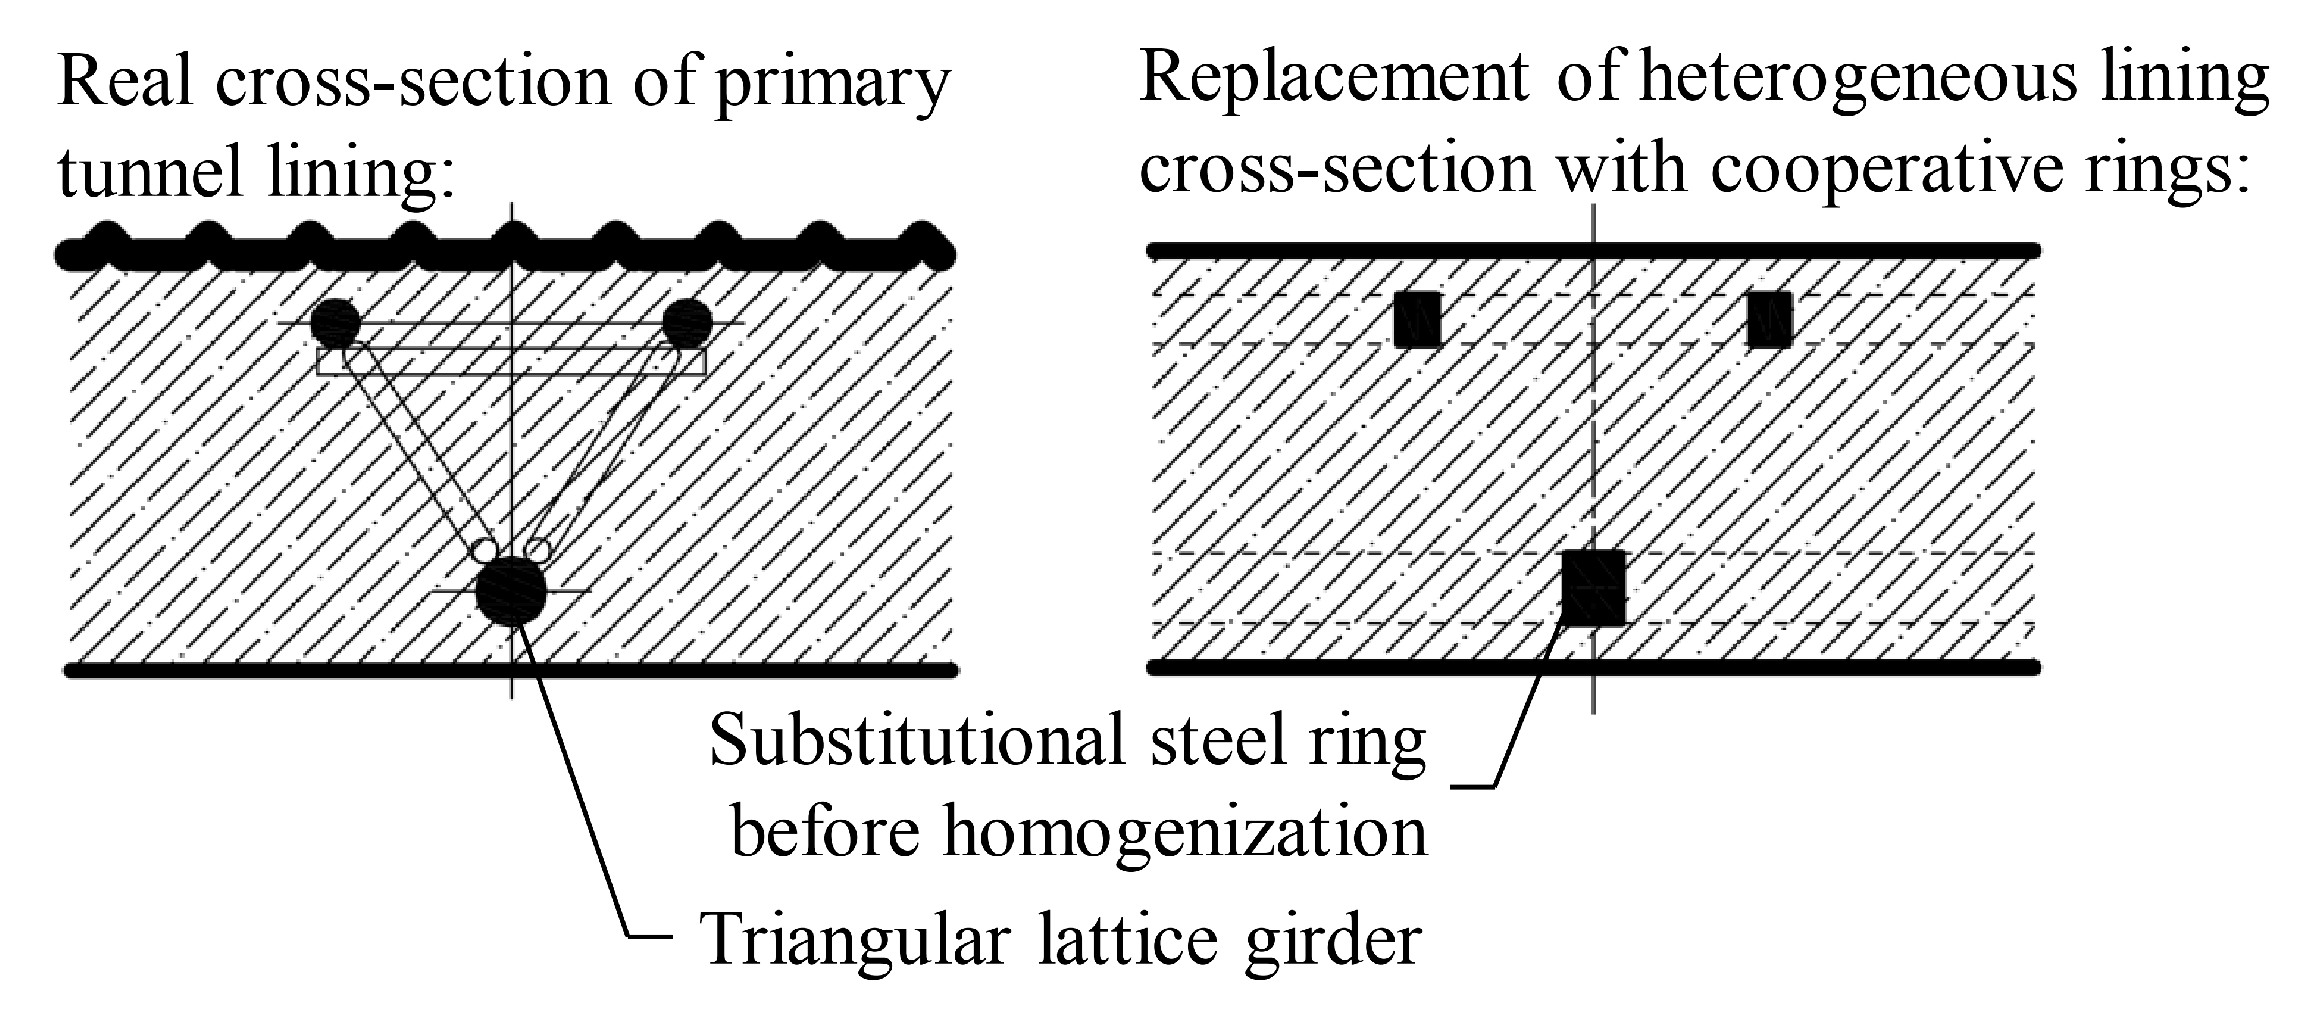
  • the heterogeneous structure of the primary lining, i.e., concrete and steel elements (arch frames, grids) and their spatial arrangement in the lining cross-section; and
  • the time-dependent parameters of the shotcrete.
After installation of the primary lining and stop of the convergences, the secondary (definitive) lining is made. The task of the primary lining is therefore only temporary short-term stabilization of the excavation in the rock mass. While rheological processes have a long-term character [11,12], they manifest themselves after a longer time than is the stabilization activity of the primary lining and it makes sense to take them into account when designing the secondary (definitive) lining.

2. State of the Art

The primary lining currently used to reinforce underground constructions has not changed with regard to its function since the time when the NATM principles were proposed [1,3,4,5,13]. The most important and largest construction using this method in the Czech Republic is the Blanka Tunnel Complex, which was built in 2007–2015.
The primary lining of underground structures is assessed according to the limit conditions in the time interval from its implementation to the construction of the secondary (final) lining. Thus, the primary lining is dimensioned according to all critical combinations of internal forces that may occur during different phases of development. After the secondary lining is completed, its load-bearing capacity is not commonly considered. EC7 [14], which is a standard describing the methodology for designing geotechnical constructions, and does not deal with tunnel constructions in detail. This standard defines the design approaches for considering the ratio of the uncertainty in the typical input parameters for geotechnical structures in the structural–strength calculation. An integral part of tunnel construction is monitoring in real time of the behaviour of ground rock around excavation. In the case of using NATM, the primary lining is continuously monitored and based on the comparison of the prediction with the actual behaviour, and is modified in the next construction procedure (the principle of the observation method). Basic monitoring can include, for example, convergence, inclinometric and dynamometric measurements. In underground construction, there have been developed progressive monitoring technologies, which make possible comprehensive control of the shape of the work geometry, such as the thickness of the primary lining (3D scanning) and a number of other modern progressive methods of stress monitoring not only in lining structures but also in rock mass around the excavation [15], that are significant for strain–stress in lining structure.
The primary lining is usually designed via numerical modelling using software based on the finite-element method [10,16,17,18]. Two-dimensional (2D) analyses are applied to a larger extent, as they significantly simplify the problems in constructing tunnel structures. 2D analyses cannot capture with sufficient precision the effect of spatial relocation of stress arising in the rock mass as a tunnel is driven. This phenomenon can be included in a 2D calculation with methods that only partially describe the problem. The most frequently used method is the β -method [19]. The β -method principle (sometimes also referred to as the λ -method) is the consideration of the spatial situation through the coefficient β (dimensionless; 0 < β < 1), which describes the distribution of the overall mass load of the temporarily unreinforced stope and the residual load transferred by the primary lining. The aforementioned stress distribution reflects the influence of partial convergences occurring before the reinforcement mounting [5,10,20]. The core-softening method can be included among the other methods for determining the spatial situation within the plane. In the 2D model, the spatial effect is reflected by reducing the value of earth elastic modulus at the location of the future excavation, prior to the excavation creation and reinforcement. Thus, it is possible to rearrange the stress that can occur in a real situation before the reinforcement mounting.
Three-dimensional (3D) analysis is commonly used in cases of spatially complex tunnel structures, e.g., branching, crossings and tunnel portals [21,22]. In contrast to 2D analysis, it provides more realistic information regarding the rock mass behaviour [23]. However, this is at the expense of longer preparation of the model and greater demands regarding the comprehensiveness of the input parameters, e.g., capturing the progress of driving. The modelling result indicates the stress-deformation status of the rock mass; the effect of the tunnel’s construction on the development of the synclinal valley on the surface, which is important to predict for built-up areas; and the internal forces in the primary lining [24]. The lining cross-section is then assessed by comparing the inner forces with the load-bearing capacity, which is depicted in an interaction diagram according to EC2 [25].
The primary lining construction (shotcrete and steel arch frame) results in the creation of crosswise sections in a longitudinal direction having a high degree of reinforcement where the steel arches are placed and a low degree of reinforcement between the steel arches. According to EC2 [25], the primary lining falls under the slabs, i.e., flat elements with dimensions exceeding its thickness by a factor of five, but the conditions for the maximum reinforcement distances (i.e., the considered steel arches) are not satisfied. Under such conditions, design assessment by an interaction diagram, which is for conventional reinforced-concrete structures, cannot be applied. Owing to the interaction between the primary lining and the rock environment, which is influenced by the tunnelling process, the cross-section structure, the tunnelling time advance, the reinforcement methods and the structure of the primary lining, the steel reinforcing arches are considered in numerical structural calculations [26,27,28].
In addition to reinforcement with steel arches, the primary lining is characterised by time-dependent properties [4,29]. Shortly after the spraying of the shotcrete, the lining begins to cooperate structurally with the rock mass. In the time from shotcrete application to the curing of the concrete, the deformation and strength parameters that influence the interaction change. Thus, the stiffness of the primary lining depends on not only its structure, i.e., the structural components used, but also the stage of the construction when the lining is considered in the partial structural–strength calculation [10,30,31]. In addition to the basic tools used to describe the lining’s heterogeneous structure, such as cross-section homogenisation according to a weighted average or a calculation based on reinforced concrete, numerous alternative methods are available [31,32,33,34]. Fundamentally, they approximate the heterogeneous structure of the lining and replace it with the parameters of a homogenous material.
For the aforementioned reason, this question is handled in the lining design via alternative methods, or the presence of steel arches is disregarded completely, and only steel wire nettings are considered in structural calculations. If the reinforcing arches are disregarded, the design based on the reinforced-concrete theory can be applied. It is unclear whether disregarding the steel arches (to be on the safe side) results in a higher load-bearing capacity of the actual primary lining. If the steel arches are disregarded in static calculations, the lining will be more rigid than necessary according to the NATM, increasing the economic costs.
The aforementioned problem can be solved via the following theories or methods.
  • weighted average: the simplest homogenisation method employs the weighted averages of the elastic modulus of the materials used, where the relevant weight is the surface area of the materials;
  • solutions based on the steel–concrete theory;
  • the method of A. Zapletal [34];
  • the method of J. Rott [32];
  • the theory for cooperation rings [35,36,37], which is used in the proposed procedure.
The importance of shotcrete in the implementation of underground structures according to NRTM also consists of the gradual increase of the primary lining stiffness. The technical literature presents various approaches for defining the parameters of shotcrete as variables with functions of time [29,30,31]. To achieve a high level of objectivity in the model of the interaction between the primary lining and the rock mass, the following aspects of shotcrete samples considered for implementation should be analysed: the mixture formula, the use of admixtures and additives, their potential chemical reactivity with cement, the shot technology, etc. Basic information about the concrete modulus over time is given by EC2 [25], which states:
E c m ( t ) = f c m ( t ) f c m 0.3 · E c m
where: E c m is the mean value of the modulus of elasticity after 28 days (C20/25 is E c m = 29 GPa), E c m (t) is the mean value of the modulus of elasticity at time t(d).

3. Methodology

The paper presents using an alternative method that allows the consideration of the primary-lining heterogeneity, including the time-dependent parameters of the shotcrete, in the numerical model. The Homogenisation software application [33], which utilises the theory of cooperation rings, is used in the solution process. This theory is based on an analytical model for the calculation of the stress-deformation conditions in a multi-layered circular ring [38].
This analytical model utilises the theory of analytical functions of a complex variable, the theory of complex potentials and the function of Kolosov–Muskhelishvili. The basic algorithm is based on the assumption that the external load (normal and shear) of the ring is transmitted by the individual layers according to the transfer coefficients, which generally depend on the condition of the continuity of deformations at individual contacts of the reinforcement layer. These transfer coefficients are functions of the layer thickness and the deformation characteristics of the layer materials. The quasi-homogeneous elastic modulus of the non-homogeneous multilayer reinforcement ring is determined via gradual homogenisation from the inner layers to the outer layers. First, the partial quasi-homogeneous elastic moduli of the two innermost layers of the nonhomogeneous multilayer reinforcement system are evaluated. In a multilayer reinforcement system, the two inner layers are joined into a single layer (whose thickness is equal to the sum of the thicknesses of the layers being homogenised), and the homogenisation process is again applied to the two inner layers of the system. This procedure is performed repeatedly; thus, the number of layers in the original multilayer reinforcement system is gradually reduced until there is a single layer, whose thickness is the sum of the thicknesses of the original layers in the non-homogeneous reinforcement system, characterised by the quasi-homogeneous elastic modulus. The basic condition applied in the homogenisation of the two inner layers of the system is the equality of the radial displacements on the outer perimeter of the second layer, assuming both that the layers have different stiffnesses and that the two layers are replaced by a single layer (whose thickness is the sum of the thicknesses of the two layers homogenised) with a homogenised elastic modulus. Figure 3 shows the replacement of a heterogeneous lining cross-section with individual rings that are homogenised.
The cross-sectional homogenisation provides the lining deformation characteristics (elastic modulus for homogenised cross-section E h m , Poisson’s ratio for homogenised cross-section v h m ) and redistribution coefficients a 1 and a 2 . The numerical solution results in the quantification of the homogenised lining cross-section loading according to the internal forces. Then, using the redistribution coefficients a 1 and a 2 , the tangential stress of the homogenised lining cross-section can be converted into the stresses in individual elements, i.e., the steel arch frame and shotcrete. The proposed solution is described in Figure 4.
The aforementioned problems have been studied at the Department of Geotechnics and Underground Engineering of the VSB—Technical University of Ostrava since 1999 [35,36,37].

4. Model Illustration of Primary Tunnel Lining Design

This section presents an alternative approach for the primary tunnel lining design that involves numerical modelling, which is introduced in Figure 3. The primary lining is assessed in identical cross-sections at different calculation stages (days 1, 5 and 10) or according to the progress of the driving/tunnel face 1, 5 and 10 m from the solved cross-section at a progress rate of 1 m/d. Additionally, the stress development in selected cross-sections at certain calculation stages is analysed, including assessment. The foregoing analysis considers the fundamental, important definitions of the NATM:
  • the heterogeneous structure of the lining or the presence of reinforcement arches in the cross-section of the lining;
  • the time dependence of the lining’s deformation parameters due to the curing of the shotcrete.
The load on the primary lining depends on numerous variables, including the stiffness of the lining, and to achieve relevant results in numerical models, it is necessary to consider the fundamental behaviour of the model. The procedure selected in this case, considering the aforementioned claims of the NATM, can be integrated into the commonly used schematic of a structural strength assessment unaffected of its informative value.
The construction stage of the lining in this study is understood to be the stage where the deformation parameters of the primary lining are constant. A calculation stage corresponds to the simulation of the progress of work performed by one step/burden (1 m). Therefore, one construction stage of the lining can be used for several calculation stages.
The following alternatives were considered in this study:
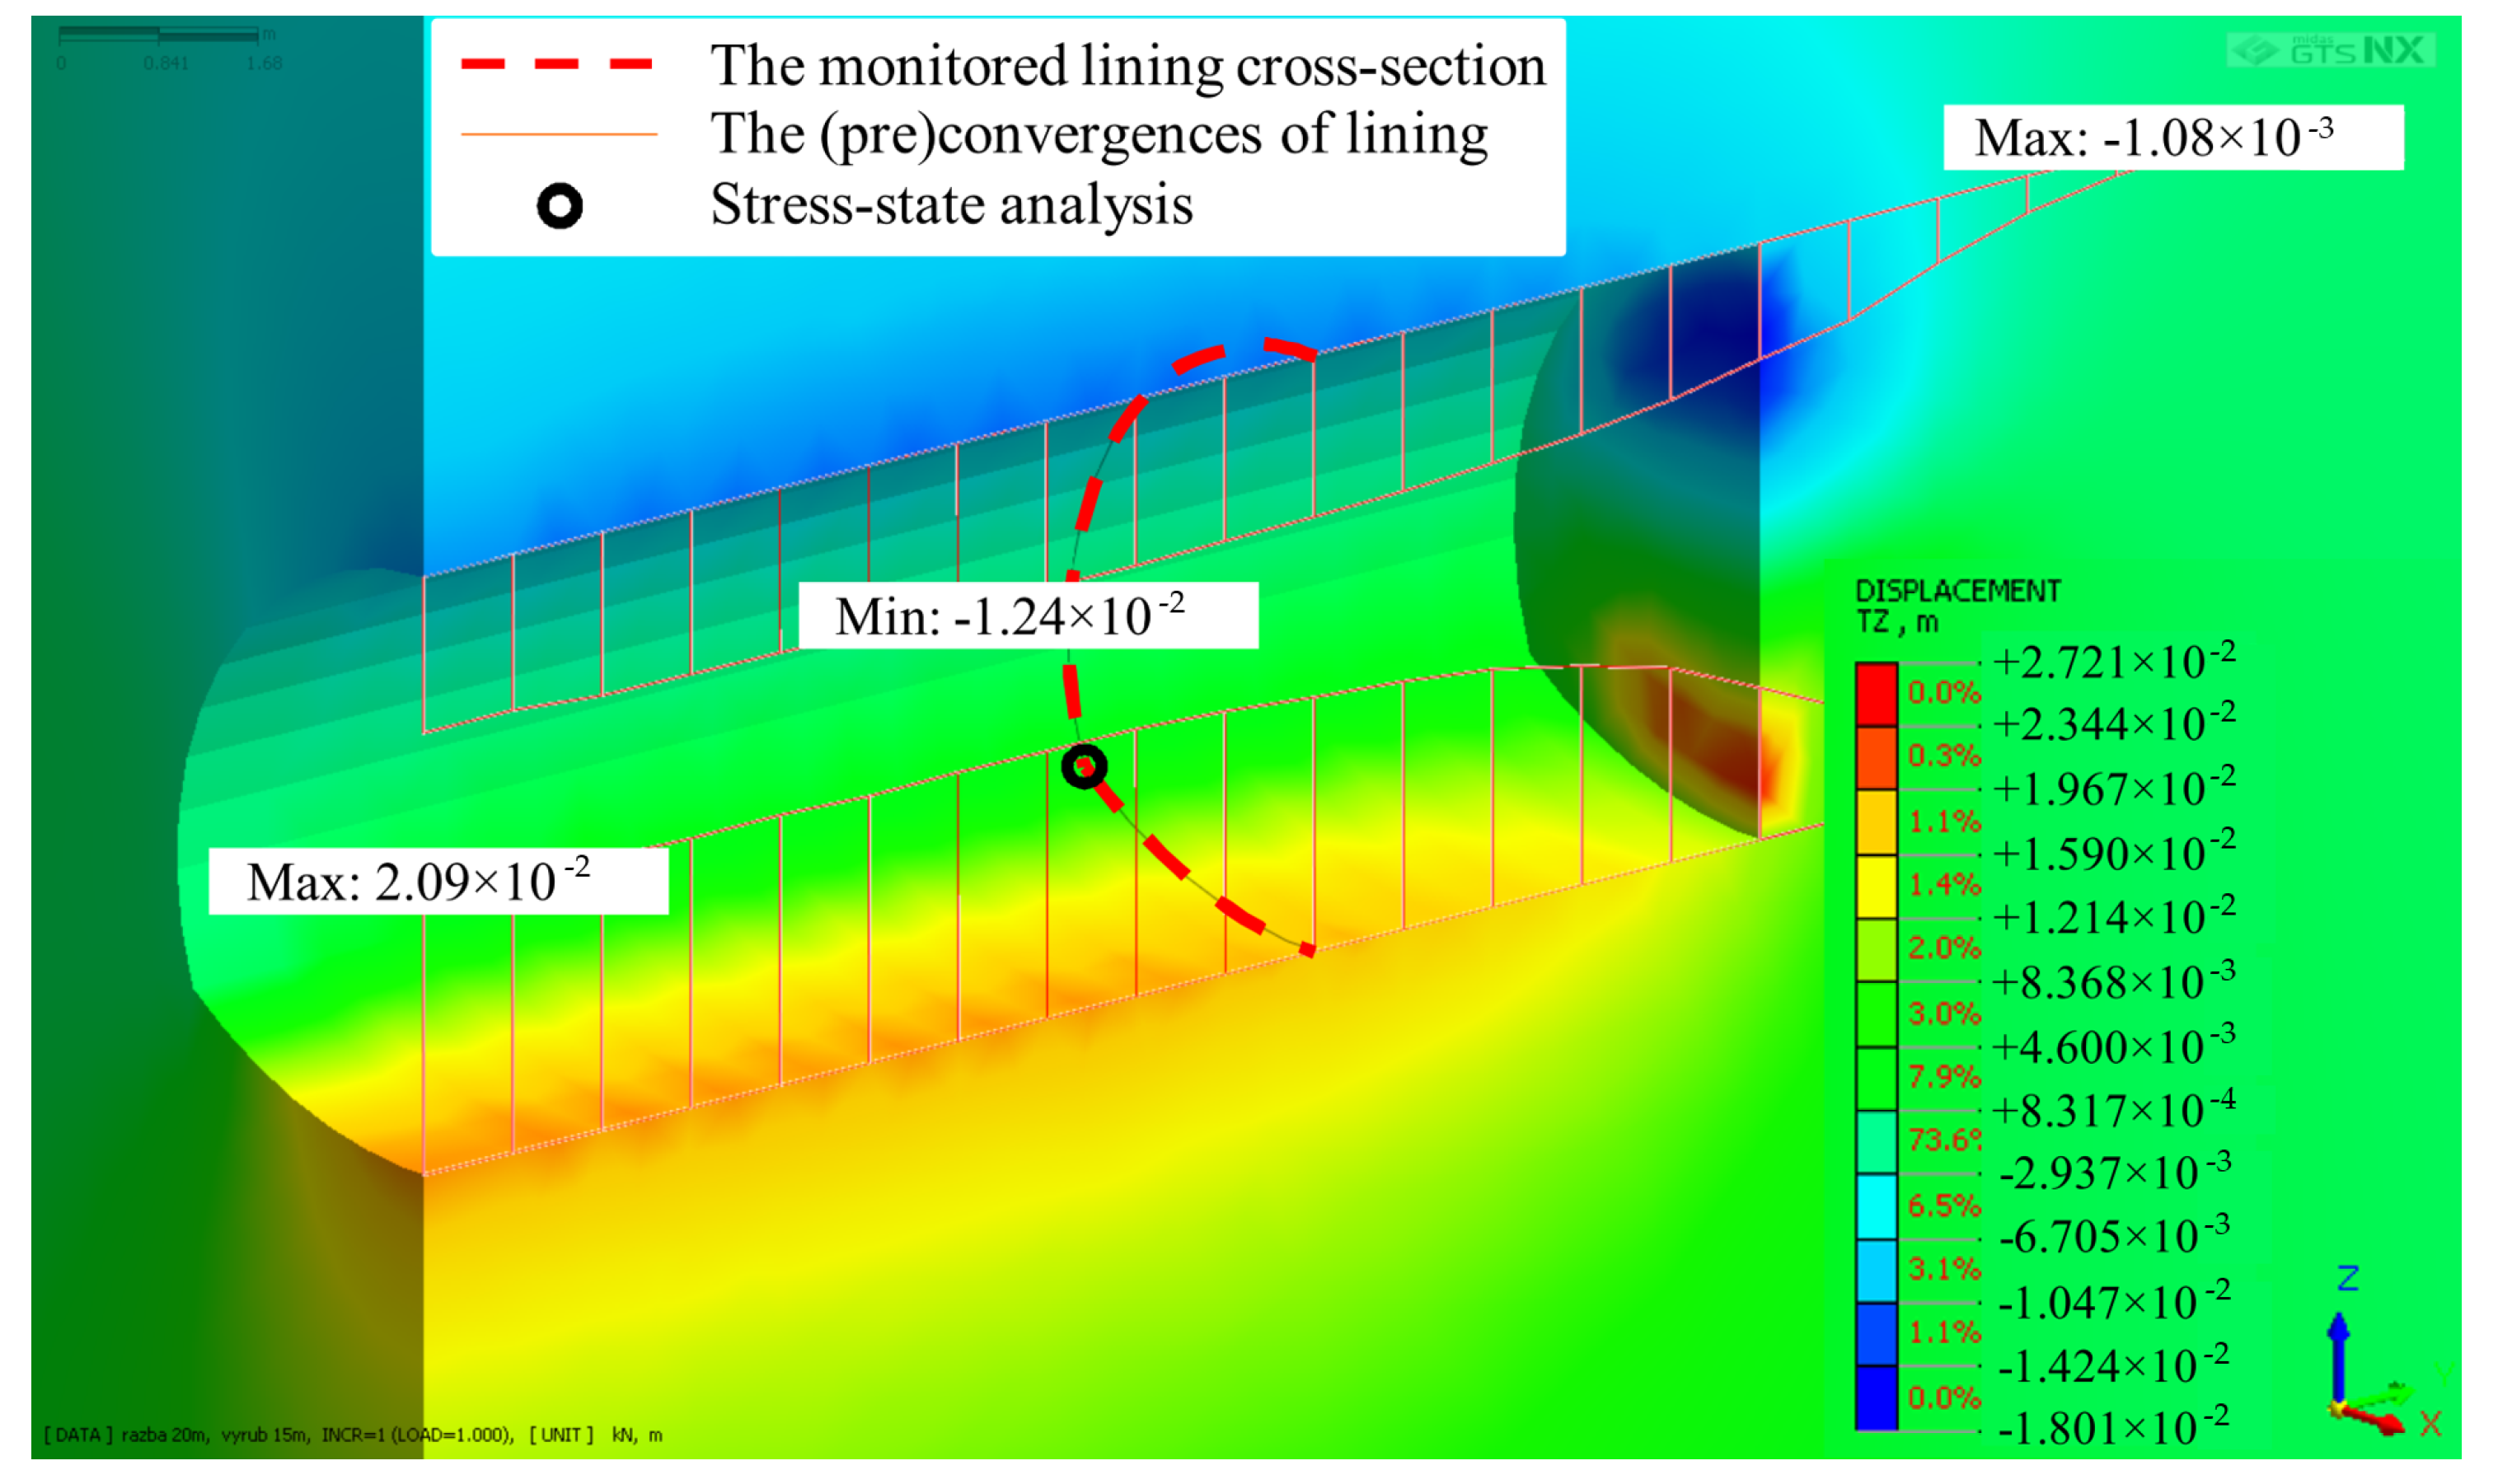
  • The primary lining was modelled using a shell. Reinforcement grids were included in the calculation for homogenisation of the heterogeneous structure of the lining. Arch frames were modelled using a “beam” element.
  • The primary lining was modelled using a shell. Arch frames (triangular lattice girder) and steel grids were included in the calculation for homogenisation of the heterogeneous structure of the lining. The solution corresponds to model alternative “II” (please see Figure 5).
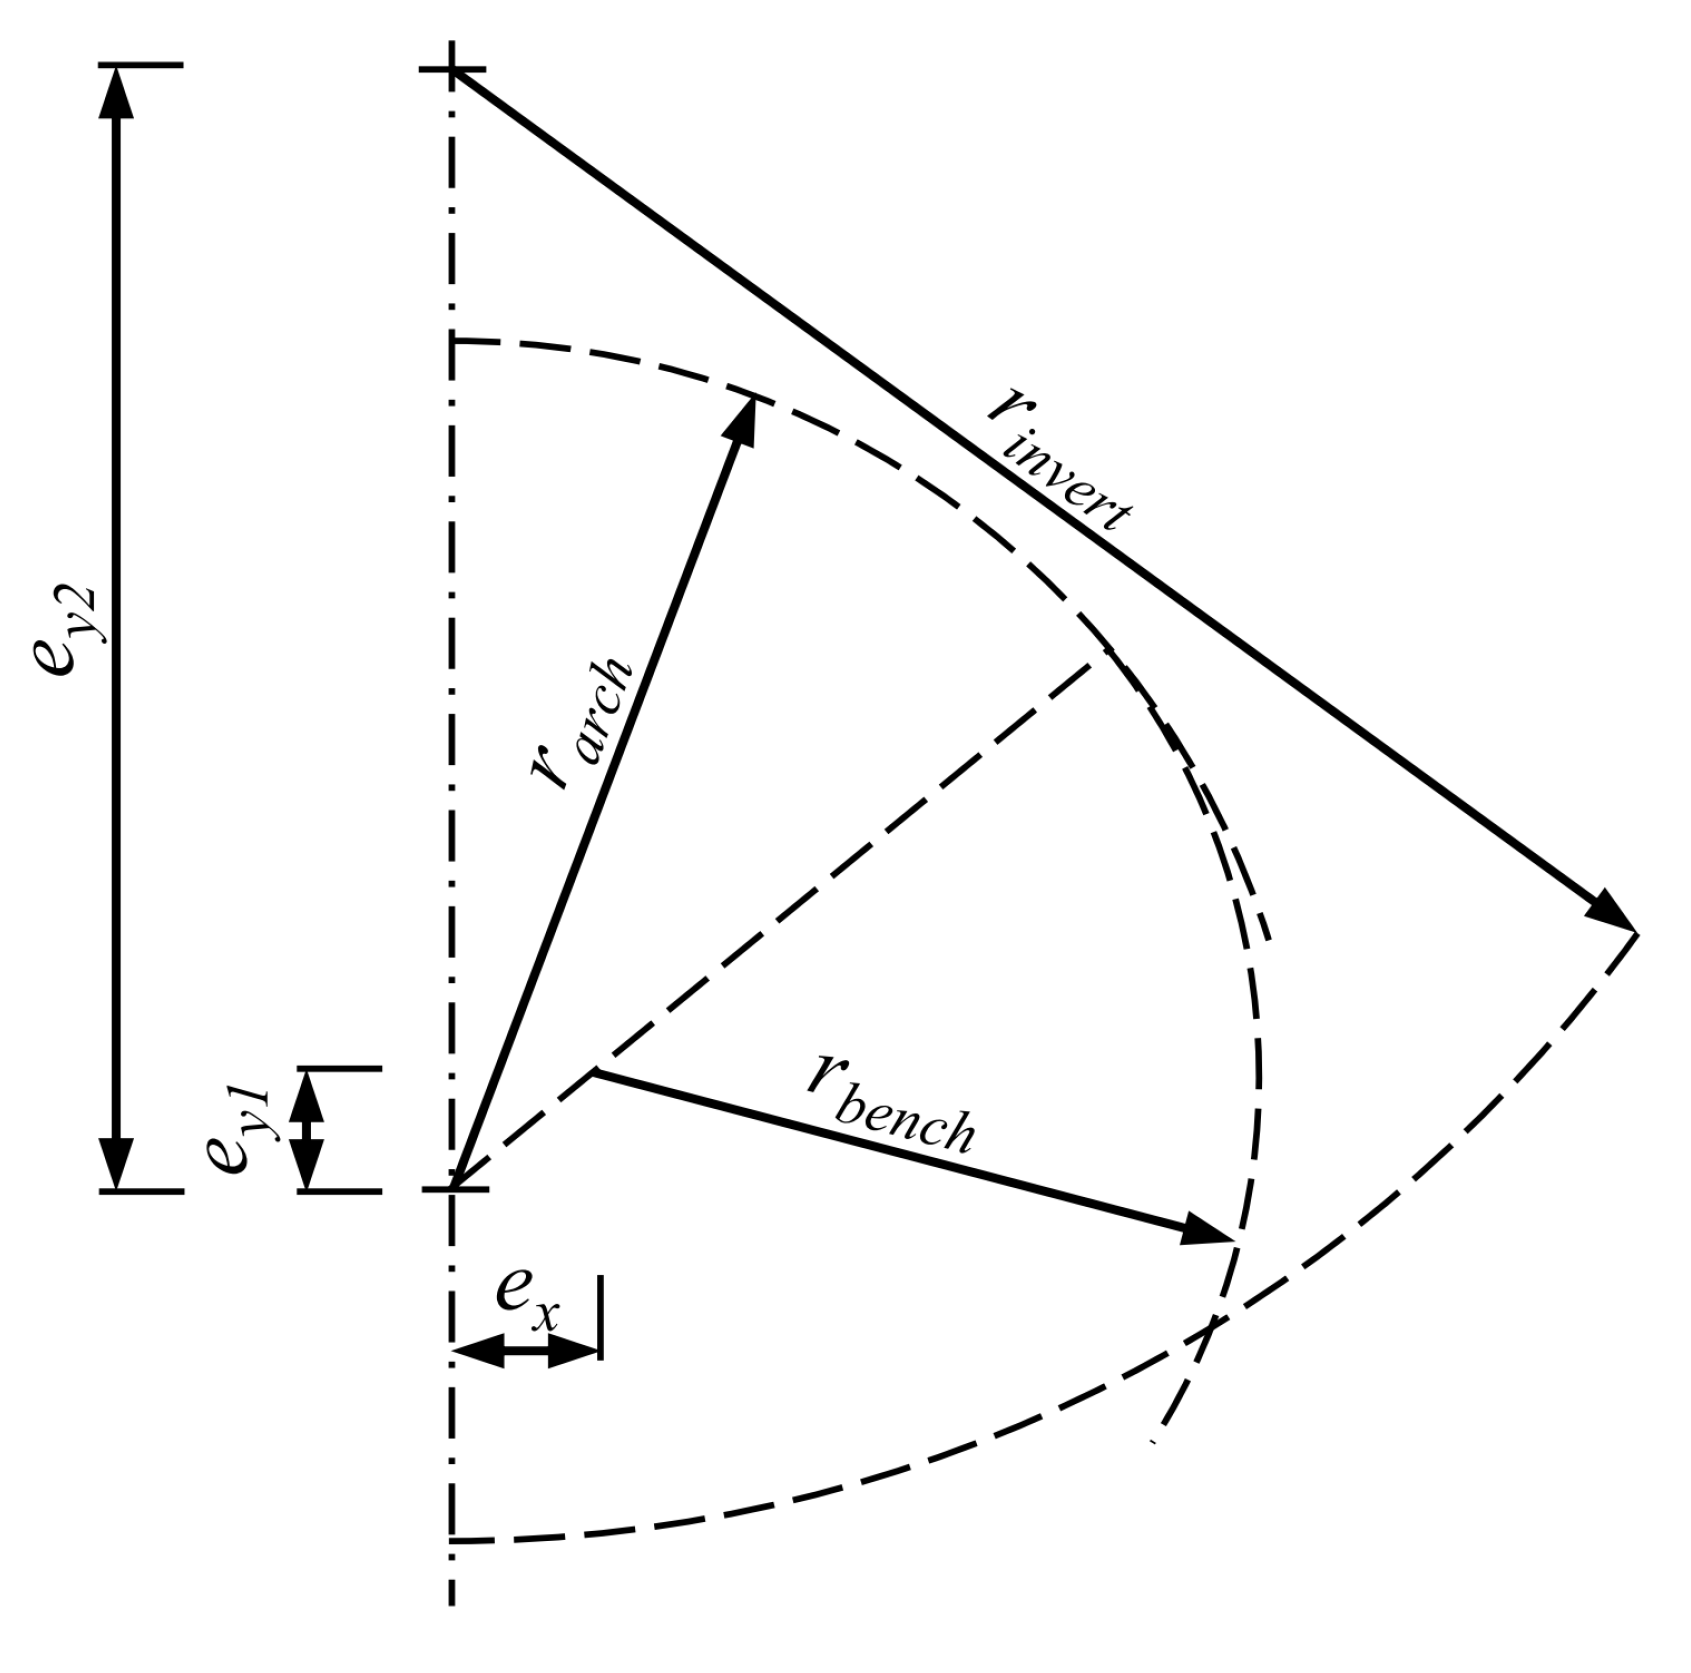
Additionally, Figure 5 shows the real longitudinal section of the primary lining. As mentioned previously, simplified sections were considered in this study. In alternatives I and II, planar “shell” and “shell and beam” elements are used in the 3D model of the lining, respectively. These elements have the advantage of simple implementation, particularly for spatial simulations of driving a tunnel. Alternative II is the simplest method for modelling the primary lining and is based on the most frequently used methods for modelling the lining in 2D and 3D analyses [5,22,31].
A reference spatial model with dimensions of 60 × 60 m 2 , a width of 30 m and 118,809 elements (21,226 nodes) was created using the Midas NX software. A tunnel with a cross-section consisting of circular arches was situated in the middle of the model. The top of the ceiling was at a depth of approximately 25.8 m. The geometric parameters of the lining cross-section (Figure 6) were as follows:
  • radius of the tunnel arch: r a r c h = 3.40 m;
  • radius of the tunnel bench: r b e n c h = 2.65 m;
  • radius of the tunnel invert: r i n v e r t = 6.55 m;
  • eccentricities of the arches: e x = 0.55 m; e y 1 = 0.51 m; e y 2 = 5.00 m.
The load on primary lining was determined by the deformation and structural strength parameters of the rock mass, which were characterised by the Mohr–Coulomb constitutive model:
  • bulk density of mass γ m = 21 kN/ m 3 ; elastic modulus E m = 100 MPa; v m = 0.3; angle of internal friction Φ = 28 ; cohesion c = 30 kPa; angle of dilation Ψ = 0 .
The tunnel was reinforced with a primary lining of thickness d = 0.2 m. The analysis included ASTA 70 (triangular lattice girder with following transversal geometry: diameter D 1 = 32 mm; D 2 = 22 mm; H = 124 mm) with an axial distance of 1 m and a reinforcement grid of 6 × 100 mm at the face and back sides and a cover of 30 mm in the lining.
The components of the primary lining were selected with the following descriptive and deformation parameters:
  • steel (density of steel γ = 78.5 kN/ m 3 ; elastic modulus E s = 210 GPa; Poisson’s ratio v s = 0.2);
  • shotcrete (density of concrete γ c = 25 kN/ m 3 , elastic modulus as function of time E c = f(t) (MPa), Poisson’s ratio of concrete v c = 0.2);
  • constitutive model: linearly elastic.
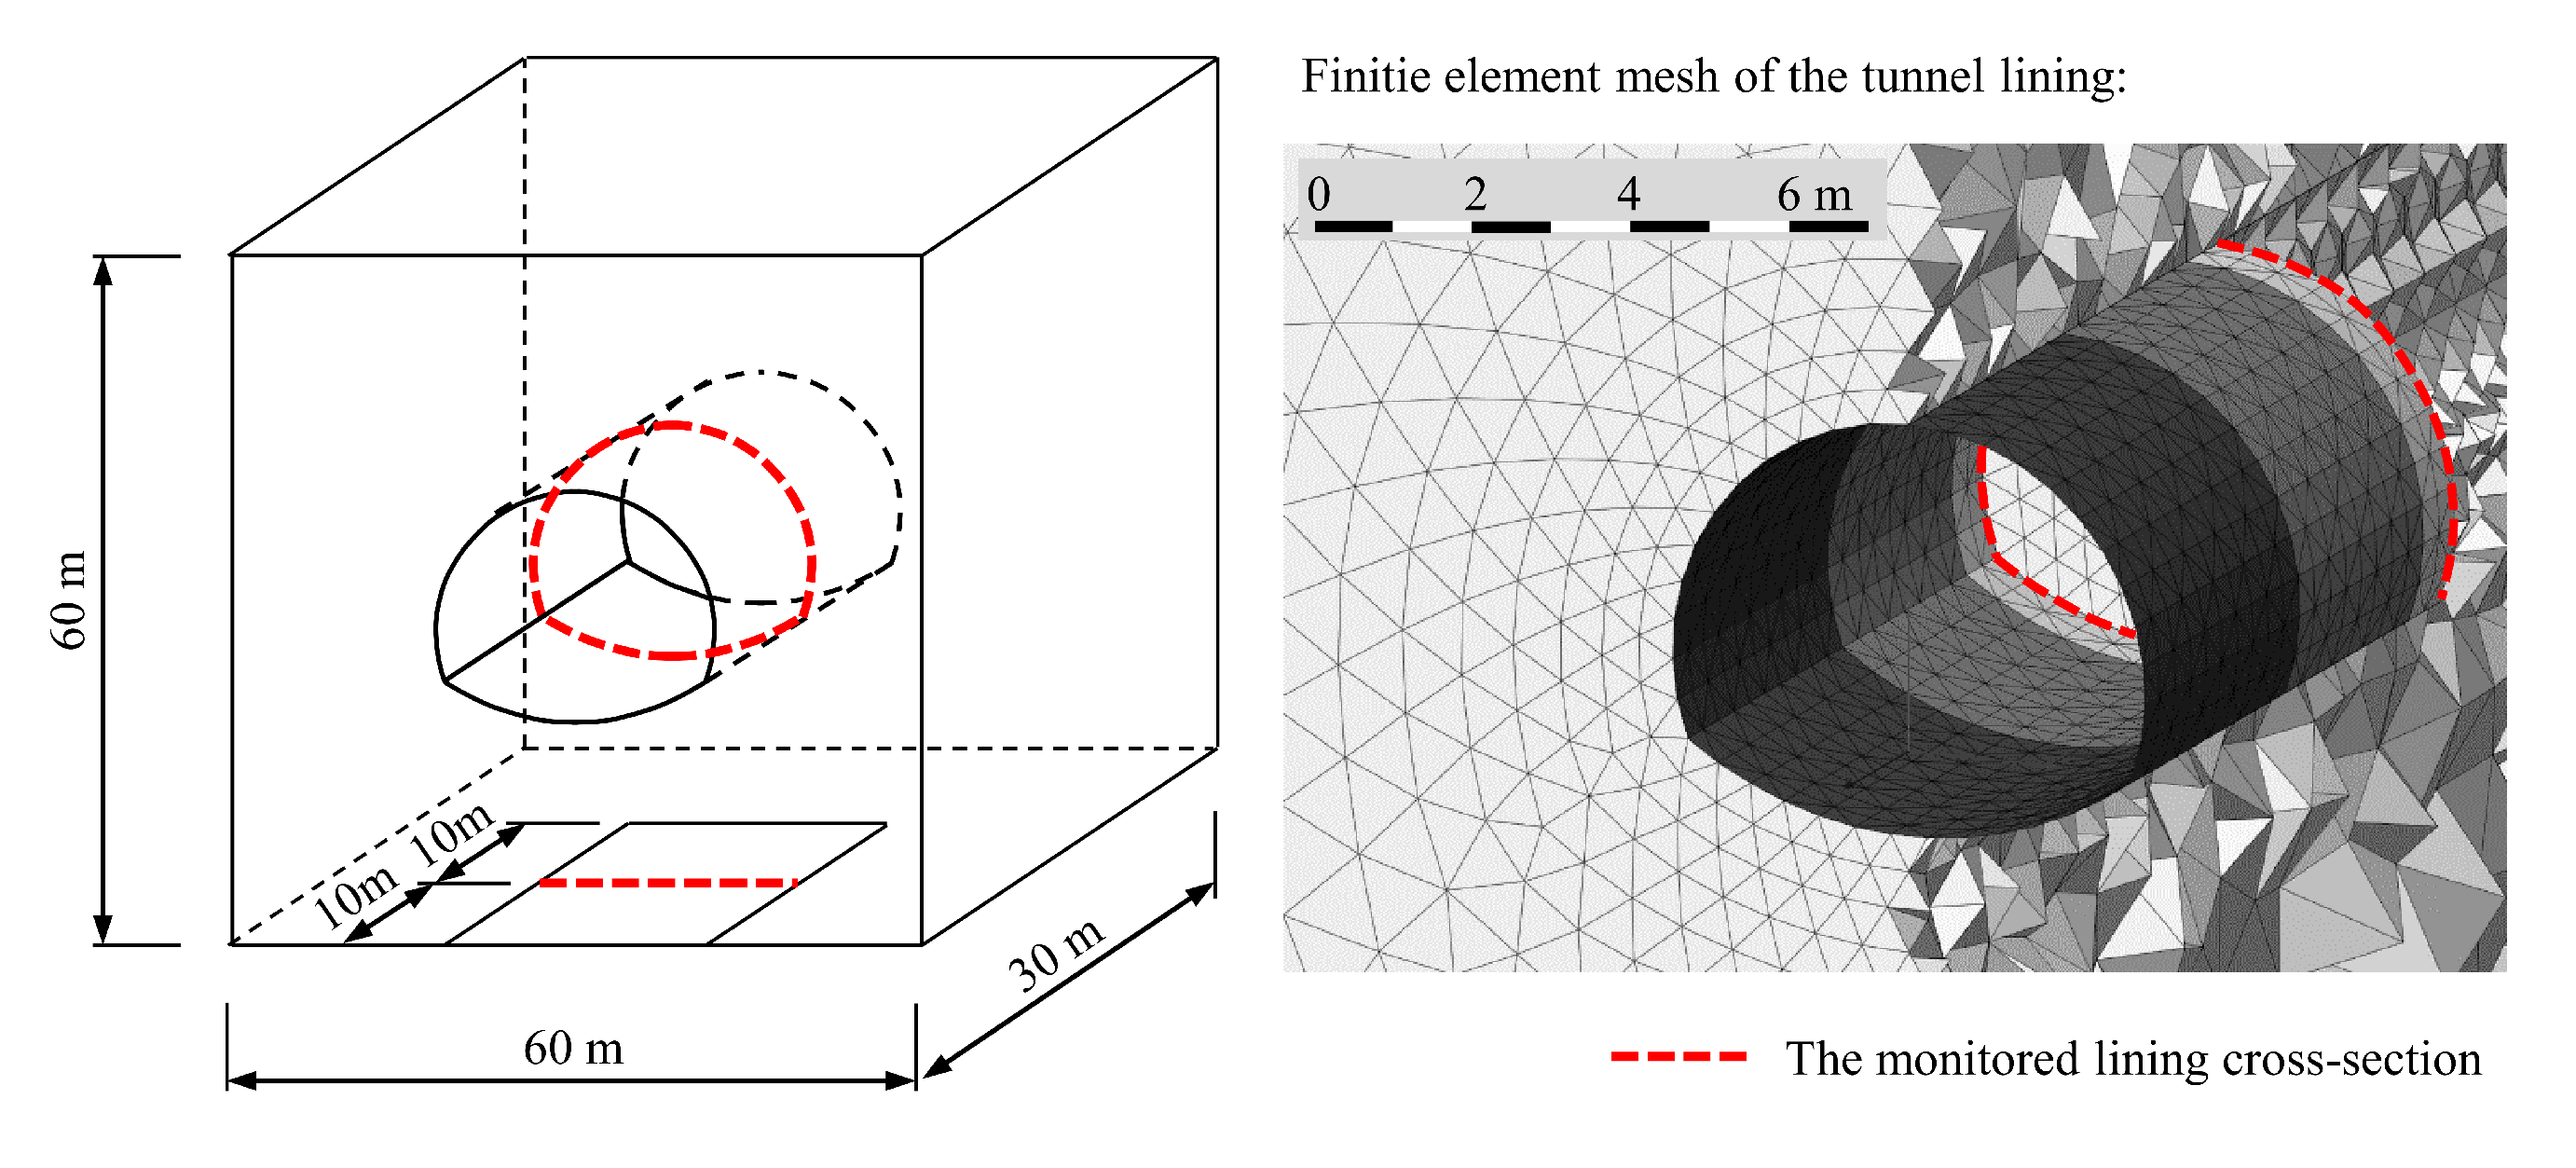
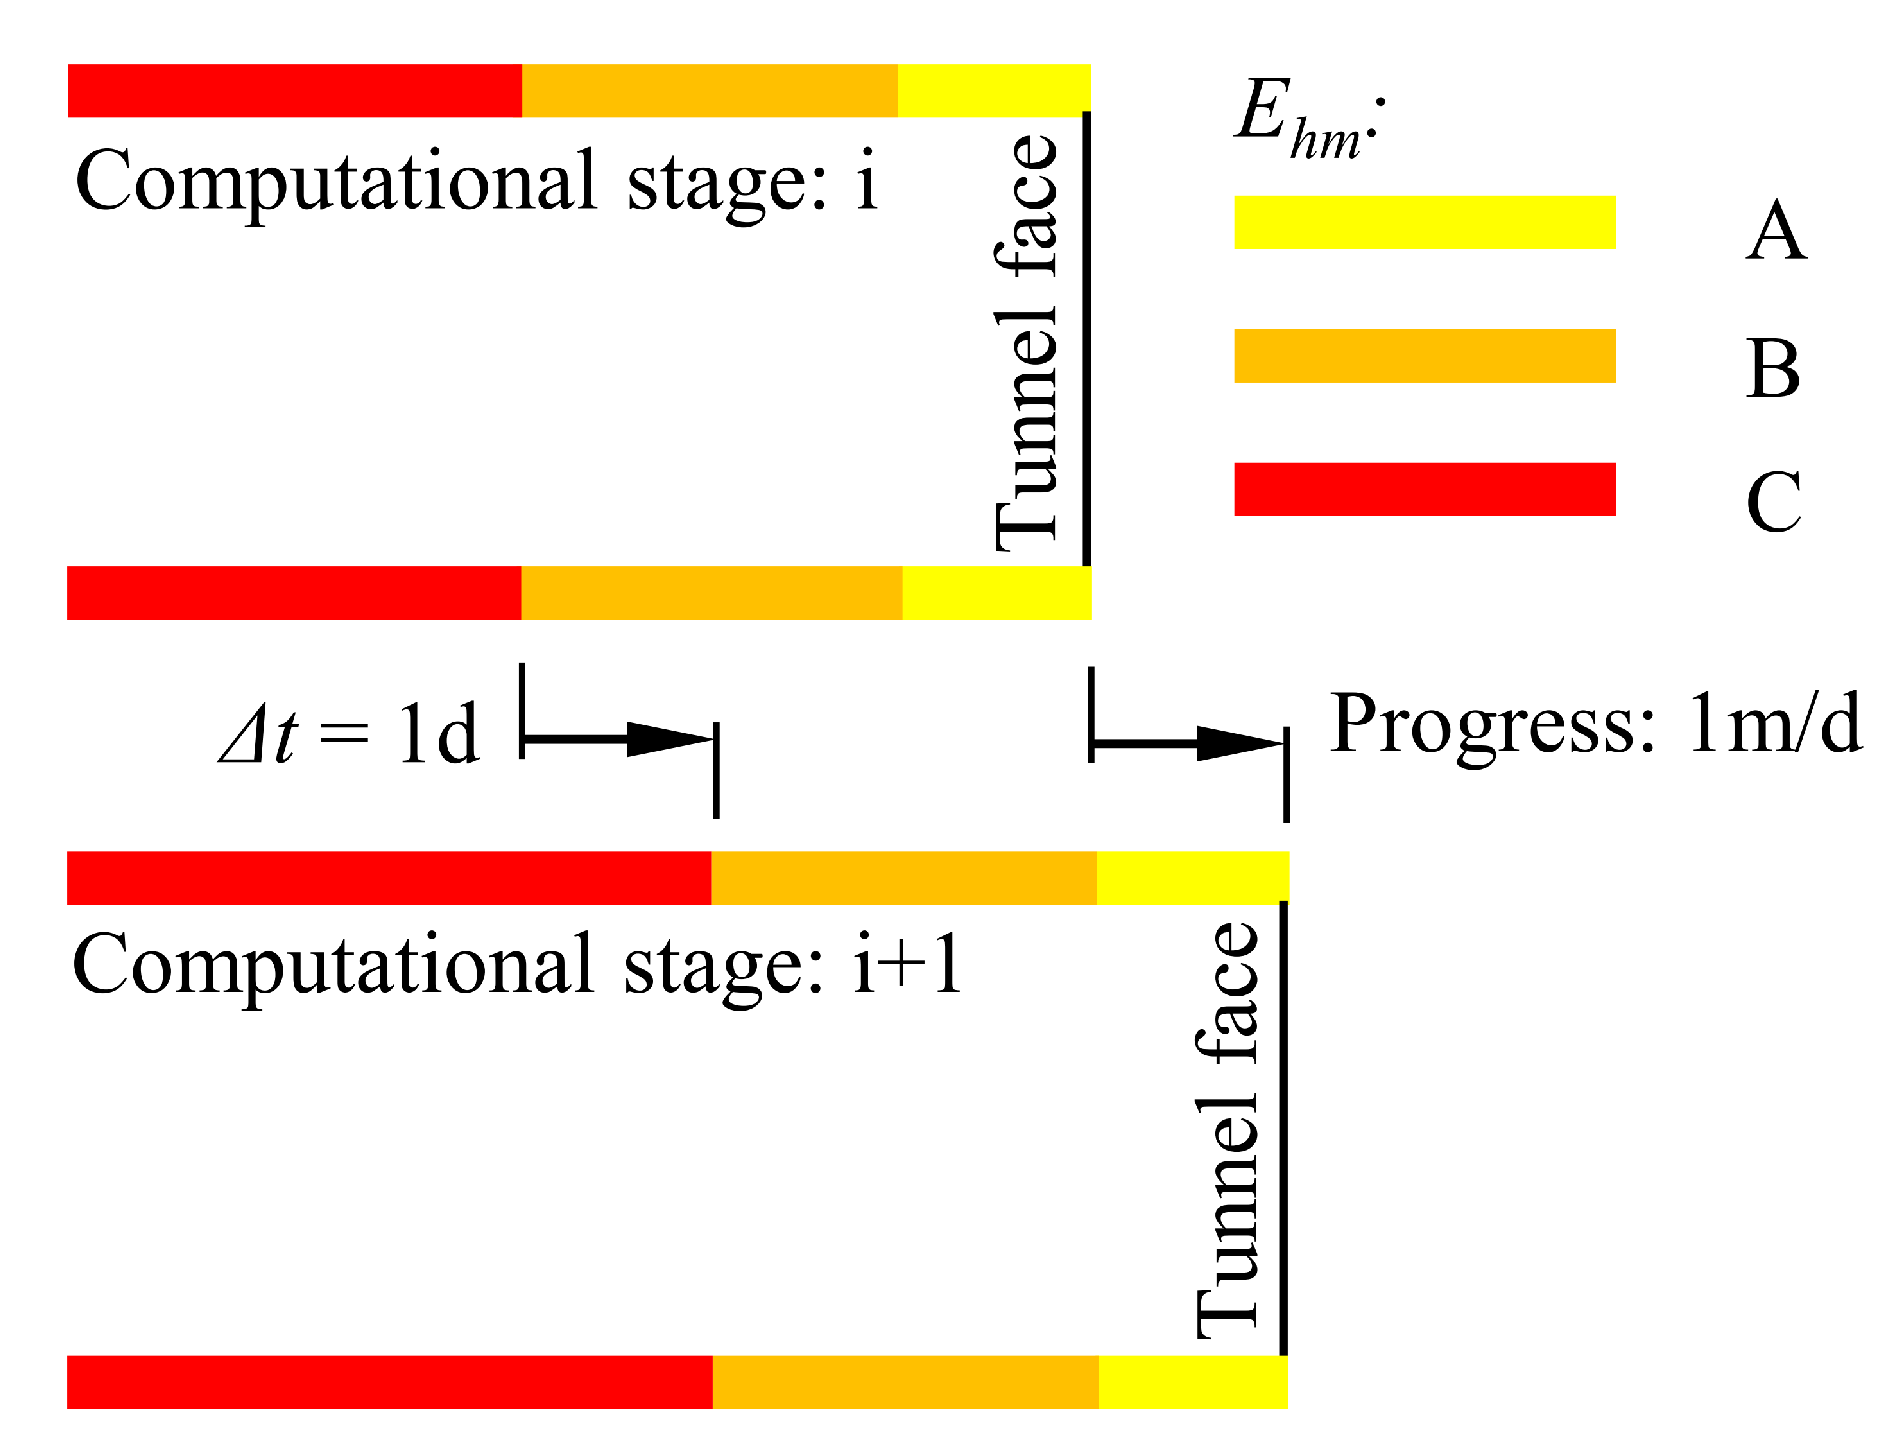
Typical boundary conditions were selected, i.e., horizontal shifts perpendicular to the relevant planes were limited to the boundary of the model, while the bottom of the model had limited vertical and horizontal shifts in both directions.
The numerical model demonstrates cyclic implementation of the primary lining. A reference “pseudo-time” of 1 d, during which the driving progress was considered as 1 m/d, i.e., individual increases in the stiffness of the primary lining of the evaluated construction stages observed this assumption. All the construction stages of the lining were adjusted to the selected time periods, particularly the development of the time-dependent parameters of the shotcrete. According to the principles of the NATM, the primary lining was applied shortly after creating a partial burden. It was impossible to capture the influence of the time factor in the lining’s defined scale of time-dependent parameters (1 d) or the progress of 1 m/day in the numerical model.
In total, 20 stages of calculation were performed, representing a distance of 20 m from the tunnel’s face to the boundary of the numerical model. The monitored lining cross-section was 10 m from the boundary of the model. The driving of 10 m was therefore reflected in the assessment of the lining and the monitoring of the stress development in the selected lining cross-section (Figure 7).
The elastic modulus of the shotcrete E c was measured via a laboratory test before the deformation parameters of the primary lining were determined for the calculation stages (Table 1).
According to a regression analysis, the development of the elastic modulus is described by the function
E c ( t ) = 14.022 · t 0.107 ( GPa )
where t represents the age of the concrete (d). The coefficient of determination of the function is R 2 = 0.98.
To increase the objectivity of the regression analysis, the condition of E c = 0 MPa was considered at t = 0 d. The function is used only for timeslots ranging from t = 0 d to t = 28 d; after 28 d, a constant value of the elastic modulus ( E c = 20.31 GPa) is considered.
The development time axis was divided into three intervals A, B and C, which were assigned a representative average value of the elastic modulus of shotcrete in the given solidification stage (Figure 8). The representative value of shotcrete E c _ A , B , C corresponding to construction stages A, B and C was determined as the arithmetic average of discrete E c values divided by the time axis by 0.1 d in the set time interval of the relevant stage, as follows:
E c _ A , B , C = T · Σ E c _ t Δ t ,
where E c _ A , B , C represents the average elastic modulus of the shotcrete in stages A, B and C (GPa), and E c _ t represents the elastic modulus of the shotcrete (GPa) at time t according to Formula (1). Δ t represents the duration (d) of the stage (A, B or C), and T represents the fineness of the division of the time axis (d), which was 0.1 d in this study.
When this relationship is applied, the elastic modulus of construction stage A, for example, can be determined as follows:
E c _ A = 0.1 · Σ 0 + 11.554 + 12.384 + . . . + 14.546 1 = 0.1 · 115.58 1 = 11.558 GPa
To capture the development of the elastic modulus of shotcrete in further detail, more construction stages can be used in the numerical model, but at the expense of a more articulate numerical model and the need to use more calculation stages. The method for setting the elastic modulus of shotcrete E c is shown graphically in Figure 8.
Table 2 presents the elastic modulus of the shotcrete and resulting modules of the homogenised cross-section for the calculation stages. The heterogeneous structure of the lining was subsequently homogenised using the software Homogenisation. The input parameters and results are presented in Table 2, including the inputs and outputs of the homogenisation process for individual construction stages can be found.
Figure 9 presents the construction stages in the numerical model. The figure clearly shows the gradual increase in the elastic modulus of the homogenised lining Ehm, which was due to shotcrete solidification.
Alternative II using steel arches and reinforcement grids in cross-section homogenisation exhibited identical (variation of <1%) internal forces to Alternative I, in which the reinforcement elements were modelled with “beam” elements and reinforcement grids were only considered in the cross-section homogenisation.
Thus, the procedure allowing the numerical model to be simplified via homogenisation of the lining provides sufficiently reliable results for application in practice. Potential differences between the results of the model and monitoring are caused by an individual modelling approach (the selection of the constitutive relationship, etc.) and often also by errors in the monitoring.
Further evaluation only focuses on model Alternative II, which uses arch frames and grids in the cross-section homogenisation. In the framework of model option II, the primary lining in the selected cross-section was evaluated in three development stages:
  • A (at 1 d);
  • B (at 5 d and a distance of 5 m from the tunnel face);
  • C (at 10 d and a distance of 10 m from the tunnel face).
Figure 10 presents an interaction diagram for the solved lining, disregarding the reinforcement arches. The reinforcement arch was only applied in the numerical model for the stiffness of the primary lining.
The results indicate that the load-bearing capacity of the lining at nodes 1, 14 and 38 was consumed (the dotted interaction diagram). These nodes were situated in places where the counter-arch connected to the sides of the lining. The reinforcement must be extended in these places with bars 12 mm in diameter and an axial distance of 150 mm, which corresponds to the dashed interaction diagram. The numerical identification of individual nodes in the primary lining is shown in Figure 11.
A certain risk is also posed by nodes 4 and 11 and those close by in the arch of the lining. The load at these nodes is almost at the limit of the load-bearing capacity of the lining. Stress concentrations arise from the transversal shape of the lining or the transition of its benches to the invert. This can be resolved by using a more suitable transversal shape of the lining or via rounding at the transition locations.
This paper would be complete with regard to assessing the primary lining according to EC7 [14] and EC2 [25]. Although the assessment was not performed for all stages of shotcrete curing (particularly up to 28 d), this approach is presented in an exhaustive manner. Additional steps emulate previous steps depending on the number of construction stages of the lining (shotcrete curing), the driving technology (division of the tunnel face, length of burdens, etc.) and the level of simplification applied to the numerical model. Figure 12 depicts the vertical deformations in the numerical model corresponding to construction stage B. The distance between the tunnel face and the cross-section of interest (dotted red line) of the lining was 5 m. Thus, the distance between the tunnel face and the model edge was 15 m. The red continuous line represents the excavation convergence, i.e., pre-convergence in the section before the tunnel face.
The development of the stress conditions in the selected cross-section and the critical stress values were analysed in detail. According to Figure 11, the relevant nodes were 1, 14 and 38. The cross-section of interest was 10 m from the boundary of the numerical model between the driving-progress values of 10 and 11 m.
Table 3 presents the obtained results for the tangential stress in the selected cross-section of the lining. The specified stresses in the outer fibres correspond to the inner forces of the relevant stage. Figure 13 presents the influence area of tangential stress development at points 1 = 38 and 14 (see Figure 9) depending on the excavation course, i.e., with the increasing distance between the evaluated lining cross-section and the receding excavation face. The evaluated lining cross-section was 10 m from the model edge (see Figure 5).
Figure 14 presents the stress in the vault at stage C, i.e., the condition where the face excavation is 10 m from the section of interest. The stress course in the homogenised cross-section of the primary lining is shown, as well as the stresses in individual elements of the lining: steel and concrete. The stress values for individual lining elements were obtained via application of the redistributing coefficients a 1 and a 2 to the stress over the homogenised cross-section. The homogenisation process, including the determination and application of the redistributing coefficients, is described in detail in the previous papers [35,36,37].
This chapter introduced a new alternative approach to solve a spatial numerical model of tunnel driving for assessing the primary lining. The solution allows the time-dependent parameters of the primary lining and the presence of steel reinforcement arches to be considered, which would otherwise need to be completely neglected or modelled using independent elements at the expense of a more complex numerical model. When creating the model, the “real” stiffness of the lining and its interaction with the rock mass was considered. The assessment was performed in a standard manner according to EC2 [25] by compiling an interaction diagram and comparing it with the cross-section load. In the compilation of the interaction diagram, the reinforcement arches were not considered, as they did not satisfy the conditions for reinforced-concrete structures.

5. Discussion

A new approach for the numerical modelling of tunnel constructions at a level sufficient for practical application was proposed. In this regard, the research dealing with the method of cooperation rings has been almost finished.
However, the problems in numerical modelling of the tunnel construction are comprehensive and require further attention in the following areas:
  • the possibilities of staging the progress of driving a tunnel using the “construction stages” and agreement with the modelled master. The driving stages are highly approximated (as in practice), and depend on time factors, with the primary lining being applied after driving, and another section then being excavated at the length of burden. During this relatively short time, radial deformations occur only partially (deformation load) and can only be stabilised several driving cycles later. These radial deformations depend on not only the driving progress but also the fundamental rheological behaviour of the rock mass as a response to this action. Numerical models partially disregard this information. An equilibrium state is found between the individual construction stages of a spatial numerical model that does not occur in reality. The numerical model de facto simulates the following procedure: driving, partial mobilisation of radial deformations or omission, lining implementation, stabilisation of radial deformations of the rock mass, balancing, etc.
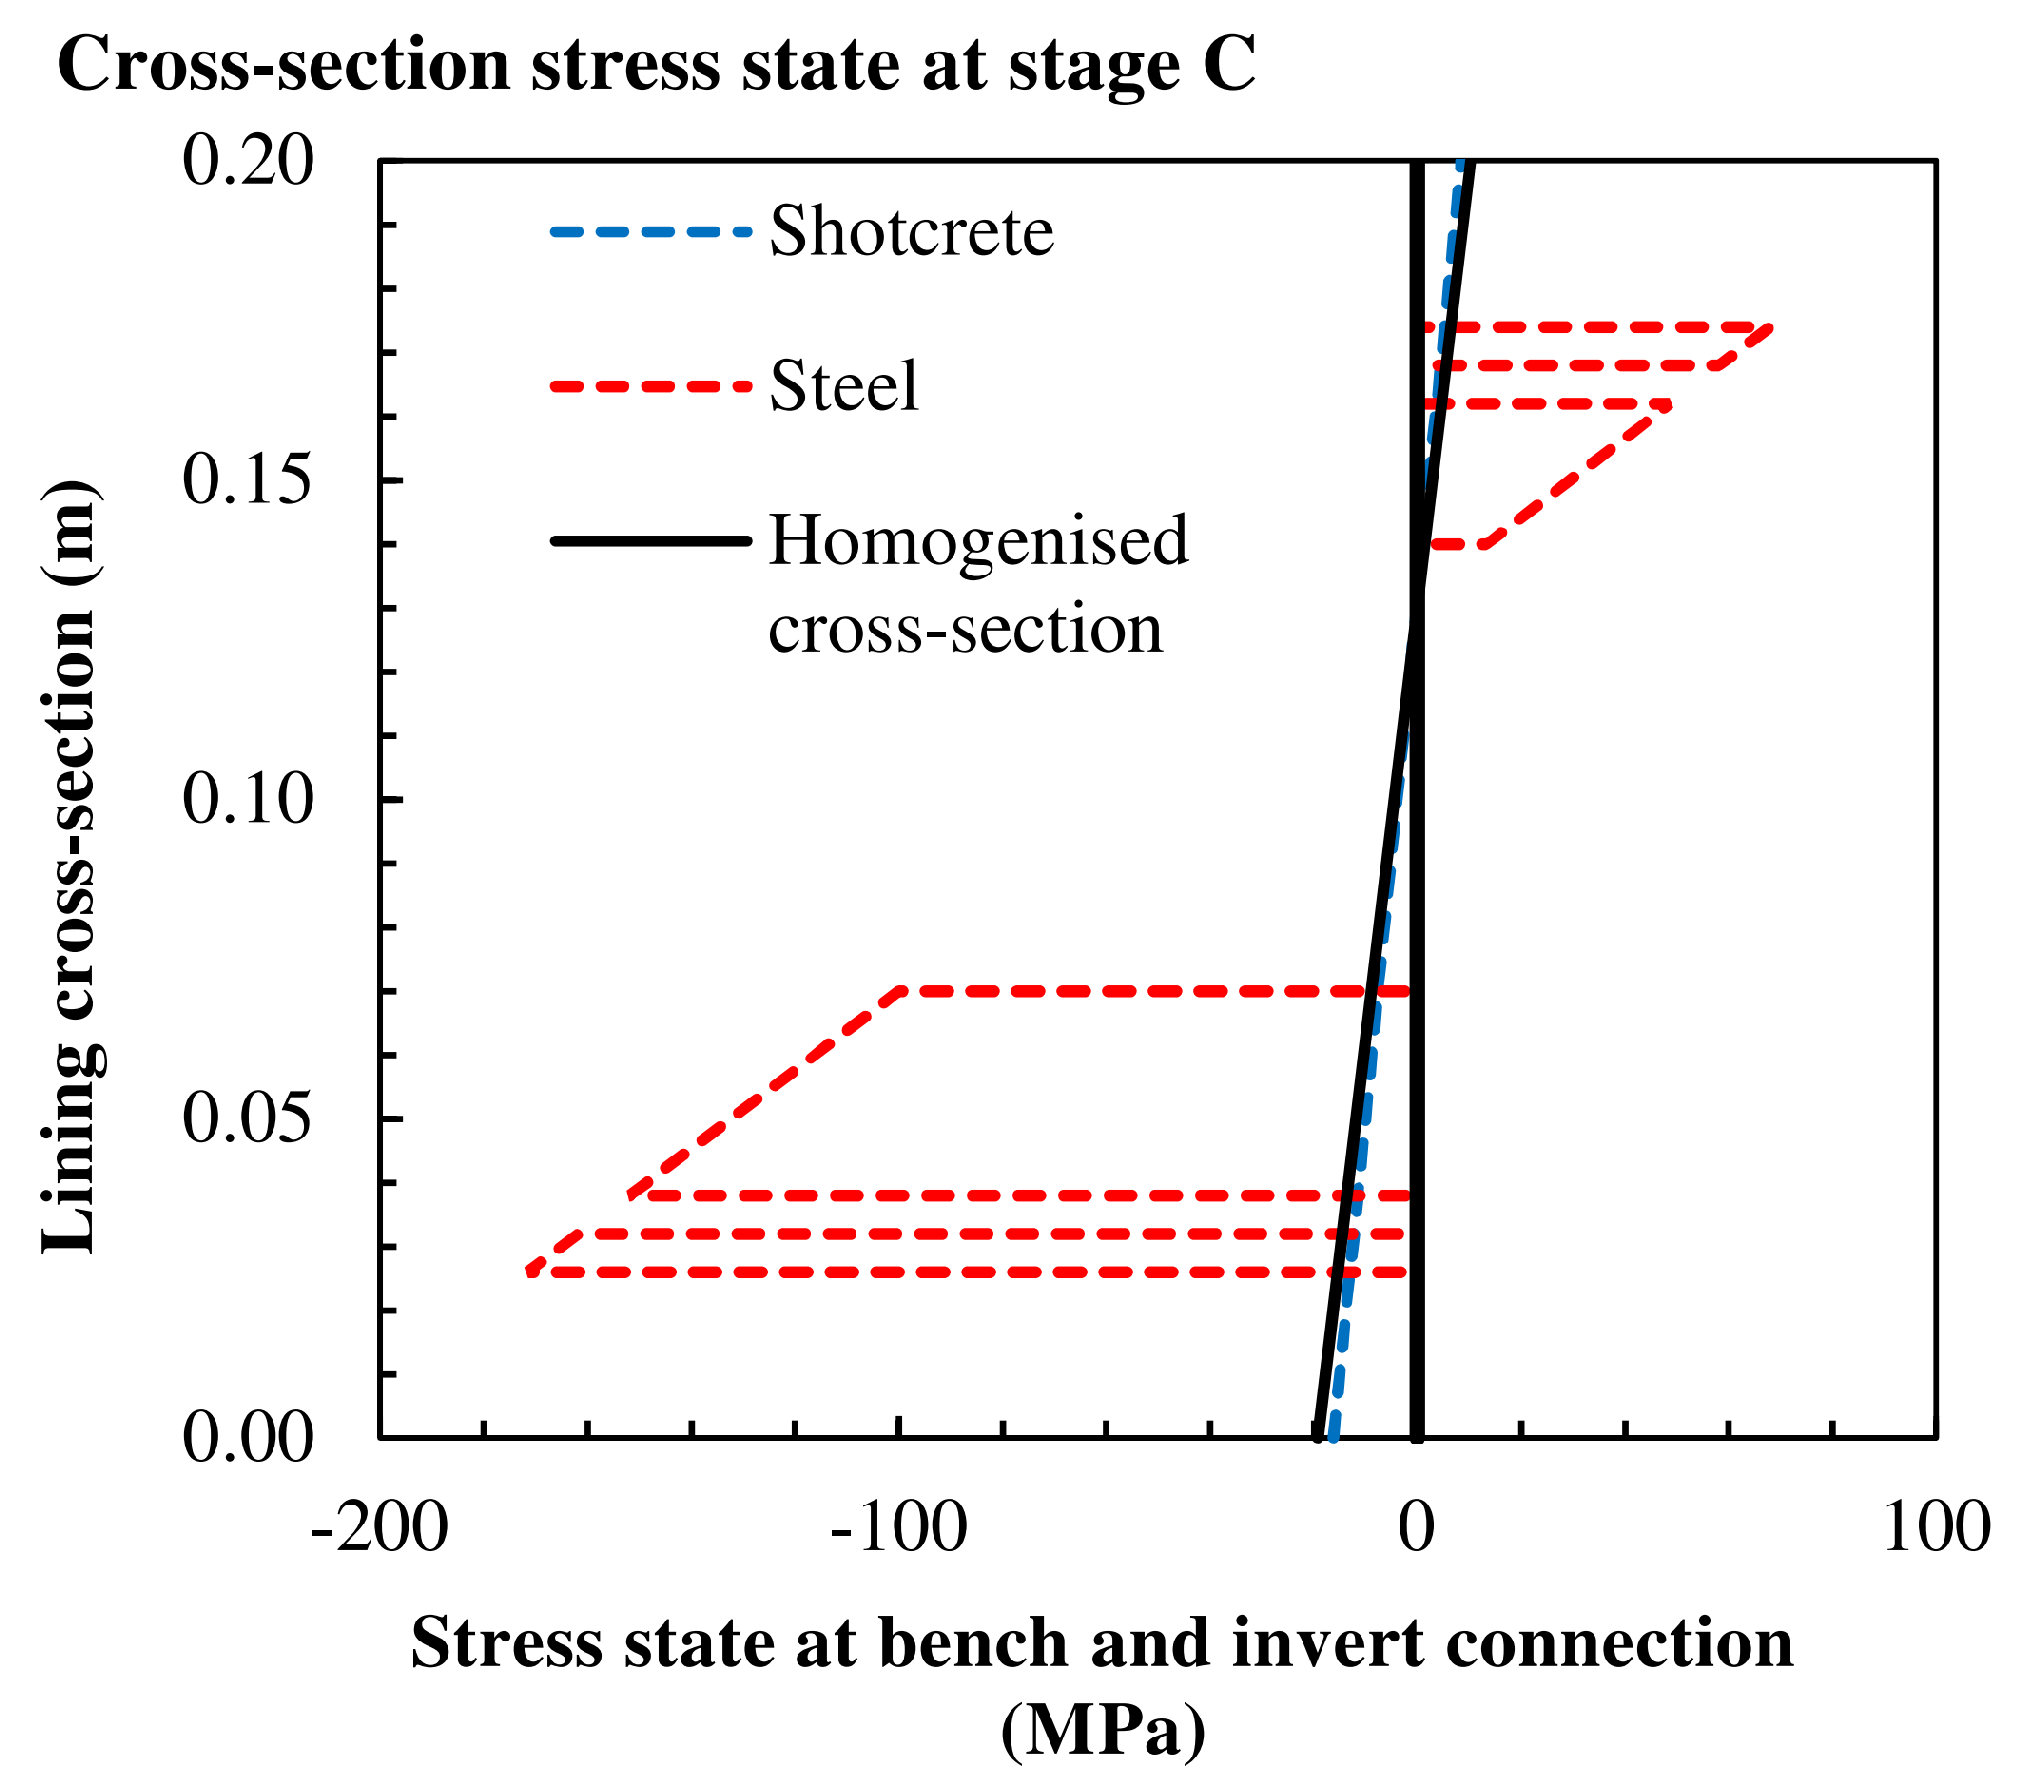
  • In contrast to the theory for reinforced concrete, calculation based on the theory for cooperation rings does not deal with tensile stresses in the cross-section caused by a large eccentricity in the load. While a tensile stress is excluded from operation in the theory of reinforced concrete, this is not the case in the theory for cooperation rings. When interpreting the results, it is possible to accept an alternative for tensile crack occurrence in concrete and the stress redistribution to steel elements, which have a high reserve of load-bearing capacity in this case. The stated conclusion is acceptable according to the principles of the NATM, where the primary lining forms a significant, but temporary structure.
  • The method of cooperation rings, based on which the Homogenisation software application was implemented, is designate for circular cross-section tunnel profiles. However, a comparison between Alternatives I and II revealed a difference of <1% in the internal forces, indicating that this software/method can be used even for generally non-circular profiles. In other studies involving a critical analysis of the stresses in individual elements of the lining, i.e., steel and concrete, the difference in the application of the Homogenisation software was more significant [39]. In particular, the most problematic point was where the counter-arch connected to the sides of the lining, i.e., the point where the curve radii changed. The stress in the steel differed by 23% in comparison with the 3D model, whereas the differences for the stress in the concrete were small, not exceeding 1%.

6. Conclusions

The initial chapters of the paper summarised the general knowledge and state-of-the-art of reinforcement in tunnels driven according to the NATM and explained the importance of the primary lining. The development of the time-dependent parameters of the most important component with regard to the NATM, i.e., shotcrete, was analysed in detail, including a basic description of the primary lining. Additionally, a basic overview of the standardised procedures and alternative methods for creating numerical models to design and assess linings was presented.
This generally used knowledge was extended to develop an alternative approach that allows the following significant properties of the primary lining to be considered when creating numerical models:
  • heterogeneous structure of the lining, i.e., concrete and steel elements and their spatial layout in the cross-section of the lining;
  • time-dependent parameters of shotcrete.
These properties were considered in a numerical model using a new approach involving the Homogenisation software, which replaces the heterogeneous structure of the primary lining with a homogeneous structure.
Additionally, a practical application of Homogenisation software for numerical modelling and a subsequent assessment of the primary lining were presented. The model reflected the driving progress of a tunnel, the presence of steel arches and the time-dependent parameters of the shotcrete. Two models for the lining were compared, and the suitability of the Homogenisation software for this purpose was confirmed. The primary lining was assessed according to EC2 [25], and a cross-section with extreme load was subjected to a stress analysis.
A comparison of the results obtained by this study with the behaviour of a real structure would be very beneficial; however, the main intention of the authors was primarily the development and promotion of the homogenization method. The article is a theoretical study evaluating the potential of the homogenization method in the design and assessment of the primary tunnel lining.

Author Contributions

M.M. proposed the idea and edited the manuscript. M.M., K.V., E.H., M.S., J.N. and M.P. developed, tested and validated data. M.M., K.V. and E.H. wrote the manuscript. M.M. performed statistical investigation and visualization. M.M., K.V., E.H. and J.N. critically evaluated the quality of the research data and experimental methods used to generate them as well as the soundness and validity of the scientific and engineering techniques and performed its final edits. All authors have read and agreed to the published version of the manuscript.

Funding

This study was founded by conceptual and specific research development at VSB—Technical University of Ostrava in 2019 and 2020 provided by the Ministry of Education, Youth and Sports of the Czech Republic and also by the project No. SP2020/156.

Conflicts of Interest

The authors declare no conflict of interest.

References

  1. von Rabcewicz, L.; Golser, J. Principles of dimensioning the supporting system for the “new austrian tunnelling method”. Water Power 1973, 25, 88–93. [Google Scholar]
  2. von Rabcewicz, L.; Golser, J. Application of the natm to the undergound works at tarbela. part 1. Water Power 1974, 26, 314–321. [Google Scholar]
  3. Fenner, R. Untersuchungen zur erkenntnis des gebirgsdrucks; Gluckauf: Essen, Germany, 1938. [Google Scholar]
  4. Oreste, P.P. A Procedure for Determining the Reaction Curve of Shotcrete Lining Considering Transient Conditions. Rock Mech. Rock Eng. 2003, 36, 209–236. [Google Scholar] [CrossRef]
  5. Vermeer, P.A.; Moeller, S.C. On design analyses of NATM-tunnels. In Underground Space Use. Analysis of the Past and Lessons for the Future; Taylor & Francis Group: Boca Raton, FL, USA, 2005. [Google Scholar] [CrossRef]
  6. El-Nahhas, F.; El-Kadi, F.; Ahmed, A. Interaction of tunnel linings and soft ground. Tunn. Undergr. Space Technol. 1992, 7, 33–43. [Google Scholar] [CrossRef]
  7. Behnen, G.; Nevrly, T.; Fischer, O. Soil-structure interaction in tunnel lining analyses. Geotechnik 2015, 38, 96–106. [Google Scholar] [CrossRef]
  8. Kroetz, H.M.; Do, N.A.; Dias, D.; Beck, A.T. Reliability of tunnel lining design using the Hyperstatic Reaction Method. Tunn. Undergr. Space Technol. 2018, 77, 59–67. [Google Scholar] [CrossRef]
  9. Svoboda, T.; Mašín, D. Convergence-confinement method for simulating NATM tunnels evaluated by comparison with full 3D simulations. In Proceedings of the International Conference Underground Construction, Prague, Czech Republic, 14–16 June 2010; pp. 795–801. [Google Scholar]
  10. Karakus, M. Appraising the methods accounting for 3D tunnelling effects in 2D plane strain FE analysis. Tunn. Undergr. Space Technol. 2007, 22, 47–56. [Google Scholar] [CrossRef]
  11. Zhou, C.; Lu, Y.; Liu, Z.; Zhang, L. An Innovative Acousto-optic-Sensing-Based Triaxial Testing System for Rocks. Rock Mech. Rock Eng. 2019, 52, 3305–3321. [Google Scholar] [CrossRef]
  12. Liu, Z.; Zhou, C.; Li, B.; Zhang, L.; Liang, Y. Effects of grain dissolution–diffusion sliding and hydro-mechanical interaction on the creep deformation of soft rocks. Acta Geotech. 2019, 15, 1219–1229. [Google Scholar] [CrossRef]
  13. Oreste, P. Analysis of structural interaction in tunnels using the covergence–confinement approach. Tunn. Undergr. Space Technol. 2003, 18, 347–363. [Google Scholar] [CrossRef]
  14. European-standard. CSN EN 1997-1 (731000) EuroCode 7: Geotechnical Design – Part 1: General Rules; Technical Report ICS 91.010.30; 93.020; ÚNMZ: Prague, Czech Republic, 2006. [Google Scholar]
  15. Liu, Z.; Zhou, C.; Lu, Y.; Yang, X.; Liang, Y.; Zhang, L. Application of FRP Bolts in Monitoring the Internal Force of the Rocks Surrounding a Mine-Shield Tunnel. Sensors 2018, 18, 2763. [Google Scholar] [CrossRef] [PubMed] [Green Version]
  16. Zhao, C.; Lavasan, A.A.; Barciaga, T.; Kämper, C.; Mark, P.; Schanz, T. Prediction of tunnel lining forces and deformations using analytical and numerical solutions. Tunn. Undergr. Space Technol. 2017, 64, 164–176. [Google Scholar] [CrossRef]
  17. He, W.; Xu, L.; Wang, L. 3D Numerical Simulation of Reinforced Concrete Lining’s Cracking Behavior in Tunnels. J. Eng. Sci. Technol. Rev. 2019, 12, 160–167. [Google Scholar] [CrossRef]
  18. Liu, S.; Shi, Y.; Sun, R.; Yang, J. Damage behavior and maintenance design of tunnel lining based on numerical evaluation. Eng. Fail. Anal. 2020, 109, 104209. [Google Scholar] [CrossRef]
  19. Panet, M.; Guenot, A. Analysis of Convergence Behind the Face of A Tunnel: Tunnelling 82. In Proceedings of the 3rd International Symposium, Brighton, UK, 7–11 June 1982; IMM: London, UK, 1982; pp. 197–204. [Google Scholar]
  20. Vermeer, P.A.; Moeller, S.C. On numerical simulation of tunnel installation. Tunn. Undergr. Space Technol. 2008, 23, 461–475. [Google Scholar] [CrossRef]
  21. Galli, G.; Grimaldi, A.; Leonardi, A. Three–dimensional modelling of tunnel excavation and lining. Comput. Geotech. 2004, 31, 171–183. [Google Scholar] [CrossRef]
  22. Ng, C.W.; Boonyarak, T.; Mašín, D. Three-dimensional centrifuge and numerical modeling of the interaction between perpendicularly crossing tunnels. Can. Geotech. J. 2013, 50, 935–946. [Google Scholar] [CrossRef]
  23. Svoboda, T.; Masin, D. Comparison of displacement field predicted by 2D and 3D finite element modelling of shallow NATM tunnels in clays. Geotechnik 2011, 34, 115–126. [Google Scholar] [CrossRef]
  24. Wenzheng, H.; Linsheng, X.; Lili, W. Theoretical Back Analysis of Internal Forces of Primary Support in Deep Tunnels. J. Eng. Sci. Technol. Rev. 2019, 12, 18–26. [Google Scholar] [CrossRef]
  25. European-standard. CSN EN 1992-1-1 (731201) EuroCode 2: Design of Concrete Structures—Part 1-1: General Rules and Rules for Buildings; Technical Report ICS 91.010.30; 91.080.40; ÚNMZ: Prague, Czech Republic, 2011. [Google Scholar]
  26. Carranza-Torres, C.; Diederichs, M. Mechanical analysis of circular liners with particular reference to composite supports. For example, liners consisting of shotcrete and steel sets. Tunn. Undergr. Space Technol. 2009, 24, 506–532. [Google Scholar] [CrossRef]
  27. Wong, L.N.Y.; Fang, Q.; Zhang, D. Mechanical analysis of circular tunnels supported by steel sets embedded in primary linings. Tunn. Undergr. Space Technol. 2013, 37, 80–88. [Google Scholar] [CrossRef]
  28. Sugimoto, M.; Chen, J.; Sramoon, A. Frame structure analysis model of tunnel lining using nonlinear ground reaction curve. Tunn. Undergr. Space Technol. 2019, 94, 103135. [Google Scholar] [CrossRef]
  29. Pottler, R. Time-dependent rock—Shotcrete interaction a numerical shortcut. Comput. Geotech. 1990, 9, 149–169. [Google Scholar] [CrossRef]
  30. Masin, D. 3D Modeling of an NATM Tunnel in High K0 Clay Using Two Different Constitutive Models. J. Geotech. Geoenviron. Eng. 2009, 135, 1326–1335. [Google Scholar] [CrossRef] [Green Version]
  31. Svoboda, T.; Masin, D.; Bohac, J. Class A predictions of a NATM tunnel in stiff clay. Comput. Geotech. 2010, 37, 817–825. [Google Scholar] [CrossRef] [Green Version]
  32. Rott, J. Homogenisation and Modification of Composite Steel-Concrete Lining, with The Modulus of Elasticity of Sprayed Concrete Growing with Time. Tunel 2014, 23, 53–60. [Google Scholar]
  33. Vojtasik, K.; Hrubesova, E.; Mohyla, M.; Stankova, J. Determination of development of elastic modulus value for primary steel concrete reinforcement according to cooperative-ring-exchange theory. In Proceedings of the Transport and City Tunnels—Underground Construction, Prague, Czech Republic, 14–16 June 2010; pp. 802–804. [Google Scholar]
  34. Zapletal, A. Structural Model of a Steel-Concrete Composite Lining. Tunel 2007, 16, 68–71. [Google Scholar]
  35. Hrubesova, E. Contribution to the Issue of Inverse Analysis in Geotechnics. Ph.D. Thesis, Faculty of Civil Engineering, VSB-Technical University of Ostrava, Ostrava, Czech Republic, 1999. [Google Scholar]
  36. Aldorf, J.; Hrubesova, E.; Vojtasik, K.; Duris, L. Stiffness of Concrete Tunnel Lining Reinforced with Sectional Bars. Inf. Czech Assoc. Civ. Eng. (CKAIT) 2009, 15, 27–31. [Google Scholar]
  37. Vojtasik, K.; Hrubesova, E.; Mohyla, M.; Duris, L. Assessment of Stress State in a Heterogeneous Cross-section from Steel and Shotcrete at Primary Tunnel Lining. In Proceedings of the SGEM 2014, 14th GeoConference on Science and Technologies in Geology, Exploration and Minig, Albena, Bulgaria, 17–26 September 2014; pp. 125–129. [Google Scholar] [CrossRef]
  38. Bulytchev, N. Towards a Methodology for Mechanics of Underground Structures; Balkema: Rotterdam, The Netherlands, 1994; pp. 3–8. [Google Scholar]
  39. Mohyla, M. Contribution to Design of Primary Tunnel Lining from Steel-Shotrete Structure. Ph.D. Thesis, Faculty of Civil Engineering, VSB-Technical University of Ostrava, Ostrava, Czech Republic, 2016. [Google Scholar]
Figure 1. Example of shotcrete application (by the authors).
Applsci 10 06705 g001
Figure 2. Factors affecting the load on the primary lining.
Applsci 10 06705 g002
Figure 3. Replacement of heterogeneous lining cross-section with triangular lattice girder reinforcement.
Applsci 10 06705 g003
Figure 4. Replacement of heterogeneous lining cross-section with triangular lattice girder reinforcement.
Applsci 10 06705 g004
Figure 5. Model alternatives for the primary lining.
Applsci 10 06705 g005
Figure 6. Diagram of the arch structure consisting of three circular arches.
Applsci 10 06705 g006
Figure 7. 3D model of the lining.
Applsci 10 06705 g007
Figure 8. Deformation parameters of the lining in the considered construction stages.
Applsci 10 06705 g008
Figure 9. Stages of the numerical model.
Applsci 10 06705 g009
Figure 10. Interaction diagram depicting inner forces (Alternative II).
Applsci 10 06705 g010
Figure 11. Extension and numerical identification of node points and internal forces at the perimeter of the primary lining.
Applsci 10 06705 g011
Figure 12. Vertical deformation for stage B.
Applsci 10 06705 g012
Figure 13. Development of tangential stresses in the cross section of the lining depending on the distance of the tunnel face.
Applsci 10 06705 g013
Figure 14. Stresses in individual elements of the lining (steel and concrete) after recalculation according to the redistribution coefficients.
Applsci 10 06705 g014
Table 1. Measured time-dependent elastic modulus of concrete E c (according to VSB).
t (d) E c (GPa)
114.550
1018.320
2820.310
Table 2. Deformation parameters of the lining in the considered construction stages.
StageTime (d)Alternative E c (GPa) E hm (GPa)
A0–1I.11.55812.130
II.13.807
B1–5I.15.88316.442
II.18.029
C5–28I.18.67119.224
II.20.786
Table 3. Development of tangential stresses in outer fibres of the lining depending on the distance of the tunnel face.
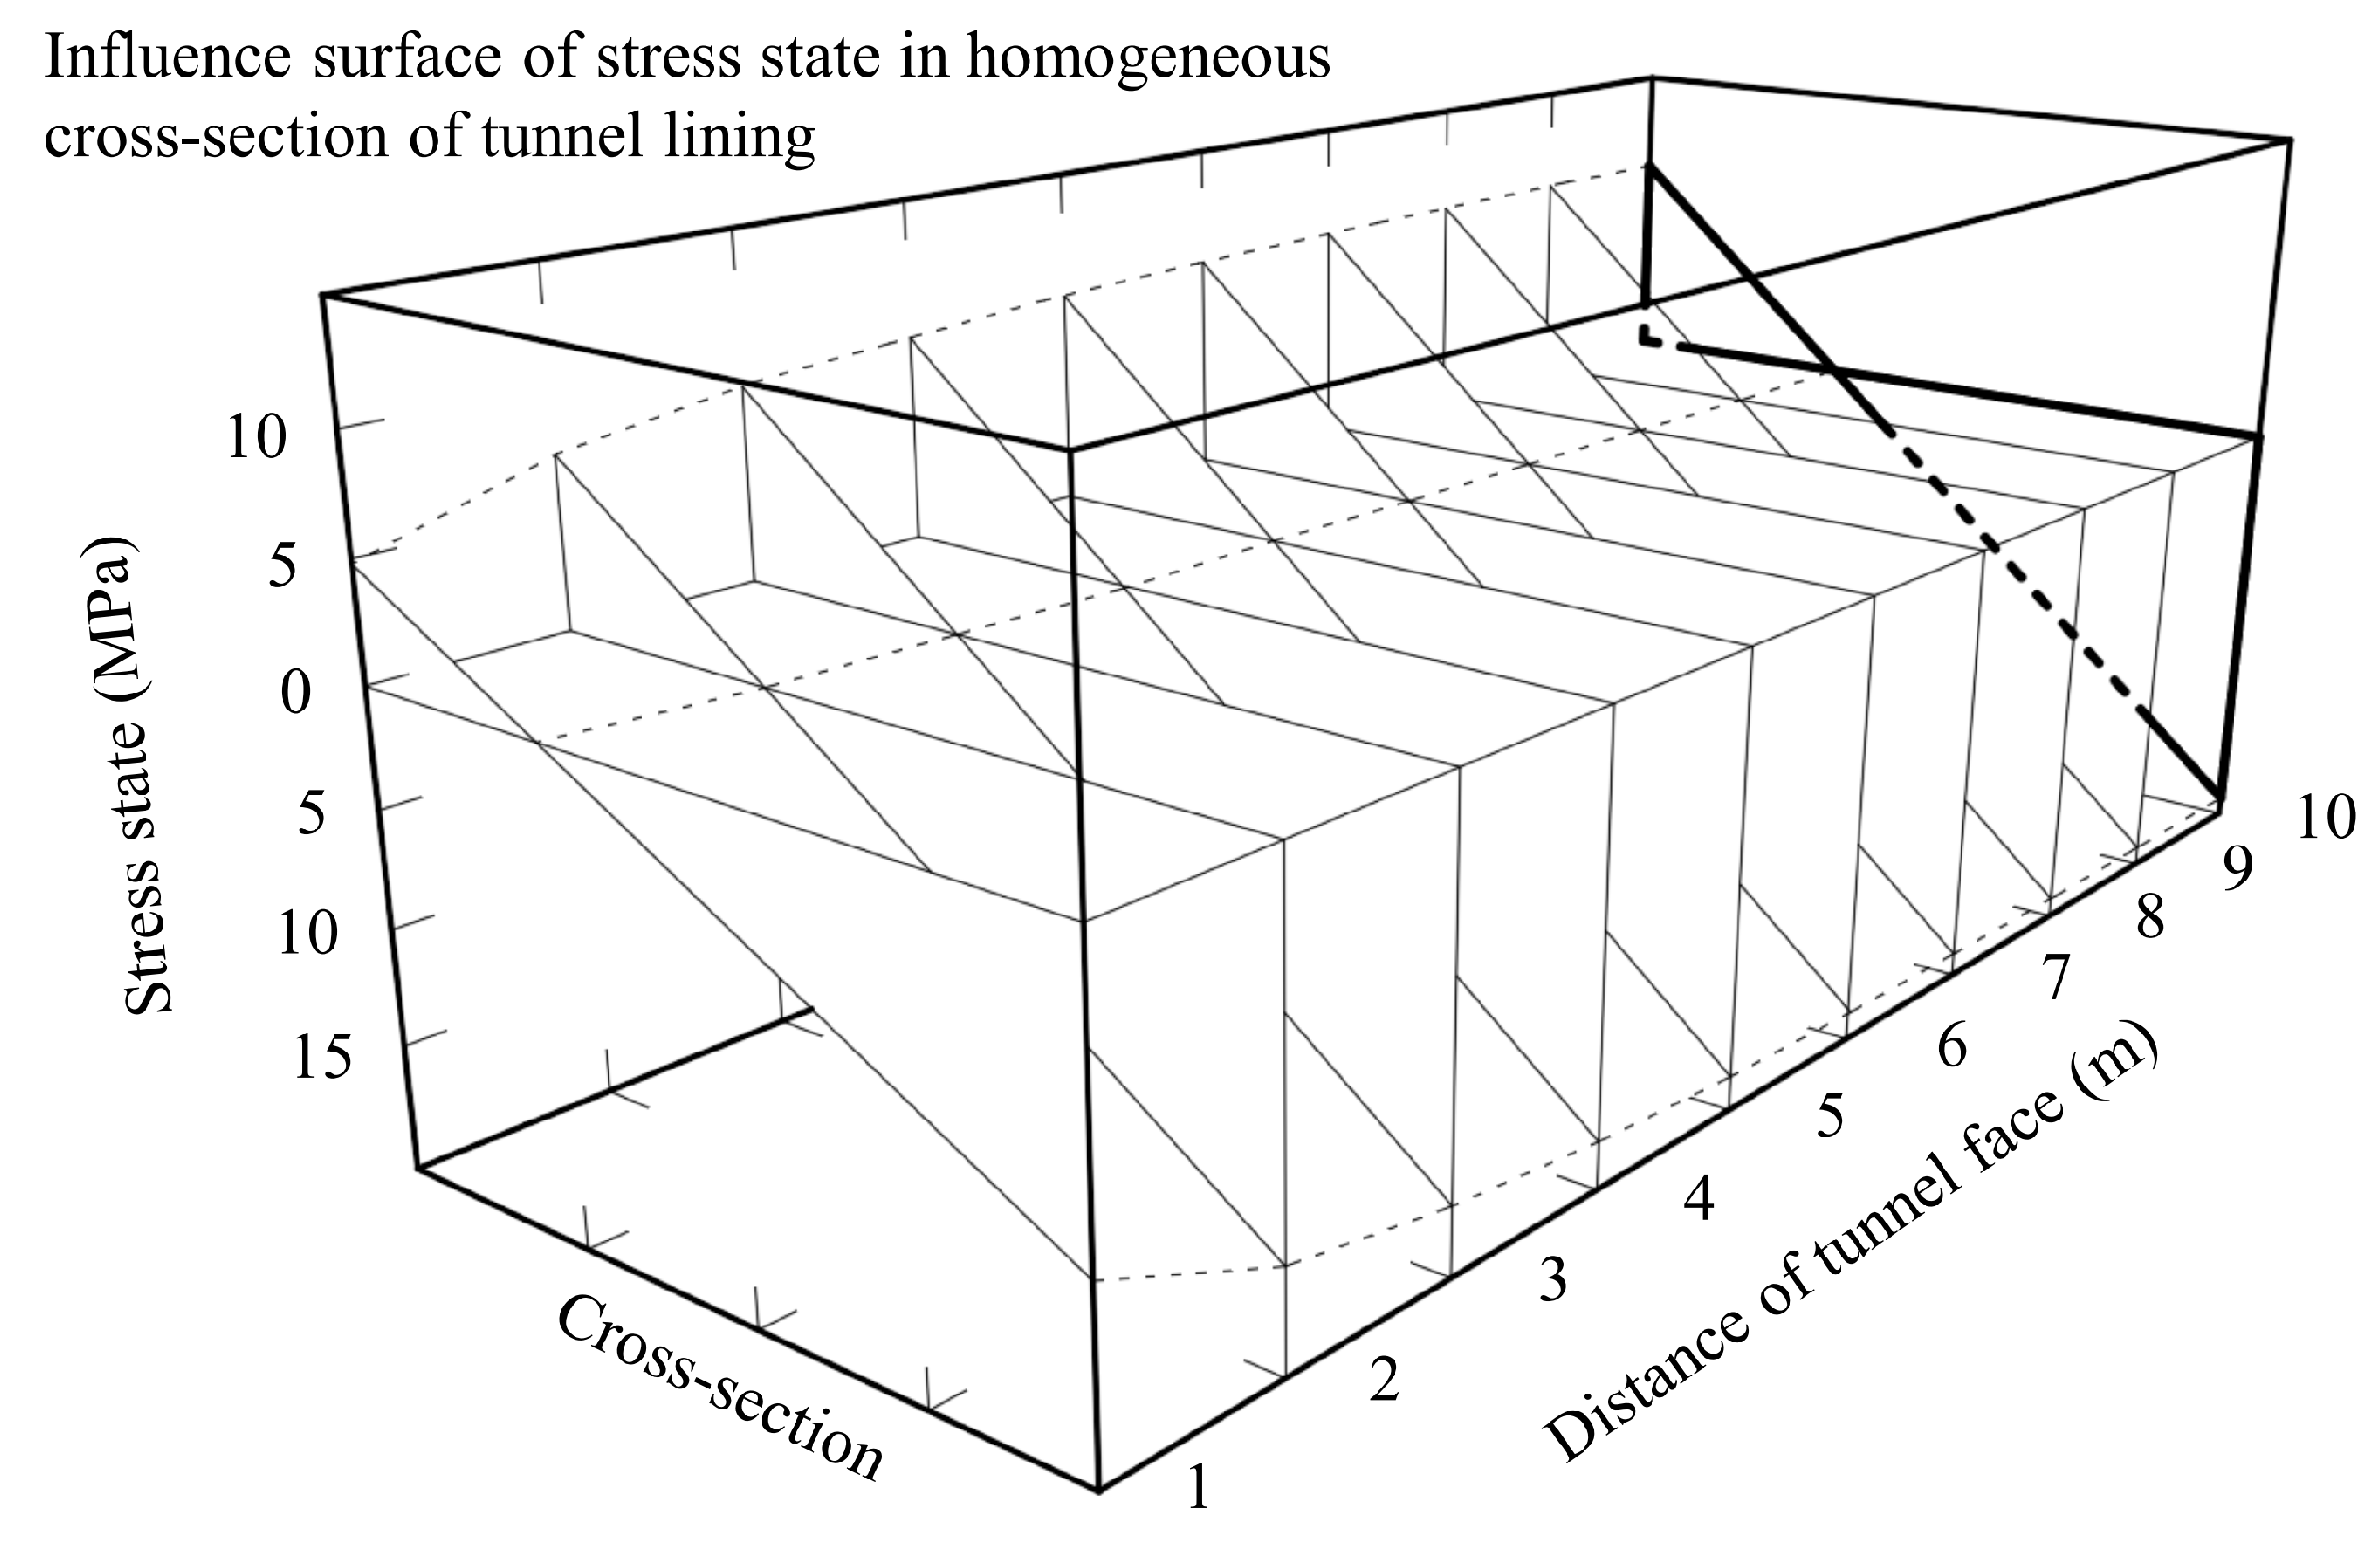
Stress State in Outer Fibres (MPa)
Tunnel Face
Distance (m)
Back Side
Fibres
Face Side
Fibres
14.86−12.20
27.34−15.50
38.43−16.90
49.10−17.80
59.54−18.40
69.80−18.70
79.98−18.90
810.10−19.10
910.20−19.10
1010.20−19.20

