1. Introduction
The engineering of phononic resonances enables the excitation of localized vibrations of microscopic objects at ultrasonic frequencies, forming meta-atoms or meta-molecules with precise eigenfrequencies and elastic waveforms. They have potential applications as sensor elements [
1], MEMS resonators [
2], elastic waveguides [
3], or optomechanical systems [
4,
5,
6,
7], for instance.
Phononic resonances are naturally induced at the microscale with three-dimensional mechanical structures attached to a surface, for instance, in the form of erected pillars [
8] or chains of resonators [
3,
9]. One requirement is that clamping to the surface or support does not reduce too significantly the quality factor of resonances through radiation of outgoing elastic waves. Another approach that is prone to engineering relies on phononic crystals [
10,
11,
12]. One of their important features is indeed the formation of complete band gaps, inside which wave propagation is forbidden and only evanescent waves can exist.
By introducing defects in a phononic crystal, spatially-localized states are introduced with precise resonant frequencies. Further forming an infinite chain of such defects leads to the concept of the coupled-resonator elastic waveguide (CREW) [
13], originally inspired by coupled-resonator optical waveguides in photonic crystals (CROW) [
14]. It is known that the dispersion of waves guided along a CREW is very smooth and is determined by the coupling coefficients existing between phononic resonators. When the chain is made finite, a discrete set of resonance frequencies established along the dispersion relation for guided waves; we hence term the chain a coupled-resonator waveguide cavity. The resonant states are collective vibrations of the chain, as we have shown recently in the case of a chain of seventeen resonators implemented in a two-dimensional fused silica phononic crystal slab, and are rather independent of the path followed over the surface of the slab [
15].
In this paper, we experimentally explore how a set of a few phononic coupled-resonator waveguide cavities, coupled weakly through evanescent elastic waves, can form collective vibrations where the resonance modes of the individual phononic cavities are essentially preserved but can be excited at once. Experimentally, we rely on the phononic crystal slab technology developed for our previous work based on femtosecond laser writing followed by KOH etching of a fused silica plate [
15], but extend our considerations to the set of three short phononic cavities shown in
Figure 1. In the following, we first present the experimental results and the numerical simulations that sustain them, before discussing the observed collective vibrations in the light of a dynamical matrix model with one degree of freedom per defect and the nearest-neighbor approximation.
2. Results
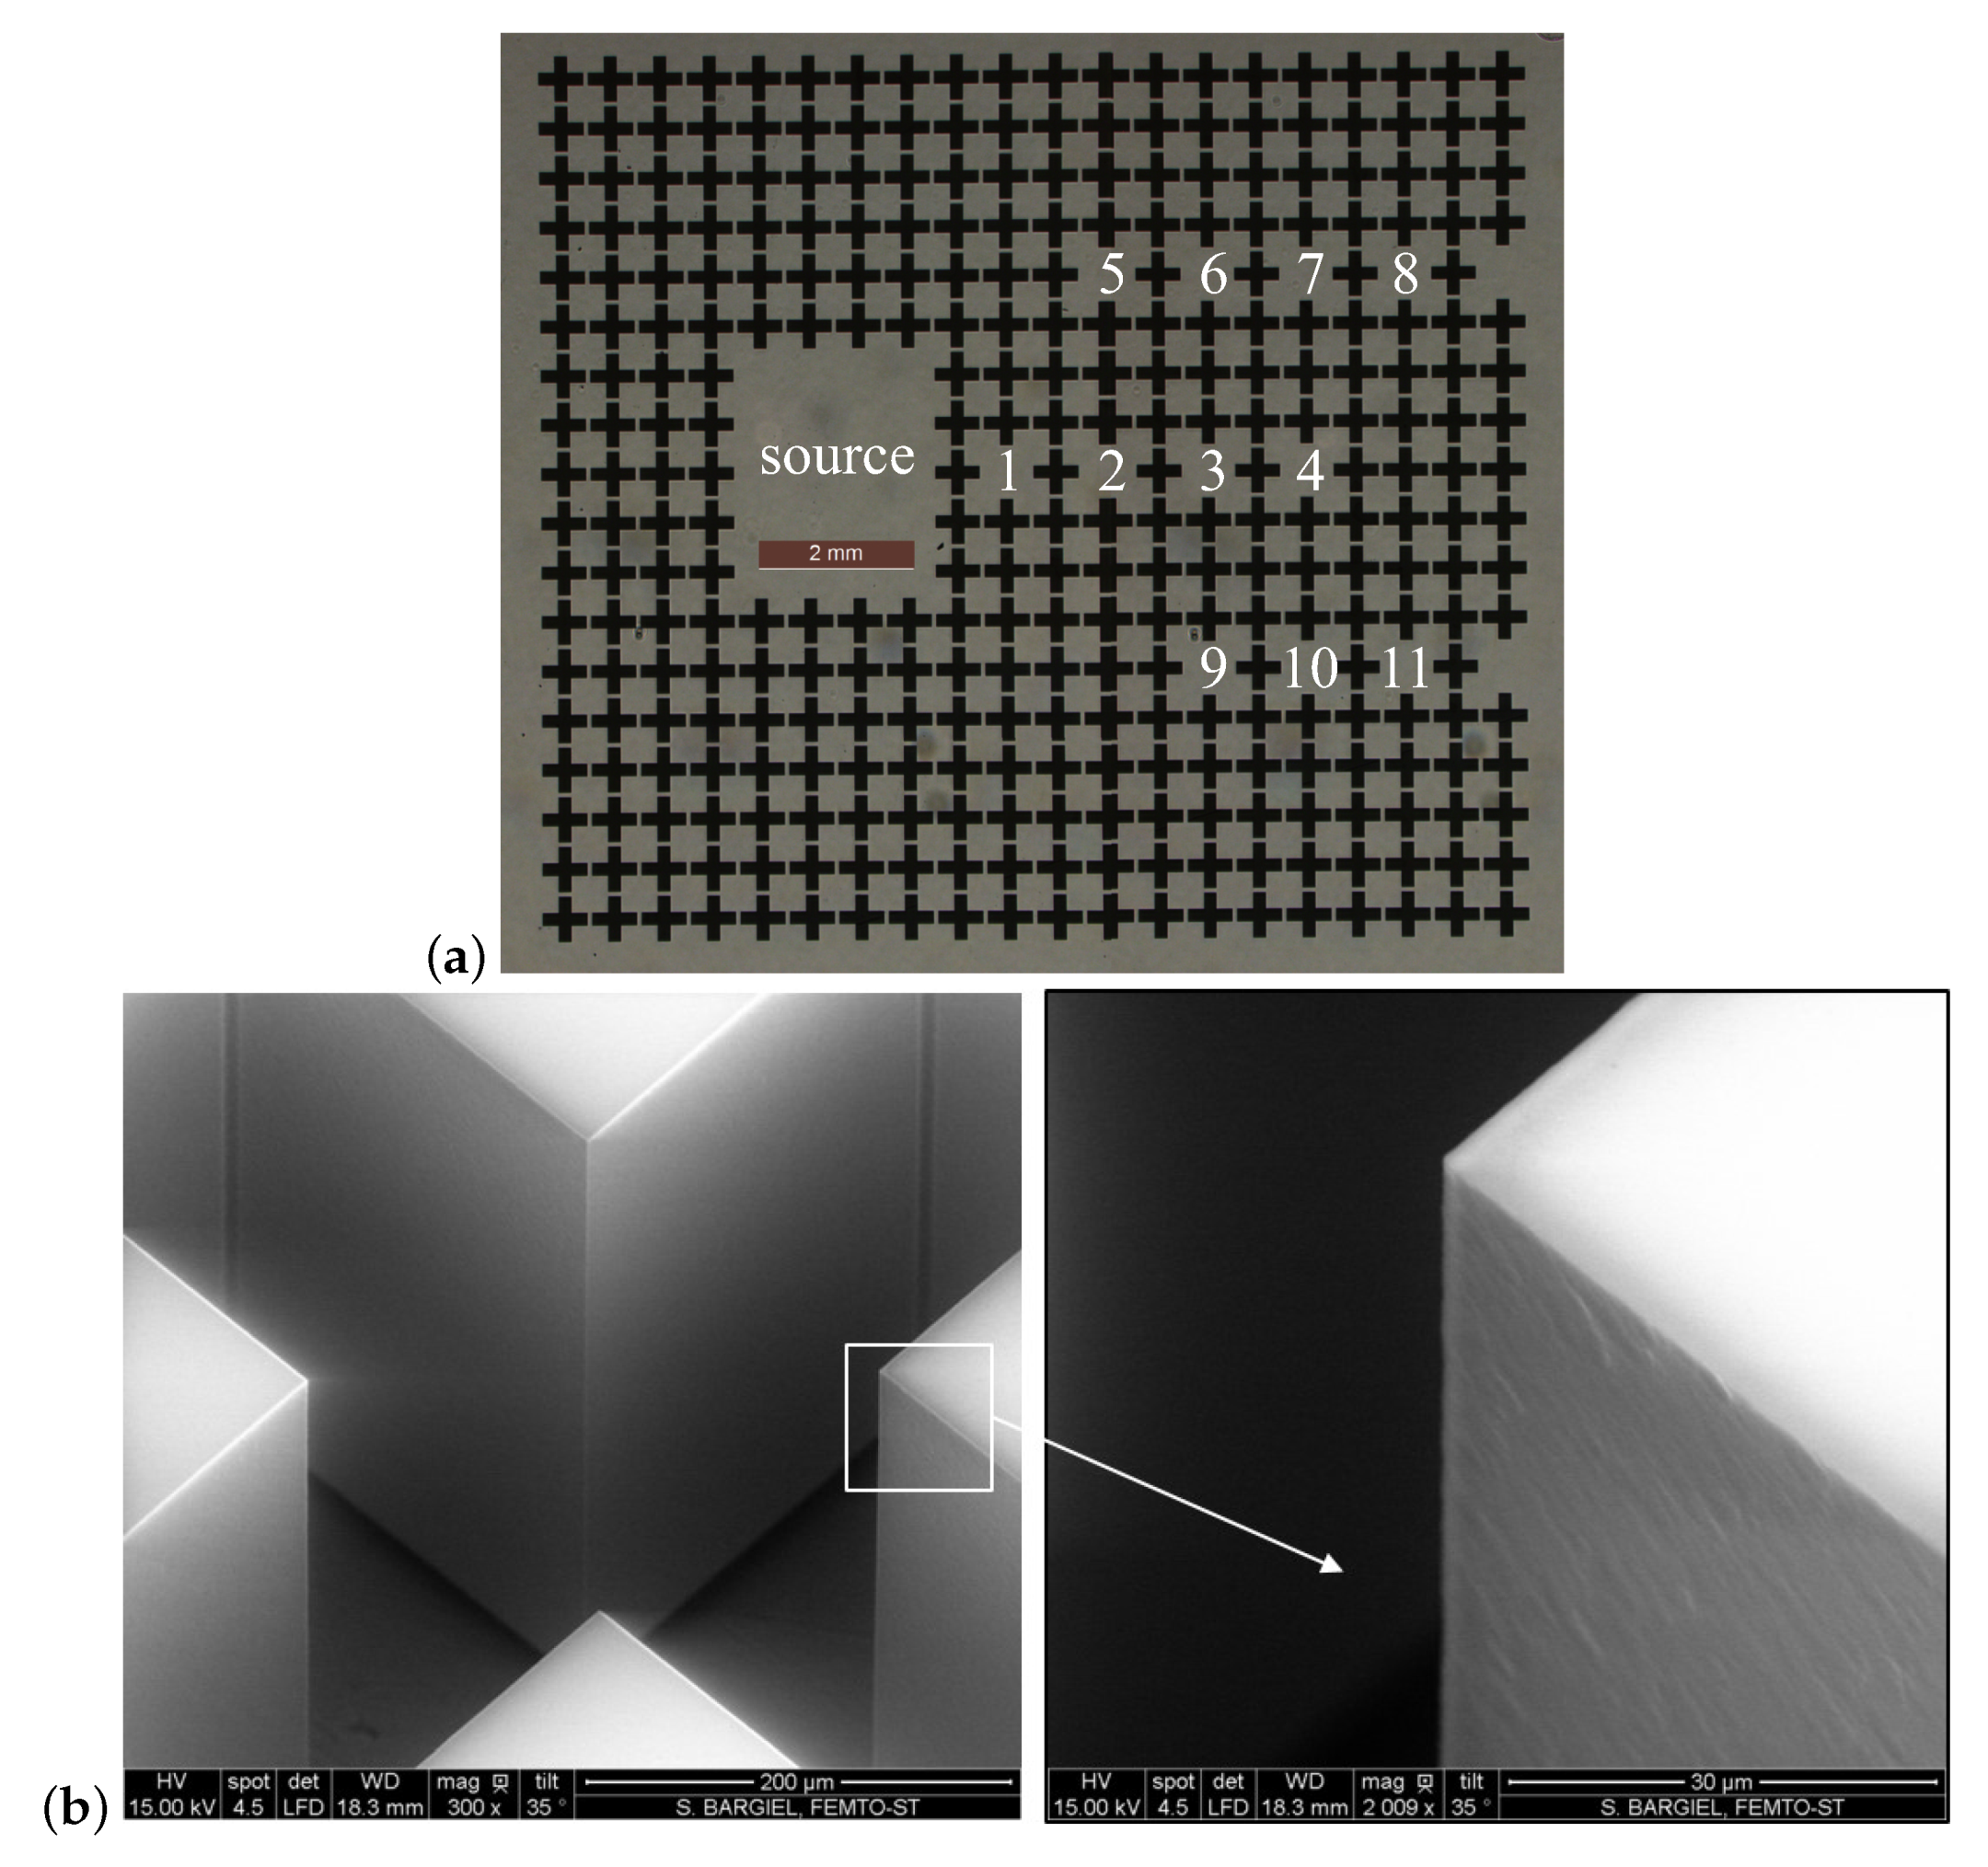
The phononic crystal slab sample we consider is shown in
Figure 1. The crystal itself is a square lattice of cross-holes [
16] with lattice constant
a = 714 μm. Between each group of four nearest holes, a square-shape membrane resonator is defined and is connected to its four neighbors. The phononic crystal slab has a large complete bandgap that is detailed later on. As a note, cross-holes provide a much wider bandgap width than circular holes, for instance [
16]. There are even other unit-cell designs that still allow gaining on the bandgap width [
17], but we selected cross-holes in this work because of the simpler footprint for technology. For frequencies within the complete bandgap, there are only evanescent Bloch waves and the coupling between defects decreases exponentially with their separation. A total of eleven identical defects are introduced and are grouped in three coupled-resonator waveguide cavities: defects 1–4 form CREW cavity C1, defects 5–8 form CREW cavity C2, and defects 9–11 form CREW cavity C3). Defect resonators in the cavities are separated by a distance 2
a. Comparatively, the shortest distance between two cavities is 4
a. Hence, it is expected that CREW cavities are only weakly coupled. Experimental details regarding sample preparation and characterization are identical with Ref. [
15] and are not repeated here.
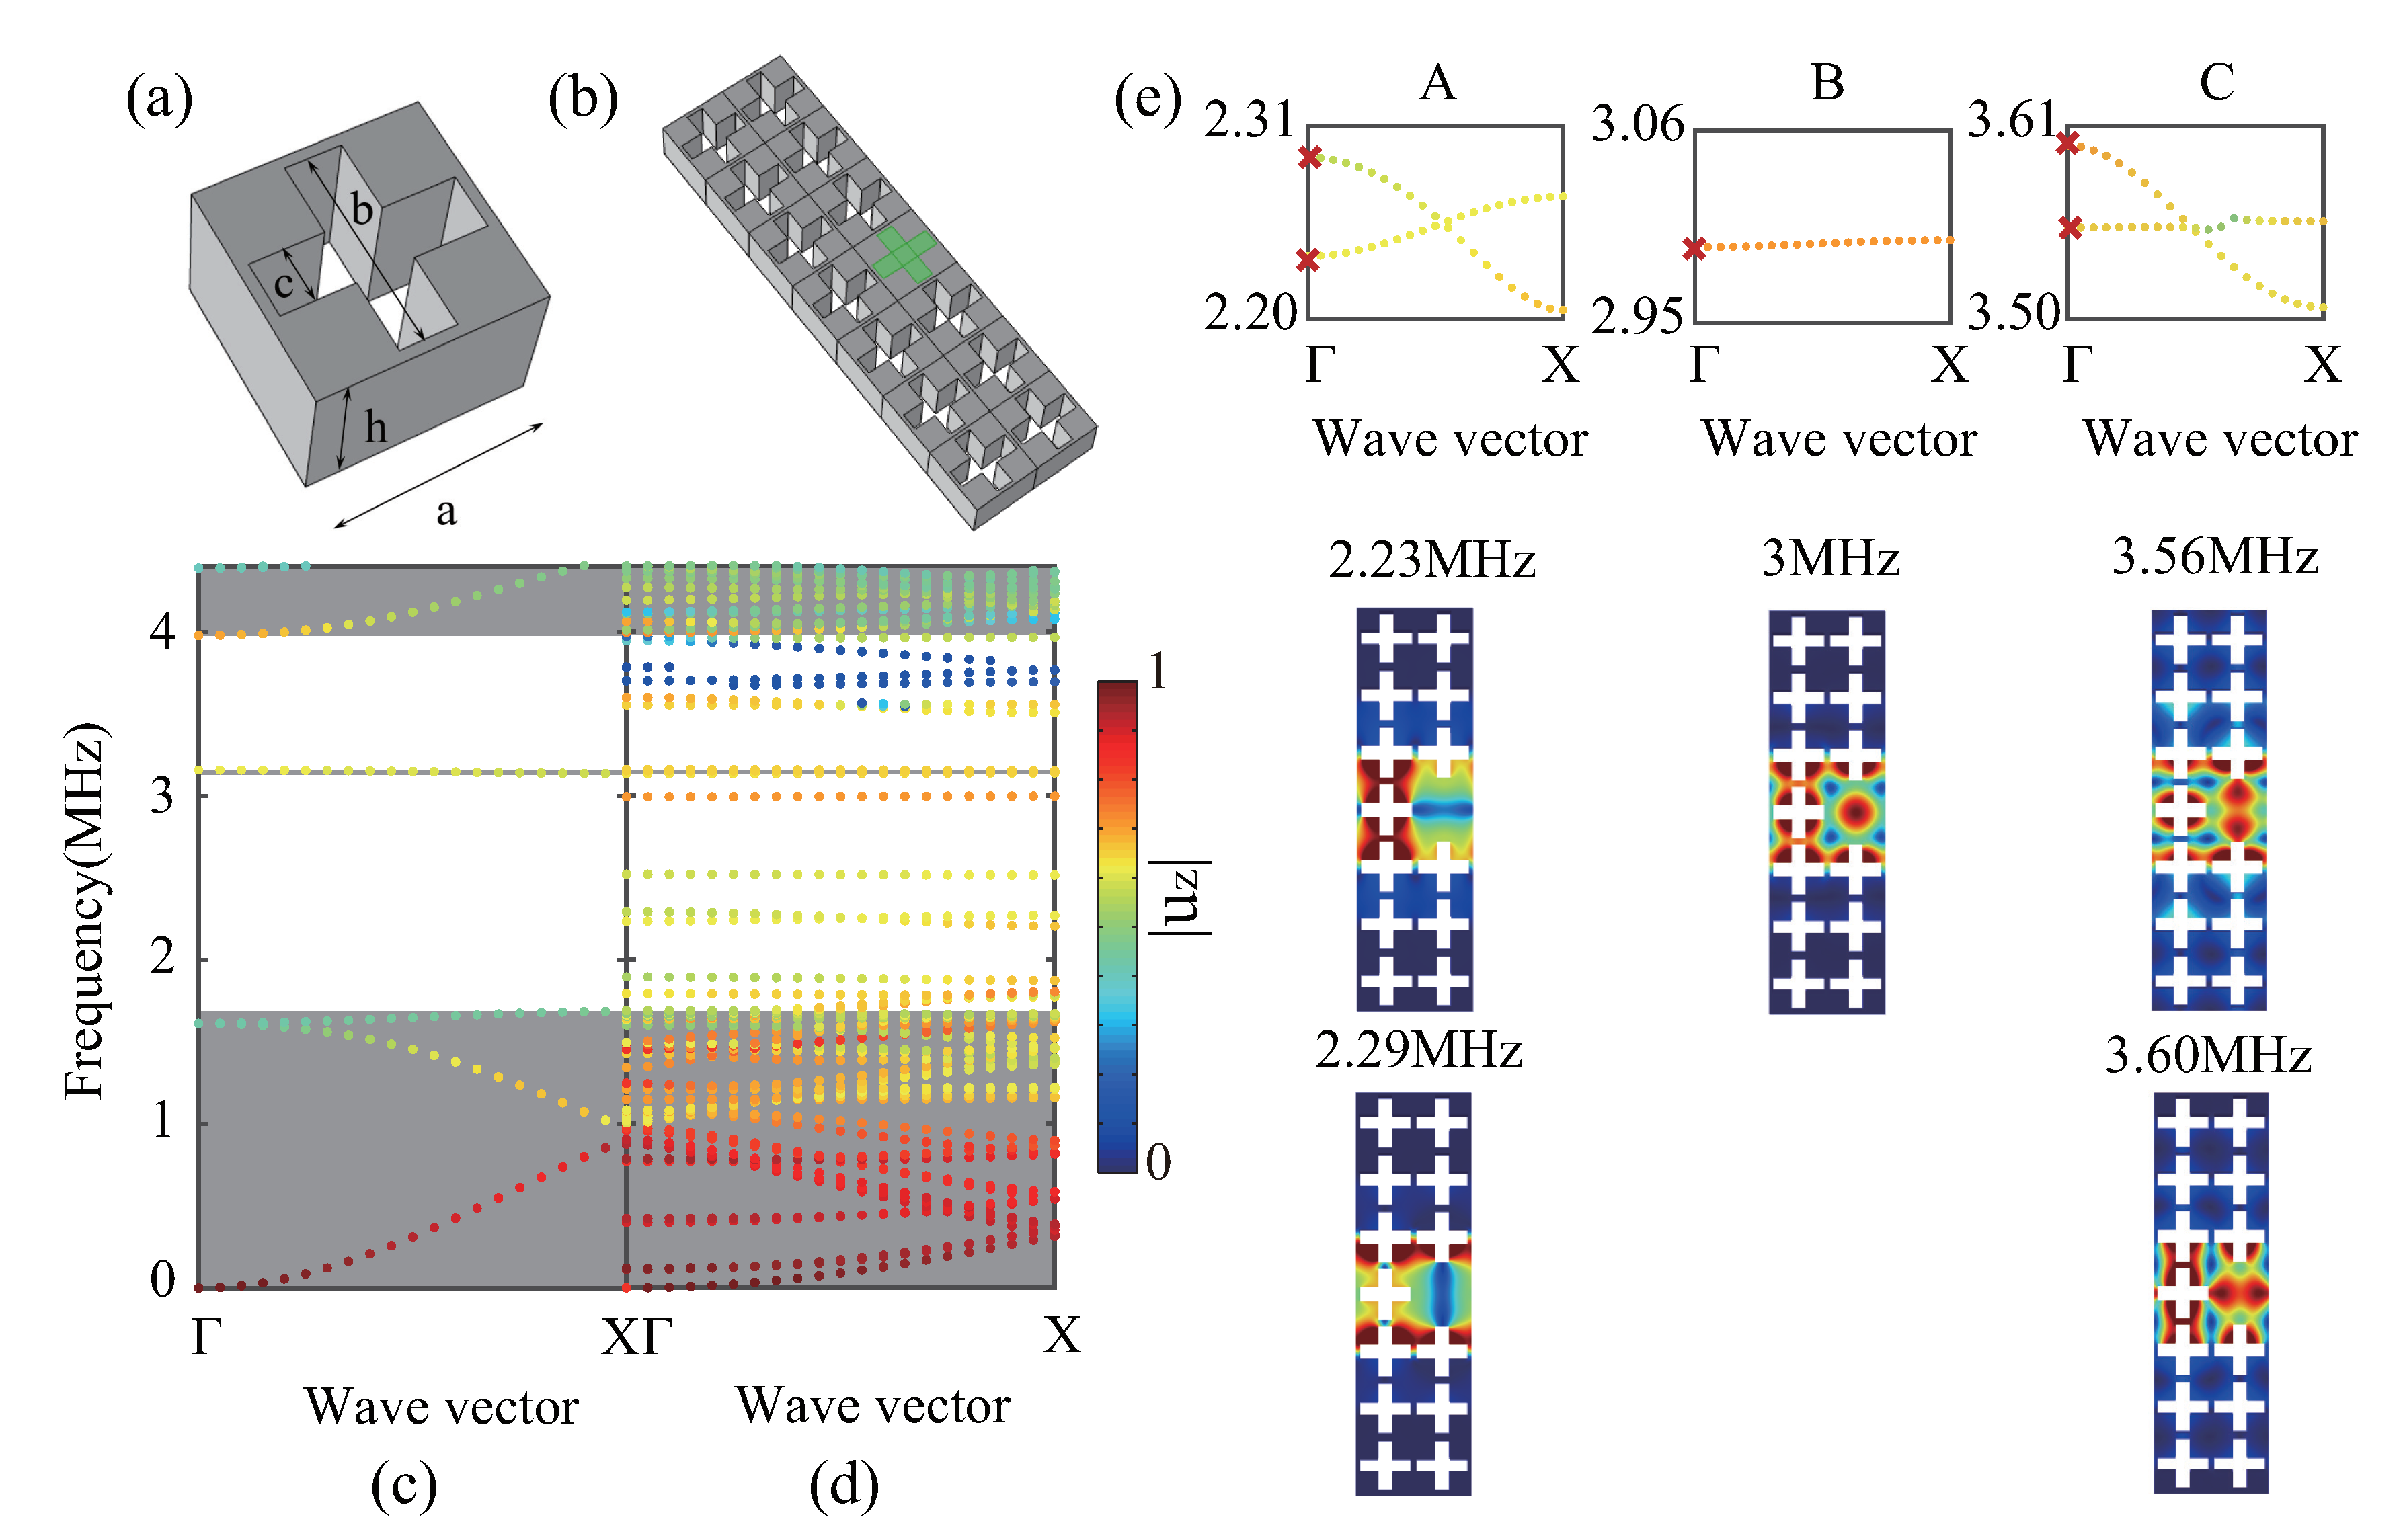
The phononic crystal dispersion properties are summarized in
Figure 2. All computations are performed using the finite element method. Phononic band structures are obtained using the unit-cell of
Figure 2a for the phononic crystal and using the unit-cell of
Figure 2b for the CREW. Periodic boundary conditions are applied on all lateral sides, whereas the bottom and top surfaces are left free; the Bloch wavevector is fixed and frequencies are obtained by solving an eigenvalue problem [
13]. The band structures are shown only for out-of-plane polarized Bloch waves, as only that displacement component is accessible in our experiments. Geometrical parameters are chosen to ensure the existence of a wide complete bandgap, extending between 1.7 and 4 MHz except from a flat bulk band appearing around 3.2 MHz. The smallest length in the structure is
μm, much larger than the estimated resolution of
μm of the technological process for the holes. The CREW considered in this paper are formed from defects separated by two lattice constants. Defects are simply created by omitting to etch chosen cross holes. As a result, it is expected that elastic waves can become spatially localized around the defects, for frequencies inside the complete bandgap, decaying exponentially away from the defect center [
18,
19,
20]. If defects are placed not too far away from one another, they are in their mutual near-fields and are thus evanescently coupled. Guided elastic waves can then transit from one defect to the next. The dispersion of guided waves in a CREW is very smooth and is dictated by the coupling coefficients between resonant defects [
13]. In
Figure 2, many guided bands appear within the complete bandgap, each of them originating from a given resonant mode. In relation to experiments, we have selected three frequency ranges around 2.25 MHz (range A), 3 MHz (range B), and 3.55 MHz (range C). A total of five guided waves are apparent, each with their specific modal shape. The two pairs of guided waves in ranges A and C have orthogonal polarizations and hence their dispersion curves can cross without interference. Their respective actual excitations in the experiment depend on the symmetry of the excitation source.
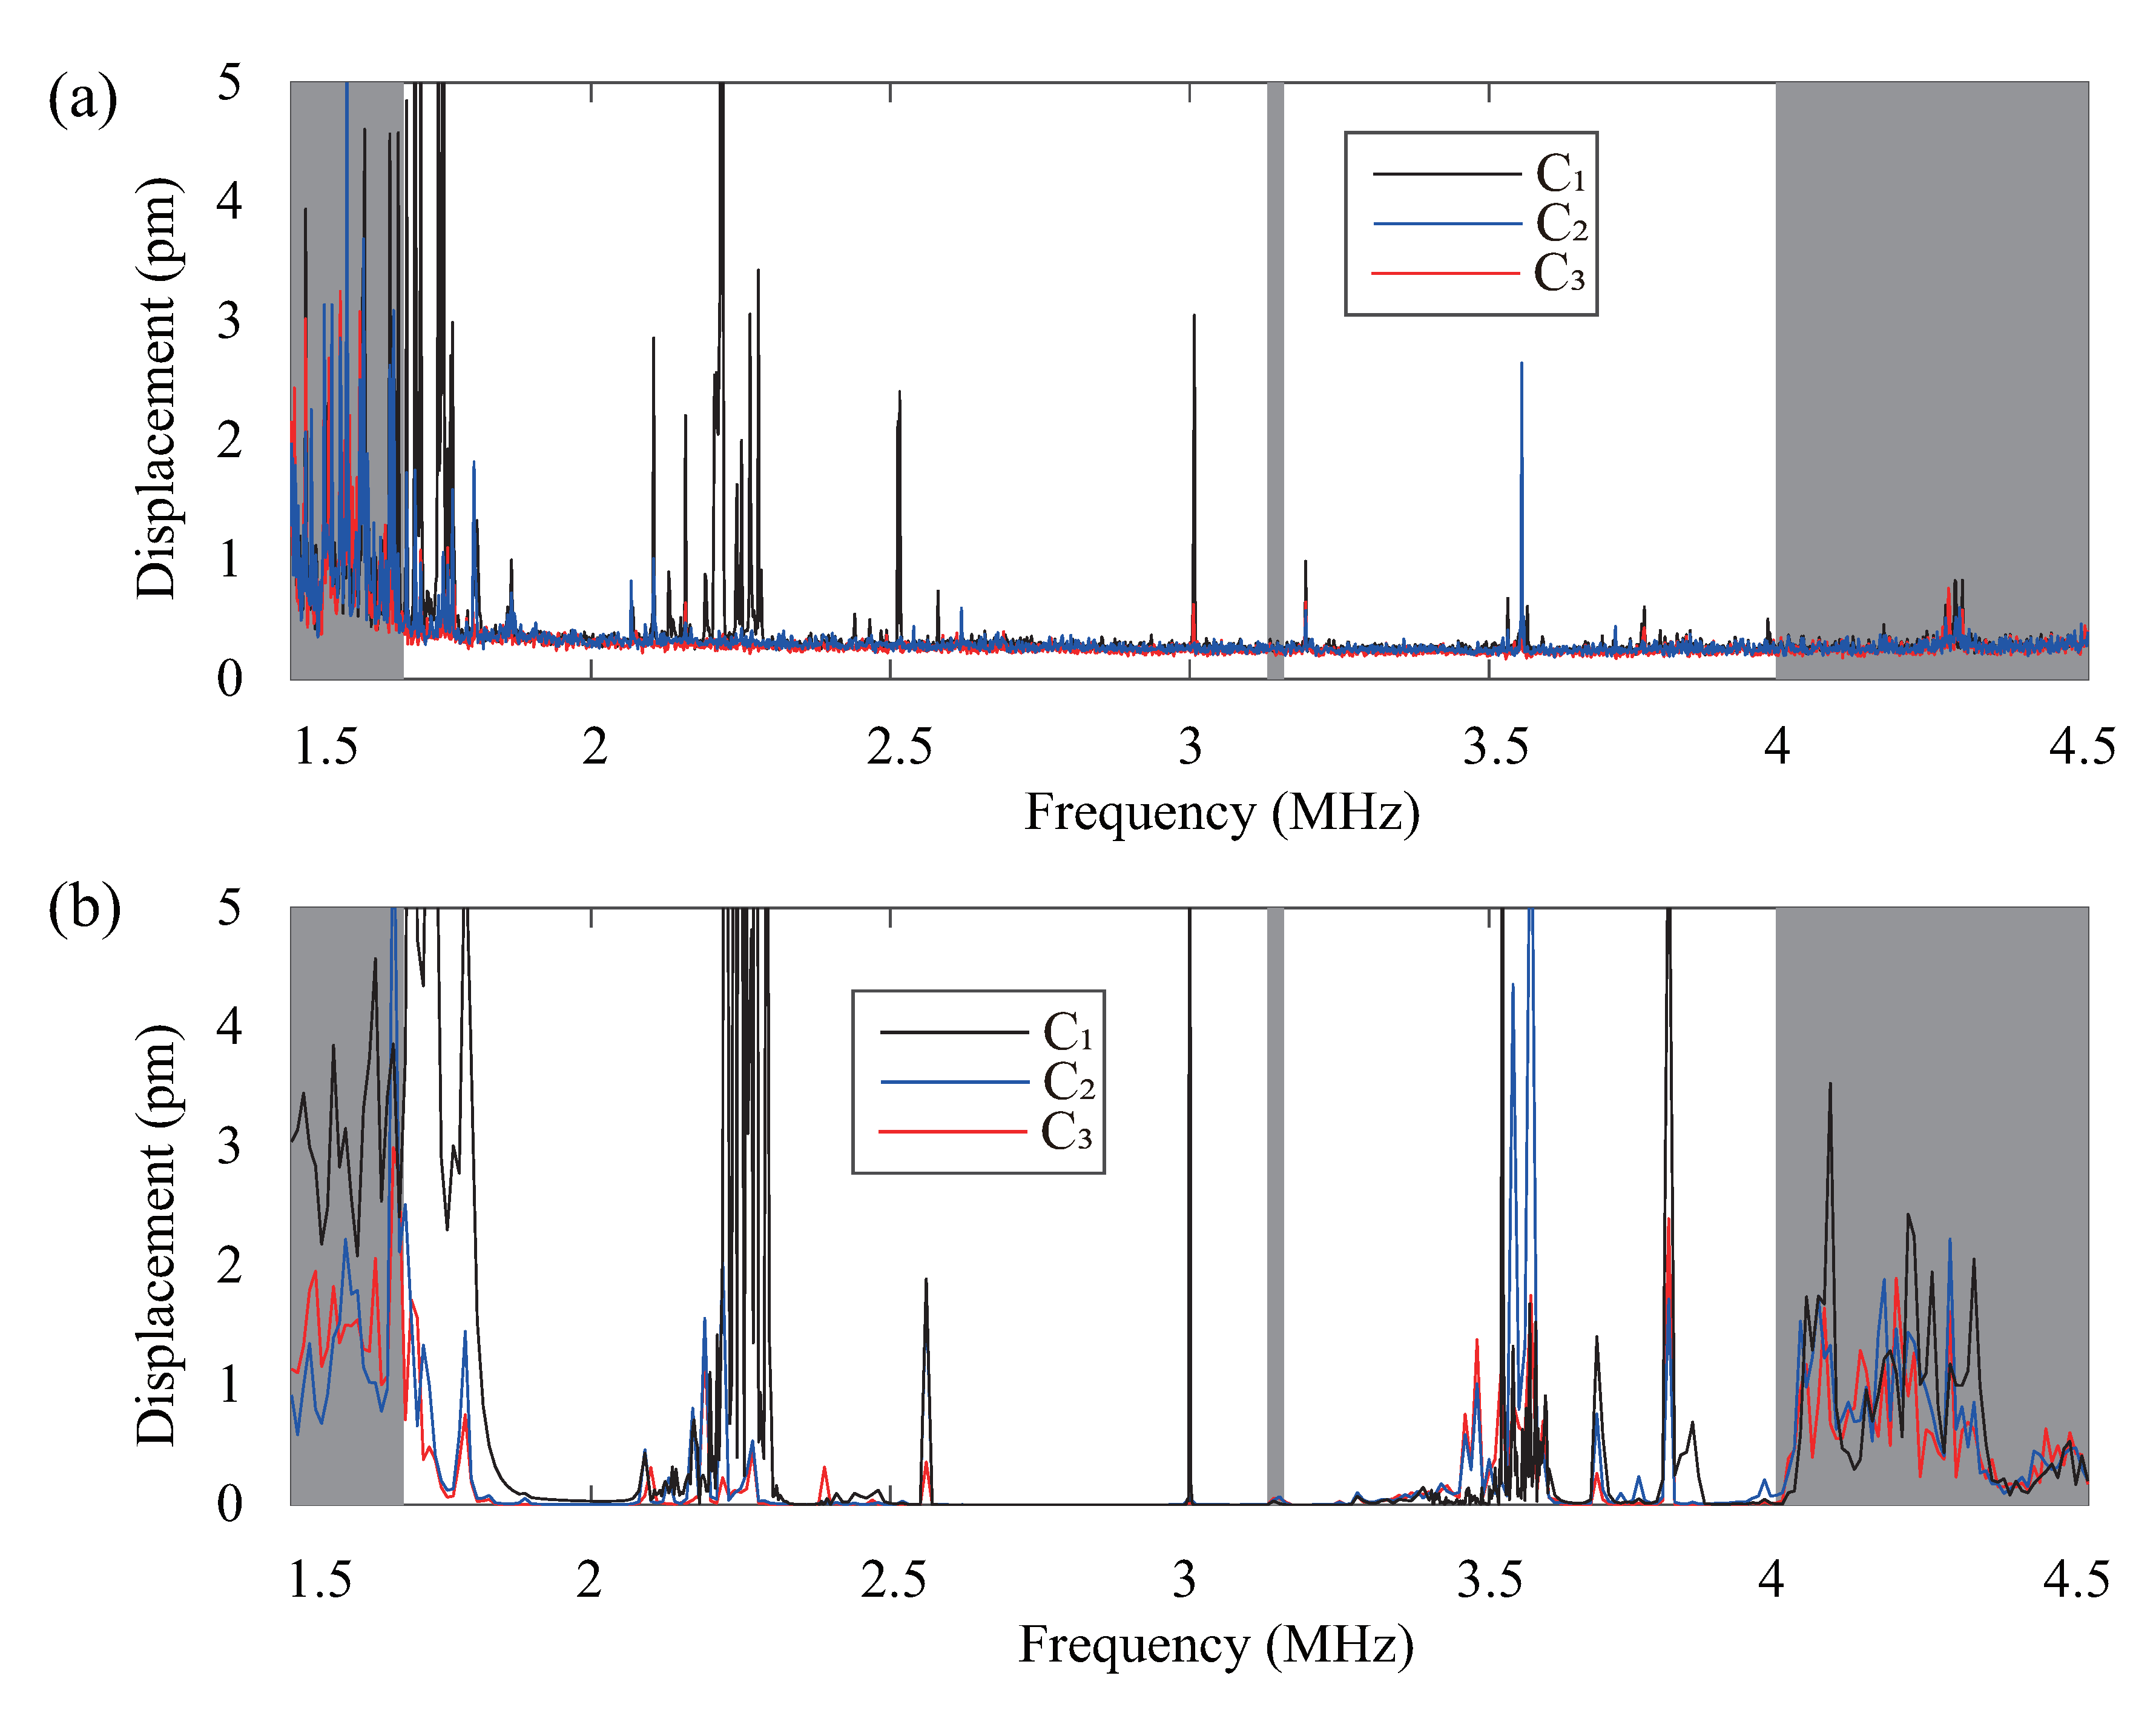
Ultrasonic waves in the experimental sample of
Figure 1 are excited thanks to a piezoelectric vibrator in contact with the bottom surface in the source region. Coupling from the source region to the resonators occurs mainly with defect 1. Out-of-plane vibrations at the top surface are measured using a scanning laser vibrometer (Polytec Microsystem Analyzer MSA-500, equipped with analog displacement decoder model DD-300; 0.03-24 MHz frequency response with 50 nm/V sensitivity). The source waveform sent to the piezoelectric vibrator is a periodic chirp covering the frequency range of interest. The amplitude of out-of-plane displacement measured at three different locations is plotted in
Figure 3a. Measurements averaged over defect 4 are considered typical of CREW cavity C1, whereas measurements for CREW cavities C2 and C3 are averaged over the unit cells just right of defect 8 and defect 11, respectively. Displacements larger than 0.3 pm can be recorded with this setting. The measurements reveal a sequence of very sharp resonance peaks, in agreement with previous results on a sample with a single chain of seventeen coupled resonators [
15]. Compared with that sample, however, the resonance peaks are distributed over a larger span of frequencies, especially in the range from 2.1 to 2.3 MHz.
Measurements can be compared directly with a finite element model based on a stochastic force distribution applied in the source region [
21]. To this end, a three-dimensional mesh is created to represent the full sample shown in
Figure 1, with a perfectly matched layer (PML) surrounding the finite size crystal. Free boundary conditions are still applied on the bottom and top surfaces. Material losses in fused silica are added to the model. A fair correspondence is observed between experiment and numerical simulation in
Figure 3. In particular, the distribution of resonance peaks and their central frequencies are rather well-reproduced numerically, but the response levels are less reliable. Compared to the experiment, indeed, a fully spatially random body force distribution is considered numerically, whereas the actual piezoelectric excitation has a more symmetrical and homogeneous distribution. Furthermore, the resonance peaks are very narrow and are resolved experimentally with only a few sampling points.
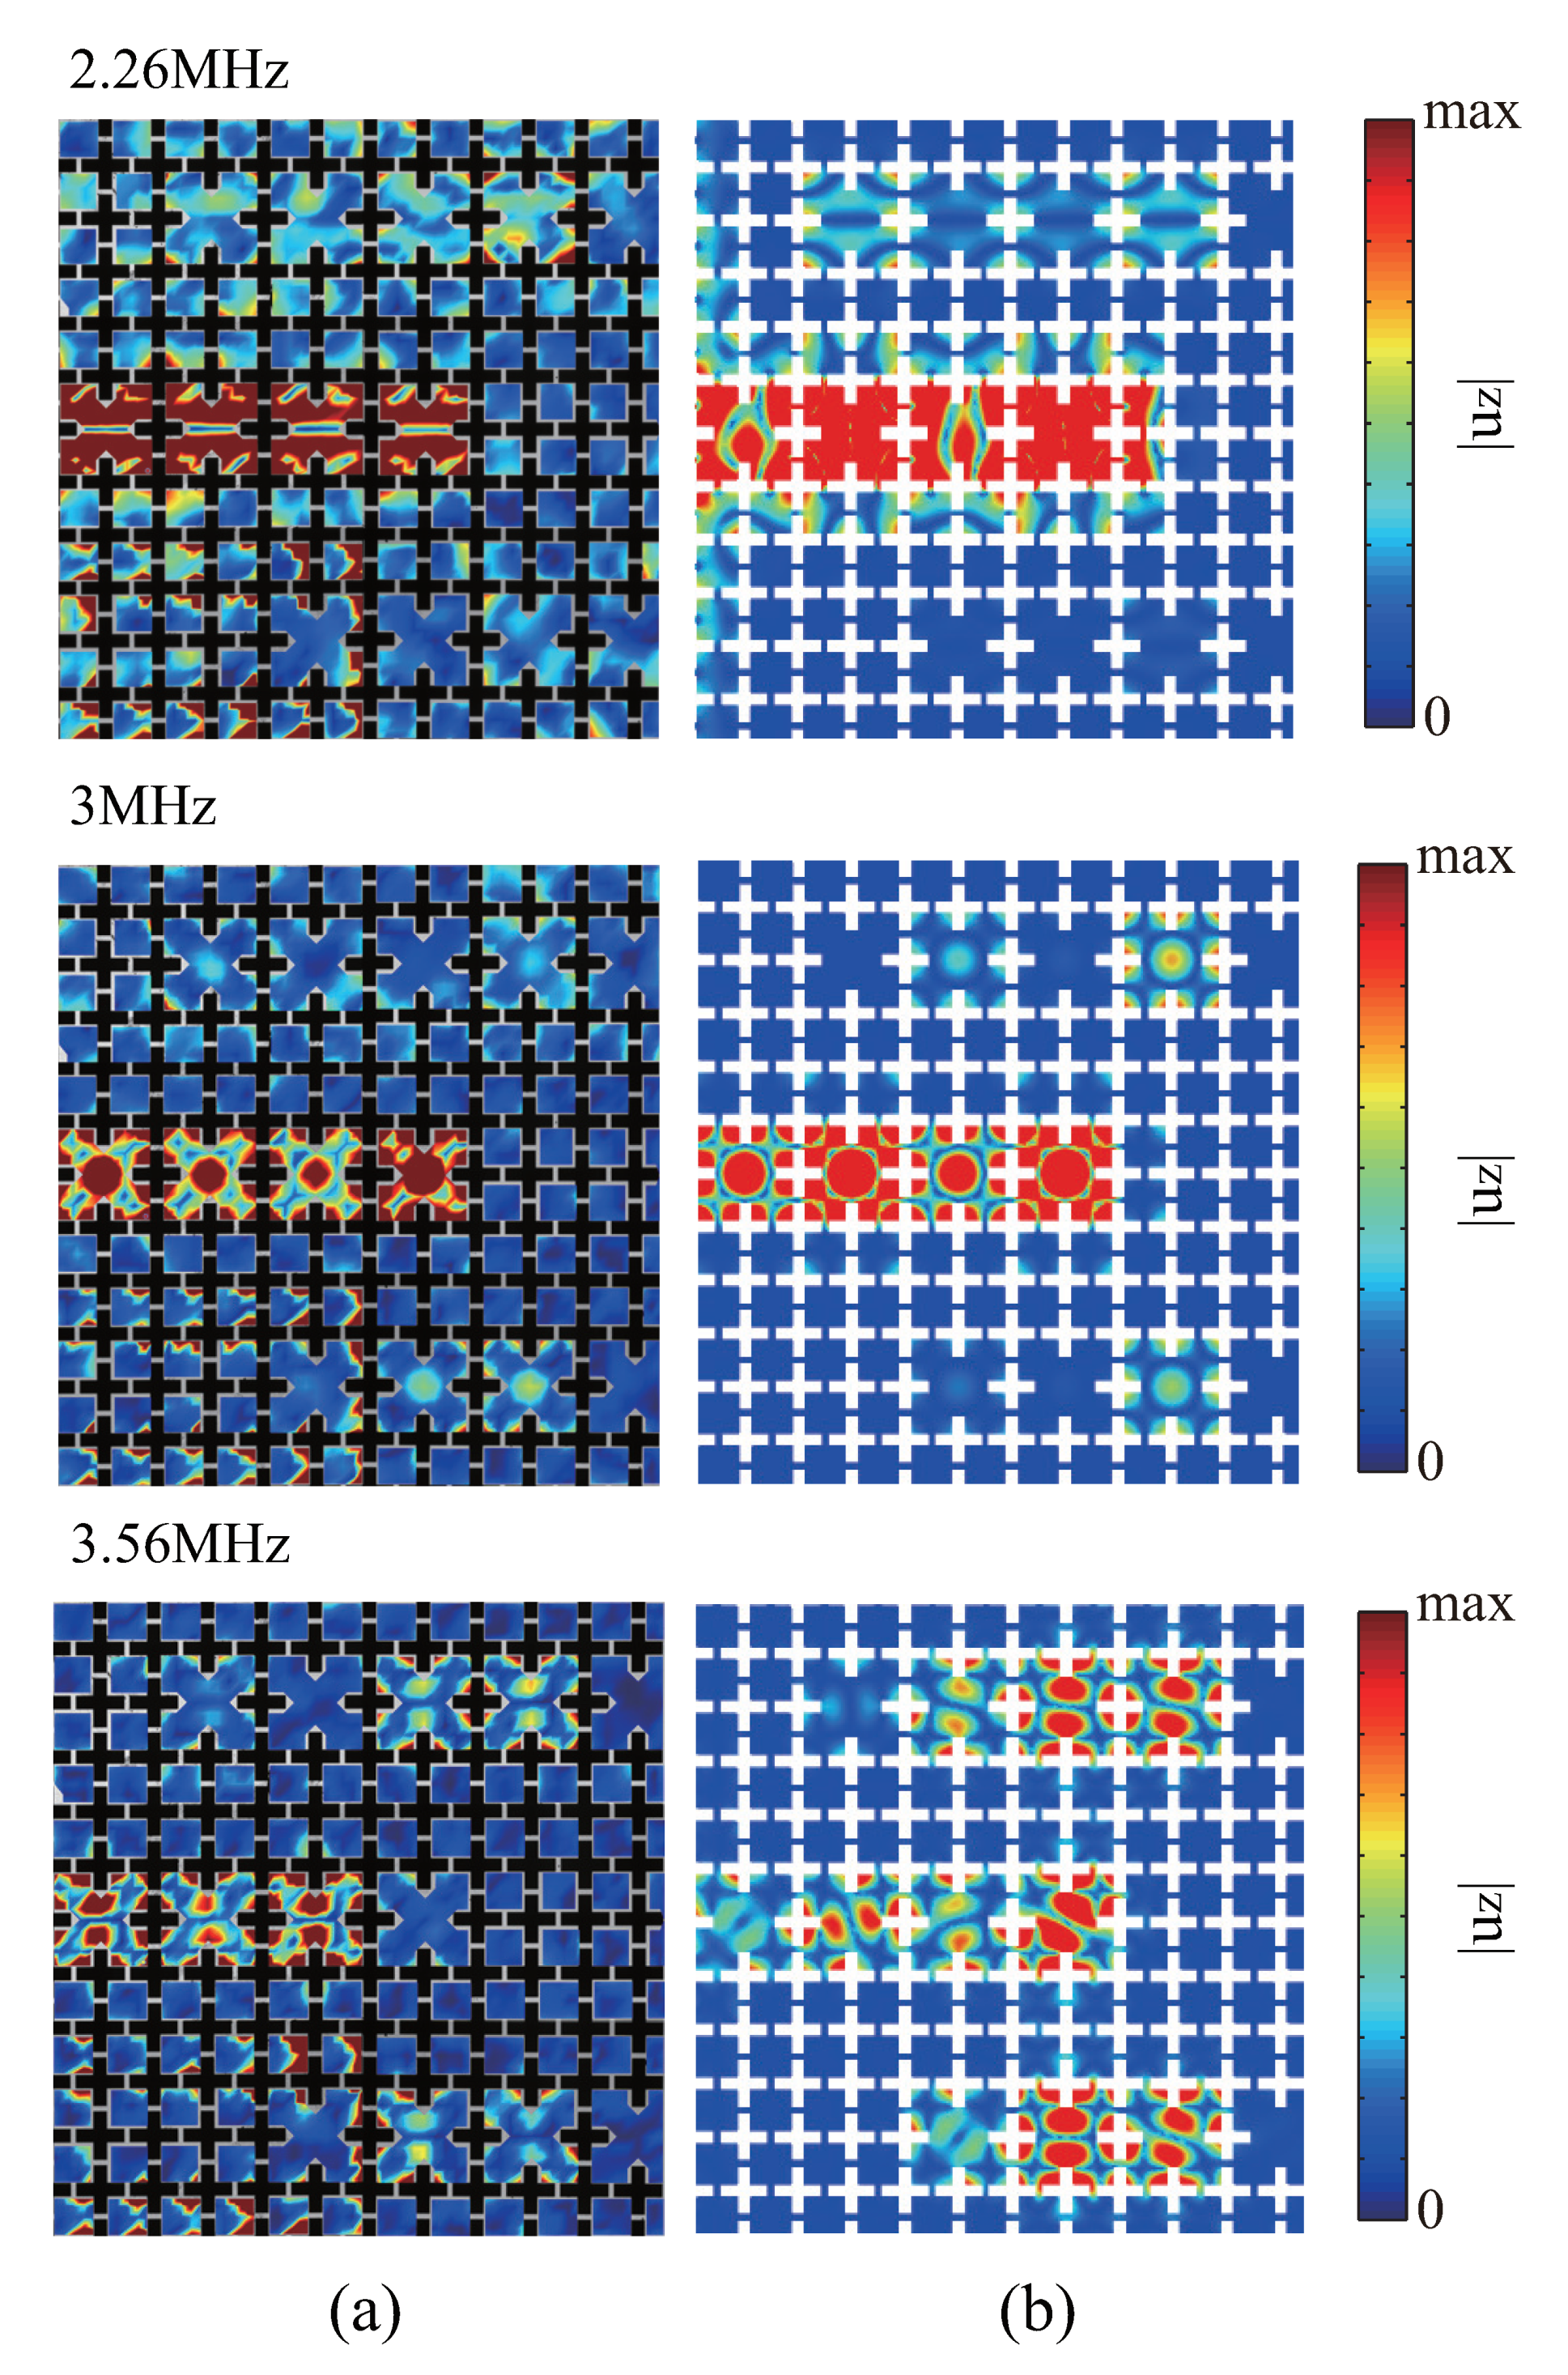
In addition to the frequency response functions shown in
Figure 3a, the scanning laser vibrometer can form images of the spatial distribution of the out-of-plane displacement at the surface of the sample at a fixed frequency. We show in
Figure 4 the measured displacement fields at three selected frequencies for which maxima of vibration are observed experimentally in CREW cavity C1. Each of these measurements is compared with the finite element numerical simulation obtained at the same frequency.
At the frequency of 2.26 MHz, vibrations in CREW cavity C1 are clearly excited and the modal shape of the symmetrical mode in range A of
Figure 2e is recognized. Comparatively, the antisymmetrical mode in range A is not observed experimentally. The numerical simulation in contrast involves both symmetrical and antisymmetrical modes. As mentioned before, this fact can be explained by the symmetry of the actual source compared to the absence of symmetry of the numerical (random) source.
At the frequency of 3 MHz, the observations are similar for CREW cavity C1 and the modal shape of the non-degenerated mode in range B of
Figure 2e is recognized. Faint vibrations in both CREW cavities C2 and C3 are observed as well, with exactly the same modal shape.
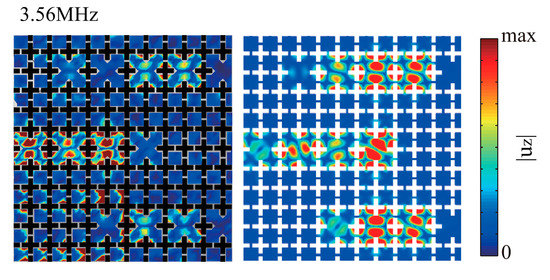
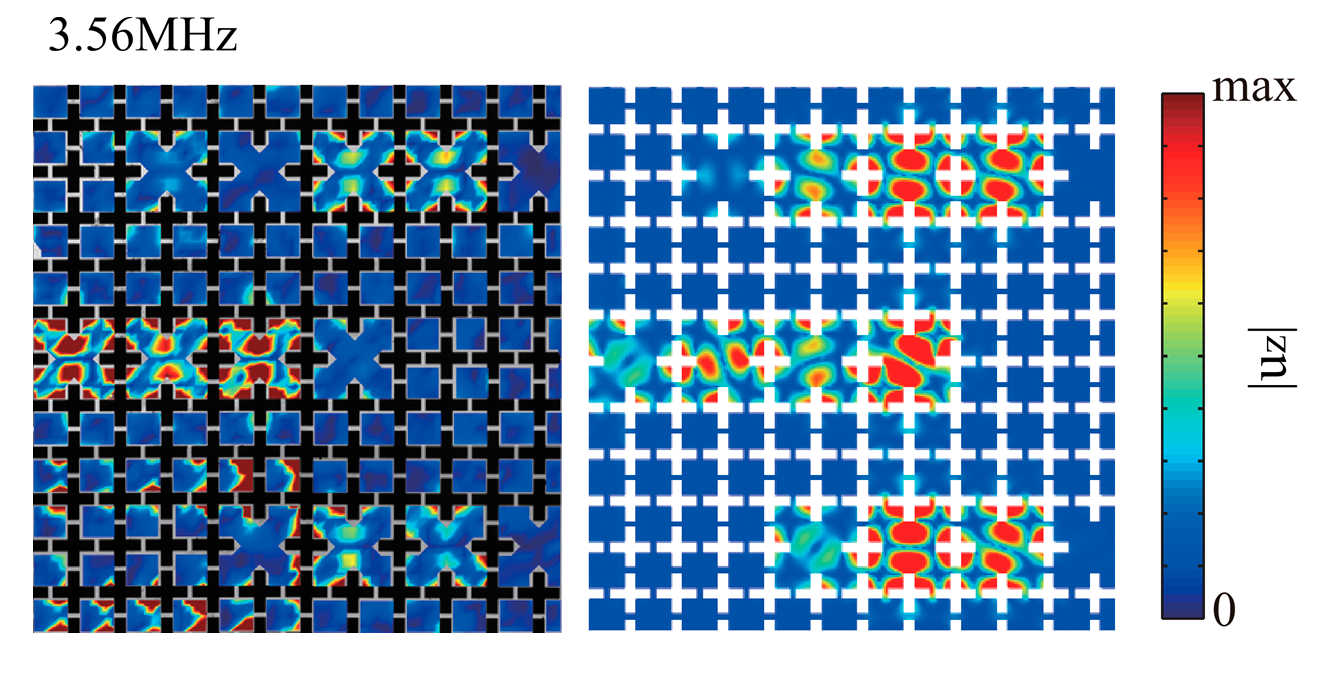
At the frequency of 3.56 MHz, the observations are similar again and the modal shape of the symmetrical mode in range C of
Figure 2e is recognized in the experimental image. As for 2.26 MHz, the numerical simulation involves both symmetrical and antisymmetrical modes. Clear vibrations in both CREW cavities C2 and C3 are observed at 3.56 MHz, with exactly the same modal shape. There is hence energy transfer from the vibrations of CREW cavity C1 to both CREW cavities C2 and C3, without a significant change in modal shapes, as can be expected in the case of weak coupling of resonant cavities.
3. Discussion
In Ref. [
15], we introduced a dynamical matrix model to predict the resonant frequencies of a phononic polymer, or a generalized chain of coupled resonators that is not necessarily organized along the principal axes of the supporting phononic crystal. Here we extend the model to the more general case of unequal coupling coefficients. In short, the model assumes that the state of the phononic defect structure is described by one macroscopic degree of freedom per resonator,
. All resonators are identical except for a spatial shift in the crystal and have the same isolated resonance frequency
. Then, the dynamical equation for coupled resonators is written
with a symmetric dynamical matrix
such that
. The eigenvalues of the dynamical matrix give the observable resonant frequencies of the finite structure. Their number equals the number of resonators for a non-degenerate band.
Within each of the three CREW cavities in this paper, the dominant coupling coefficient is between nearest neighbors, with a lattice separation 2
a. For every waveguide band, the coupling coefficient can be estimated from the frequency extent of the dispersion relation. Hence a coupling coefficient γ can be estimated for each band, or each single defect mode. Furthermore, the CREW cavities are separated by a distance of at least 4
a (vertically, the separation between defects numbers 2 and 5 is 4
a; similarly the vertical separation between defects numbers 3 and 9 is also 4
a). This leads us to define a coupling coefficient δ that is much smaller than γ to describe the evanescent coupling between CREW cavities 1 and 2, and 1 and 3 as well. Neglecting all other coupling coefficients, we thus can write the dynamical matrix as
The three diagonal blocks account for the eigenfrequencies of CREW cavities C1, C2, and C3, in that sequence. The off-diagonal blocks of the first line provide the weak couplings between CREW cavities.
The discrete dynamical model explains most of the features of the experimental observations of the previous section. Resonances are discrete, appear as sharp peaks centered on the eigenfrequencies of the finite structure, and the modal shapes of the original resonances of the isolated defect resonators remain clearly present in the coupled vibration fields. It also implies that a resonator placed far away from the source of vibrations can be rather efficiently excited, by a mechanism of collective vibrations of the whole phononic crystal structure. Here, cavities placed four phononic crystal rows apart are observed to sustain such collective vibrations.
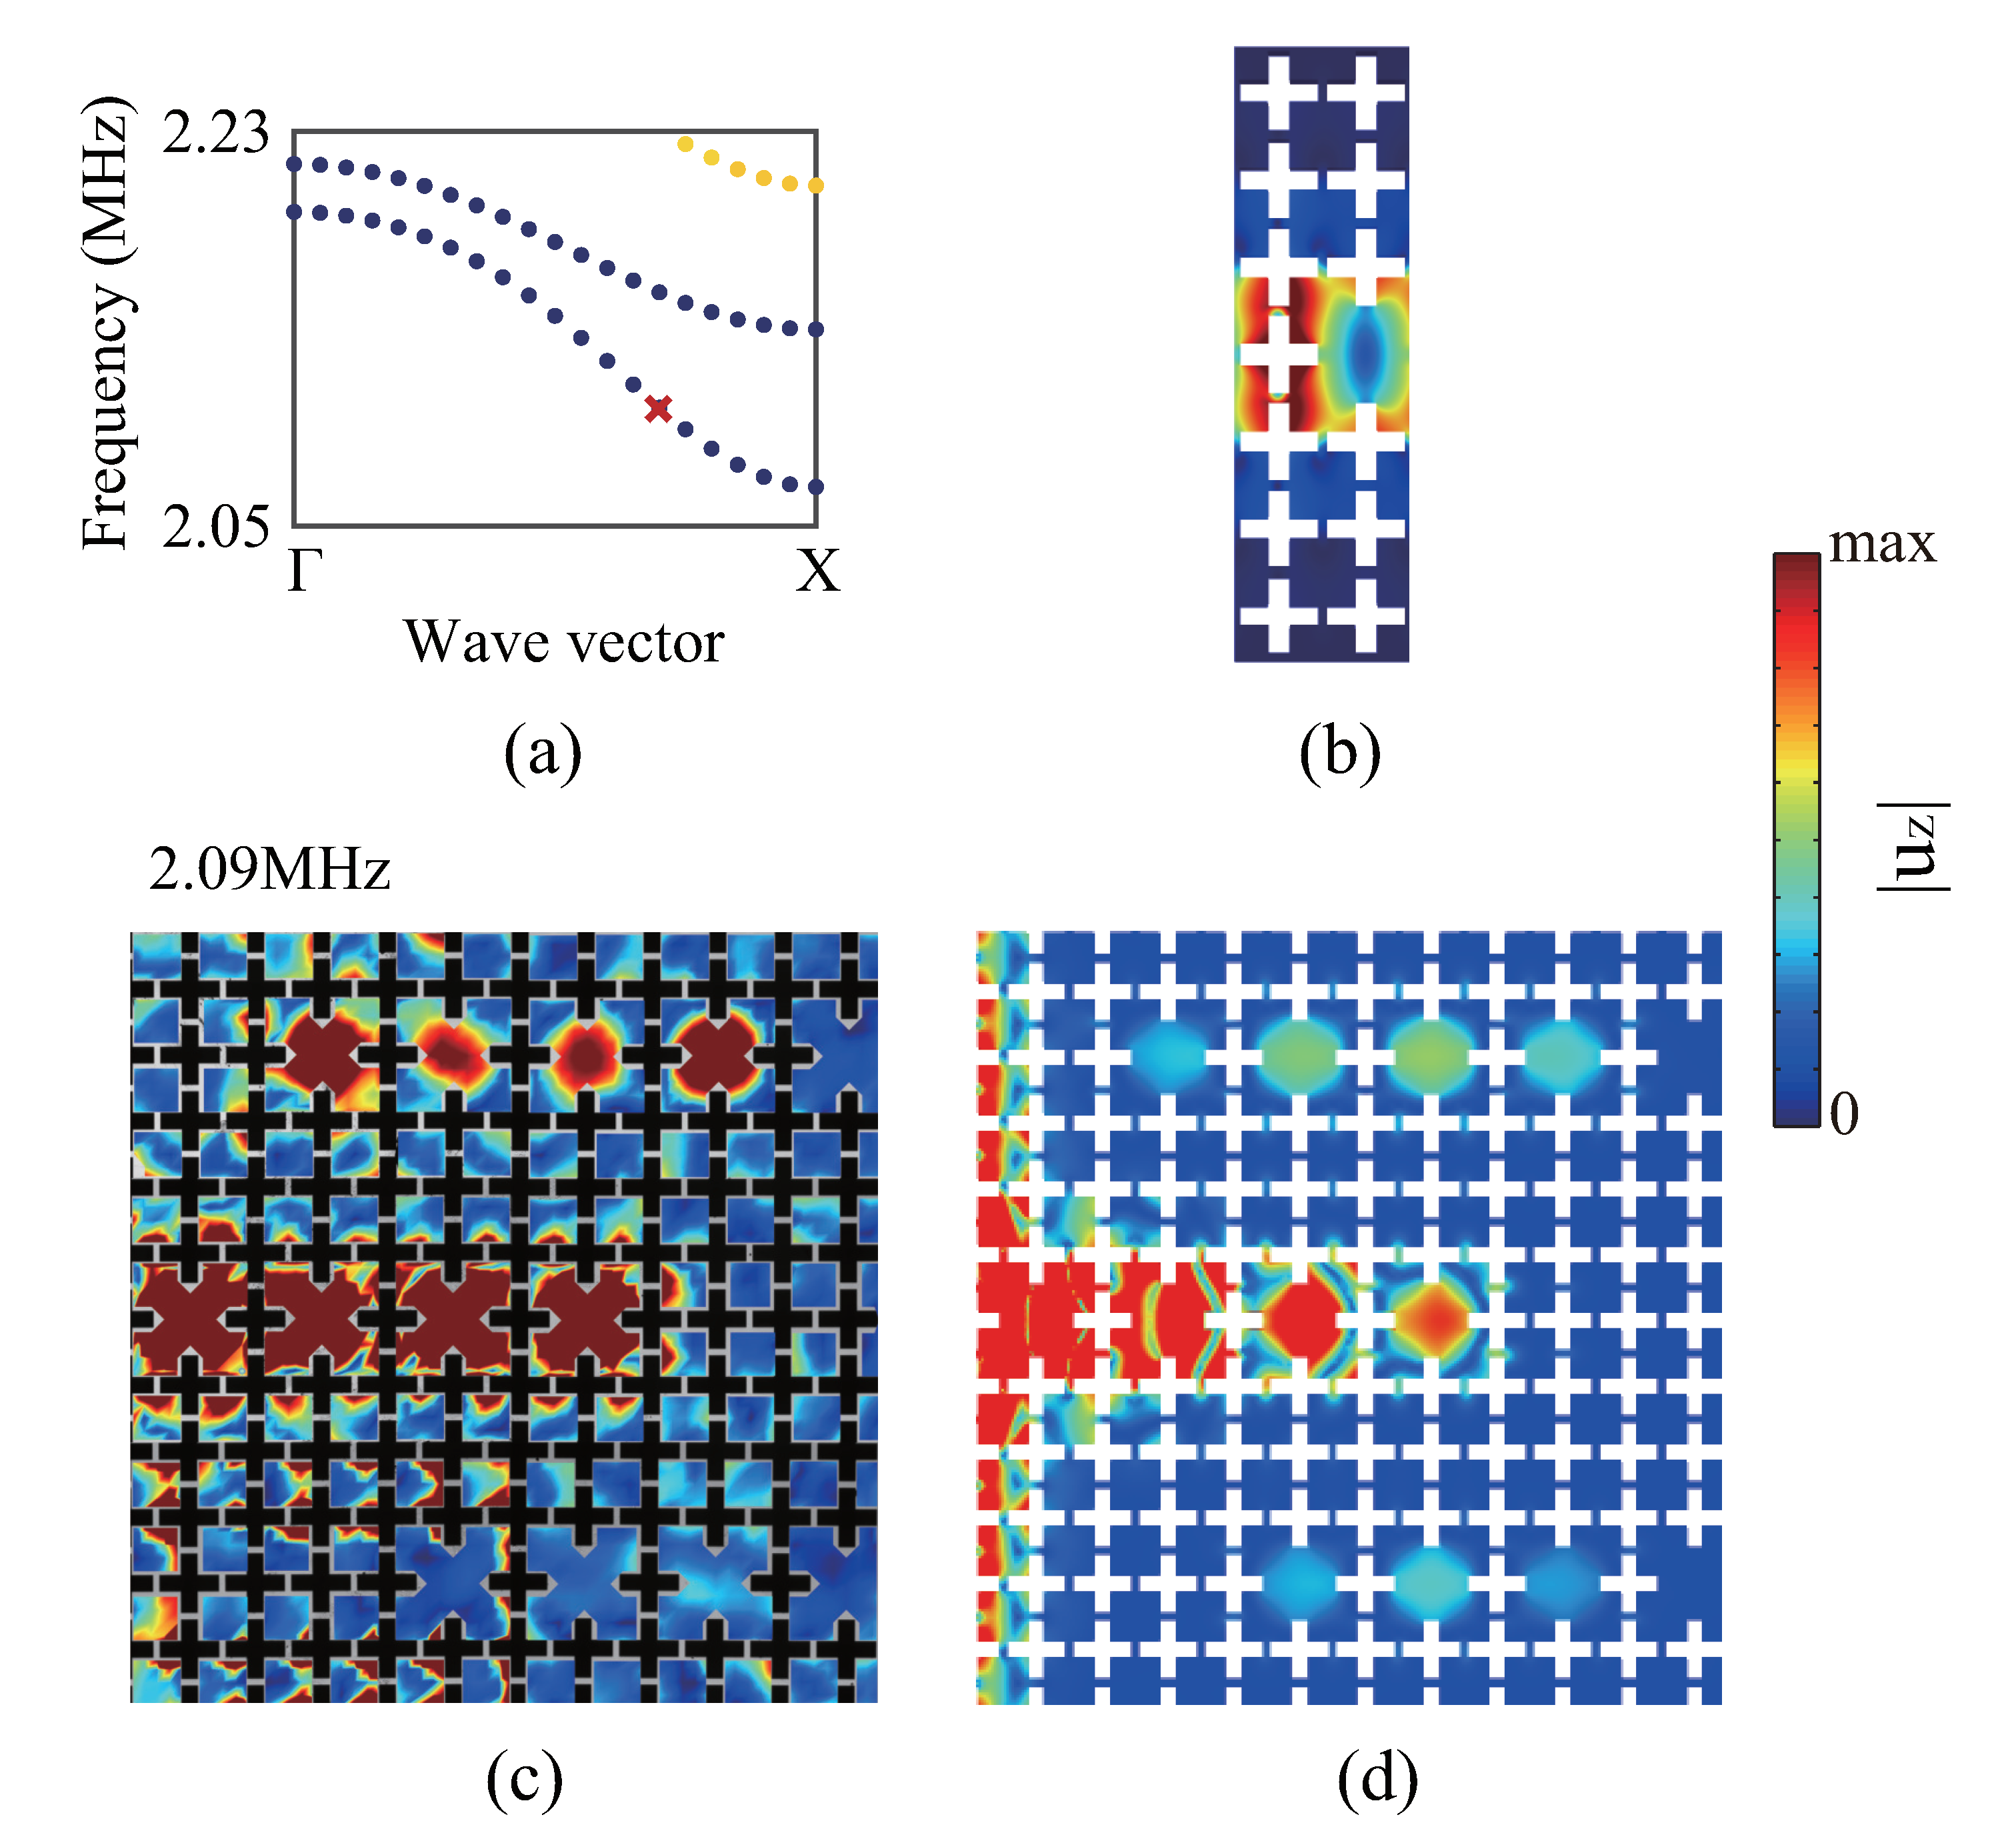
Before closing this paper, we mention an intriguing observation at frequency 2.09 MHz, reported in
Figure 5. At that frequency, the phononic band structure of
Figure 2 does not indicate the existence of out-of-plane polarized guided Bloch waves for the 2
a-separated CREW. In contrast, both experiment and numerical simulation indicate the existence of vibration peaks around that frequency. Including also in-plane waves, we show in
Figure 5a a close-up view of the phononic band structure. Two additional mostly in-plane polarized bands exist around 2.1 MHz, but the modal shape in
Figure 5b is not in agreement with the one observed experimentally in
Figure 5c and numerically in
Figure 5d, which rules out its contribution to the dynamical response. The numerical simulation in
Figure 5d suggests that the out-of-plane vibration excited in CREW cavity C1 may be evanescent (its amplitude decays smoothly from left to right). More investigations are necessary to fully understand the origin of the response at frequency 2.09 MHz, but it seems out of the scope of the dynamical model above.

 ,
, 


