Article

Variations in Sediment Grain Size from a Lake in the Tianshan Mountain of Central Asia: Implications for Paleoprecipitation Reconstruction

1
State Key Laboratory of Desert and Oasis Ecology, Xinjiang Institute of Ecology and Geography, Chinese Academy of Sciences, Urumqi 830011, China
2
Research Center for Ecology and Environment of Central Asia, Chinese Academy of Sciences, Urumqi 830011, China
3
University of Chinese Academy of Sciences, Beijing 100049, China
*
Author to whom correspondence should be addressed.
Appl. Sci. 2020, 10(19), 6793; https://doi.org/10.3390/app10196793
Submission received: 7 September 2020 / Revised: 21 September 2020 / Accepted: 27 September 2020 / Published: 28 September 2020
(This article belongs to the Section Earth Sciences)

Abstract

:
The Tianshan Mountain is the largest mountain range in Central Asia, and the source area of many river systems. Changes in precipitation result in significant alterations to regional hydrological processes. Lake sediment from the Tian Shan representative of the last 90 years was chosen as the object of this research study. The grain-size data were used in conjunction with instrumental data to provide a method for determining changes in paleoprecipitation. The results showed the three-point moving average curve of the silty fraction content with a size of 16 to 32 μm to be significantly consistent with the curve of total precipitation from April to September since 1950. The total content of clay and fine-silty fraction (0–16 μm) was clearly consistent with the monthly precipitation in July. The total precipitation from April to September showed a significant downward trend from 1930 to 1975, and then an overall increasing trend beginning in 1975, which may have been influenced by the North Atlantic Oscillation. The change in precipitation reconstructed by the grain size of lake sediments was significantly different from the high-resolution gridded datasets (Climatic Research Unit Time-Series version 4.04) because of the lack of data from meteorological stations in China before 1950. The conclusions of this study are significant for evaluating the validity of climatic research unit (CRU) data in arid areas of Western China. In addition, the results of this study serve as a bridge between modern instrumental records and long time-scale paleoclimate research and provide important reference values for future reconstructions of long time-scale paleoclimate.

1. Introduction

Located in the hinterland of Eurasia, the arid region of Central Asia has a typical continental arid climate and one of the most vulnerable terrestrial ecosystems [1]. A comprehensive understanding of the environmental issues resulting from climate change and human activities in Central Asia is of great significance for the ecological protection and improvement of the region, national security, and sustainable development of the social economy [2,3,4]. Over the past 100 years, air temperature in the arid region of Central Asia, which is mainly controlled by westerly winds, has clearly shown an increasing trend [5,6]. Annual precipitation in this region also shows an overall increasing trend, but with spatial differences [7,8]. Under the combined effect of climate change and human activities, regional surface processes are undergoing strong and brand-new changes, which are highlighted by changes in arid hydrological processes and consequent changes in the ecological environment [9,10,11].
The underlying surface structure of the arid region in Central Asia is complex, and a large number of mountain-oasis-desert systems exist in the region [12,13]. Water resources in arid regions typically originate in mountain systems. The Tian Shan comprises the largest mountain range in Central Asia, traversing the central part of Xinjiang in China, Kyrgyzstan, and Uzbekistan, and extending into four countries including Kazakhstan at the western end. Major rivers in Central Asia such as the Ili, Syr Darya, Amu Darya, Tarim, and Chu rivers all have their headwaters in the Tian Shan [14]. Within the context of global change, important changes in the climate and hydrology of the Tian Shan have occurred [2,4,11,14,15,16]. In particular, owing to the lack of weather monitoring stations in high-altitude areas such as the Tian Shan, there is a major knowledge gap regarding temperature and precipitation trends, and available data are typically poor and often unreliable, which has a negative impact on the ability to predict the occurrence and intensity of extreme weather events [17].
As modern instruments are not able to record historic climate changes, their data are representative of only a short period in the evolution of a climatic environment [18,19]. Some historically significant climate mutations and their environmental responses cannot be recorded by modern instruments, making it difficult to grasp the current state of environmental changes and to predict future trends [20,21]. On the one hand, the climate data has a relatively short time scale, e.g., climatic research unit (CRU) data began in 1901 [22]. On the other hand, since most of the weather stations in arid regions of China began to observe in the 1950s, the applicability of the CRU data covering Chia is also worthy of exploring. In recent years, many scholars in Central Asia have integrated tree rings into their studies [23,24,25,26,27,28,29,30] to recover and reconstruct long-term changes in temperature, precipitation, or humidity. Compared with tree rings, lake sediments effectively record information on lake hydrology, regional temperature, precipitation, and vegetation, and extracting climate information from lake records is one of the basic means for studying paleoclimate and paleoenvironment [31,32,33,34]. However, previous studies have not provided effective links between long-term paleoclimate reconstruction and modern investigations regarding climate and environmental parameters.
In this study, while focusing on the importance of environmental changes in the Tianshan Mountains and significant spatial heterogeneity of precipitation in this area, lake sediment representative of the last 100 years from a lake in the Tian Shan was chosen as the research object. In conjunction with instrument data, the sediment grain-size data from a lake in Tianshan Mountain were used to reconstruct the changes in paleoprecipitation over the past 90 years, which will provide an approach for reconstructing changes in paleoprecipitation over long-time scales.

2. Geographic Background

Lake Ta-Lung-Chi (Figure 1) is a freshwater lake with an altitude of 2402 m, located on the southern slope of the middle Tian Shan. The bedrocks in this region are mainly composed of carbonate sedimentary rocks, pyroclastics, mixed sedimentary rocks, and a small cover of intermediated plutonic [35]. The east-west length of the lake is ~2.6 km, the north-south width is ~0.6 km, the area is ~2 km2, and the deepest point is 5.5 m. The lake is mainly supplied by glacier melt water from the surrounding mountain and precipitation in the valley, which is blocked by the moraine embankment west of the lake. Glacial and snow-melt water are injected into the lake through the Muzilik River on the east side of Lake Ta-Lung-Chi. The lakeside area consists of dense grassland, with dense spruce forest in the south, spruce forest, bushes, and meadows on the western slope, and seasonal rivers and underflows in the western lake area; the northern mountains are relatively bare, with some low bushes. The lake has no obvious surface water outlets, but water passes through an underground underpass formed by gaps in the huge rock stacks under the final embankment, and enters Lake Hsiao-Lung-Chi downstream at ~1.4 km through infiltration. During the high-water period, water in Lake Hsiao-Lung-Chi overflows the west bank where a waterfall dropping 150 m forms. Overflow water from Lake Hsiao-Lung-Chi enters the Kuqa River through the river channel. Based on CRU data [22] (grid coordinates 42.0° N–42.5° N; 83.0° E–83.5° E, central coordinates 42.25° N, 83.25° E), the average annual temperature within this grid for the period 1960 to 2019 was 1.4 °C. The hottest month was July, with an average temperature of 14.7 °C; the coldest period was January, with an average temperature of −16.0 °C. The total annual precipitation was 159.4 mm; the average monthly precipitation was 25.6 mm, with the maximum precipitation occurring in May. The closest meteorological station to Lake Ta-Lung-Chi is Bayanbulak Station with an elevation of 2458 m. The average annual temperature recorded at Bayanbulak Station from 1960 to 2019 was 3.2 °C. The hottest month was July, with an average temperature of 18.3 °C; the coldest period was January, with an average temperature of −19.6 °C. The average precipitation for the period was 283.7 mm; the average monthly precipitation was 71.4 mm, with the maximum occurring in July.

3. Materials and Methods

In May 2018, a sedimentary core with 50-cm length (TLC01) (42.447775°, 83.285435°) was obtained from Lake Ta-Lung-Chi at a depth of 5.5 m using a gravity corer (UWITEC, Mondsee, Austria) fitted with a 60 mm internal diameter Perspex tube. The color of the core sediment is dark brown with no bedding structure. The core log was shown in Figure 2. The core was sampled in-situ at 1.0 cm intervals, and a total of 50 samples were obtained. The samples were analyzed at the Key Laboratory of Lakes and the Environment, Nanjing Institute of Geography and Limnology, Chinese Academy of Sciences.
The 137Cs specific activity was detected by an Ortec HPGe GWL series well-type, coaxial low background intrinsic germanium detectors (EG&G ORTEC, Oak Ridge, TN, USA). The procedure for measuring sediment grain size involved placing a small amount of sediment sample (about 0.3 g) into a 100 mL beaker, adding 20 mL of distilled water, and 10 mL of 10% hydrogen peroxide (H2O2). The sample was then heated and brought to a boil on a hot plate throughout which a wash bottle was used to continuously clean the beaker walls from substances deposited from the reaction foam. Once the sample was fully reacted following the complete decomposition of excess hydrogen peroxide, 10 mL of 10% hydrochloric acid was added and the beaker was removed upon boiling. Then, 100 mL of distilled water was added and left overnight, after which the distilled water was removed, the excess hydrochloric acid was washed off, and the sample was neutralized. Next, 20 mL of distilled water and 10 mL of potassium hexametaphosphate with a concentration of 0.05 mol/L were added to the sample and the beaker was placed in an ultrasonic cleaner and agitated for 15 min. Agitated samples were tested with a British Malvern Mastersizer 2000 laser particle size analyzer with a relative error of less than 1%.
The temperature (TMP) and precipitation (PRE) data were derived from Climatic Research Unit (CRU) Time-Series (TS) version 4.04 of high-resolution gridded data of month-by-month variation in climate (cru_ts_4.04) of the University of East Anglia in the United Kingdom, with a time range from 1901 to 2019 [22]. The monitoring data were obtained from the Meteorological Data Center of China Meteorological Administration. Sediment size analysis of the entire TLC01 core using an algorithm of end-member modelling analysis (EMMA) [38,39], which was used to extract geo-meaningful end members. The HYSPLIT model [40] was used to determine the possible source of water vapor. Global Data Assimilation System (GDAS) meteorological data (GDAS1) were downloaded from the National Centers for Environmental Prediction [41] for use in the HYSPLIT model, and the daily backward parcel trajectory for 48 h from April 2019 to September 2019 was calculated using MeteoInfo (TrajStat package) [42].

4. Results

4.1. Core Dating

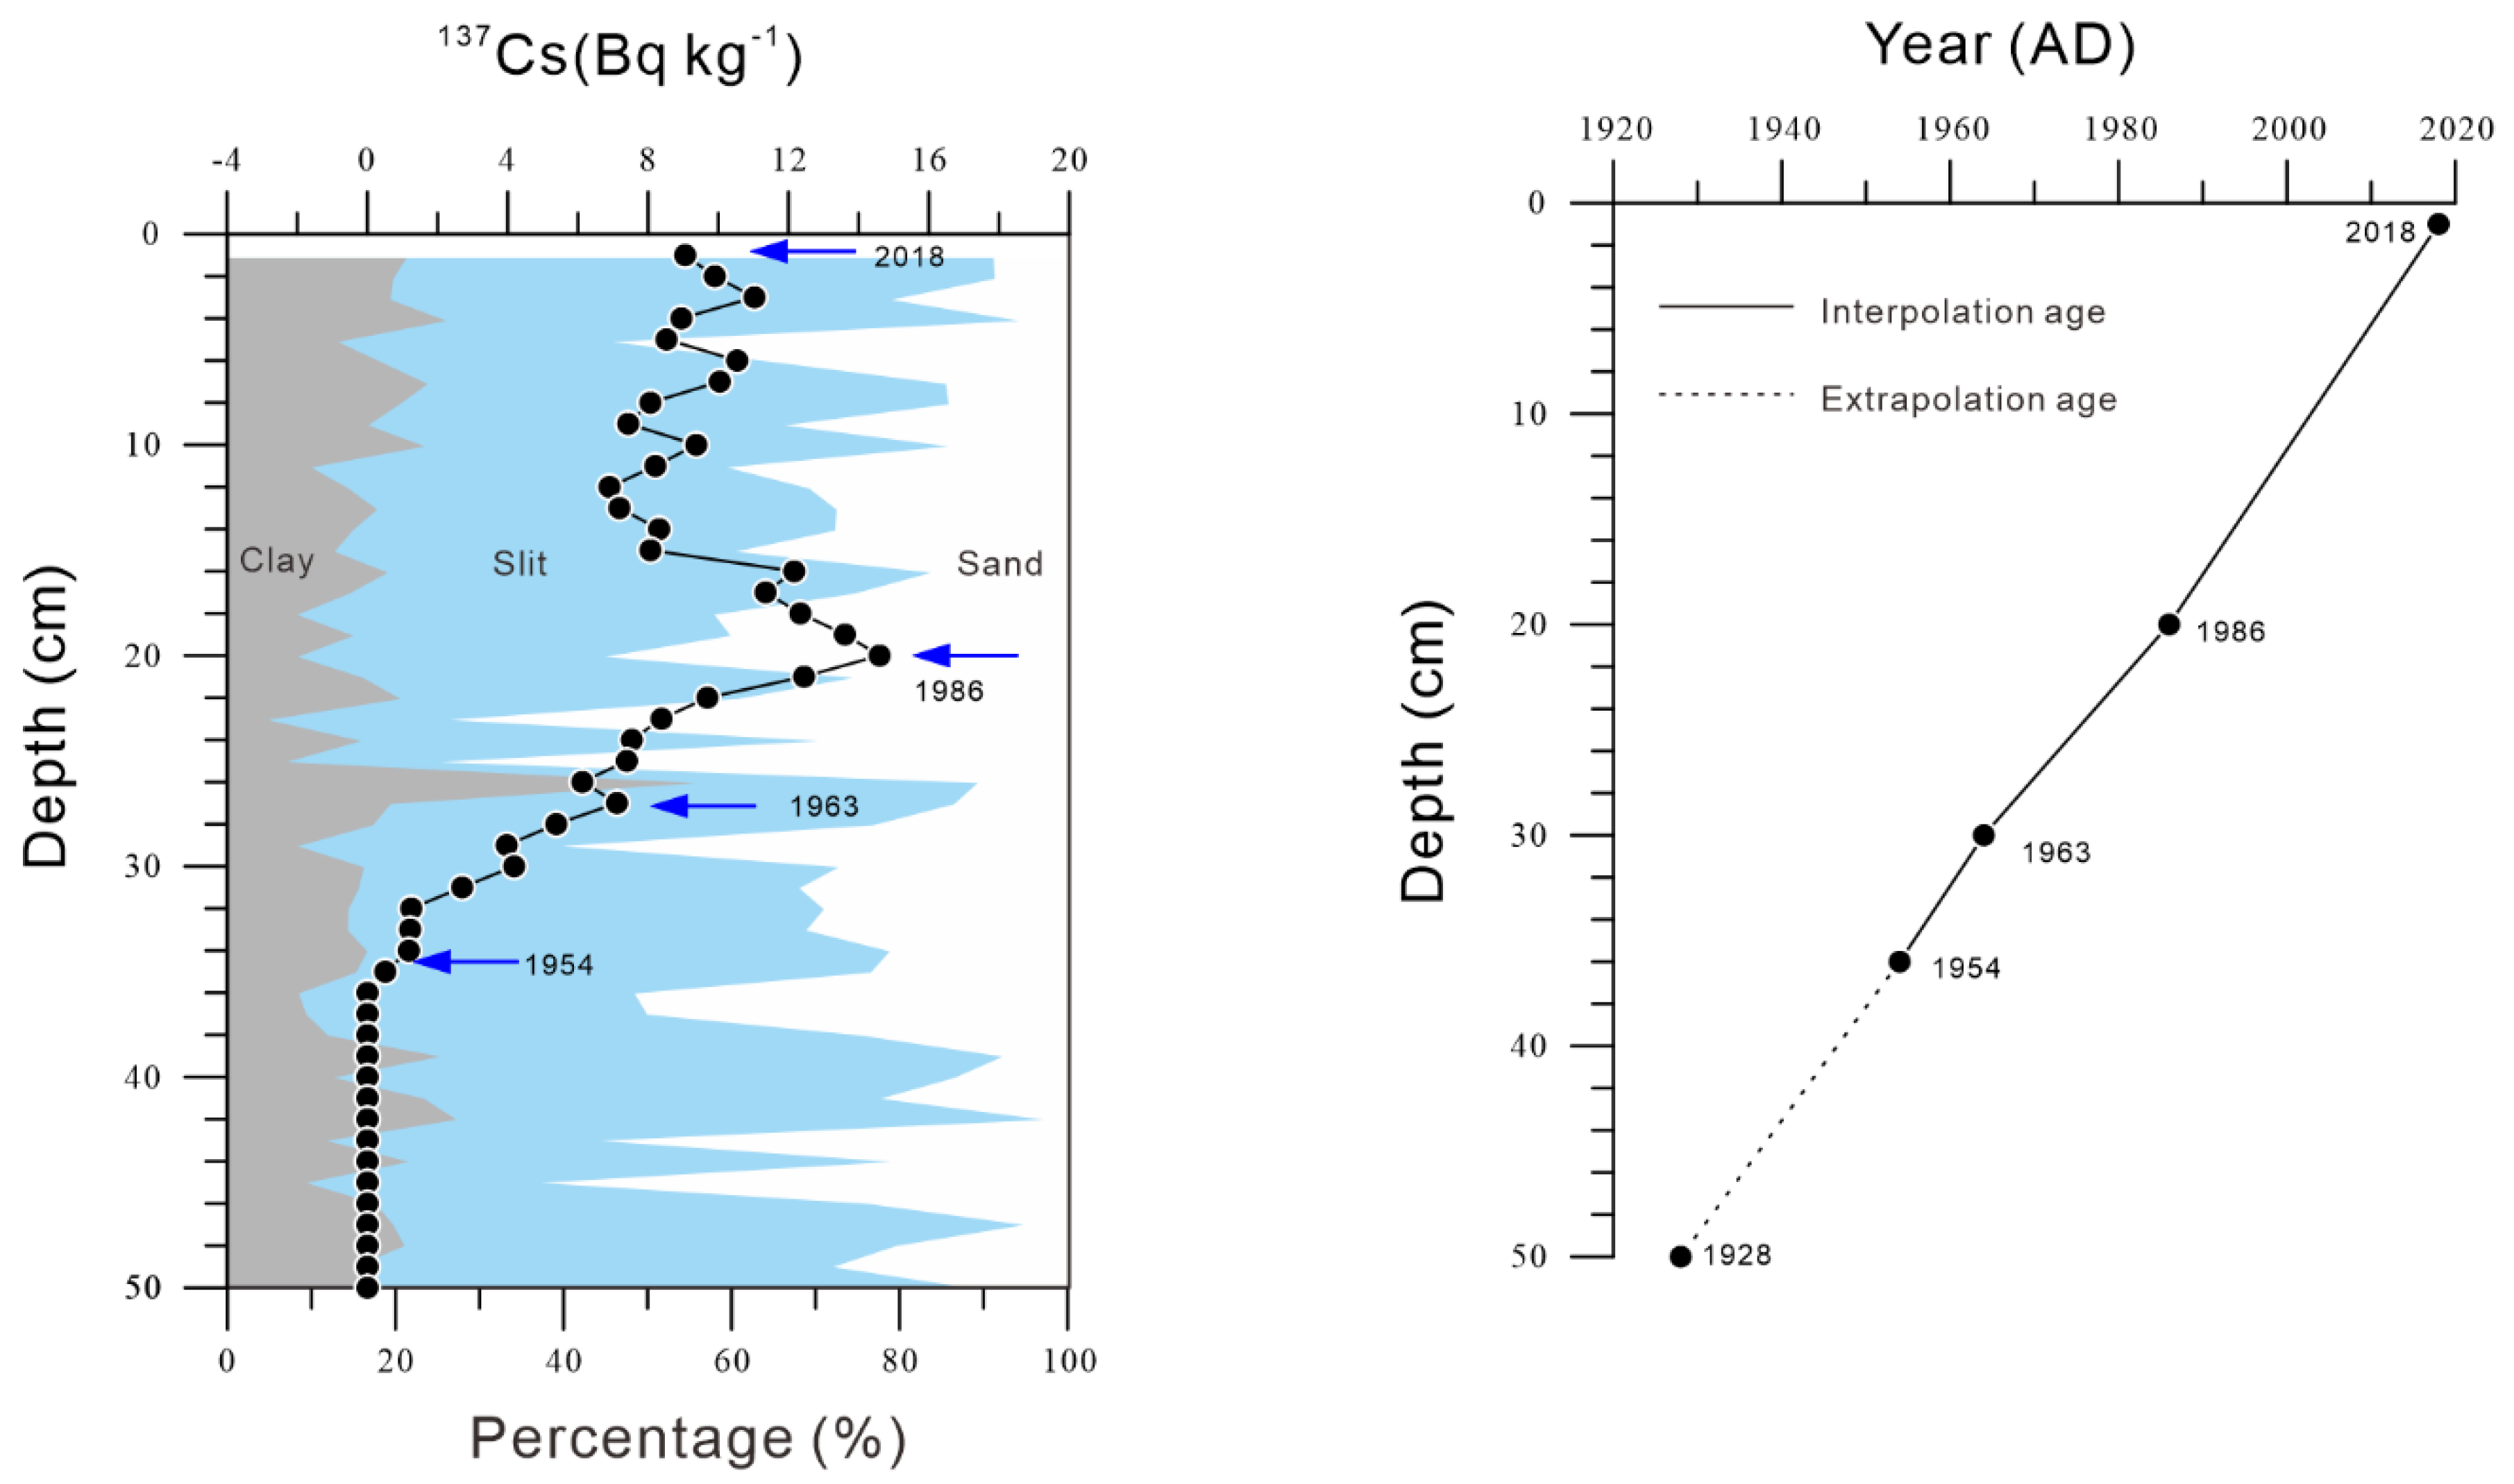
Variations in 137Cs specific activity with depth in the lake sediment core are shown in Figure 2. There is significant accumulation of 137Cs in the sediment core starting at a depth of 35 cm (0.51 Bq/kg) and peaking at 20 cm (14.60 Bq/kg). Based on the distribution of 137Cs in lake sediments within the northern hemisphere, it is believed that the occurrence of 137Cs residual layers corresponds to the start of global nuclear testing in 1954 [43], and the main peak at 20 cm may correspond to the Chernobyl nuclear leak in the former Soviet Union in 1986 [44,45]. The accumulation peak occurring between these depths corresponds to the global 137Cs scattering peak (30 cm) date to 1963 [46,47], and the sedimentation rate of sediments in core TLC01 was calculated based on this year. The average sedimentation rate in Lake Ta-Lung-Chi is about 0.55 cm/year. With the average sedimentation rate, the age for the bottom of the sediment is about 1928 (Figure 2).

4.2. Sediment Grain Size

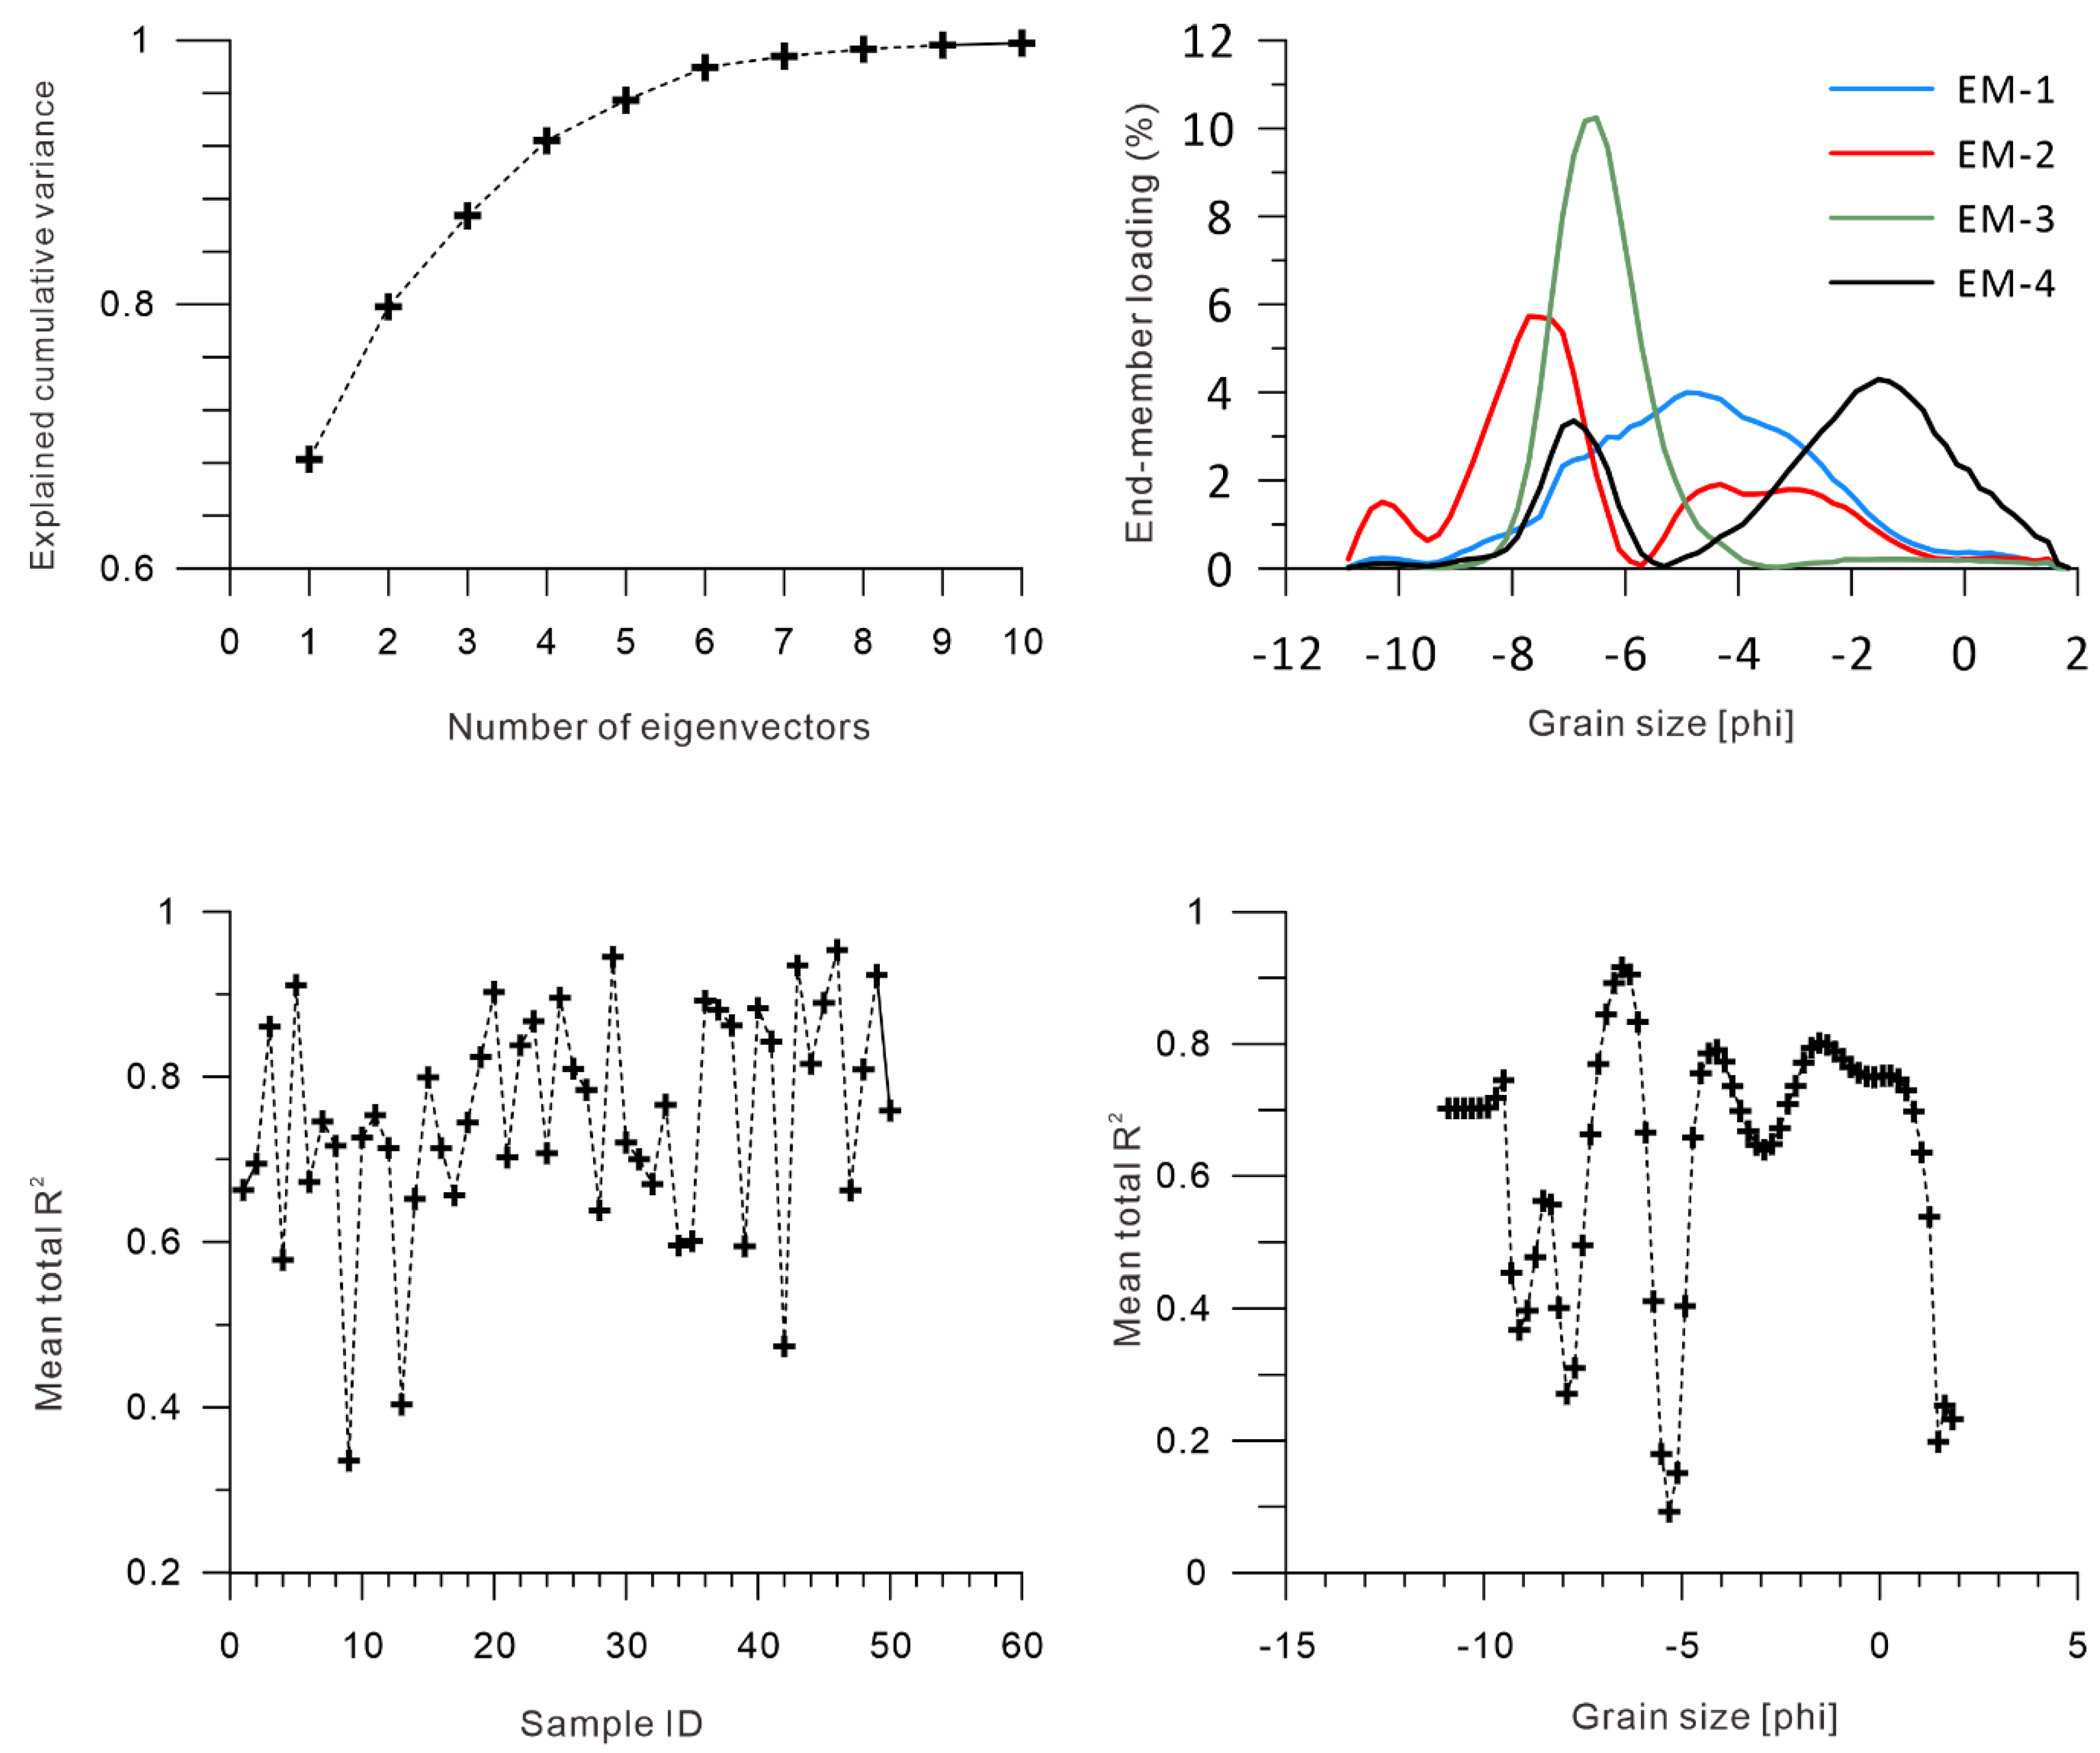
The grain size distributions of sediments in core TLC01 ranged from 0.28 to 1905.46 μm and displayed clear bimodal or multimodal styles (Figure 3). Sediment size analysis of the entire TLC01 core using an algorithm of end-member modelling analysis (EMMA) [38,39] showed that there are four relatively independent end-element components (EM1, EM2, EM3, and EM4); however, these four end-element components do not adequately express the entire granularity data sequence (Figure 4). These results indicate that the grain size of Lake Ta-Lung-Chi sediments reflect abundant environmental information.
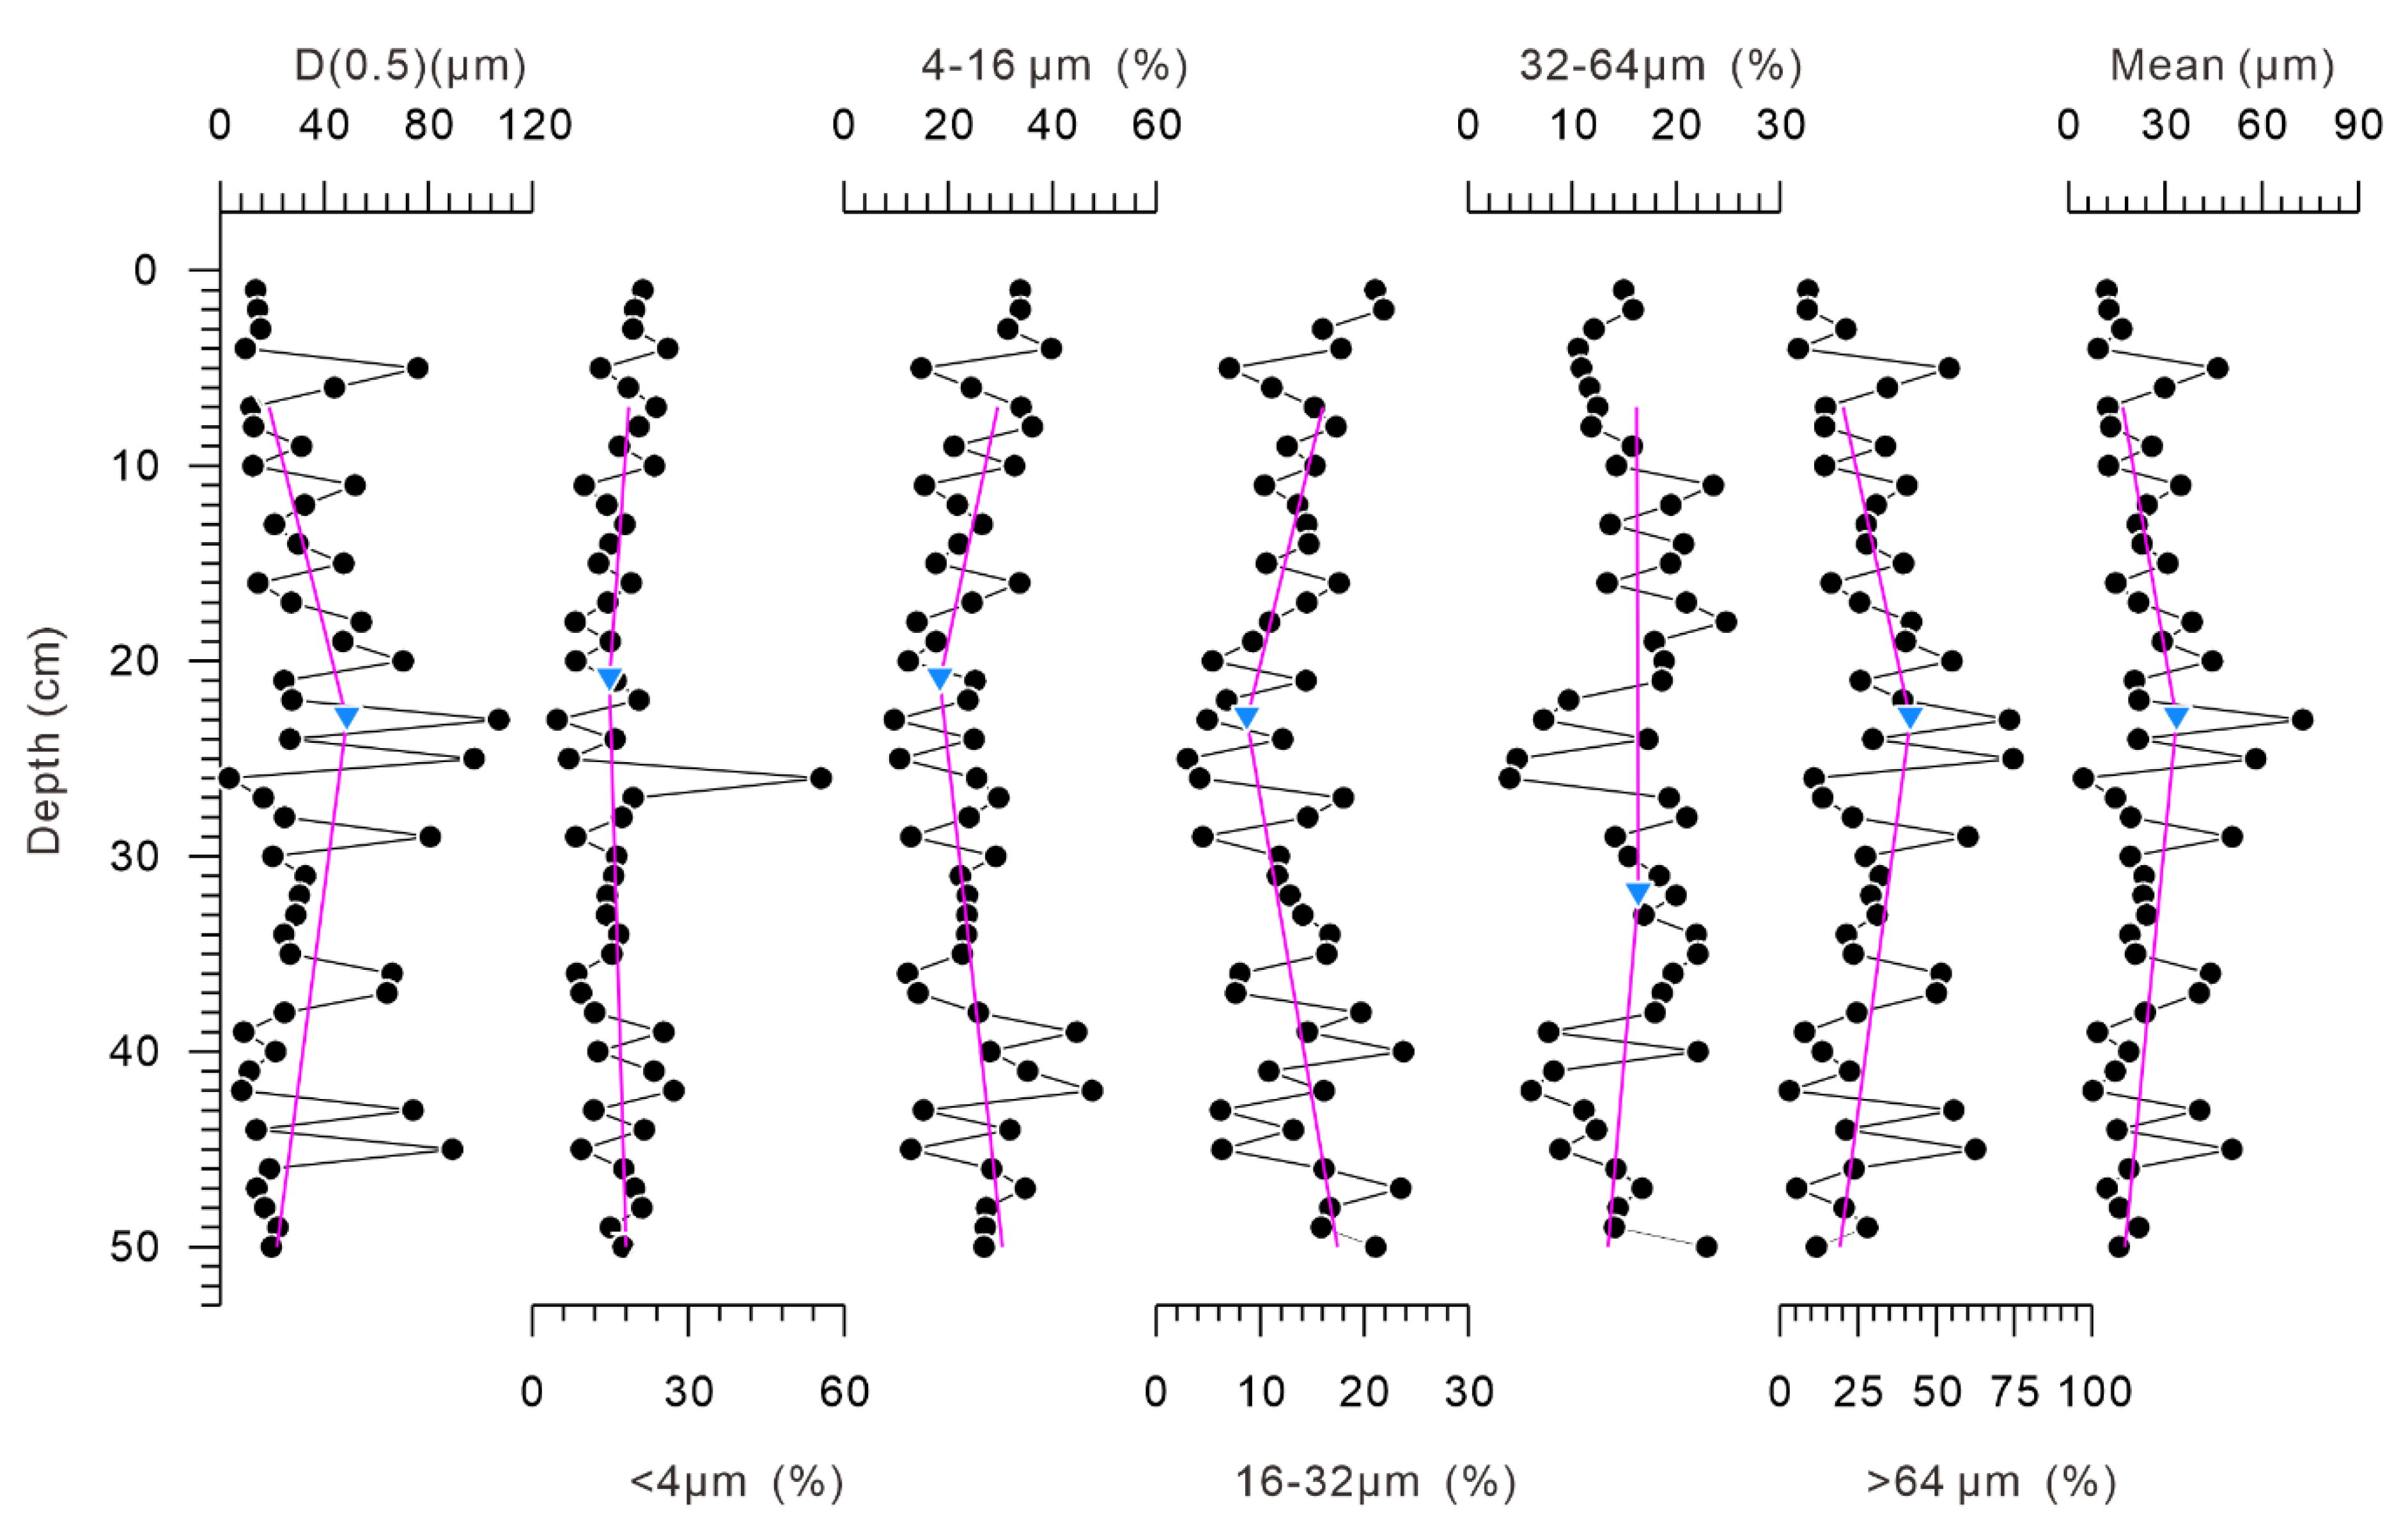
Following the Udden-Wentworth grain size scale [48,49], Lake Ta-Lung-Chi sediments were classified into five grain size components (Figure 5): clay fraction (<4 μm), fine-silty fraction (4–16 μm), silty fraction (16–32 μm), coarse-silty fraction (32–64 μm), and sandy fraction (>64 μm. Overall, the TLC01 sediment core was mainly composed of medium and fine particles. Clay fraction components comprised 4.78% to 55.56% of the particles with an average value of 16.94%, fine-silty fraction components comprised 9.60% to 47.71% (average 25.03%), silty fraction components comprised 2.99% to 23.77% (average 13.24%), coarse-silty fraction components comprised 3.98% to 24.81% (average 15.37%), and sandy fraction components comprised 2.89% to 74.63% (average 29.42%). The median diameter D(0.5) was 3.39 to 107.15 μm, with an average value of 33.67 μm. The mean grain size (Mz) was calculated using the expression defined by Fokker and Ward [50]: Mz = (Φ16 + Φ50 + Φ84)/3, where Φx is the grain diameter phi units at the cumulative percentile value of x. The median diameter D(0.5) was 4.66 to 72.71 μm, with an average value of 24.71 μm. Once calculated, the mean grain size was converted to a metric unit (μm).
The trend depicted by component 4.0–16.0 μm in sediment core TLC01 was generally consistent with changes in component 16.0–32.0 μm, but opposite to changes noted in component >64.0 μm. The median particle size was consistent with the average particle size and with changes in component >64.0 μm. Following the analysis of Piecewise linear fitting and trend changing points [51,52], the vertical trends noted for each particle size could be divided into two stages, but the trend changing points differed between particle sizes (Figure 5). The trend changing points for the median diameter, mean value, silty fraction (16–32 μm), and sandy fraction (>64 μm) all occurred at a depth of 23 cm. The trend changing points for clay fraction (<4 μm) and fine-silty fraction (4–16 μm) occurred at a 21-cm depth. The trend changing point for coarse-silty fraction (32–64 μm) was at 32 cm, which differed from the other grain sizes. Taking the vertical change in the fine-silty fraction content of 4–16 μm as an example, with increasing depth below the trend changing point at 21 cm, the content tended to increase. However, above the trend changing point, the content decreased with increasing depth.

5. Discussion

Although EMMA is a very effective grain-size research tool [39,53,54,55,56], through the result, the end-member model cannot effectively extract the grain size components affected by a single geological action (Figure 4). The grain size of the lake sediments was affected by the combined effects of multiple external stresses, or the strength of the same force has large fluctuations. Although the end member model has wide applicability [57,58], it is not an effective method to conduct research in this region. Existing studies have shown that the size characteristics of lake sediments are sensitive to the regional climatic environment [59,60,61]. In humid-semi-humid regions, on inter-annual and 10-year scales, coarse-grained sediments indicate wet years with heavy rainfall while fine-grained sediments indicate dry years with low rainfall [60]. During the process of lake sedimentation, changes in rainfall affecting the intensity of surface runoff can also determine to a considerable extent the amounts of coarse and terrigenous clastic materials entering the lake. In years with heavy rainfall, the capacity of surface runoff for erosion and transport is enhanced, and the sediment particle size in the runoff is increased; in dry years with low rainfall, surface runoff is low, making it difficult to transport coarse particulate matter to the lake, and the sediment particle size in the runoff decreases [62,63]. In arid and semi-arid regions, during humid periods, precipitation is high, lake water levels are high, and the sediment particles are coarse [64]. In summary, grain size of lake sediments can provide environmental information about lake runoff, which indirectly reflected the variation in the regional climate [61]. Studies on grain size in arid regions can also reveal the frequency and intensity of sandstorms that have occurred in the past [65,66], e.g., lakes in the Tibetan Plateau [59], Lake Chaiwopu, Xinjiang Province, China [67], Lop Nur, Tarim Basin, northwestern China [68], San Juan Mountains, Colorado [69], and Lake Hongjiannao, Shaanxi Province, China [70], all of which indicate that the debris transported by wind in arid areas is also a source of sediments to lakes. Through this research on Lake Ta-Lung-Chi in the Tian Shan, it was found that lake sediment size data can reflect regional climate change information.
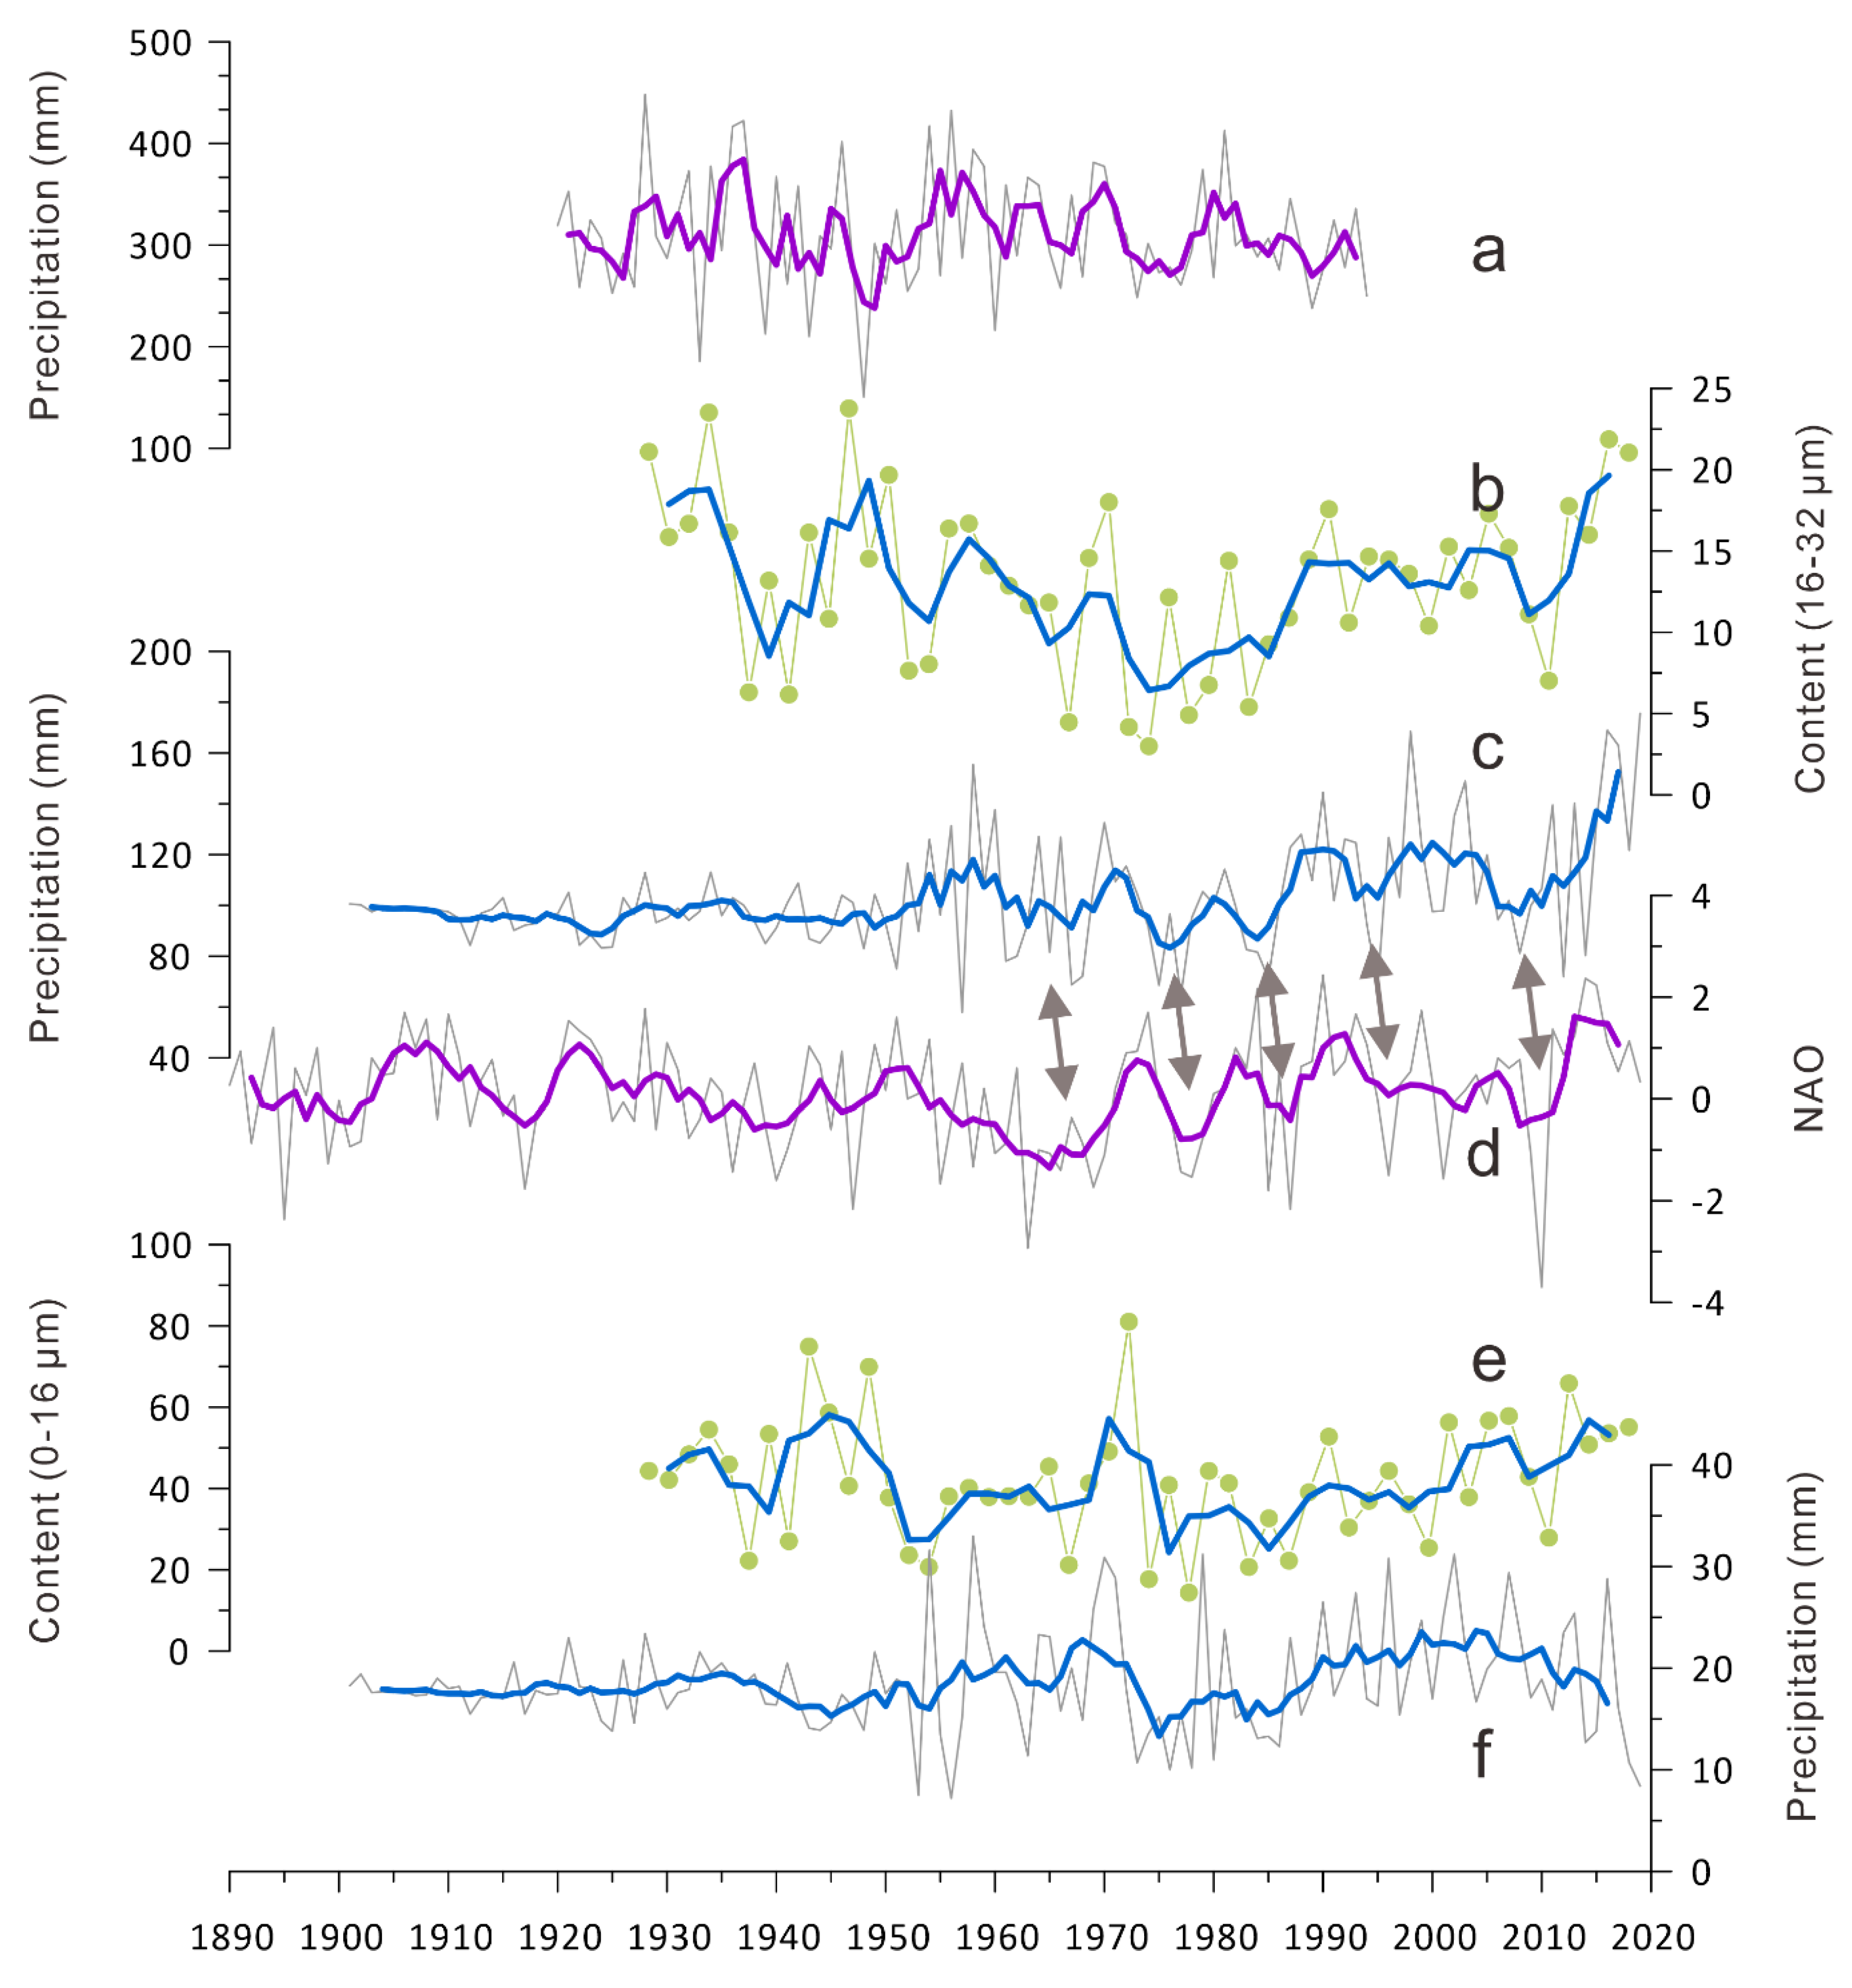
Because the CRU data are based on data from existing meteorological monitoring stations, it was possible to reconstruct a complete set of high-resolution, monthly average surface climate data for the period 1901 to 2019 covering an area of 0.25° × 0.25° that includes all land types [22]. The weather station serving the area where Lak Ta-Lung-Chi is located in the middle of the Tian Shan is shown in Figure 1 [22]. The earliest record of meteorological stations in China related to the study of Lake Ta-Lung-Chi is from 1951. Therefore, it is necessary to verify whether the CRU precipitation data from before 1951 [22] are credible. Through this study, it was found that the three-point moving average curve of the silty fraction content (16–32 μm) was significantly consistent with the curve of total precipitation from April to September since 1950 (Figure 6). The results suggested that the grain size of Lake Ta-Lung-Chi in the Tianshan Mountains sensitively recorded the information of precipitation changes. The proxies that are sensitive to precipitation changes in lake sediments are different in different regions, for example, biomarker compounds [34,71,72], Rb/Sr ratios [73], and magnetic susceptibility [74] are sensitive to changes in precipitation in some regions. In addition, the environmental information reflected by the grain size of lake sediments in different regions is also different, for example, it can reflect wind intensity and dust transport [75,76], riverine input [77] and lake water level changes [78]; however, it can be used as a useful indicator for quantitative reconstruction of long-term paleoprecipitation in the region of Lake Ta-Lung-Chi in Tianshan Mountains. The total precipitation from April to September showed a significant downward trend from 1930 to 1975, after which an overall increasing trend began. What caused this change? The study area is located in the mid-latitude zone, which is affected by westerlies, and the change in the North Atlantic Oscillation (NOA) is closely related to westerly intensity [79,80]. From the Figure 6, it was an interesting phenomenon that the precipitation change in the study region may be affected by the NAO, which showed that there is a certain correspondence between the Monthly North Atlantic Oscillation Index (station-based, December, January, and February) [81,82] and the precipitation curve reconstructed since 1930 in this study. The North Atlantic Oscillation Index is positively correlated with the westerly wind intensity [83], indicating that more water vapor is brought to the study area with increasing westerly winds, which may result in more precipitation. However, existing studies have shown that the precipitation in Central Asia and NAO have an anti-phased relationship on interannual to multi-centennial time scales [19,84,85]. The impact mechanism of the North Atlantic Oscillation on climate change in the Tianshan Mountains and even Central Asia may be different at different time scales, which is worthy of further discussion in the future.
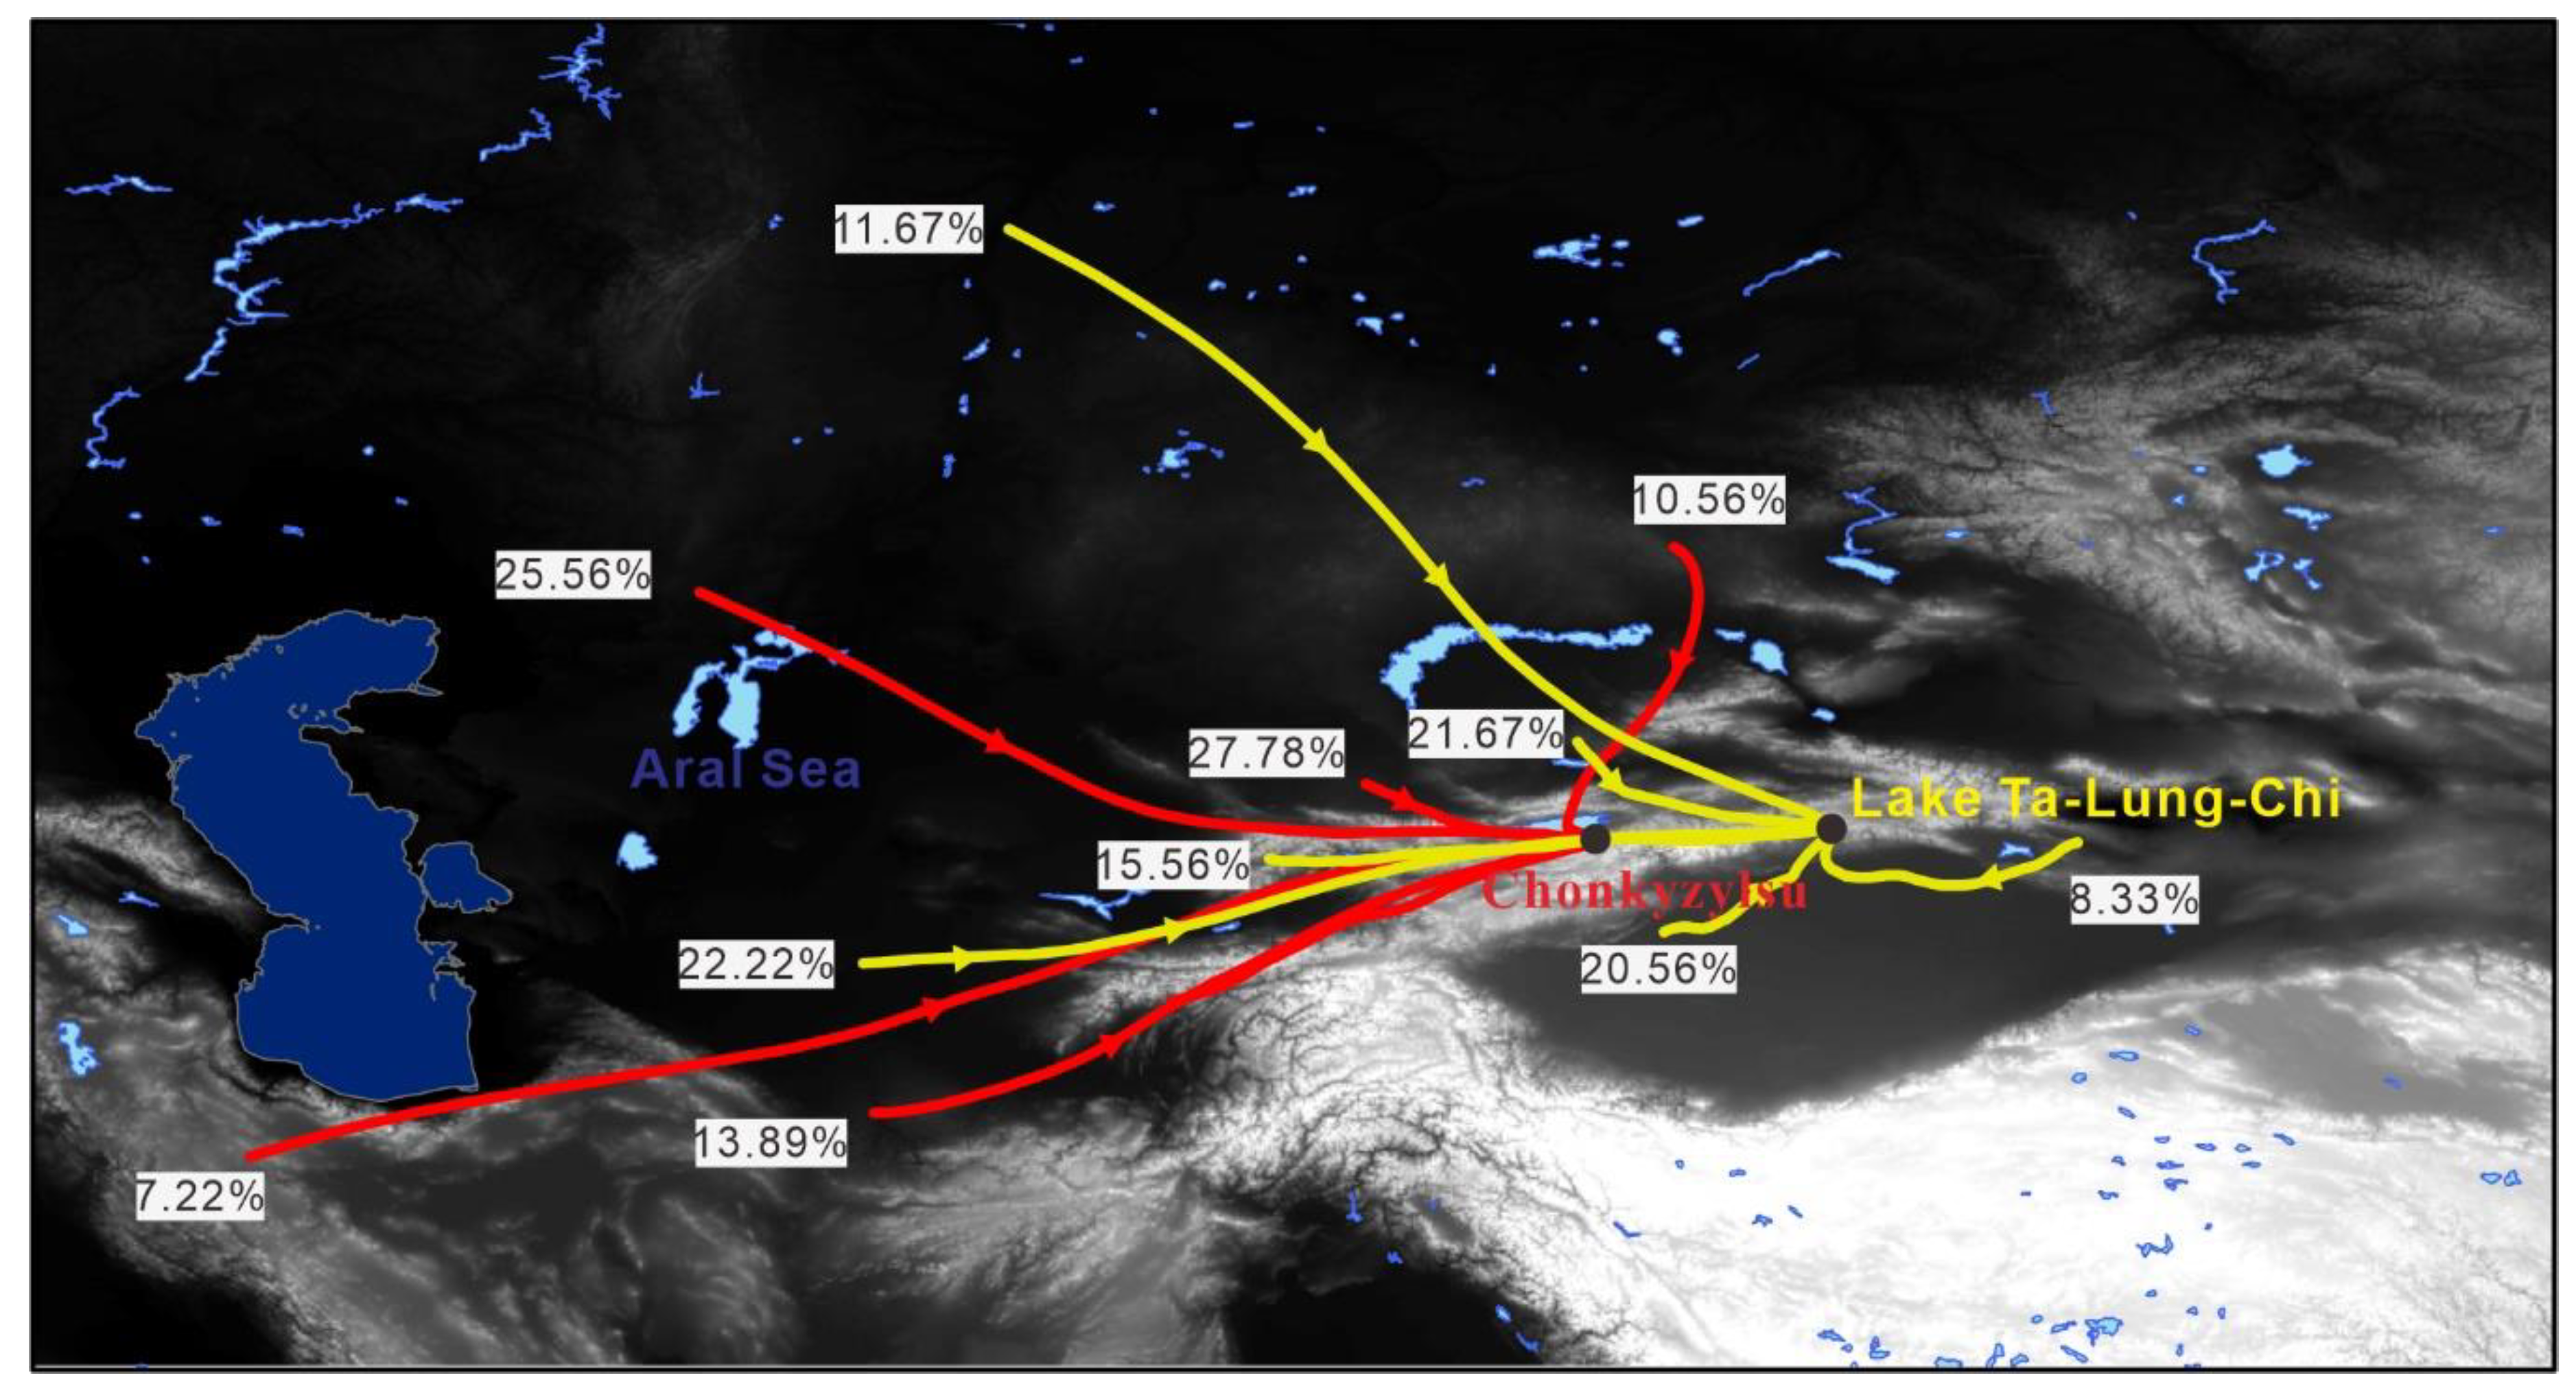
From the Figure 6, 1951 years ago, the reconstructed precipitation from April to September are inconsistent with the change from the CRU data, which was mainly because the earliest instrumental records of weather stations of China started at 1951 [86] (Figure 1), and thus the data before 1951 in this region were mainly calculated based on data from weather stations in the western section of the Tian Shan (within Kyrgyzstan, Figure 1). By comparing the data from our study area to data from a meteorological station (Chonkyzylsu, 42.20° N, 78.19° E; 1883–1996) in the Tian Shan [86], it can be seen that there is a large difference in precipitation between central Tian Shan and the region of Lake Ta-Lung-Chi in western Tian Shan. What is the reason for this difference? The main influencing factor of precipitation is the source of water vapor. The HYSPLIT analysis showed that water vapor sources in the region of Lake Ta-Lung-Chi (42.45° N, 83.29° E) from April to September are not only affected by westerlies blowing from west to east, but also in part by winds blowing from east to west (8.33%) and from north to south (20.56%), which infers a local effect to water vapor transmission (Figure 7). At Chonkyzylsu station (42.20° N, 78.19° E), apart from the 10.56% of water vapor transmitted from north to south, the rest of the water vapor is transmitted from west to east (Figure 7). There are obvious differences between the two regions, which may be one of the reasons for the differences noted in precipitation.
The contents of clay fraction (<4 μm) and fine-silty fraction (4–16 μm) particles in Lake Ta-Lung-Chi sediments show a significant positive linear correlation (R2 = 0.85, p < 0.0001), indicating that these components are influenced by the same factors. Furthermore, it was found that the total content of clay and fine-silty fraction (0–16 μm) particles are clearly consistent with the monthly precipitation in July (Figure 6). However, during the 1940s and since 2000, the relationship between this particle content (0–16 μm) and July precipitation has been more complicated. Through previous research, it has been found that the sources of lake sediments in arid areas are not limited to surface runoff within the basin, and that atmospheric dust also represents an important source of lake sediments. In addition to this, studies on grain size in arid regions can reveal the frequency and intensity of sandstorms that have occurred in the past [65,66], e.g., lakes in the Tibetan Plateau [59], Lake Chaiwopu, Xinjiang Province, China [67], Lop Nur, Tarim Basin, northwestern China [68], San Juan Mountains, Colorado [69], and Lake Hongjiannao, Shaanxi Province, China [70], all of which show that the debris transported by wind in arid areas is also a source of lake sediments. A large amount of modern dustfall grain size data shows that the modal grain size of modern atmospheric dustfall materials is about 20 μm [69,88]. Therefore, some of the land-based materials in Lake Ta-Lung-Chi sediments less than 16 μm in size may also come from atmospheric dustfall, which may be the reason for the inconsistency observed between the variation curve of sediment content smaller than 16 μm and precipitation in the study area in July.

6. Conclusions

By analyzing the characteristics of particle size in the sediments from Lake Ta-Lung-Chi in the Tian Shan, the possibility of using sediment grain size to reconstruct past changes of regional precipitation was discussed. The following conclusions are drawn.
The core sediment (TLC01) with 50-cm length extracted from Lake Ta-Lung-Chi recorded the environmental changes covering over the past 90 years (1928–2018). The average sedimentation rate is about 0.55 cm year−1, and the average content of clay fraction (<4 μm), fine-silty fraction (4–16 μm), silty fraction (16–32 μm), coarse-silty fraction (32–64 μm), and sandy fraction (>64 μm) was 16.94%, 25.03%, 13.24%, 15.37%, and 29.42%, respectively.
The grain size of lake sediments in the Tianshan Mountains sensitively reflects the changes in precipitation in the basin, and it can be used as a useful indicator for quantitative reconstruction of long-term paleoprecipitation. The three-point moving average curve of silty fraction (16–32 μm) content is significantly consistent with the total precipitation curve from April to September since 1950. The total content of clay and fine-silty fraction (0–16 μm) is clearly consistent with the monthly precipitation in July.
The reconstructed precipitation (1950 years ago) with grain size of lake sediments was significantly different from the CRU database, which was due to the lack of meteorological data from monitoring stations in China before 1950, The total precipitation from April to September showed a significant downward trend from 1930 to 1975, and an overall increasing trend began in 1975.

Author Contributions

Conceptualization, L.M. and J.A.; methodology, L.M. and Z.H.; validation, L.M. and J.A.; investigation, L.M. and W.L.; data curation, W.L.; writing—original draft preparation, L.M. and W.L.; writing—review and editing, L.M. and J.A.; visualization, W.L.; project administration, L.M. and J.A.; funding acquisition, L.M., and J.A. All authors have read and agreed to the published version of the manuscript.

Funding

This research was funded by the National Natural Science Foundation of China (U1903115), West Light Foundation of Chinese Academy of Sciences (2016−QNXZ−A−4), Tianshan Youth Project of Xinjiang Uygur Autonomous Region of China (2018Q008) and the high-level training project of Xinjiang Institute of Ecology and Geography, CAS (E050030101).

Acknowledgments

We thank the two anonymous reviewers for their professional comments and detailed suggestions, which significantly improved our manuscript. The meteorological data collected at the Bayanbulak Meteorological station for the study were obtained from the China Meteorological Data Service Center (http://data.cma.cn/).

Conflicts of Interest

The authors declare no conflict of interest.

References

  1. Li, D.; Wu, S.; Liu, L.; Zhang, Y.; Li, S. Vulnerability of the global terrestrial ecosystems to climate change. Global Chang. Biol. 2018, 24, 4095–4106. [Google Scholar] [CrossRef] [PubMed]
  2. Sorg, A.; Bolch, T.; Stoffel, M.; Solomina, O.; Beniston, M. Climate change impacts on glaciers and runoff in Tien Shan (Central Asia). Nat. Clim. Chang. 2012, 2, 725–731. [Google Scholar] [CrossRef]
  3. Marchenko, S.S.; Gorbunov, A.P.; Romanovsky, V.E. Permafrost warming in the Tien Shan Mountains, Central Asia. Global Planet. Chang. 2007, 56, 311–327. [Google Scholar] [CrossRef]
  4. Li, Q.; Yang, T.; Zhou, H.; Li, L. Patterns in snow depth maximum and snow cover days during 1961–2015 period in the Tianshan Mountains, Central Asia. Atmos. Res. 2019, 228, 14–22. [Google Scholar] [CrossRef]
  5. Hu, Z.; Zhang, C.; Hu, Q.; Tian, H. Temperature Changes in Central Asia from 1979 to 2011 Based on Multiple Datasets. J. Clim. 2014, 27, 1143–1167. [Google Scholar] [CrossRef]
  6. Davi, N.K.; D’Arrigo, R.; Jacoby, G.C.; Cook, E.R.; Anchukaitis, K.J.; Nachin, B.; Rao, M.P.; Leland, C. A long-term context (931–2005 C.E.) for rapid warming over Central Asia. Quat. Sci. Rev. 2015, 121, 89–97. [Google Scholar] [CrossRef] [Green Version]
  7. Chen, F.; Huang, W.; Jin, L.; Chen, J.; Wang, J. Spatiotemporal precipitation variations in the arid Central Asia in the context of global warming. Sci. China-Earth Sci. 2011, 54, 1812–1821. [Google Scholar] [CrossRef]
  8. Luo, M.; Liu, T.; Meng, F.; Duan, Y.; Bao, A.; Frankl, A.; De Maeyer, P. Spatiotemporal characteristics of future changes in precipitation and temperature in Central Asia. Int. J. Climatol. 2019, 39, 1571–1588. [Google Scholar] [CrossRef]
  9. Lioubimtseva, E.; Henebry, G.M. Climate and environmental change in arid Central Asia: Impacts, vulnerability, and adaptations. J. Arid. Environ. 2009, 73, 963–977. [Google Scholar] [CrossRef]
  10. Li, Y.; Tao, H.; Su, B.; Kundzewicz, Z.W.; Jiang, T. Impacts of 1.5 °C and 2 °C global warming on winter snow depth in Central Asia. Sci. Total Environ. 2019, 651, 2866–2873. [Google Scholar] [CrossRef]
  11. Hao, X.; Ma, H.; Hua, D.; Qin, J.; Zhang, Y. Response of ecosystem water use efficiency to climate change in the Tianshan Mountains, Central Asia. Environ. Monit. Assess. 2019, 191, 561. [Google Scholar] [CrossRef] [PubMed]
  12. Wei, H.; Liu, H.; Xu, Z.; Ren, J.; Lu, N.; Fan, W.; Zhang, P.; Dong, X. Linking ecosystem services supply, social demand and human well-being in a typical mountain–oasis–desert area, Xinjiang, China. Ecosyst. Serv. 2018, 31, 44–57. [Google Scholar] [CrossRef]
  13. Wei, H.; Xu, Z.; Liu, H.; Ren, J.; Fan, W.; Lu, N.; Dong, X. Evaluation on dynamic change and interrelations of ecosystem services in a typical mountain-oasis-desert region. Ecol. Indic. 2018, 93, 917–929. [Google Scholar] [CrossRef]
  14. Yang, T.; Li, Q.; Ahmad, S.; Zhou, H.; Li, L. Changes in Snow Phenology from 1979 to 2016 over the Tianshan Mountains, Central Asia. Remote Sens. 2019, 11, 499. [Google Scholar] [CrossRef] [Green Version]
  15. Aizen, V.B.; Aizen, E.M.; Melack, J.M.; Dozier, J. Climatic and hydrologic changes in the Tien Shan, central Asia. J. Clim. 1997, 10, 1393–1404. [Google Scholar] [CrossRef]
  16. Hagg, W.; Braun, L.N.; Kuhn, M.; Nesgaard, T.I. Modelling of hydrological response to climate change in glacierized Central Asian catchments. J. Hydrol. 2007, 332, 40–53. [Google Scholar] [CrossRef] [Green Version]
  17. Xenarios, S.; Gafurov, A.; Schmidt-Vogt, D.; Sehring, J.; Manandhar, S.; Hergarten, C.; Shigaeva, J.; Foggin, M. Climate change and adaptation of mountain societies in Central Asia: Uncertainties, knowledge gaps, and data constraints. Reg. Environ. Chang. 2019, 19, 1339–1352. [Google Scholar] [CrossRef]
  18. Chen, F.; Chen, J.; Huang, W.; Chen, S.; Huang, X.; Jin, L.; Jia, J.; Zhang, X.; An, C.; Zhang, J.; et al. Westerlies Asia and monsoonal Asia: Spatiotemporal differences in climate change and possible mechanisms on decadal to sub-orbital timescales. Earth Sci. Rev. 2019, 192, 337–354. [Google Scholar] [CrossRef]
  19. Chen, F.; Chen, J.; Holmes, J.; Boomer, I.; Austin, P.; Gates, J.B.; Wang, N.-L.; Brooks, S.J.; Zhang, J.-W. Moisture changes over the last millennium in arid central Asia: A review, synthesis and comparison with monsoon region. Quat. Sci. Rev. 2010, 29, 1055–1068. [Google Scholar] [CrossRef]
  20. Mishra, V.; Cherkauer, K.A.; Shukla, S. Assessment of Drought due to Historic Climate Variability and Projected Future Climate Change in the Midwestern United States. J. Hydrometeorol. 2010, 11, 46–68. [Google Scholar] [CrossRef] [Green Version]
  21. Gergis, J.L.; Fowler, A.M. A history of ENSO events since A.D. 1525: Implications for future climate change. Clim. Chang. 2009, 92, 343–387. [Google Scholar] [CrossRef]
  22. Harris, I.; Osborn, T.J.; Jones, P.; Lister, D. Version 4 of the CRU TS monthly high-resolution gridded multivariate climate dataset. Sci. Data 2020, 7, 1–18. [Google Scholar] [CrossRef] [PubMed] [Green Version]
  23. Esper, J.; Schweingruber, F.H.; Winiger, M. 1300 years of climatic history for Western Central Asia inferred from tree-rings. Holocene 2002, 12, 267–277. [Google Scholar] [CrossRef] [Green Version]
  24. Li, J.; Gou, X.; Cook, E.R.; Chen, F. Tree-ring based drought reconstruction for the central Tien Shan area in northwest China. Geophys. Res. Lett. 2006, 33, L07715. [Google Scholar] [CrossRef] [Green Version]
  25. Fang, K.; Davi, N.; Gou, X.; Chen, F.; Cook, E.; Li, J.; D’Arrigo, R. Spatial drought reconstructions for central High Asia based on tree rings. Clim. Dyn. 2010, 35, 941–951. [Google Scholar] [CrossRef]
  26. Chen, F.; Yuan, Y.-J.; Chen, F.-H.; Wei, W.-S.; Yu, S.-L.; Chen, X.-J.; Fan, Z.-A.; Zhang, R.-B.; Zhang, T.-W.; Shang, H.-M. A 426-year drought history for Western Tian Shan, Central Asia, inferred from tree rings and linkages to the North Atlantic and Indo-Pacific Oceans. Holocene 2013, 23, 1095–1104. [Google Scholar] [CrossRef]
  27. Opała-Owczarek, M.; Niedźwiedź, T. Last 1100 yr of precipitation variability in western central Asia as revealed by tree-ring data from the Pamir-Alay. Quat. Res. 2019, 91, 81–95. [Google Scholar] [CrossRef] [Green Version]
  28. Xu, G.; Liu, X.; Trouet, V.; Treydte, K.; Wu, G.; Chen, T.; Sun, W.; An, W.; Wang, W.; Zeng, X.; et al. Regional drought shifts (1710–2010) in East Central Asia and linkages with atmospheric circulation recorded in tree-ring δ18O. Clim. Dyn. 2019, 52, 713–727. [Google Scholar] [CrossRef] [Green Version]
  29. Zhang, R.; Wei, W.; Shang, H.; Yu, S.; Gou, X.; Qin, L.; Bolatov, K.; Mambetov, B.T. A tree ring-based record of annual mass balance changes for the TS.Tuyuksuyskiy Glacier and its linkages to climate change in the Tianshan Mountains. Quat. Sci. Rev. 2019, 205, 10–21. [Google Scholar] [CrossRef]
  30. Liang, J.; Shengjie, W.; Yuan, J.; Xuerui, L. A 333-year record of the mean minimum temperature reconstruction in the Western Tianshan Mountains, China. Geochronometria 2019, 46, 37–48. [Google Scholar]
  31. Lasher, G.E.; Axford, Y.; Masterson, A.L.; Berman, K.; Larocca, L.J. Holocene temperature and landscape history of southwest Greenland inferred from isotope and geochemical lake sediment proxies. Quat. Sci. Rev. 2020, 239. [Google Scholar] [CrossRef]
  32. Rudaya, N.; Nazarova, L.; Novenko, E.; Andreev, A.; Kalugin, I.; Daryin, A.; Babich, V.; Li, H.-C.; Shilov, P. Quantitative reconstructions of mid- to late holocene climate and vegetation in the north-eastern altai mountains recorded in lake teletskoye. Global Planet. Chang. 2016, 141, 12–24. [Google Scholar] [CrossRef] [Green Version]
  33. Grauel, A.-L.; Hodell, D.A.; Bernasconi, S.M. Quantitative estimates of tropical temperature change in lowland Central America during the last 42 ka. Earth Planet. Sci. Lett. 2016, 438, 37–46. [Google Scholar] [CrossRef] [Green Version]
  34. Maloney, A.E.; Nelson, D.B.; Richey, J.N.; Prebble, M.; Sear, D.A.; Hassall, J.D.; Langdon, P.G.; Croudace, I.W.; Zawadzki, A.; Sachs, J.P. Reconstructing precipitation in the tropical South Pacific from dinosterol 2H/1H ratios in lake sediment. Geochim. Cosmochim. Acta 2019, 245, 190–206. [Google Scholar] [CrossRef]
  35. Hartmann, J.; Moosdorf, N. The new global lithological map database GLiM: A representation of rock properties at the Earth surface. Geochem. Geophys. Geosyst. 2012, 13. [Google Scholar] [CrossRef]
  36. Becker, J.J.; Sandwell, D.T.; Smith, W.H.F.; Braud, J.; Binder, B.; Depner, J.; Fabre, D.; Factor, J.; Ingalls, S.; Kim, S.H.; et al. Global Bathymetry and Elevation Data at 30 Arc Seconds Resolution: SRTM30_PLUS. Mar. Geod. 2009, 32, 355–371. [Google Scholar] [CrossRef]
  37. NASA. NASADEM_HGT v001, NASADEM Merged DEM Global 1 arc Second. Available online: https://doi.org/10.5067/MEaSUREs/NASADEM/NASADEM_HGT.001 (accessed on 7 August 2020).
  38. Weltje, G.J.; Prins, M.A. Genetically meaningful decomposition of grain-size distributions. Sediment. Geol. 2007, 202, 409–424. [Google Scholar] [CrossRef]
  39. Dietze, E.; Hartmann, K.; Diekmann, B.; Ijmker, J.; Lehmkuhl, F.; Opitz, S.; Stauch, G.; Wünnemann, B.; Borchers, A. An end-member algorithm for deciphering modern detrital processes from lake sediments of Lake Donggi Cona, NE Tibetan Plateau, China. Sediment. Geol. 2012, 243–244, 169–180. [Google Scholar] [CrossRef]
  40. Stein, A.F.; Draxler, R.R.; Rolph, G.D.; Stunder, B.J.B.; Cohen, M.D.; Ngan, F. NOAA’s HYSPLIT Atmospheric Transport and Dispersion Modeling System. Bull. Am. Meteorol. Soc. 2016, 96, 2059–2077. [Google Scholar] [CrossRef]
  41. National Weather Service’s National Centers for Environmental Prediction. Global Data Assimilation System (GDAS). Available online: ftp://arlftp.arlhq.noaa.gov/pub/archives/gdas1 (accessed on 7 August 2020).
  42. Wang, Y.Q. MeteoInfo: GIS software for meteorological data visualization and analysis. Meteorol. Appl. 2014, 21, 360–368. [Google Scholar] [CrossRef]
  43. Pennington, W.; Tutin, T.G.; Cambray, R.S.; Fisher, E.M. Observations on Lake Sediments using Fallout 137Cs as a Tracer. Nature 1973, 242, 324–326. [Google Scholar] [CrossRef] [PubMed]
  44. Callaway, J.; DeLaune, R.; Patrick, W., Jr. Chernobyl 137Cs used to determine sediment accretion rates at selected northern European coastal wetlands. Limnol. Oceanogr. 1996, 41, 444–450. [Google Scholar] [CrossRef]
  45. Abbasi, A. 210Pb and 137Cs based techniques for the estimation of sediment chronologies and sediment rates in the Anzali Lagoon, Caspian Sea. J. Radioanal. Nucl. Chem. 2019, 322, 319–330. [Google Scholar] [CrossRef]
  46. Blais, J.M.; Kalff, J.; Cornett, R.J.; Evans, R.D. Evaluation of 210 Pb dating in lake sediments using stable Pb, Ambrosia pollen, and 137 Cs. J. Paleolimnol. 1995, 13, 169–178. [Google Scholar] [CrossRef]
  47. Liu, S.; Narentuya; Xia, B.; Chu, G.; Tian, M. Using 210Pbuns and 137Cs to date recent sediment cores from the Badain Jaran Desert, Inner Mongolia, China. Quat. Geochronol. 2012, 12, 30–39. [Google Scholar] [CrossRef]
  48. Yan, Y.; Zhou, J.; He, Z.; Sun, Q.; Fei, J.; Zhou, X.; Zhao, K.; Yang, L.; Long, H.; Zheng, H. Evolution of Luyang Lake since the last 34,000 years: Climatic changes and anthropogenic impacts. Quat. Int. 2017, 440, 90–98. [Google Scholar] [CrossRef]
  49. Blair, T.C.; McPherson, J.G. Grain-size and textural classification of coarse sedimentary particles. J. Sediment. Res. 1999, 69, 6–19. [Google Scholar] [CrossRef]
  50. Blott, S.J.; Pye, K. GRADISTAT: A grain size distribution and statistics package for the analysis of unconsolidated sediments. Earth Surf. Process. Landforms 2001, 26, 1237–1248. [Google Scholar] [CrossRef]
  51. Tomé, A.R.; Miranda, P.M.A. Piecewise linear fitting and trend changing points of climate parameters. Geophys. Res. Lett. 2004, 31. [Google Scholar] [CrossRef] [Green Version]
  52. Tomé, A.R.; Miranda, P.M.A. Continuous partial trends and low-frequency oscillations of time series. Nonlinear Process. Geophys. 2005, 12, 451–460. [Google Scholar] [CrossRef] [Green Version]
  53. Hamann, Y.; Ehrmann, W.; Schmiedl, G.; Krüger, S.; Stuut, J.B.; Kuhnt, T. Sedimentation processes in the Eastern Mediterranean Sea during the Late Glacial and Holocene revealed by end-member modelling of the terrigenous fraction in marine sediments. Mar. Geol. 2008, 248, 97–114. [Google Scholar] [CrossRef]
  54. Liang, X.; Niu, Q.; Qu, J.; Liu, B.; Liu, B.; Zhai, X.; Niu, B. Applying end-member modeling to extricate the sedimentary environment of yardang strata in the Dunhuang Yardang National Geopark, northwestern China. Catena 2019, 180, 238–251. [Google Scholar] [CrossRef]
  55. Zhou, J.; Wu, J.; Ma, L.; Qiang, M. Late Quaternary lake-level and climate changes in arid central Asia inferred from sediments of Ebinur Lake, Xinjiang, northwestern China. Quat. Res. 2019, 92, 416–429. [Google Scholar] [CrossRef]
  56. Mishra, P.K.; Ankit, Y.; Gautam, P.K.; Lakshmidevi, C.G.; Singh, P.; Anoop, A. Inverse relationship between south-west and north-east monsoon during the late Holocene: Geochemical and sedimentological record from Ennamangalam Lake, southern India. Catena 2019, 182, 104117. [Google Scholar] [CrossRef]
  57. Huang, Y.; Xiao, J.; Xiang, R.; Liu, S.; Khokiattiwong, S.; Kornkanitnan, N.; Fan, J.; Wen, R.; Zhang, S.; Liu, J. Holocene Indian Summer Monsoon variations inferred from end-member modeling of sediment grain size in the Andaman Sea. Quat. Int. 2020. [Google Scholar] [CrossRef]
  58. Li, J.; Vandenberghe, J.; Mountney, N.P.; Luthi, S.M. Grain-size variability of point-bar deposits from a fine-grained dryland river terminus, Southern Altiplano, Bolivia. Sediment. Geol. 2020, 403, 105663. [Google Scholar] [CrossRef]
  59. Dietze, E.; Maussion, F.; Ahlborn, M.; Diekmann, B.; Hartmann, K.; Henkel, K.; Kasper, T.; Lockot, G.; Opitz, S.; Haberzettl, T. Sediment transport processes across the Tibetan Plateau inferred from robust grain-size end members in lake sediments. Clim. Past 2014, 10, 91–106. [Google Scholar] [CrossRef] [Green Version]
  60. Chen, J.A.; Wan, G.; Zhang, D.D.; Zhang, F.; Huang, R. Environmental records of lacustrine sediments in different time scales: Sediment grain size as an example. Sci. China-Earth Sci. 2004, 47, 954–960. [Google Scholar] [CrossRef]
  61. Peng, Y.; Xiao, J.; Nakamura, T.; Liu, B.; Inouchi, Y. Holocene East Asian monsoonal precipitation pattern revealed by grain-size distribution of core sediments of Daihai Lake in Inner Mongolia of north-central China. Earth Planet. Sci. Lett. 2005, 233, 467–4792. [Google Scholar] [CrossRef]
  62. He, H.-C.; Ding, H.-Y.; Zhang, Z.-K.; Shi, X.-D.; Li, S.-H.; Mao, L.-J. Grain-size characteristics and their environmental significance of Hongze Lake sediments. Sci. Geogr. Sinica 2005, 25, 590–596. [Google Scholar]
  63. Sun, W.; Shen, J.; Yu, S.-Y.; Long, H.; Zhang, E.; Liu, E.; Chen, R. A lacustrine record of East Asian summer monsoon and atmospheric dust loading since the last interglaciation from Lake Xingkai, northeast China. Quat. Res. 2018, 89, 270–280. [Google Scholar] [CrossRef]
  64. Liu, X.; Herzschuh, U.; Shen, J.; Jiang, Q.; Xiao, X. Holocene environmental and climatic changes inferred from Wulungu Lake in northern Xinjiang, China. Quat. Res. 2008, 70, 412–425. [Google Scholar] [CrossRef]
  65. Sun, D.; Bloemendal, J.; Rea, D.K.; Vandenberghe, J.; Jiang, F.; An, Z.; Su, R. Grain-size distribution function of polymodal sediments in hydraulic and aeolian environments, and numerical partitioning of the sedimentary components. Sediment. Geol. 2002, 152, 263–277. [Google Scholar] [CrossRef]
  66. Neff, J.C.; Ballantyne, A.P.; Farmer, G.L.; Mahowald, N.M.; Conroy, J.L.; Landry, C.C.; Overpeck, J.T.; Painter, T.H.; Lawrence, C.R.; Reynolds, R.L. Increasing eolian dust deposition in the western United States linked to human activity. Nat. Geosci. 2008, 1, 189–195. [Google Scholar] [CrossRef]
  67. Ma, L.; Wu, J.; Abuduwaili, J. Climate and environmental changes over the past 150 years inferred from the sediments of Chaiwopu Lake, central Tianshan Mountains, northwest China. Int. J. Earth Sci. 2013, 102, 959–967. [Google Scholar] [CrossRef]
  68. Liu, J.; Wang, R.; Zhao, Y.; Yang, Y. A 40,000-year record of aridity and dust activity at Lop Nur, Tarim Basin, northwestern China. Quat. Sci. Rev. 2019, 211, 208–221. [Google Scholar] [CrossRef]
  69. Arcusa, S.H.; McKay, N.P.; Routson, C.C.; Munoz, S.E. Dust-drought interactions over the last 15,000 years: A network of lake sediment records from the San Juan Mountains, Colorado. Holocene 2020, 30, 559–574. [Google Scholar] [CrossRef]
  70. Shen, J.; Wang, Y.; Yang, X.; Zhang, E.; Yang, B.; Ji, J. Paleosandstorm characteristics and lake evolution history deduced from investigation on lacustrine sediments—The case of Hongjiannao Lake, Shaanxi Province. Chin. Sci. Bull. 2005, 50, 2355–2361. [Google Scholar]
  71. Buckles, L.K.; Verschuren, D.; Weijers, J.W.; Cocquyt, C.; Blaauw, M.; Sinninghe Damsté, J.S. Interannual and (multi-) decadal variability in the sedimentary BIT index of Lake Challa, East Africa, over the past 2200 years: Assessment of the precipitation proxy. Clim. Past 2016, 12, 1243–1262. [Google Scholar] [CrossRef] [Green Version]
  72. Schartman, A.K.; Diefendorf, A.F.; Lowell, T.V.; Freimuth, E.J.; Stewart, A.K.; Landis, J.D.; Bates, B.R. Stable source of Holocene spring precipitation recorded in leaf wax hydrogen-isotope ratios from two New York lakes. Quat. Sci. Rev. 2020, 240, 106357. [Google Scholar] [CrossRef]
  73. Ouyang, C.; Zhang, H.; Chang, F.; Li, H.; Che, Y.; Zhang, Y.; Duan, L.; Ren, Y. The Rb/Sr Ratio Response to Paleo Precipitation Recorded by Lake Sediment from a Semi Closed Lake in Southwest China since 16.0 cal. ka BP. Ekoloji 2019, 28, 3901–3912. [Google Scholar]
  74. Warrier, A.K.; Sandeep, K.; Shankar, R. Climatic periodicities recorded in lake sediment magnetic susceptibility data: Further evidence for solar forcing on Indian summer monsoon. Geosci. Front. 2017, 8, 1349–1355. [Google Scholar] [CrossRef]
  75. Li, Z.; Wei, Z.; Dong, S.; Chen, Q. The paleoenvironmental significance of spatial distributions of grain size in groundwater-recharged lakes: A case study in the hinterland of the Badain Jaran Desert, northwest China. Earth Surf. Process. Landforms 2018, 43, 363–372. [Google Scholar] [CrossRef]
  76. Nagashima, K.; Suzuki, Y.; Irino, T.; Nakagawa, T.; Tada, R.; Hara, Y.; Yamada, K.; Kurosaki, Y. Asian dust transport during the last century recorded in Lake Suigetsu sediments. Geophys. Res. Lett. 2016, 43, 2835–2842. [Google Scholar] [CrossRef] [Green Version]
  77. Liu, X.; Vandenberghe, J.; An, Z.; Li, Y.; Jin, Z.; Dong, J.; Sun, Y. Grain size of Lake Qinghai sediments: Implications for riverine input and Holocene monsoon variability. Palaeogeogr. Palaeoclimatol. Palaeoecol. 2016, 449, 41–51. [Google Scholar] [CrossRef] [Green Version]
  78. Ma, L.; Abuduwaili, J.; Liu, W. Environmentally sensitive grain-size component records and its response to climatic and anthropogenic influences in Bosten Lake region, China. Sci. Rep. 2020, 10, 942. [Google Scholar] [CrossRef]
  79. Chen, F.; Huang, X.; Zhang, J.; Holmes, J.A.; Chen, J. Humid Little Ice Age in arid central Asia documented by Bosten Lake, Xinjiang, China. Sci. China-Earth Sci. 2006, 49, 1280–1290. [Google Scholar] [CrossRef]
  80. Delworth, T.L.; Zeng, F.; Vecchi, G.A.; Yang, X.; Zhang, L.; Zhang, R. The North Atlantic Oscillation as a driver of rapid climate change in the Northern Hemisphere. Nat. Geosci. 2016, 9, 509–512. [Google Scholar] [CrossRef]
  81. Hurrell, J.W. Decadal trends in the North Atlantic Oscillation: Regional temperatures and precipitation. Science 1995, 269, 676–679. [Google Scholar] [CrossRef] [Green Version]
  82. Hurrell, J.W.; Deser, C. North Atlantic climate variability: The role of the North Atlantic Oscillation. J. Mar. Syst. 2009, 78, 28–41. [Google Scholar] [CrossRef]
  83. Stige, L.C.; Ottersen, G.; Brander, K.; Chan, K.-S.; Stenseth, N.C. Cod and climate: Effect of the North Atlantic Oscillation on recruitment in the North Atlantic. Mar. Ecol. Prog. Ser. 2006, 325, 227–241. [Google Scholar] [CrossRef] [Green Version]
  84. Aizen, E.M.; Aizen, V.B.; Melack, J.M.; Nakamura, T.; Ohta, T. Precipitation and atmospheric circulation patterns at mid-latitudes of Asia. Int. J. Climatol. 2001, 21, 535–556. [Google Scholar] [CrossRef]
  85. Chen, F.; Jia, J.; Chen, J.; Li, G.; Zhang, X.; Xie, H.; Xia, D.; Huang, W.; An, C. A persistent Holocene wetting trend in arid central Asia, with wettest conditions in the late Holocene, revealed by multi-proxy analyses of loess-paleosol sequences in Xinjiang, China. Quat. Sci. Rev. 2016, 146, 134–146. [Google Scholar] [CrossRef]
  86. Harris, I.; Jones, P.D.; Osborn, T.J.; Lister, D.H. Updated high-resolution grids of monthly climatic observations–the CRU TS3.10 Dataset. Int. J. Climatol. 2014, 34, 623–642. [Google Scholar] [CrossRef] [Green Version]
  87. Jarvis, A.; Reuter, H.; Nelson, A.; Guevara, E. Hole-Filled SRTM for the Globe Version 4, SRTM Data Processing Methodology. asp 2006. Available online: http://srtm.csi.cgiar.org (accessed on 3 April 2019).
  88. Ma, L.; Wu, J.; Abuduwaili, J. Variation in aeolian environments recorded by the particle size distribution of lacustrine sediments in Ebinur Lake, northwest China. SpringerPlus 2016, 5, 481. [Google Scholar] [CrossRef] [PubMed] [Green Version]
Figure 1. Geographical map of the study area. (a) Location of the Tian Shan where Lake Ta-Lung-Chi is located. Monthly precipitation and monthly average temperature data for Lake Ta-Lung-Chi are from the climatic research unit (CRU) (Harris et al., 2020) while data for the Bayanbulak Station are from the Meteorological Data Center of China Meteorological Administration. (b) Lake Ta-Lung-Chi water system. The base map of (a) was derived from a SRTM30PLUS color-encoded shaded relief world topography (approximately 4 km) GeoTIFF image [36]. The base map of (b) was derived from global topographic data at 1 arc-second (~30 m) horizontal resolution (NASADEM) from NASA Land Processes Distributed Active Archive Center (LP DAAC) Distribution Server hosted at the USGS Earth Resources Observation and Science (EROS) Center [37]. (c) Vegetation around the lake. (d) Core sediment TLC01 and field sub-sampling.
Applsci 10 06793 g001
Figure 2. The vertical distribution of 137Cs specific activity in Lake Ta-Lung-Chi sediments, a mountain lake in the Tian Shan (left), and the established chronological record for sediment core TLC01 (right). Different colors represent the percentage (%) of clay (gray)/silt (blue)/sand (white) versus depth.
Applsci 10 06793 g002
Figure 3. Distribution of grain-size frequencies in sediment core TLC01.
Applsci 10 06793 g003
Figure 4. Grain-size data using the algorithm of end-member modelling analysis (EMMA) [39].
Applsci 10 06793 g004
Figure 5. Grain size distribution and nonlinear trend fitting in sediment core TLC01 from Lake Ta-Lung-Chi. The blue triangles for the change points with the method of Piecewise linear fitting and trend changing points [51,52].
Applsci 10 06793 g005
Figure 6. Comparisons of regional climate change. (a) Total precipitation from April to September at the meteorological station (Chonkyzylsu, 42.20° N 78.19° E, 1883–1996) located in the western Tian Shan [86]. (b) The three-point moving average curve of silty fraction content of 16 to 32 μm. (c) Total precipitation from April to September from cru_ts_4.04 grid-box data for 42.25° N, 83.25° E in the region of Lake Ta-Lung-Chi [22]. (d) The monthly North Atlantic Oscillation Index (station-based, December, January, and February) [81,82]. (e) The total content of clay and fine-silty fraction (0–16 μm). (f) The monthly precipitation in July from CRU TS 4.04 grid-box data for 42.25° N, 83.25° E in the region of Lake Ta-Lung-Chi [22].
Applsci 10 06793 g006
Figure 7. Possible sources of water vapor identified for Lake Ta-Lung-Chi (42.45° N, 83.29° E) and Chonkyzylsu station (42.20° N, 78.19° E) using the HYSPLIT [40] and MeteoInfo (TrajStat package) [42] models. The base map was derived from SRTM 90 m Digital Elevation Database v4.1 [87]. The red lines suggested the cluster trajectories of water vapor source for the site of Chonkyzylsu Station, and the yellow for Lake Ta-Lung-Chi.
Applsci 10 06793 g007