Linked Data Platform for Solanaceae Species


 , ,
, ,
Abstract
:1. Introduction
2. Data Generation and Ingestion Pipeline
2.1. Data Sources
2.1.1. QTLs
2.1.2. SGN
2.1.3. Ensembl Plants and UniProt
2.2. Ontologies
2.3. Linked Data Deployment
2.4. Data Access & Analysis
3. Results
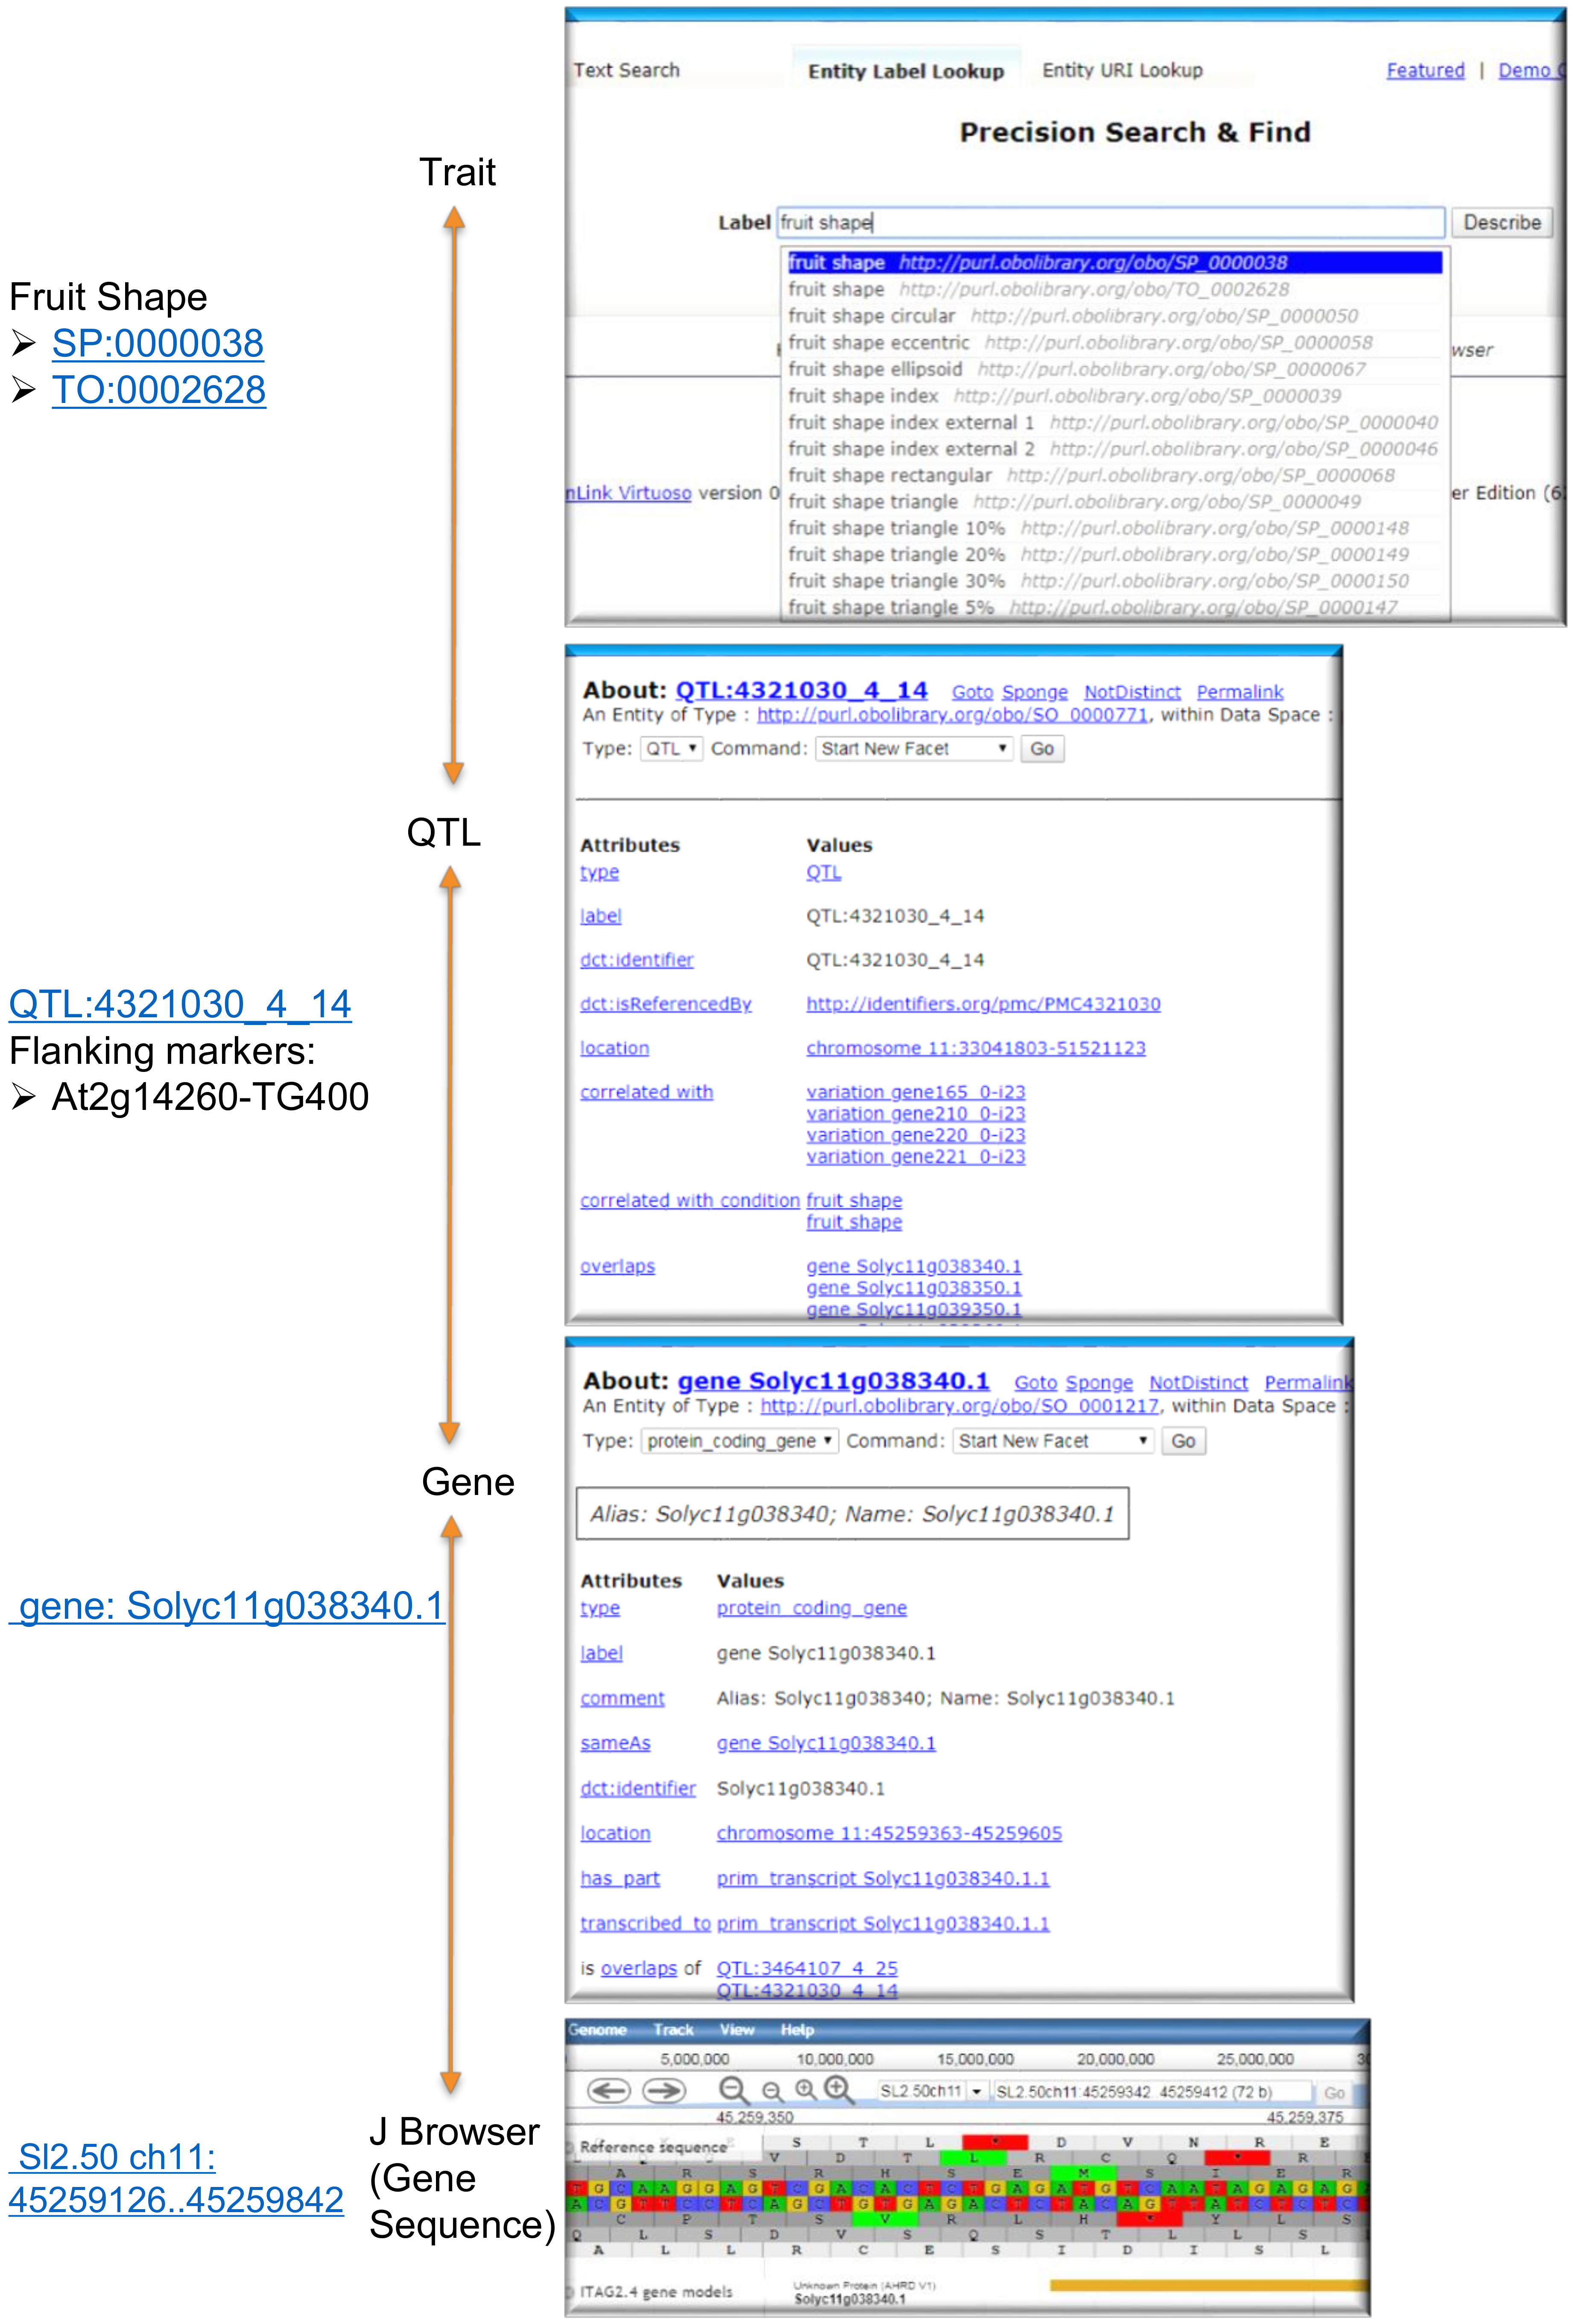
3.1. Genome Annotations via the Faceted Browser
3.2. Example Queries via SPARQL and RESTful API
- (I)
- SPARQL query to list QTLs, associated gene IDs and GO annotations related to an example trait “fruit shape” (SP:0000038).In addtion to the manual browsing via a web interface, Figure 3 exemplifies a programmatic way to query trait-gene associations. This query yields QTLs and candidate genes including GO terms (molecular function and biological process only) for the trait “fruit shape” (SP:0000038).
- (II)
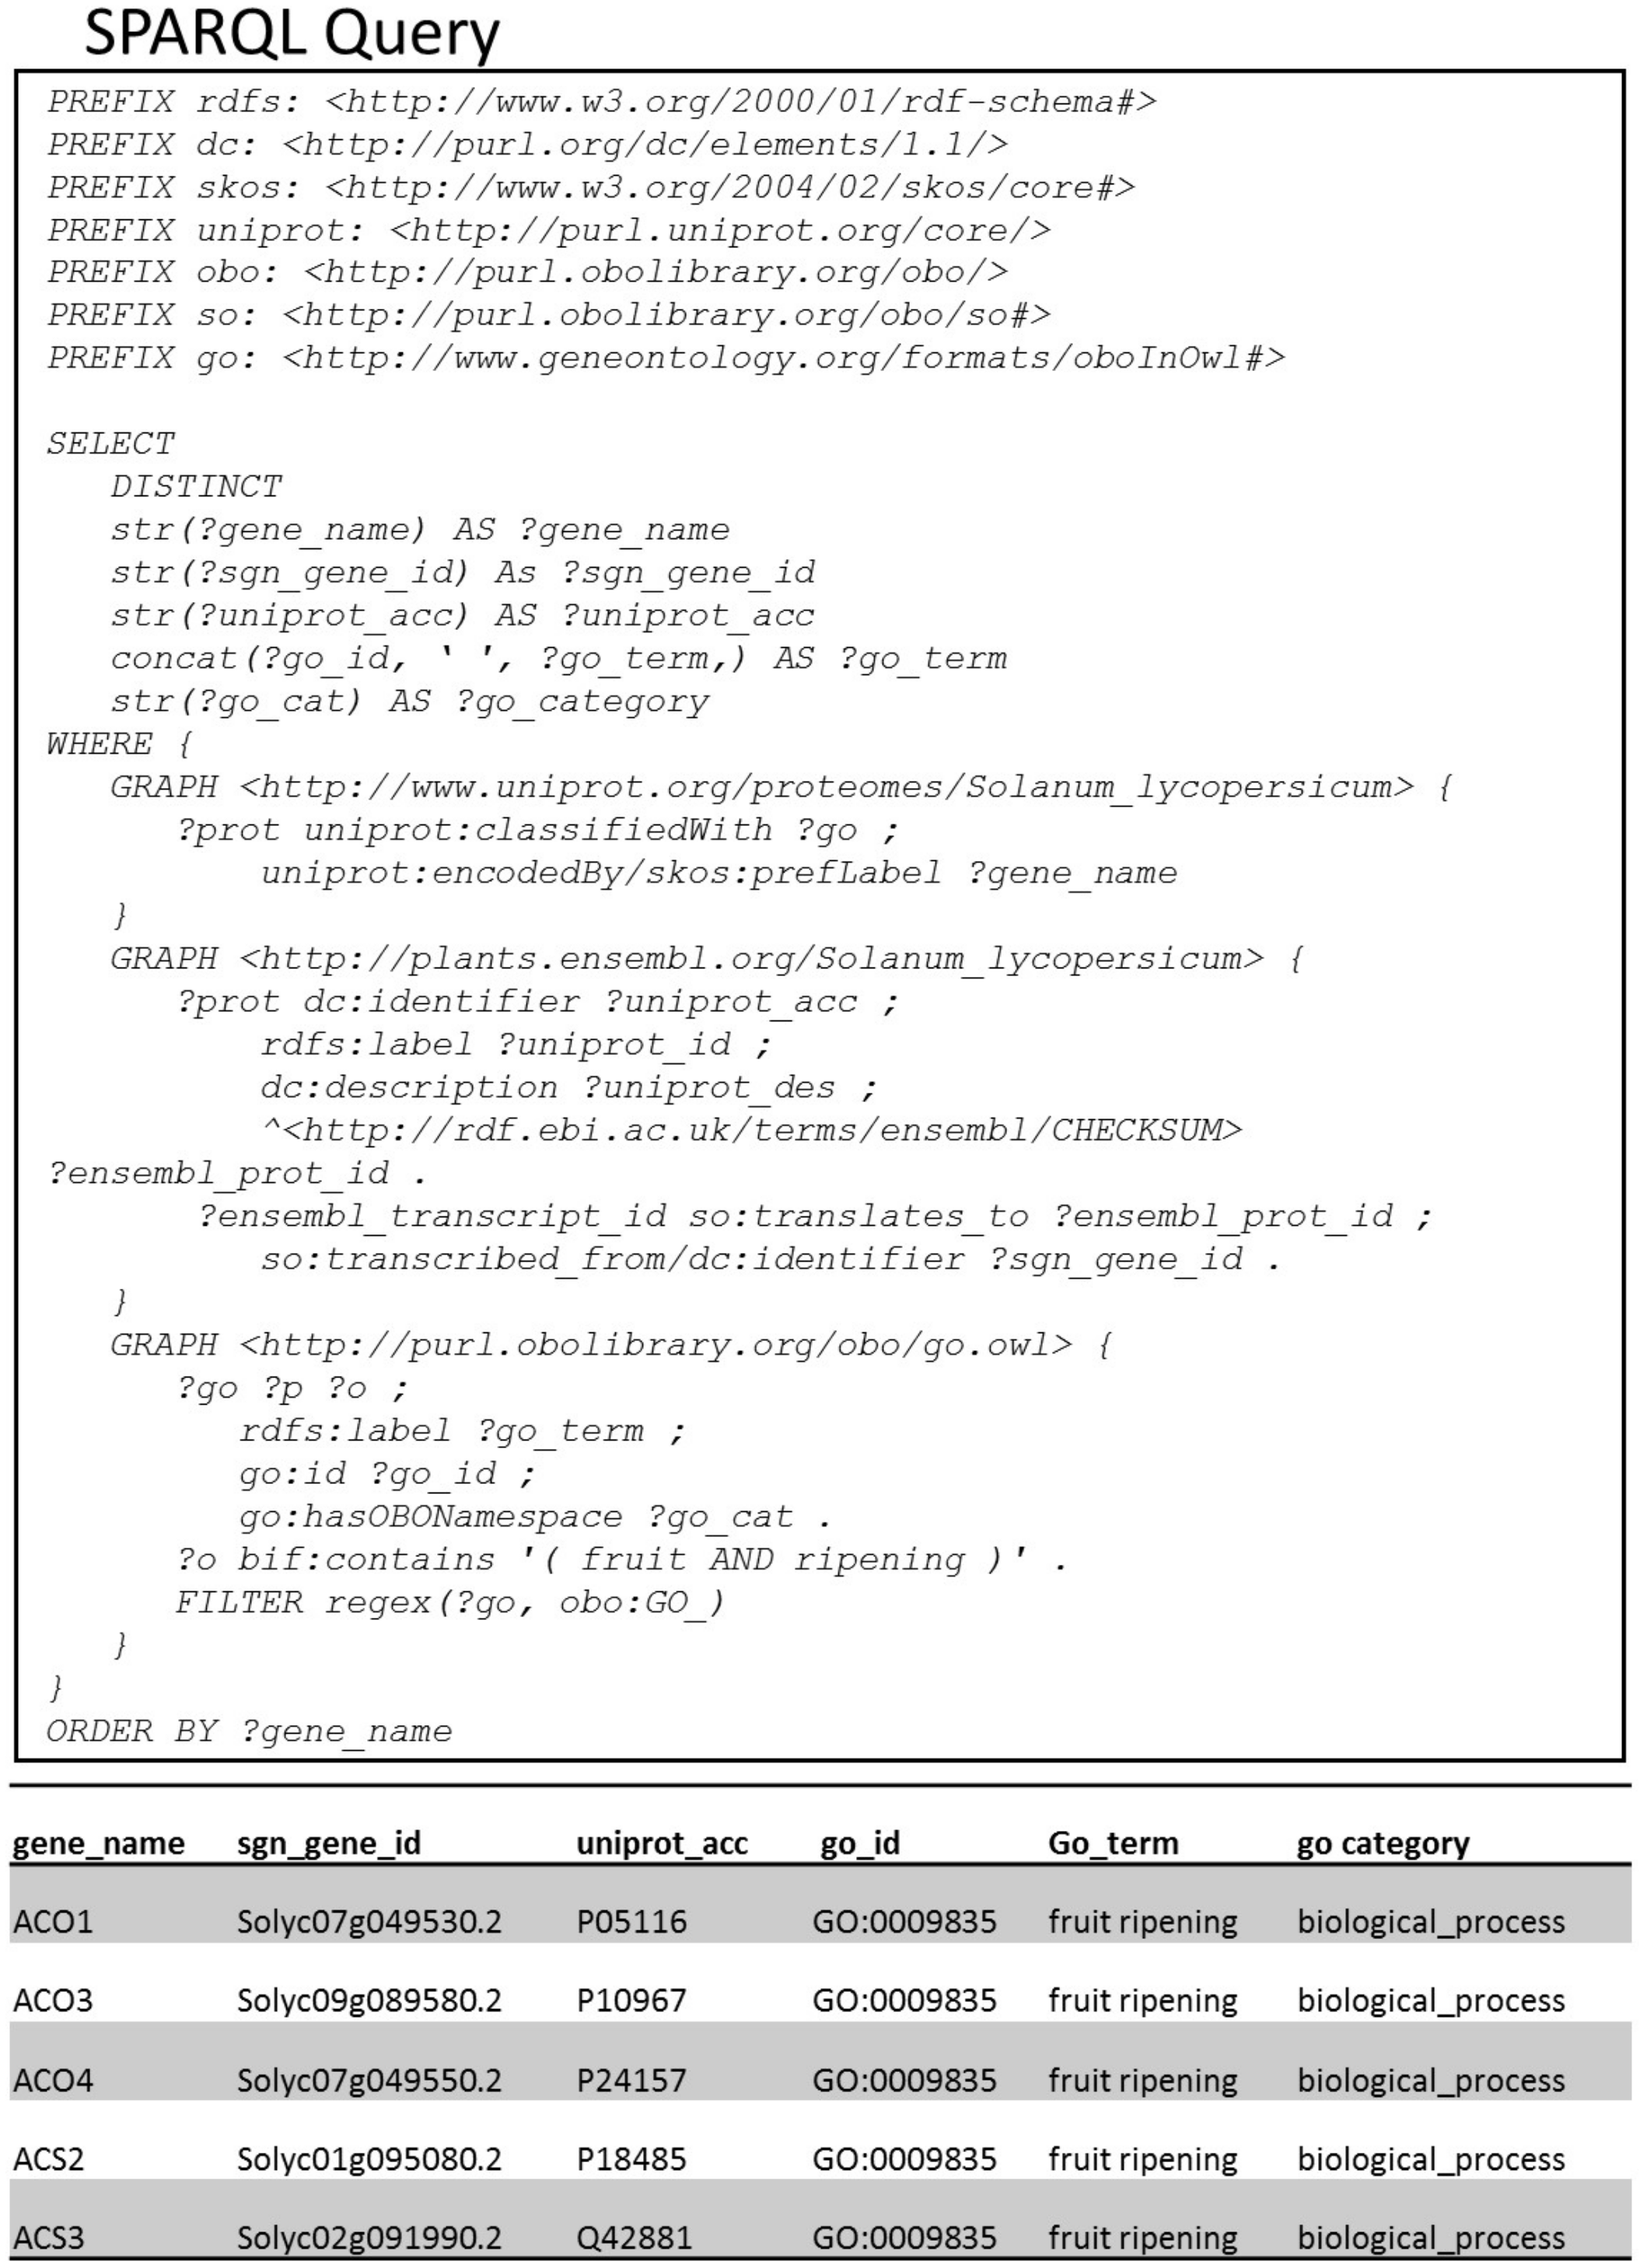
- SPARQL query to list genes/proteins annotated with GO terms related to both “fruit” and “ripening”.SPARQL query in Figure 4 highlights a way to do textual search over the annotations of genes/proteins. With the bag-of-words expression, we query genes and proteins containing GO annotations with the words “fruit” and “ripening”. The resulting output is the list of genes/proteins involved in the biological process called “fruit ripening” (GO:0009835).
- (III)
- Comparison of (wild) tomato genome graphs using the RESTful API.pbg-ld can be used to query genomic features across various biological databases. This can be done either by writing a SPARQL query against the endpoint or via the API call /countFeatures of pbg-ld, with the genomic graph as a parameter. For example, pbg-ld can count the genomic features annotated in the S. lycopersicum genome according to Ensembl Plants or SGN, and annotations in the S. pennelli genome according to SGN.We compared the differences between the genomic features of the tomato graphs in Figure 5. It is evident that there are a total of 33,785 protein coding genes in Ensemble Plants, whereas there are 34,725 protein coding genes in the SGN graph. There are 940 unique genes in the SGN database that are not mentioned in the Ensembl Plants database. Furthermore, the results also highlight that genetic markers are included in SGN but not in Ensembl Plants while the latter database contains RNAs. In addition, pbg-ld can also be used to compare genomic data of different species of the same family. S. pennellii is a wild tomato species that is relatively distant from the domesticated S. lycopersicum. Because of S. pennelli’s extreme stress tolerance, unusual morphology, and a genome sequence 119 Mb larger than S. lycopersicum, it is an important donor of germplasm for the cultivated tomato. While comparing the genomic features of S. lycopersicum vs. S. pennelli in SGN, the number of genomic features in S. pennellii is on average 1.5 times greater than that of S. lycopersicum (Figure 5).
3.3. Biological Use Case 1: Comparative Genomics to Study Tomato Fruit Shape and Potato Tuber Shape
3.4. Biological Use Case 2: Prediction of Candidate Genes in Tomato QTL Regions with Functional Annotations and Evolutionary Analysis Using pbg-ld and QTLSearch
4. Discussion & Conclusions
Author Contributions
Funding
Acknowledgments
Conflicts of Interest
Appendix A

Appendix B

| Number | Endpoint (Path) | Description | Input Parameters | Response Fields |
|---|---|---|---|---|
| 1. | /countFeatures | Count genomic features. | graph - genome graph IRI, endpoint - SPARQL endpoint | feature_id, feature_name, n |
| 2. | /getFeatureLocation | Get the genomic location of a feature. | featureid - feature ID, endpoint | feature_id, feature_name, chrom, begin_pos, end_pos, taxon_id |
| 3. | /getFeaturesInInterval | Get genomic features given an interval. | graph, chrom, begin, end, feature - feature type, endpoint | feature_id, feature_name, chrom, begin_pos, end_pos |
| 4. | /getGeneAnnotations | Get annotations from SGN, Ensembl and UniProt given a gene ID. | geneid - gene ID, endpoint | gene_id, gene_name, transcript_id, sgn_des, uniprot_acc, uniprot_reviewed, uniprot_existence, uniprot_des, uniprot_goa |
| 5. | /getGenesInQTL | Get genes that overlap with a QTL identified by ID. | qtlid - QTL ID (see QTM), endpoint | gene_id |
| 6. | /getOrthologs | Get orthologs of a gene identified by ID. | geneid, endpoint | gene_id, ortholog_id |
| 7. | /getParalogs | Get paralogs of a gene identified by ID.. | geneid, endpoint | gene_id, paralog_id |
| 8. | /getQTLs | Get QTLs associated with a trait identified by ID. | traitid - trait ID (e.g. using SPTO or TO), endpoint | qtl_id |
| 9. | /getQTLsPerArticle | Get QTLs described in an article identified by ID. | pmcid - Pubmed Central ID, endpoint | qtl_id |
| 10. | /getTraitIds | Get term ID(s) for a trait defined in several trait ontologies. | trait - trait term(s) (incl. boolean operators), endpoint | trait_id, trait_term |
| 11. | /sumQTLs | Summarize QTLs extracted from articles. | endpoint | taxon_id, n_articles, n_qtls, n_qtls_with_loc, n_qtls_with_genes |
References
- Tomato Genome Consortium. The tomato genome sequence provides insights into fleshy fruit evolution. Nature 2012, 485, 635. [Google Scholar] [CrossRef] [Green Version]
- Potato Genome Sequencing Consortium. Genome sequence and analysis of the tuber crop potato. Nature 2011, 475, 189. [Google Scholar] [CrossRef]
- Wang, X.; Wang, H.; Wang, J.; Sun, R.; Wu, J.; Liu, S.; Bai, Y.; Mun, J.H.; Bancroft, I.; Cheng, F.; et al. The genome of the mesopolyploid crop species Brassica rapa. Nat. Genet. 2011, 43, 1035–1039. [Google Scholar] [CrossRef] [Green Version]
- Huang, S.; Li, R.; Zhang, Z.; Li, L.; Gu, X.; Fan, W.; Lucas, W.J.; Wang, X.; Xie, B.; Ni, P.; et al. The genome of the cucumber, Cucumis sativus L. Nat. Genet. 2009, 41, 1275. [Google Scholar] [CrossRef] [Green Version]
- Chibon, P.Y.; Schoof, H.; Visser, R.G.; Finkers, R. Marker2sequence, mine your QTL regions for candidate genes. Bioinformatics 2012, 28, 1921–1922. [Google Scholar] [CrossRef] [Green Version]
- Astola, L.; Stigter, H.; van Dijk, A.D.; van Daelen, R.; Molenaar, J. Inferring the gene network underlying the branching of tomato inflorescence. PLoS ONE 2014, 9, e89689. [Google Scholar] [CrossRef] [PubMed]
- Shinozuka, H.; Cogan, N.O.; Spangenberg, G.C.; Forster, J.W. Quantitative Trait Locus (QTL) meta-analysis and comparative genomics for candidate gene prediction in perennial ryegrass (Lolium perenne L.). BMC Genet. 2012, 13, 101. [Google Scholar] [CrossRef] [PubMed] [Green Version]
- Durinx, C.; McEntyre, J.; Appel, R.; Apweiler, R.; Barlow, M.; Blomberg, N.; Cook, C.; Gasteiger, E.; Kim, J.H.; Lopez, R.; et al. Identifying ELIXIR Core Data Resources. F1000Research 2016, 5, 1–16. [Google Scholar] [CrossRef] [Green Version]
- Harrison, P.W.; Alako, B.; Amid, C.; Cerdeño-Tárraga, A.; Cleland, I.; Holt, S.; Hussein, A.; Jayathilaka, S.; Kay, S.; Keane, T.; et al. The European Nucleotide Archive in 2018. Nucleic Acids Res. 2018, 47, D84–D88. [Google Scholar] [CrossRef] [PubMed]
- Bolser, D.M.; Staines, D.M.; Perry, E.; Kersey, P.J. Ensembl Plants: Integrating tools for visualizing, mining, and analyzing plant genomic data. In Plant Genomics Databases; Springer: Berlin/Heidelberg, Germany, 2017; pp. 1–31. [Google Scholar]
- The UniProt Consortium. UniProt: A worldwide hub of protein knowledge. Nucleic Acids Res. 2018, 47, D506–D515. [Google Scholar]
- Mueller, L.A.; Solow, T.H.; Taylor, N.; Skwarecki, B.; Buels, R.; Binns, J.; Lin, C.; Wright, M.H.; Ahrens, R.; Wang, Y.; et al. The SOL Genomics Network. A comparative resource for Solanaceae biology and beyond. Plant Physiol. 2005, 138, 1310–1317. [Google Scholar] [CrossRef] [PubMed] [Green Version]
- Kuzniar, A. pbg-ld. zenodo 2019. [Google Scholar] [CrossRef]
- Berners-Lee, T. Linked Data. 2006. Available online: https://www.w3.org/DesignIssues/LinkedData.html (accessed on 1 July 2020).
- Wilkinson, M.D.; Dumontier, M.; Aalbersberg, I.J.; Appleton, G.; Axton, M.; Baak, A.; Blomberg, N.; Boiten, J.W.; da Silva Santos, L.B.; Bourne, P.E.; et al. The FAIR Guiding Principles for scientific data management and stewardship. Sci. Data 2016, 3, 1–9. [Google Scholar] [CrossRef] [PubMed] [Green Version]
- Solanaceae Phenotype Ontology (SPTO). Available online: http://bioportal.bioontology.org/ontologies/SPTO (accessed on 2 September 2019).
- Shrestha, R.; Matteis, L.; Skofic, M.; Portugal, A.; McLaren, G.; Hyman, G.; Arnaud, E. Bridging the phenotypic and genetic data useful for integrated breeding through a data annotation using the Crop Ontology developed by the crop communities of practice. Front. Physiol. 2012, 3, 326. [Google Scholar] [CrossRef] [PubMed] [Green Version]
- Cooper, L.; Walls, R.L.; Elser, J.; Gandolfo, M.A.; Stevenson, D.W.; Smith, B.; Preece, J.; Athreya, B.; Mungall, C.J.; Rensing, S.; et al. The Plant Ontology as a Tool for Comparative Plant Anatomy and Genomic Analyses. Plant Cell Physiol. 2013, 54, e1. [Google Scholar] [CrossRef]
- Walls, R.L.; Athreya, B.; Cooper, L.; Elser, J.; Gandolfo, M.A.; Jaiswal, P.; Mungall, C.J.; Preece, J.; Rensing, S.; Smith, B.; et al. Ontologies as integrative tools for plant science. Am. J. Bot. 2012, 99, 1263–1275. [Google Scholar] [CrossRef] [PubMed] [Green Version]
- Trait Ontology (TO). Available online: http://purl.obolibrary.org/obo/to.owl (accessed on 2 September 2019).
- The Gene Ontology Consortium. Expansion of the Gene Ontology knowledgebase and resources. Nucleic Acids Res. 2017, 45, D331–D338. [Google Scholar] [CrossRef] [Green Version]
- Eilbeck, K.; Lewis, S.E.; Mungall, C.J.; Yandell, M.; Stein, L.; Durbin, R.; Ashburner, M. The Sequence Ontology: A tool for the unification of genome annotations. Genome Biol. 2005, 6, R44. [Google Scholar] [CrossRef] [Green Version]
- Bolleman, J.T.; Mungall, C.J.; Strozzi, F.; Baran, J.; Dumontier, M.; Bonnal, R.J.P.; Buels, R.; Hoehndorf, R.; Fujisawa, T.; Katayama, T.; et al. FALDO: A semantic standard for describing the location of nucleotide and protein feature annotation. J. Biomed. Semantics 2016, 7, 39. [Google Scholar] [CrossRef] [Green Version]
- Hastings, J.; de Matos, P.; Dekker, A.; Ennis, M.; Harsha, B.; Kale, N.; Muthukrishnan, V.; Owen, G.; Turner, S.; Williams, M.; et al. The ChEBI reference database and ontology for biologically relevant chemistry: Enhancements for 2013. Nucleic Acids Res. 2013, 41, D456–D463. [Google Scholar] [CrossRef]
- Garcia-Hernandez, M.; Berardini, T.; Chen, G.; Crist, D.; Doyle, A.; Huala, E.; Knee, E.; Lambrecht, M.; Miller, N.; Mueller, L.A.; et al. TAIR: A resource for integrated Arabidopsis data. Funct. Integr. Genom. 2002, 2, 239–253. [Google Scholar] [CrossRef] [PubMed]
- Nakaya, A.; Ichihara, H.; Asamizu, E.; Shirasawa, S.; Nakamura, Y.; Tabata, S.; Hirakawa, H. Plant genome database Japan (PGDBj). In Plant Genomics Databases; Springer: Berlin/Heidelberg, Germany, 2017; pp. 45–77. [Google Scholar]
- Cooper, L.; Meier, A.; Laporte, M.A.; Elser, J.L.; Mungall, C.; Sinn, B.T.; Cavaliere, D.; Carbon, S.; Dunn, N.A.; Smith, B.; et al. The Planteome database: An integrated resource for reference ontologies, plant genomics and phenomics. Nucleic Acids Res. 2018, 46, D1168–D1180. [Google Scholar] [CrossRef] [PubMed] [Green Version]
- Singh, G.; Kuzniar, A.; van Mulligen, E.M.; Gavai, A.; Bachem, C.W.; Visser, R.G.F.; Finkers, R. QTLTableMiner++: Semantic mining of QTL tables in scientific articles. BMC Bioinform. 2018, 19, 183. [Google Scholar] [CrossRef] [PubMed]
- OpenRefine. Available online: https://openrefine.org/ (accessed on 17 September 2020).
- Kuzniar, A. SIGA.py. zenodo 2019. [Google Scholar] [CrossRef]
- Meroño-Peñuela, A.; Hoekstra, R. grlc Makes GitHub Taste Like Linked Data APIs; The Semantic Web, Sack, H., Rizzo, G., Steinmetz, N., Mladenić, D., Auer, S., Lange, C., Eds.; Springer International Publishing: Cham, Switzerland, 2016; pp. 342–353. [Google Scholar]
- Da Silva Santos, L.B.; Wilkinson, M.D.; Kuzniar, A.; Kaliyaperumal, R.; Thompson, M.; Dumontier, M.; Burger, K. FAIR Data Points supporting big data interoperability. In Enterprise Interoperability in the Digitized and Networked Factory of the Future; ISTE: Guimaraes, Portugal, 2016; pp. 270–279. [Google Scholar]
- Europe PMC Consortium. Europe PMC: A full-text literature database for the life sciences and platform for innovation. Nucleic Acids Res. 2015, 43, D1042–D1048. [Google Scholar] [CrossRef] [PubMed] [Green Version]
- Generic Feature Format version 3 (GFF3). Available online: https://github.com/The-Sequence-Ontology/Specifications/blob/master/gff3.md (accessed on 17 September 2020).
- Kuzniar, A.; Singh, G. Quantitative Trait Loci of Solanaceae species. zenodo 2019. [Google Scholar] [CrossRef]
- Singh, G.; Kuzniar, A. QTLTableMiner++. zenodo 2019. [Google Scholar] [CrossRef]
- Kuzniar, A. Genome annotations of Solanaceae species. zenodo 2019. [Google Scholar] [CrossRef]
- SGN: Solanum lycopersicum (ITAG2.4). Available online: ftp://ftp.solgenomics.net/genomes/Solanumlycopersicum/annotation/ITAG2.4release/ (accessed on 2 September 2019).
- SGN: Solanum pennellii (v2). Available online: ftp://ftp.solgenomics.net/genomes/Solanumpennellii. (accessed on 2 September 2019).
- SGN: Solanum tuberosum (PGSC v4.03). Available online: ftp://ftp.solgenomics.net/genomes/Solanumtuberosum/annotation/PGSC4.03/ (accessed on 2 September 2019).
- Ensembl Plants: Solanum lycopersicum. Available online: http://plants.ensembl.org/Solanum_lycopersicum (accessed on 2 September 2019).
- Ensembl Plants: Solanum tuberosum. Available online: http://plants.ensembl.org/Solanum_tuberosum (accessed on 2 September 2019).
- UniProt: Solanum lycopersicum. Available online: https://www.uniprot.org/proteomes/UP000004994 (accessed on 2 September 2019).
- UniProt: Solanum tuberosum. Available online: https://www.uniprot.org/proteomes/UP000011115 (accessed on 2 September 2019).
- Gene Ontology (GO). Available online: http://purl.obolibrary.org/obo/go.owl (accessed on 2 September 2019).
- Sequence Ontology (SO). Available online: http://purl.obolibrary.org/obo/so.owl (accessed on 2 September 2019).
- Feature Annotation Location Description Ontology (FALDO). Available online: http://biohackathon.org/resource/faldo.rdf (accessed on 2 September 2019).
- UniProt RDF Schema Ontology (UniProt Core). Available online: https://www.uniprot.org/core/ (accessed on 2 September 2019).
- Semanticscience Integrated Ontology (SIO). Available online: http://semanticscience.org/ontology/sio.owl (accessed on 2 September 2019).
- Relation Ontology (RO). Available online: http://purl.obolibrary.org/obo/ro.owl (accessed on 2 September 2019).
- Plant Ontology (PO). Available online: http://purl.obolibrary.org/obo/po.owl (accessed on 2 September 2019).
- Phenotype Quality Ontology (PATO). Available online: http://purl.obolibrary.org/obo/pato.owl (accessed on 2 September 2019).
- Boettiger, C. An introduction to Docker for reproducible research. ACM SIGOPS Oper. Syst. Rev. 2015, 49, 71–79. [Google Scholar] [CrossRef]
- Ansible. Available online: https://www.ansible.com/ (accessed on 1 July 2020).
- Kuzniar, A.; Kaliyaperumal, R. FAIR Data Point. zenodo 2017. [Google Scholar] [CrossRef]
- Jupyter Notebooks for the biological use cases. Available online: https://github.com/candYgene/notebooks/ (accessed on 17 September 2020).
- Kluyver, T.; Ragan-Kelley, B.; Pérez, F.; Granger, B.E.; Bussonnier, M.; Frederic, J.; Kelley, K.; Hamrick, J.B.; Grout, J.; Corlay, S.; et al. Jupyter Notebooks-a publishing format for reproducible computational workflows. In Proceedings of the ELPUB, Göttingen, Germany, 7–9 June 2016; pp. 87–90. [Google Scholar]
- Haggard, J.E.; Johnson, E.B.; Clair, D.A.S. Multiple QTL for horticultural traits and quantitative resistance to Phytophthora infestans linked on Solanum habrochaites chromosome 11. G3 (Bethesda) 2015, 5, 219–233. [Google Scholar] [CrossRef] [PubMed] [Green Version]
- Wu, S.; Zhang, B.; Keyhaninejad, N.; Rodríguez, G.R.; Kim, H.J.; Chakrabarti, M.; Illa-Berenguer, E.; Taitano, N.K.; Gonzalo, M.; Díaz, A.; et al. A common genetic mechanism underlies morphological diversity in fruits and other plant organs. Nat. Commun. 2018, 9, 4734. [Google Scholar] [CrossRef] [PubMed]
- Ballester, A.; Tikunov, Y.; Molthoff, J.; Grandillo, S.; Viquez-Zamora, M.; de Vos, R.; de Maagd, R.; van Heusden, S.; Bovy, A. Identification of Loci Affecting Accumulation of Secondary Metabolites in Tomato Fruit of a Solanum lycopersicum X Solanum chmielewskii Introgression Line Population. Front. Plant Sci. 2016, 7, 1428. [Google Scholar] [CrossRef] [PubMed] [Green Version]
- Shulaev, V.; Silverman, P.; Raskin, I. Airborne signalling by methyl salicylate in plant pathogen resistance. Nature 1997, 385, 718. [Google Scholar] [CrossRef]
- Luengwilai, K.; Fiehn, O.E.; Beckles, D.M. Comparison of leaf and fruit metabolism in two tomato (Solanum lycopersicum L.) genotypes varying in total soluble solids. J. Agric. Food Chem. 2010, 58, 11790–11800. [Google Scholar] [CrossRef]
- Di Mascio, P.; Kaiser, S.; Sies, H. Lycopene as the most efficient biological carotenoid singlet oxygen quencher. Arch. Biochem. Biophys. 1989, 274, 532–538. [Google Scholar] [CrossRef]
- Falara, V.; Akhtar, T.A.; Nguyen, T.T.; Spyropoulou, E.A.; Bleeker, P.M.; Schauvinhold, I.; Matsuba, Y.; Bonini, M.E.; Schilmiller, A.L.; Last, R.L.; et al. The tomato terpene synthase gene family. Plant Physiol. 2011, 157, 770–789. [Google Scholar] [CrossRef] [Green Version]
- Warwick Vesztrocy, A.; Dessimoz, C.; Redestig, H. Prioritising candidate genes causing QTL using hierarchical orthologous groups. Bioinformatics 2018, 34, i612–i619. [Google Scholar] [CrossRef]
- Lin, F.; Fan, J.; Rhee, S.Y. QTG-Finder: A machine-learning based algorithm to prioritize causal genes of quantitative trait loci in Arabidopsis and rice. bioRxiv 2019, 484204. [Google Scholar] [CrossRef] [Green Version]
- Schneider, A.; Dessimoz, C.; Gonnet, G.H. OMA Browser—exploring orthologous relations across 352 complete genomes. Bioinformatics 2007, 23, 2180–2182. [Google Scholar] [CrossRef]
- Fridman, E.; Liu, Y.; Carmel-Goren, L.; Gur, A.; Shoresh, M.; Pleban, T.; Eshed, Y.; Zamir, D. Two tightly linked QTLs modify tomato sugar content via different physiological pathways. Mol. Genet. Genomics 2002, 266, 821–826. [Google Scholar] [CrossRef] [PubMed]
- Bouvier, F.; D’Harlingue, A.; Backhaus, R.A.; Kumagai, M.H.; Camara, B. Identification of neoxanthin synthase as a carotenoid cyclase paralog. Eur. J. Biochem. 2000, 267, 6346–6352. [Google Scholar] [CrossRef] [PubMed] [Green Version]
- Tadmor, Y.; Fridman, E.; Gur, A.; Larkov, O.; Lastochkin, E.; Ravid, U.; Zamir, D.; Lewinsohn, E. Identification of malodorous, a wild species allele affecting tomato aroma that was selected against during domestication. J. Agric. Food Chem. 2002, 50, 2005–2009. [Google Scholar] [CrossRef] [PubMed]
- Marti, R.; Rosello, S.; Cebolla-Cornejo, J. Tomato as a source of carotenoids and polyphenols targeted to cancer prevention. Cancers 2016, 8, 58. [Google Scholar] [CrossRef]
- Giuliano, G. Plant carotenoids: Genomics meets multi-gene engineering. Curr. Opin. Plant Biol. 2014, 19, 111–117. [Google Scholar] [CrossRef] [Green Version]
- Shi, J.; Kakuda, Y.; Yeung, D. Antioxidative properties of lycopene and other carotenoids from tomatoes: Synergistic effects. Biofactors 2004, 21, 203–210. [Google Scholar] [CrossRef]
- Cunningham, F.X.; Pogson, B.; Sun, Z.; McDonald, K.A.; DellaPenna, D.; Gantt, E. Functional analysis of the beta and epsilon lycopene cyclase enzymes of Arabidopsis reveals a mechanism for control of cyclic carotenoid formation. Plant Cell 1996, 8, 1613–1626. [Google Scholar] [CrossRef] [Green Version]
- Rousseaux, M.C.; Jones, C.M.; Adams, D.; Chetelat, R.; Bennett, A.; Powell, A. QTL analysis of fruit antioxidants in tomato using Lycopersicon pennellii introgression lines. Theor. Appl. Genet. 2005, 111, 1396–1408. [Google Scholar] [CrossRef]
- Tieman, D.M.; Loucas, H.M.; Kim, J.Y.; Clark, D.G.; Klee, H.J. Tomato phenylacetaldehyde reductases catalyze the last step in the synthesis of the aroma volatile 2-phenylethanol. Phytochemistry 2007, 68, 2660–2669. [Google Scholar] [CrossRef]
- Zhang, J.; Zhao, J.; Xu, Y.; Liang, J.; Chang, P.; Yan, F.; Li, M.; Liang, Y.; Zou, Z. Genome-wide association mapping for tomato volatiles positively contributing to tomato flavor. Front. Plant Sci. 2015, 6, 1042. [Google Scholar] [CrossRef] [Green Version]
- Socaci, S.A.; Socaciu, C.; Mureşan, C.; Fărcaş, A.; Tofană, M.; Vicaş, S.; Pintea, A. Chemometric discrimination of different tomato cultivars based on their volatile fingerprint in relation to lycopene and total phenolics content. Phytochem. Anal. 2014, 25, 161–169. [Google Scholar] [CrossRef] [PubMed]
- Rambla, J.L.; Medina, A.; Fernandez-del Carmen, A.; Barrantes, W.; Grandillo, S.; Cammareri, M.; Lopez-Casado, G.; Rodrigo, G.; Alonso, A.; Garcia-Martinez, S.; et al. Identification, introgression, and validation of fruit volatile QTLs from a red-fruited wild tomato species. J. Exp. Bot. 2016, 68, 429–442. [Google Scholar] [CrossRef] [PubMed]
- Hassani-Pak, K.; Rawlings, C. Knowledge discovery in biological databases for revealing candidate genes linked to complex phenotypes. J. Integr. Bioinform. 2017, 14, 1–9. [Google Scholar] [CrossRef] [PubMed]
- KNETMiner. Available online: https://knetminer.com/resources (accessed on 31 August 2020).
- Hulse-Kemp, A.M.; Maheshwari, S.; Stoffel, K.; Hill, T.A.; Jaffe, D.; Williams, S.R.; Weisenfeld, N.; Ramakrishnan, S.; Kumar, V.; Shah, P.; et al. Reference quality assembly of the 3.5-Gb genome of Capsicum annuum from a single linked-read library. Hortic. Res. 2018, 5, 4. [Google Scholar] [CrossRef] [PubMed] [Green Version]
- Hirakawa, H.; Shirasawa, K.; Miyatake, K.; Nunome, T.; Negoro, S.; Ohyama, A.; Yamaguchi, H.; Sato, S.; Isobe, S.; Tabata, S.; et al. Draft genome sequence of eggplant (Solanum melongena L.): The representative solanum species indigenous to the old world. DNA Res. 2014, 21, 649–660. [Google Scholar] [CrossRef] [PubMed] [Green Version]
- Singh, G. Genomics Data Integration for Knowledge Discovery Using Genome Annotations from Molecular Databases and Scientific Literature. Ph.D. Thesis, Wageningen University, Wageningen, The Netherlads, 2019. [Google Scholar]


| Traits of Interest | GO Annotations | Chromosome | Location | Candidate Genes | References |
|---|---|---|---|---|---|
| Total soluble solids (Brix) | GO:0006094, GO:0046370, GO:0046369, GO:0005985, GO:0015770 | 9 | 3474710 | Lin5 | [68] |
| Carotenoid compounds (Lycopene beta-cyclase activity) | GO:0045436, GO:0016117 | 6 | Solyc06g073470 Solyc06g083850.3 | Soly06g074240.1 | [69] |
| Polyphenolic compounds (2-phenylethanol, phenylacetaldehyde) | GO:0016747, GO:0102387, GO:0018449, GO:0004029, GO:0008957, GO:1990055, GO:0050177, GO:0018814 | 8 | 55068565-63267130 | LePAR | [70] |
| Terpenoid compounds | GO:0003677, GO:0045893 | 1 | 86142248-86467672 | Terpense synthase | [64] |
| Volatile compounds (3-methylbuthanal, 3-methylbuthanol) | GO:0046568, GO:0018455, GO:0052676 | 3 | 69685329-71362039 | ? | ? |
| Gene ID | Alias | UniProt ID | Protein Description | Chromosome Number | Location | Prioritization Score |
|---|---|---|---|---|---|---|
| Metabolic Trait 1: Brix/soluble solids | ||||||
| Solyc09g010090.2 | LIN7 | Q8L4N2 | Cell-wall invertase | 9 | 3480545-3484159 | 0.202943 |
| Solyc09g010080.2 | lin5 | Q9LD97 | Beta-fructofuranosidase insoluble isoenzyme 1 | 9 | 3475480-3479343 | 0.172502 |
| Solyc09g010020.2 | - | K4CR31 | 1-aminocyclopropane-1-carboxylate oxidase | 9 | 3447416-3449839 | 0.043606 |
| Metabolic Trait 2: Lycopene beta-cyclase | ||||||
| Solyc06g074240.1 | NSY | K4C9E2 | Chromoplast-specific lycopene beta-cyclase | 6 | 45898227-45899723 | 7.399091 |
| Solyc06g073570.2 | 101245261 | K4C976 | Cytochrome P450 | 6 | 45361777-45364885 | 0.554559 |
| Solyc06g076160.2 | 101248306 | K4C9X6 | Cytochrome P450 | 6 | 47289151-47291972 | 0.471375 |
| Metabolic Trait 3: 2-phenylethanol/phenylacetaldehyde | ||||||
| Solyc08g068190.2 | 101257095 | K4CM43 | Aldehyde dehydrogenase | 8 | 57303048-57306002 | 3.702432 |
| Solyc08g076790.2 | 101246651 | K4CN39 | Cinnamoyl-CoA reductase-like protein | 8 | 60704895-60707948 | 0.009002 |
| Solyc08g068600.2 | 101264847 | K4CM83 | Decarboxylase family protein | 8 | 57730921-57733032 | 0.004473 |
| Metabolic Trait 4: terpenoids | ||||||
| Solyc01g095030.2 | 101257705 | K4AZP3 | MYB transcription factor | 1 | 86401425-86409205 | 20.423493 |
| Solyc01g094820.2 | K4AZM2 | ARID/BRIGHT DNA-binding domain-containing protein | 1 | 86227211-86231284 | 3.715449 | |
| Solyc01g094800.2 | 101245796 | K4AZM0 | Chromodomain-helicase-DNA-binding protein 1 | 1 | 86208090-86220086 | 1.800694 |
| Metabolic Trait 5: Volatile compounds | ||||||
| Solyc03g122130.2 | K4BN11 | L-lactate dehydrogenase | 3 | 70079537-70082001 | 0.008994 | |
| Solyc03g122140.2 | 101255867 | K4BN12 | L-lactate dehydrogenase | 3 | 70082466-70085406 | 0.008994 |
| Solyc03g122170.2 | K4BN15 | L-lactate dehydrogenase | 3 | 70091655-70095510 | 0.008994 | |
© 2020 by the authors. Licensee MDPI, Basel, Switzerland. This article is an open access article distributed under the terms and conditions of the Creative Commons Attribution (CC BY) license (http://creativecommons.org/licenses/by/4.0/).
Share and Cite
Singh, G.; Kuzniar, A.; Brouwer, M.; Martinez-Ortiz, C.; Bachem, C.W.B.; Tikunov, Y.M.; Bovy, A.G.; Finkers, R.G.F.V.a. Linked Data Platform for Solanaceae Species. Appl. Sci. 2020, 10, 6813. https://doi.org/10.3390/app10196813
Singh G, Kuzniar A, Brouwer M, Martinez-Ortiz C, Bachem CWB, Tikunov YM, Bovy AG, Finkers RGFVa. Linked Data Platform for Solanaceae Species. Applied Sciences. 2020; 10(19):6813. https://doi.org/10.3390/app10196813
Chicago/Turabian StyleSingh, Gurnoor, Arnold Kuzniar, Matthijs Brouwer, Carlos Martinez-Ortiz, Christian W. B. Bachem, Yury M. Tikunov, Arnaud G. Bovy, and Richard G. F. Visser and Richard Finkers. 2020. "Linked Data Platform for Solanaceae Species" Applied Sciences 10, no. 19: 6813. https://doi.org/10.3390/app10196813