Article

New Design Concept for Bridge Restrainers with Rubber Cushion Considering Dynamic Action: A Preliminary Study

1
Department of Civil Engineering, Kyushu University, Fukuoka 819-0395, Japan
2
Research and Development Group, Yokogawa Bridge Holdings Corp., Chiba 261-0002, Japan
*
Author to whom correspondence should be addressed.
Appl. Sci. 2020, 10(19), 6847; https://doi.org/10.3390/app10196847
Submission received: 14 August 2020 / Revised: 17 September 2020 / Accepted: 22 September 2020 / Published: 29 September 2020
(This article belongs to the Section Civil Engineering)

Abstract

:
A bridge unseating prevention system is a safety system for bridge collapses caused by large earthquakes, beyond the assumption of aseismic design specifications. Presently, the system is generally adopted for newly constructed bridges and the seismic retrofitting of existing bridges. Cable type bridge restrainers are included in the system, and they are expected to prevent superstructures from exceeding the seat length of substructures. Although the bridge restrainer works during an earthquake, it is designed to be static in the current design. In addition, although the constituent elements of bridge restrainers include a rubber cushion to absorb energy during an earthquake, the effect is not included in the design. Thus, the current design lacks the dynamic effects of earthquakes and the cushioning effect of the rubber. Furthermore, in the case of a multi-span bridge, there is no particular decision as to where the restrainers should be placed or what kind of specifications they should have. Therefore, in this paper, a new design concept that considers the dynamic action of the earthquake and the cushioning effect of the rubber is proposed by coupling dynamic response analysis using a frame finite element (FE) model and a simple genetic algorithm (SGA).

1. Introduction

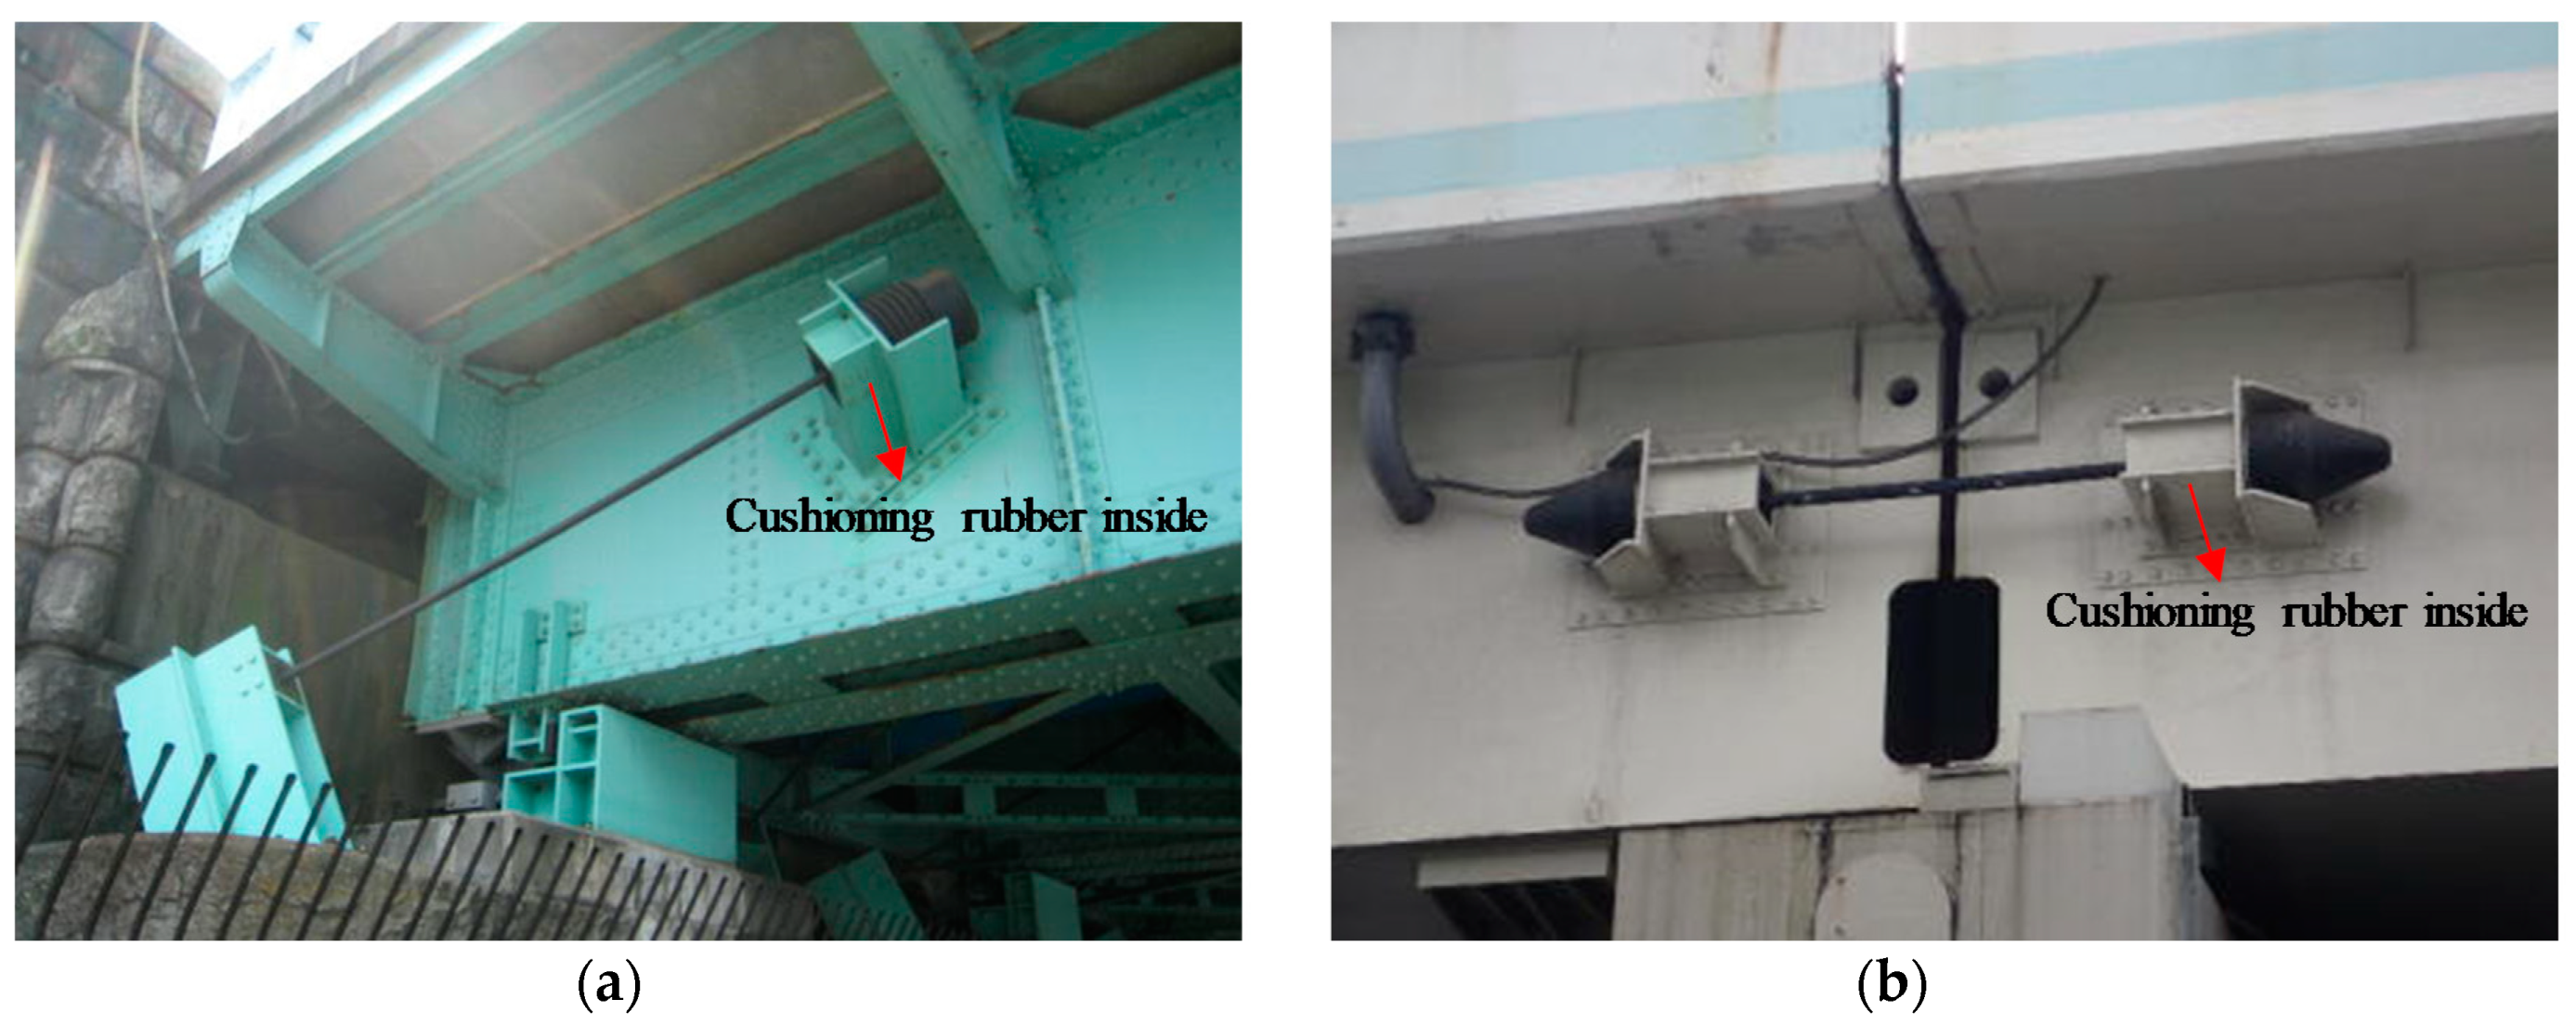
In order to prevent damage to bridge structures by seismic excitation, various types of countermeasures to bridge collapses are adopted in earthquake-prone regions. Focusing on Japan as a representative country, the Great Hanshin earthquake of 1995, which was a strong local earthquake, caused the unseating of many elevated bridges in urban areas. Due to the extensive damage to bridges caused by this earthquake, the guidelines for countermeasures to bridge unseating were significantly modified [1]. At present, the bridge unseating prevention system (Figure 1) is well defined, specifies the girder seating length and requires bridge restrainers and lateral displacement constraint structures to be installed on bridges, according to the Japanese seismic design specifications for highway bridges [2]. The function of this system is to prevent superstructures from being displaced from substructures because of massive earthquakes beyond the assumptions of aseismic design specifications. Bridge restrainers, which are the focus of this paper, are expected to ensure that the relative displacement between the superstructure and substructure does not exceed the girder seating length. Recently, many bridge restrainers have been installed in new bridges and seismically retrofitted bridges, as shown in Figure 2. In the existing design for bridge restrainers, the design load is considered to be 1.5 times the dead load reaction force. However, there is no specific evidence for this regulation. Furthermore, it seems that similar measures for using bridge restrainers as equipment to prevent reseating have been adopted in other earthquake-prone regions in the U.S. [3]. Considering the working situation of a bridge restrainer, the actual maximum acting load on the bridge restrainer is defined by the shared mass of the superstructure, cable stiffness, acting speed, cushioning type, and so on because the superstructure has various collision speeds. However, these influences are not reflected in the existing design method. Instead, a stereotypical and straightforward approach has been used for a long time. Therefore, there is concern that the acting load may temporarily exceed the design load, depending on the situation.
To provide an overview of the existing research, Sakai et al. investigated road bridges that collapsed due to large earthquakes in the past and reported that simply supported girders with plural spans were a big part of numerous collapsed road bridges. They also reported that the collapse of piers accounted for 86% of bridge unseatings [4]. Through a model experiment, Moriyama and Yoda reported that girder pounding had the potential of causing a bridge to collapse when bridge restrainers were not installed [5]. Extensive research on the acting speeds and loads of bridge restrainers, and the cushioning effect of the rubber, was conducted by Nakao and Izuno [6]. Some possibilities beyond the design load are indicated by considering dynamic acting, and there is a need for changing the specifications of the cable and rubber depending on the acting speed.
Various numerical analyses have been conducted to examine the effect of restrainers under seismic loads [7,8], showing that cable restrainers are useful for reducing bearing deformations or for preventing girder unseating problems. Won et al. proposed a simplified and idealized mechanical model for cable bridge restrainers, considering the nonlinear behavior and fracture of the cable, pointing out that the cable length, clearance length, and cable section area should be appropriately selected, depending on the level of seismic intensity [9]. DesRoches and Fenves proposed a design method for cable hinge restrainers. This method enables the design of restrainers using iterative calculations [10].
Meanwhile, the present authors conducted impact tests of cable-type bridge restrainers and analysis that reapproaches the tests for developing a new method for bridge restrainer design that considers cushioning and dynamic effects. Based on the results, the effects of the weight of the mass, collision velocity and cushioning effect of the rubber were quantitatively determined [11,12,13,14]. Thereafter, the formulated spring model, which was defined from the specifications, was derived by using the determined parameters [15].
Against such a background, essentially, it is clear that the bridge restrainer should be designed based on the earthquake response analyses of a total bridge model, as has been done for designing main bridge structures, to capture individual structural features. However, if such a design method is to be adopted for bridge restrainers, two problems should be solved. First, it is unclear how the initial conditions should be set because the exact working condition of the bridge restrainer is still uncertain. Second, conducting thousands of analyses to obtain the optimized solution is impractical and unrealistic because of the huge number of combinations of members such as cable length, cable diameter, rubber size and rubber hardness. Therefore, in Section 2, a dynamic analysis for the whole bridge model is conducted, assuming a situation beyond the assumption of standard earthquake design to clarify the working condition of the bridge restrainer in this study. Then, the working situations of the bridge restrainers are defined. For the given situation, in Section 3 and Section 4, a new design concept for bridge restrainers is proposed wherein the cushioning effect of rubber and the dynamic effect is reflected in the design load. Also, the simple genetic algorithm (SGA) is used to obtain the appropriate combination of members with workable accuracy. This algorithm is described briefly as the simulation of biological evolutionary processes, namely reproduction, selection, crossover and mutation, in order to acquire the best-suited solution (individual) to a combination issue, considering the remaining adaptable individuals under a given condition [16]. The main advantages are as follows: the solution does not tend to converge to a local solution due to multipoint searching, and the algorithm is easy to program. This method is suited for civil engineering because the combination issue is very common in the field of design and construction; hence, it has been widely researched and used [17,18,19,20,21]. In the proposed method, the SGA, coupled with dynamic analysis, is used to obtain an optimized solution within the shortest possible time, considering the actual design work. Finally, the validity of the proposed method is verified by a trial design of bridge restrainers with round-robin calculations. In Section 5, the findings obtained in this study are organized and described.

2. Discussion on the Working Conditions of a Bridge Restrainer

It is important to determine how a bridge restrainer works when the supports are broken, while also discussing the dynamic design method for bridge restrainers. In this section, some earthquake response analyses for a steel bridge with general specifications are discussed to comprehend and organize the mechanism of activating conditions.

2.1. Outline of Dynamic Response Analysis

2.1.1. Analysis Model

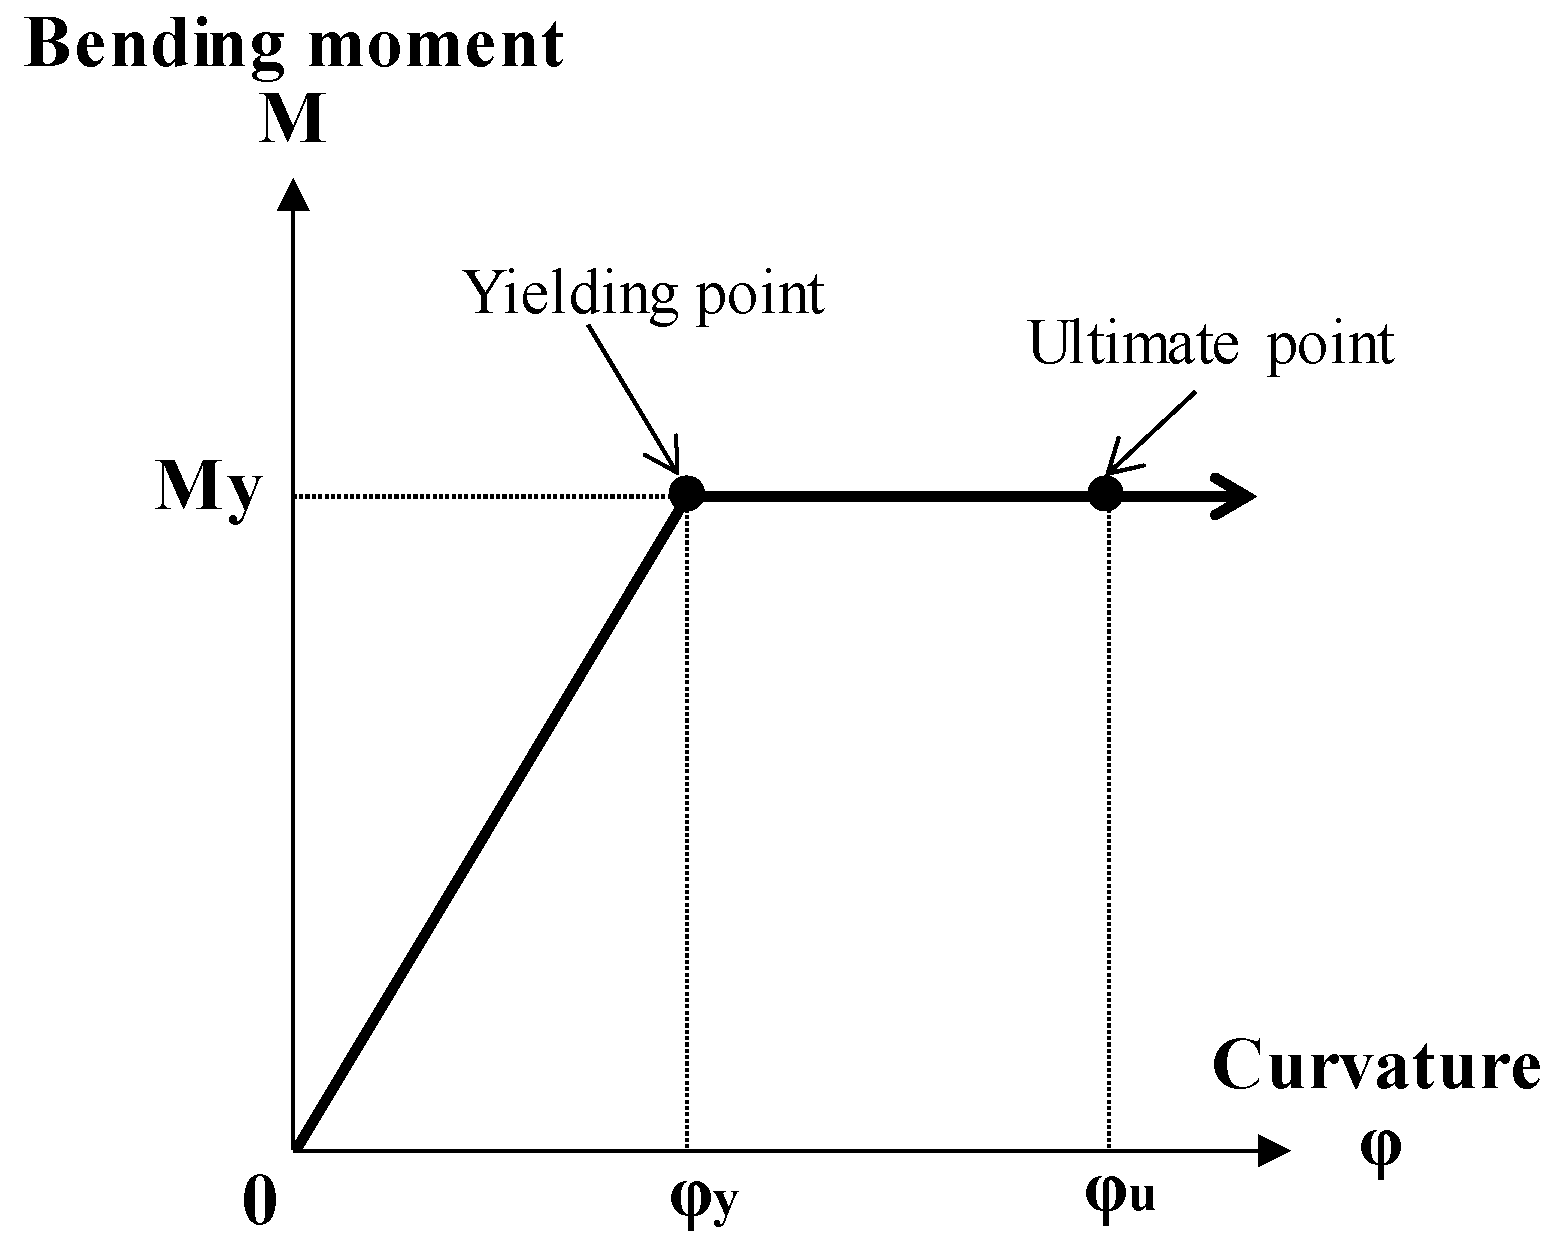
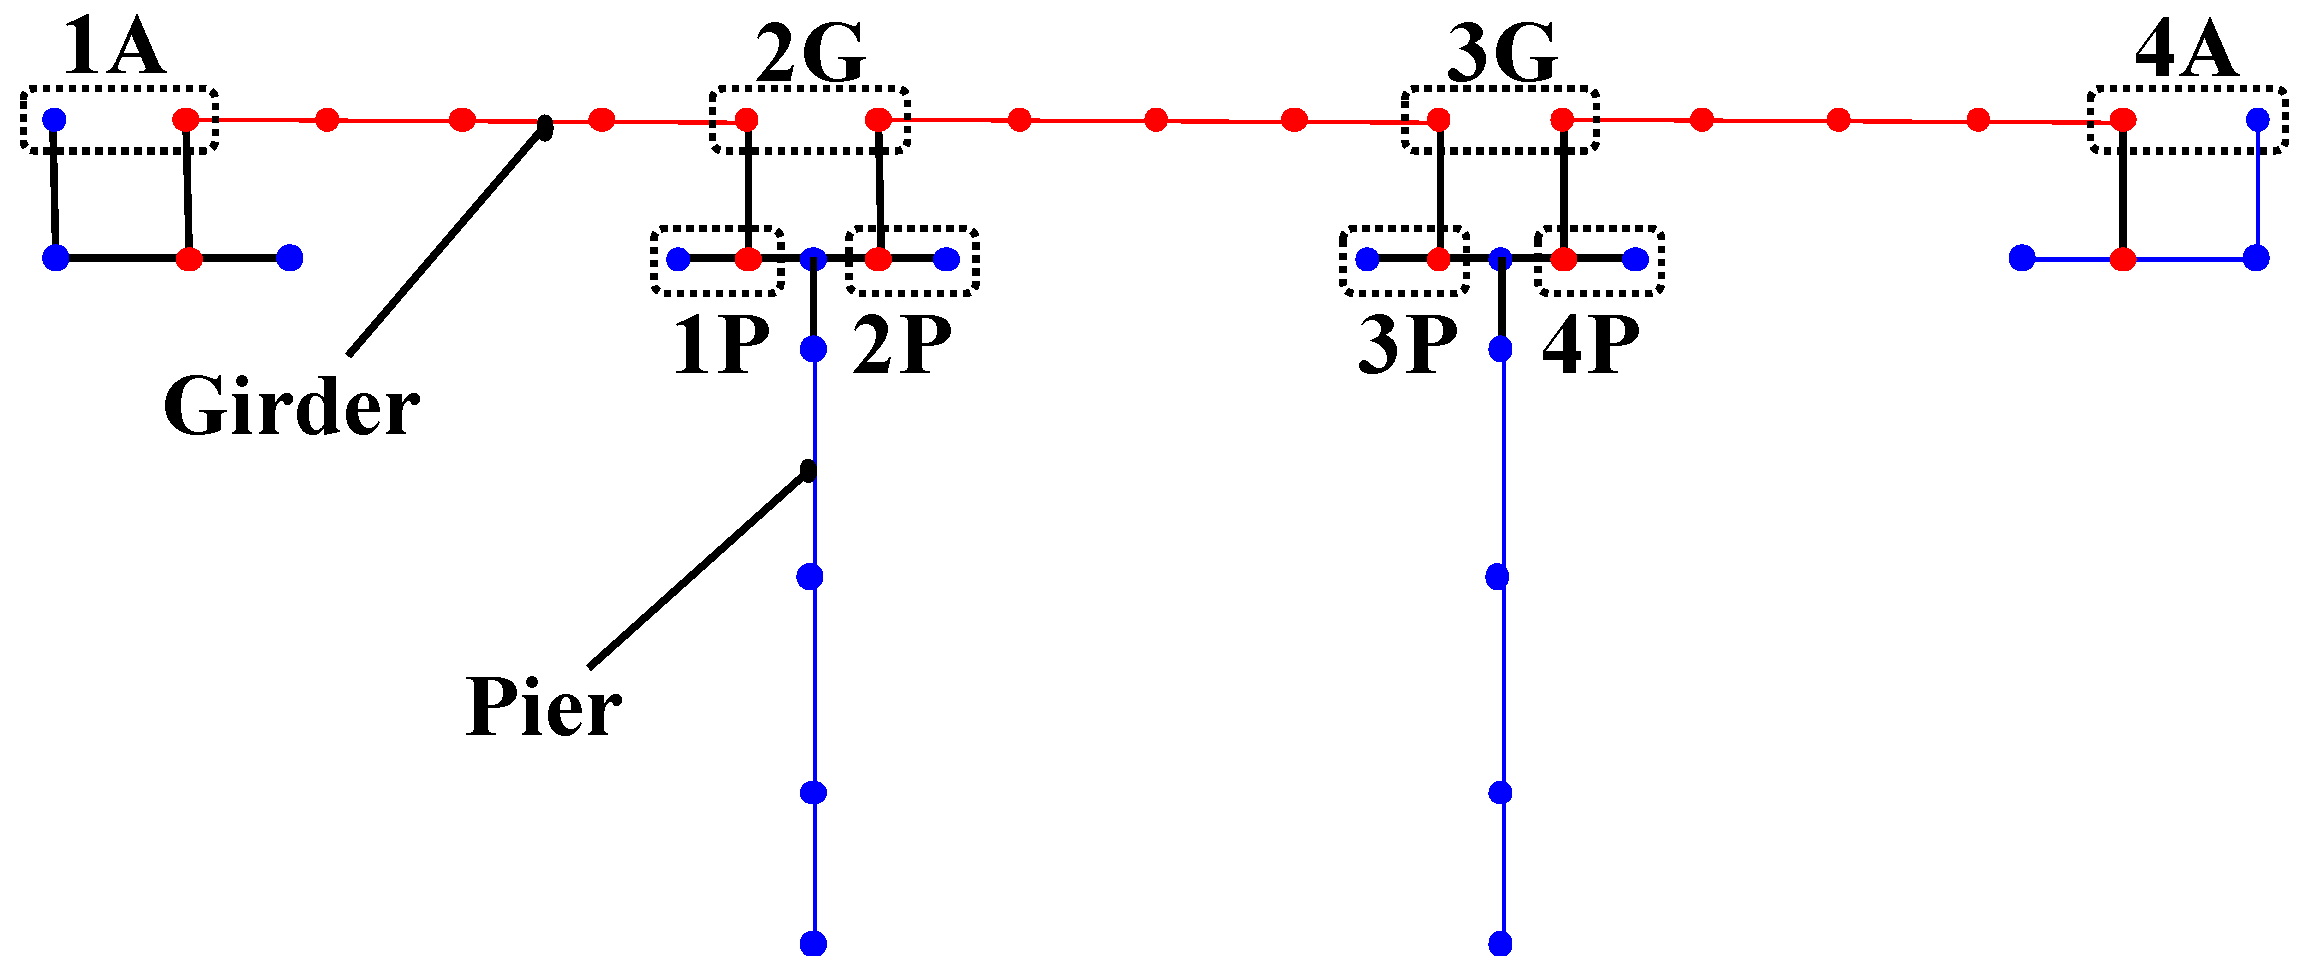
Figure 3 shows a general drawing of the simple span steel I-girder bridge considered in this study, which has typical specifications for the road width, spans and bridge types in Japanese urban areas. The bridge specifications were defined considering actual bridges: span length, 35 m; height of the girder, 2 m; width of the road, 10.5 m with two lanes each way; height of the pier, 12 m; and a soil type of soft ground. Figure 4 shows the analysis model. In this figure, the points basically represent the nodes, and the lines connected between the two nodes represent the elements. Regarding the mesh division, the superstructure divided one span into four sections and the pier was divided into three. The abutment was a rigid element, and a spring element capable of expressing pounding was placed either between the piers or between the pier and the abutment. As a boundary condition, the base of the pier was fixed, with a spring representing the ground. Table 1, Table 2, Table 3 and Table 4 list the parameters used in the analysis. In this analysis model, a structure-simplified frame finite element (FE) model was employed because it is commonly used for bridge design, and it can reduce the calculation cost. The superstructure, constituting a slab and girder, was modeled using the linear beam model, and the pier was modeled as a nonlinear beam model, which is defined based on the perfect elastic-plasticity M-φ model shown in Figure 5. A rigid beam element was used to match the gap between the centroid axis of the superstructure and the top of the substructure.
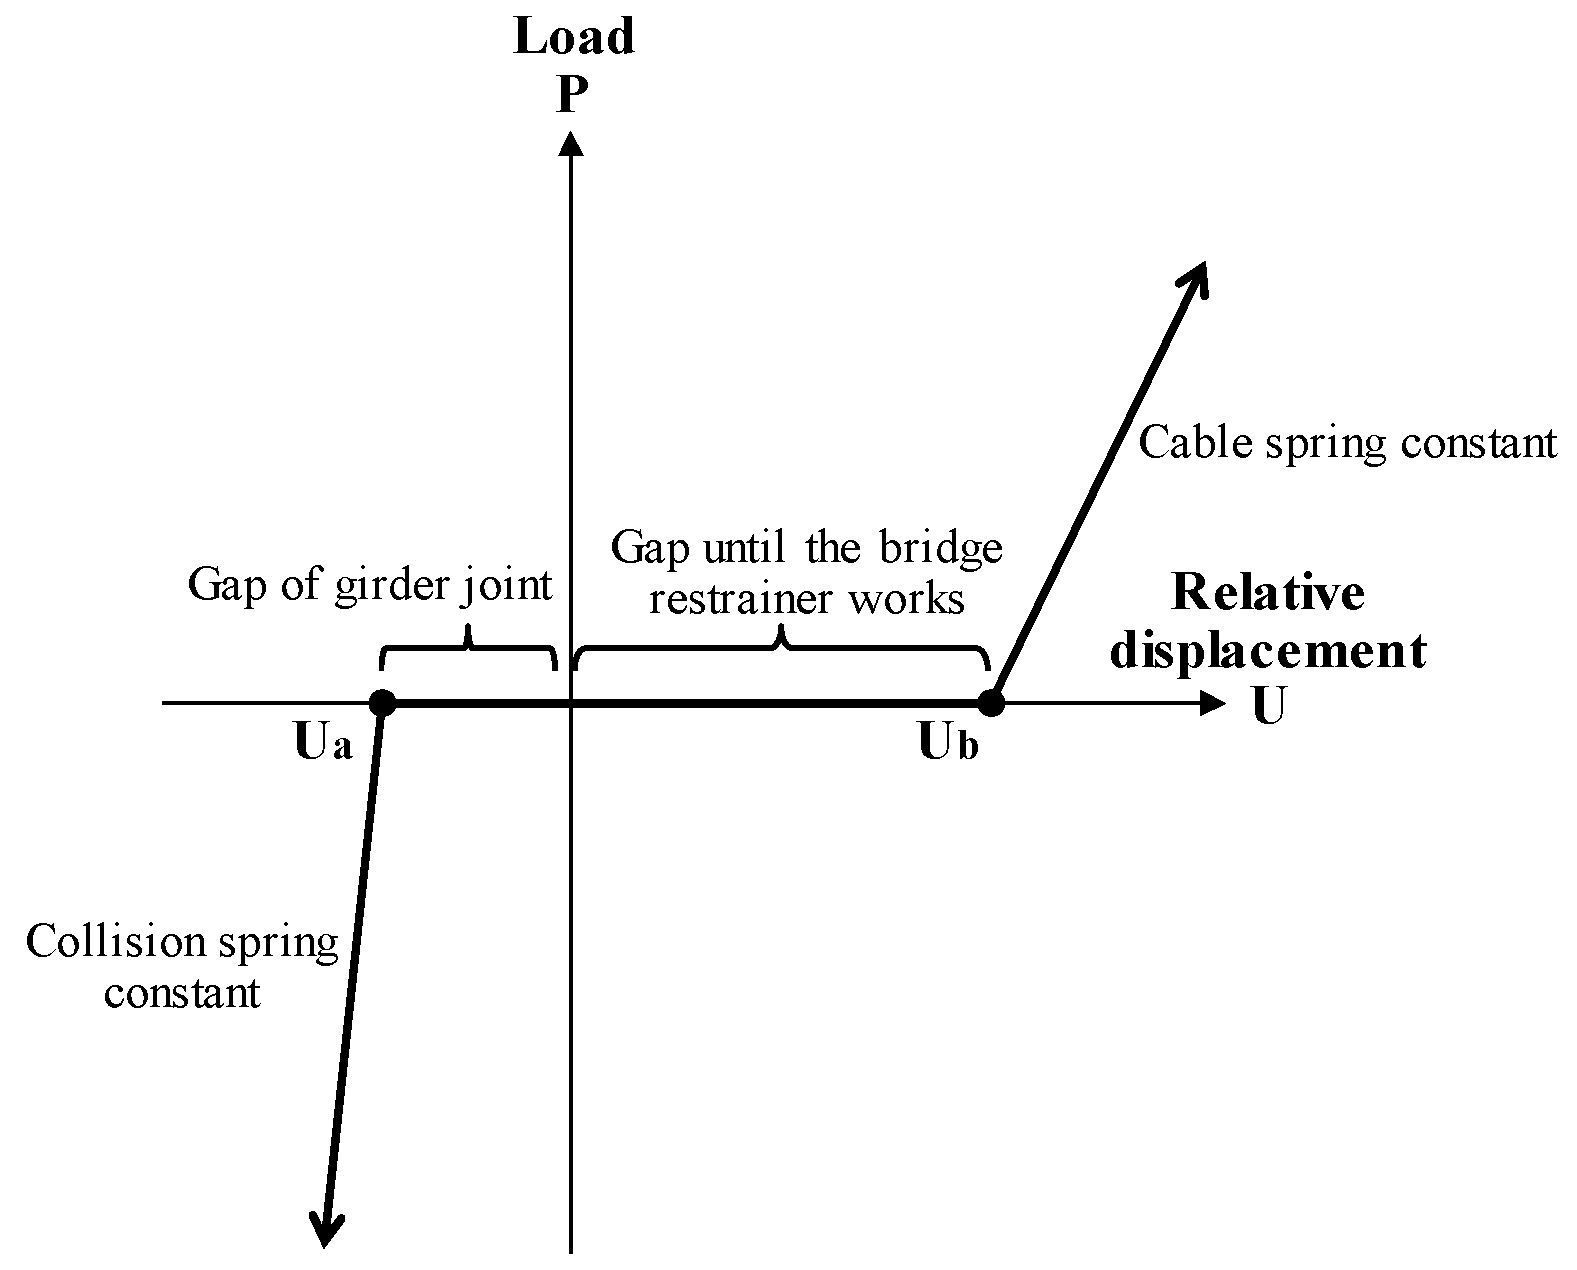
The mass of the structure was distributed among the nodes, and the ground spring comprised of four spring elements (a horizontal spring, vertical spring, rotation spring and coupled spring). Furthermore, considering the pounding within the superstructure, a collision spring was defined as shown in Figure 6 (compression side). With this model assumed as the elastic collision spring model, based on the specifications [2], this spring could be obtained using Equation (1):
k I = n × E s × A s / L s
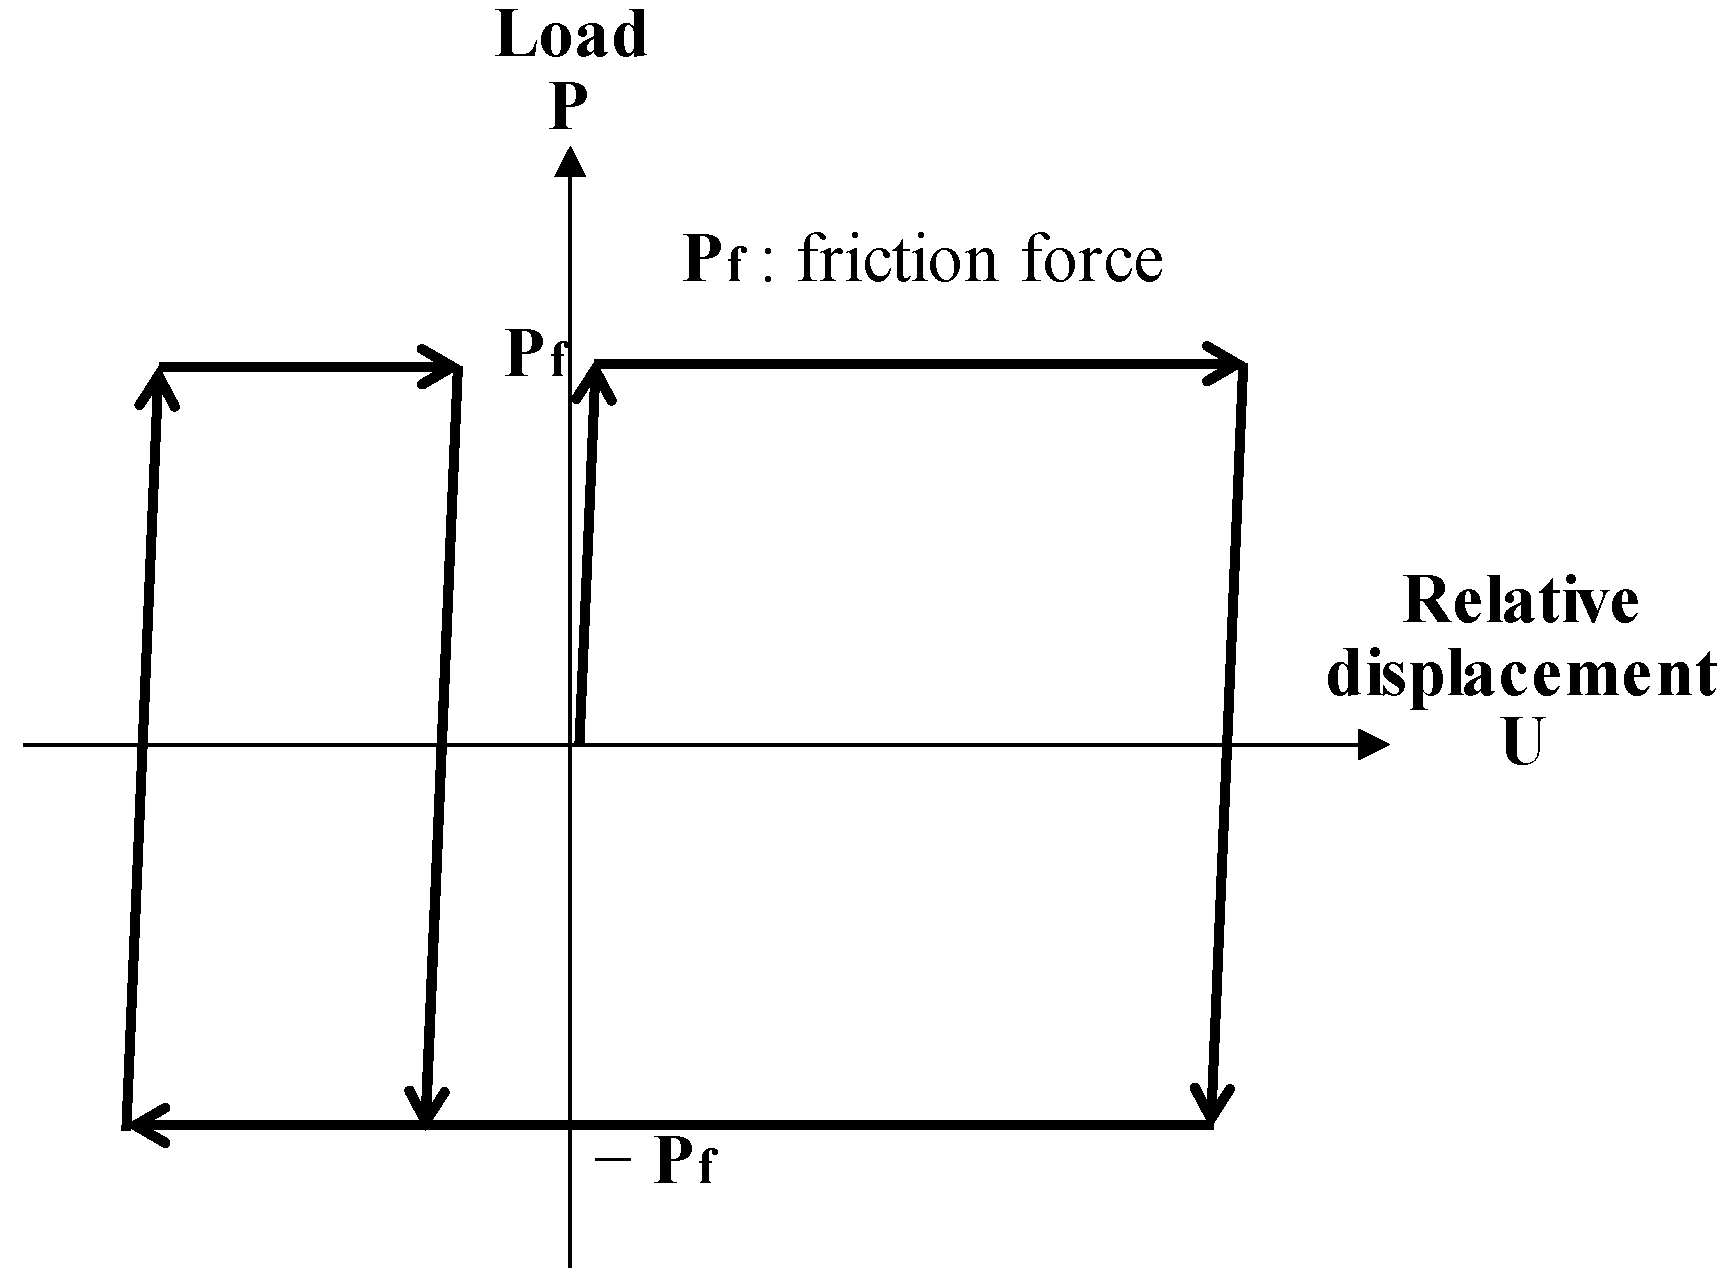
where kI is the collision spring constant, n is the partition number of the beam element, Es × As is the axial direction stiffness of the superstructure and Ls is the length of the girder. Furthermore, the friction between the superstructure and substructure after breaking the fixed support is expressed, as shown in Figure 7. The coefficient of dynamic friction was assumed as 0.05, based on a previous study [4]. Bridge restrainers were installed between girders or between the girder and the pier, and they were modeled by the linear spring, as defined in Figure 6 (tension side) and Equation (2). In addition, the design load of the bridge restrainer was set using Equation (3), which was defined by the dead load as per the existing design method in Japan. Incidentally, the rubber cushion was not considered in this analysis model because the focus was on whether using bridge restrainers was effective:
k c = E c × A c / l c
P d = 1.5 × R d
where kc is the cable spring constant, Ec × Ac is the axial direction stiffness of the cable, lc is the cable length, Pd is the design load of the bridge restrainer and Rd is the dead load of the superstructure on a support line.

2.1.2. Analysis Parameter

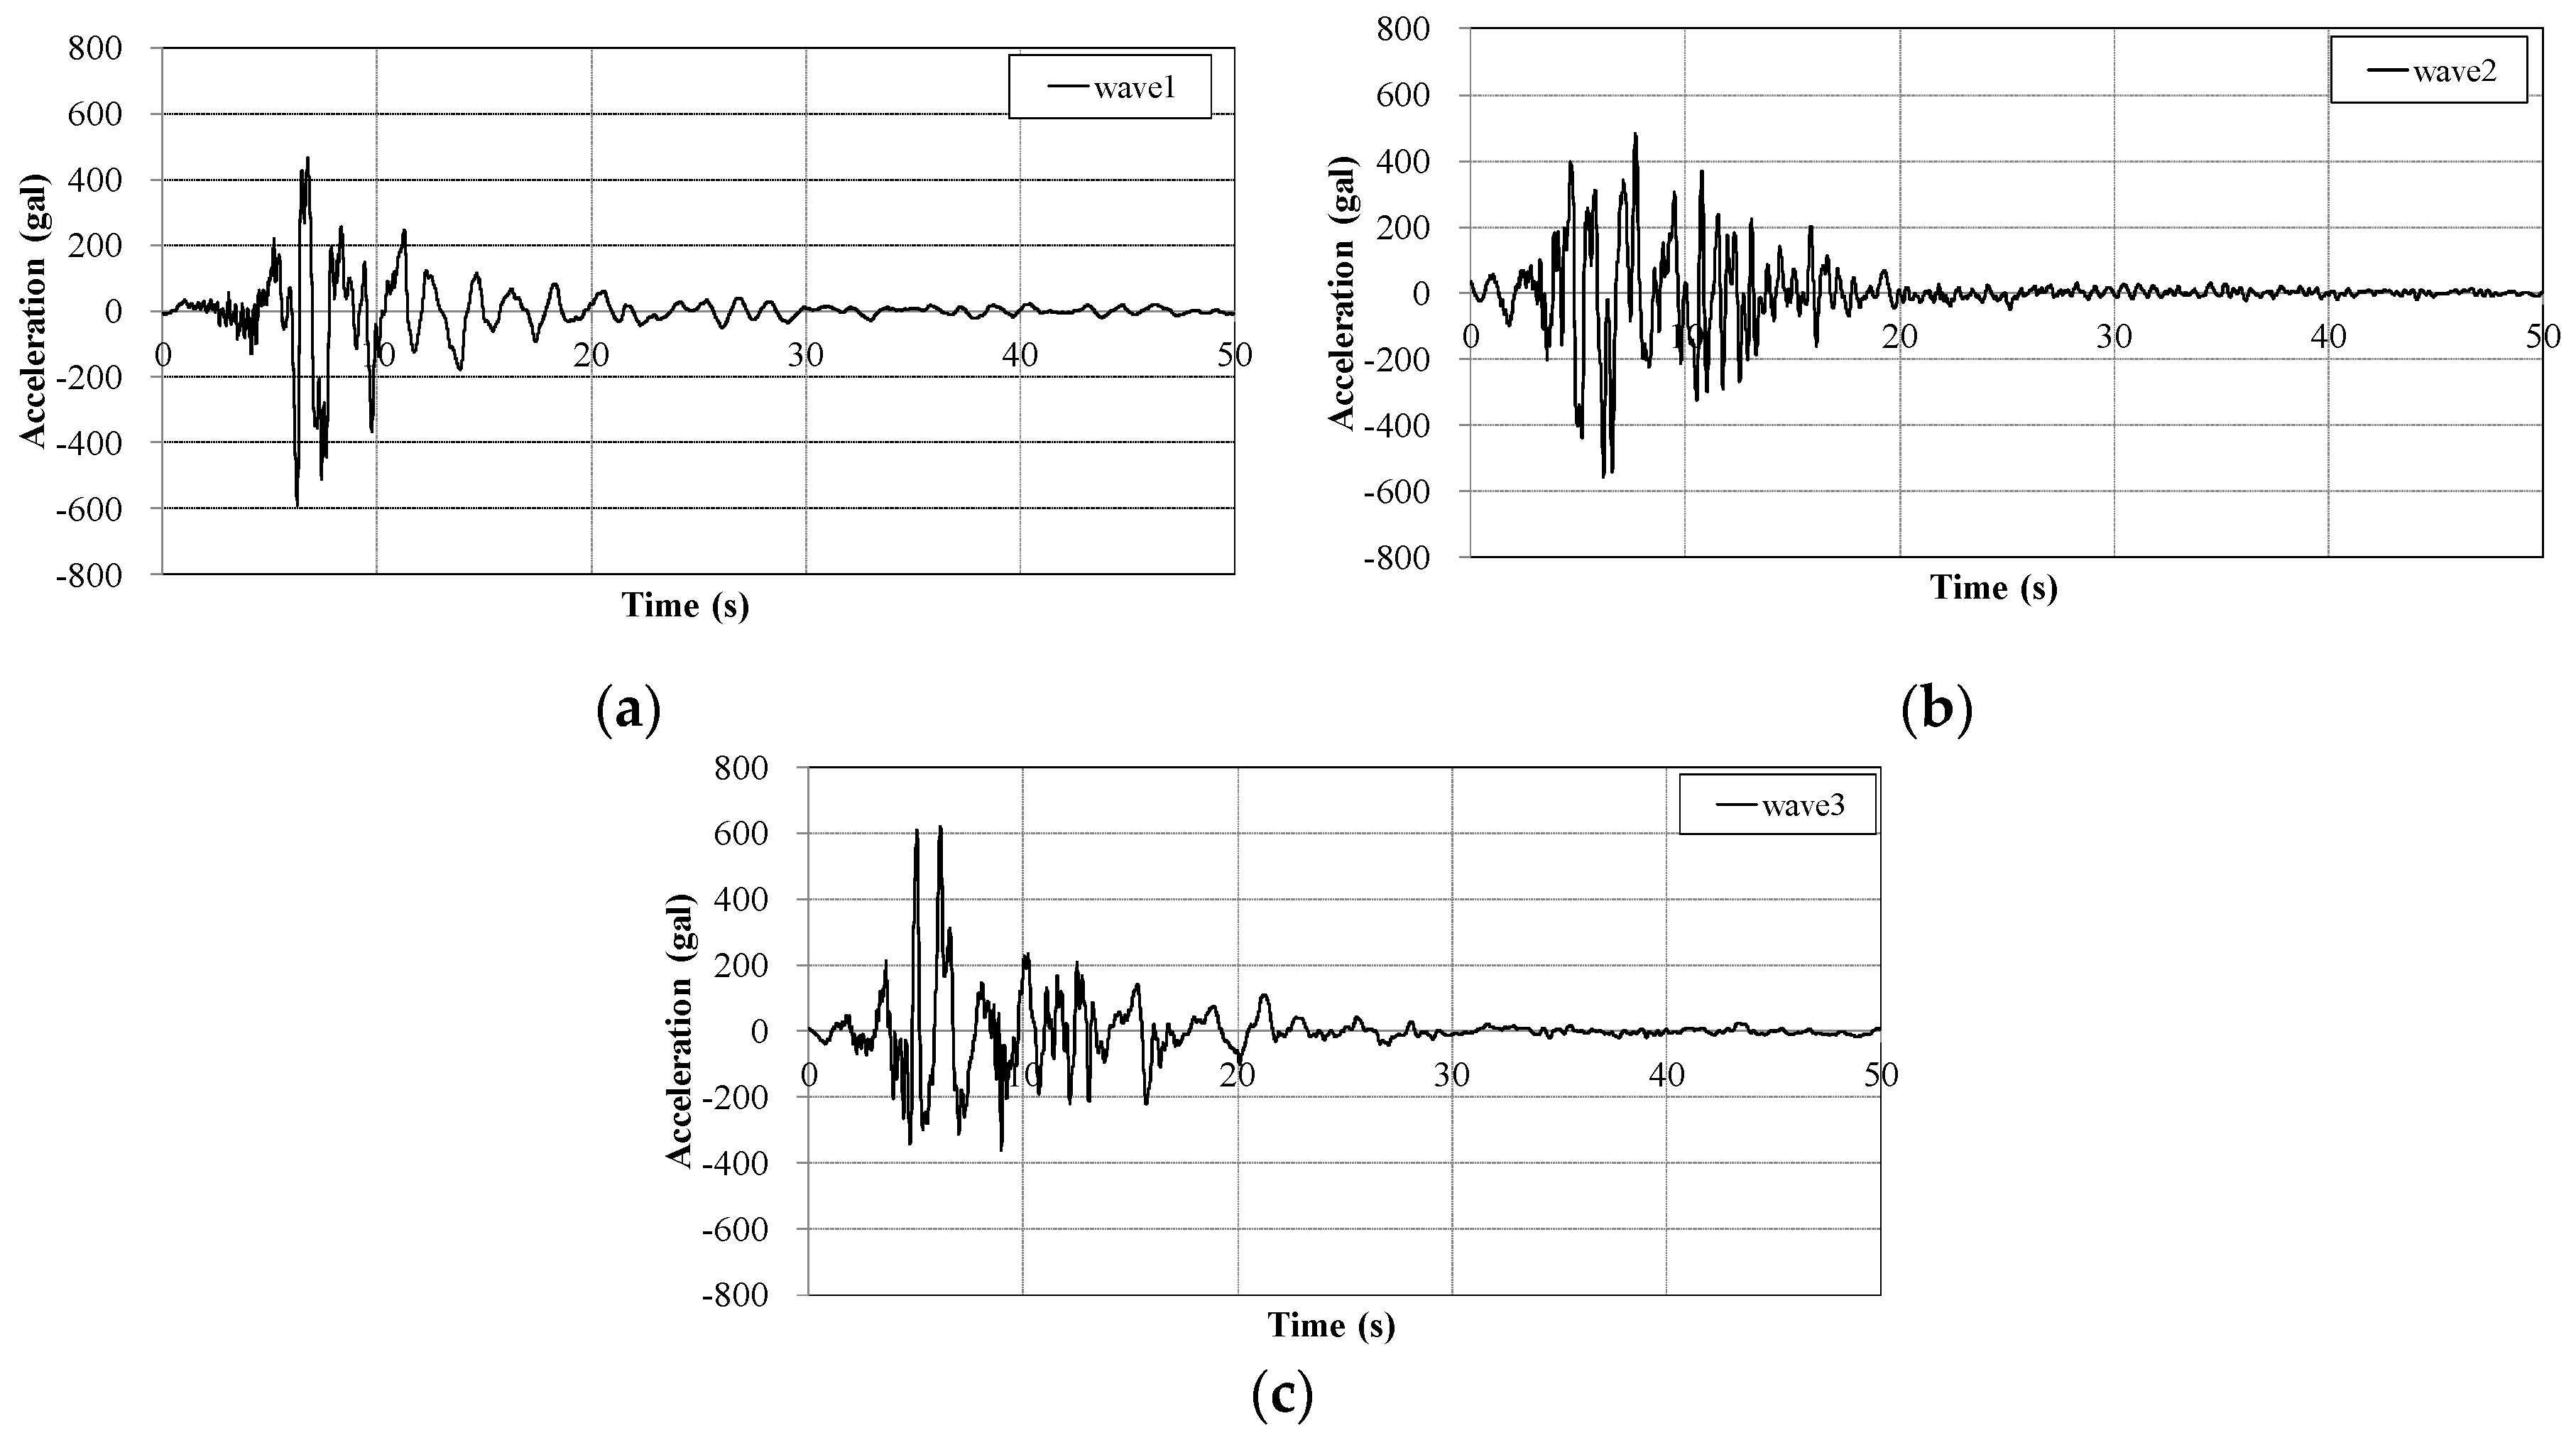
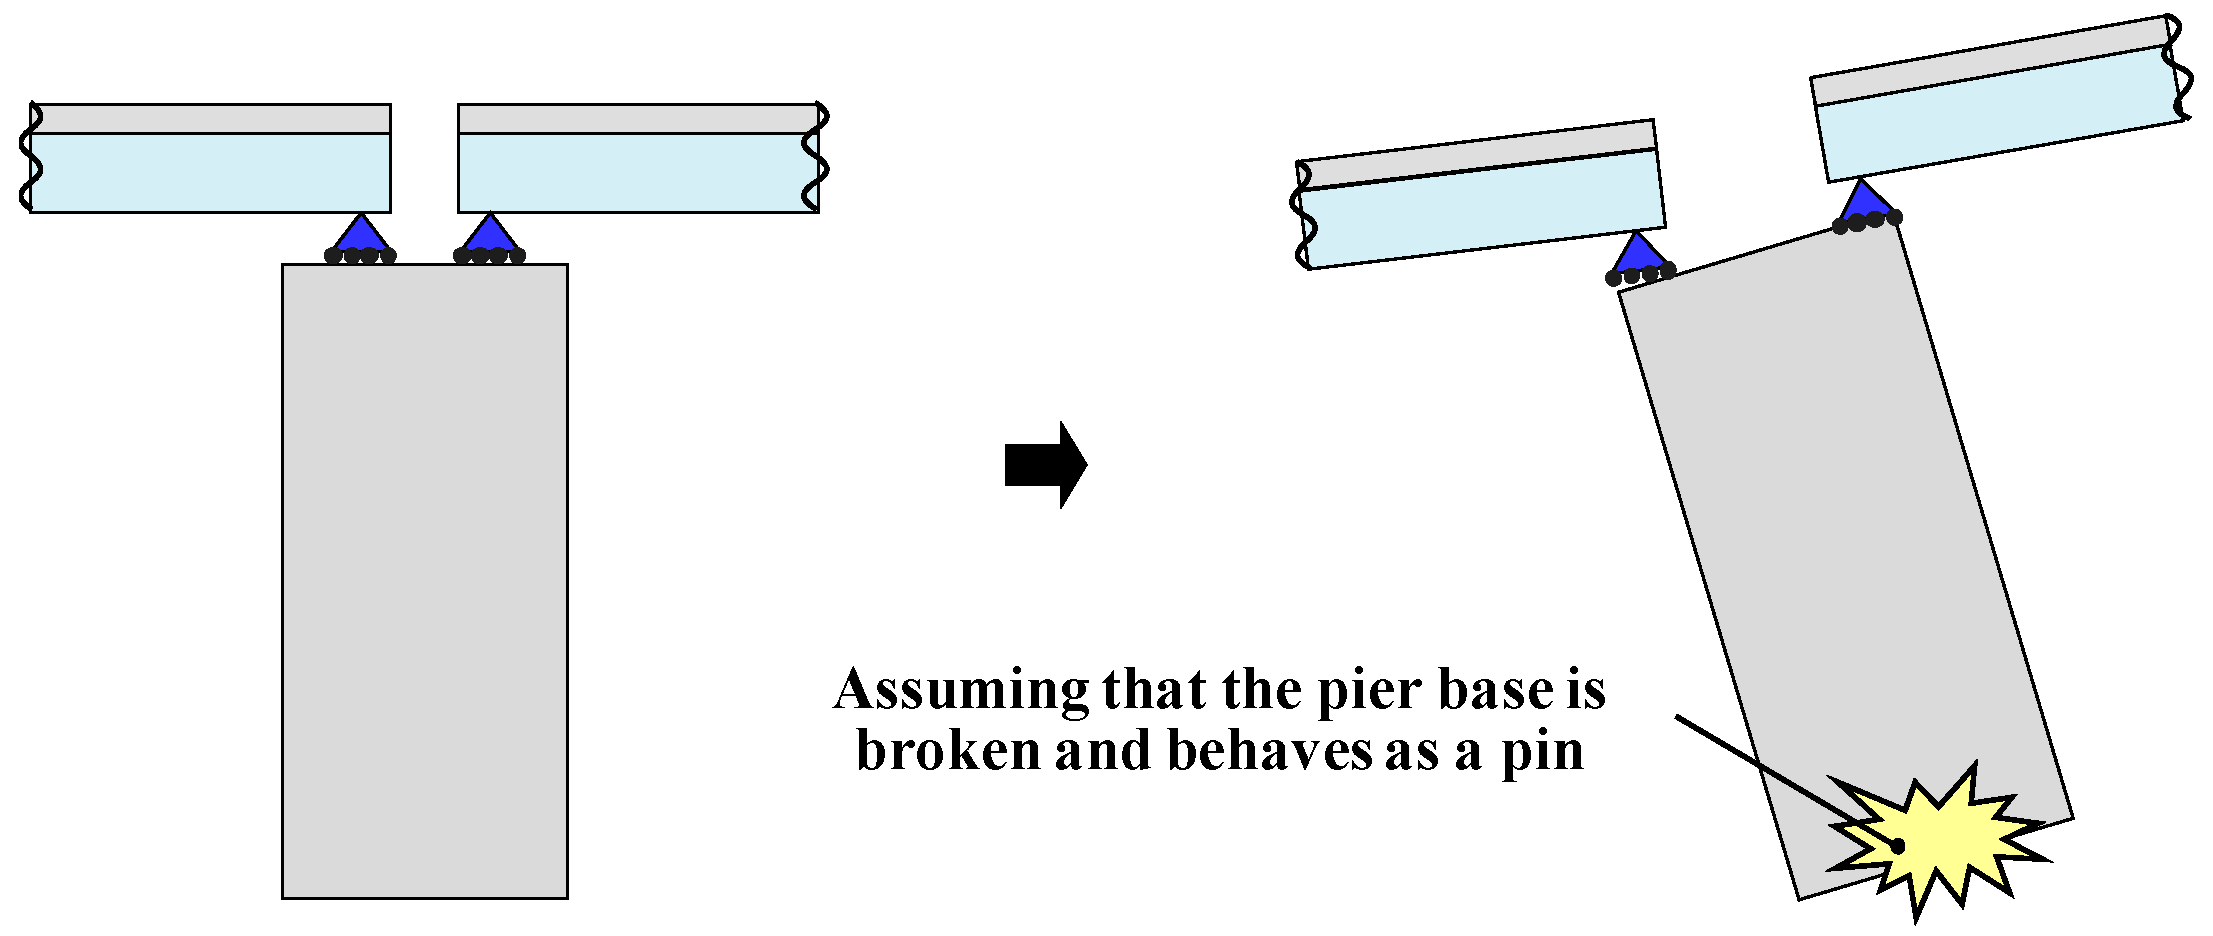
The general-purpose three-dimensional dynamic analysis software TDAP-III [22] was used for the simulation in this study. Here, TDAP III can handle various types of civil engineering structures utilizing beam, solid and spring elements associated with nonlinear hysteresis rules. It has been used mainly in implicit, method-based seismic response analysis, using a frame model of the whole bridge system by using beam elements. The Newmark-beta method was used, wherein the value of beta was 0.25 and the time step was 0.001 s. The time interval of the input earthquake wave was 0.01 s, and the input direction of the wave was along the bridge axis in this time-history response analysis. Rayleigh damping, based on the strain energy proportional damping method, was used for modeling viscous damping. Figure 8 shows three earthquake waves, corresponding to a large inland earthquake used in the analysis. Here, wave 1, 2 and 3 are the waveforms (II-III-1, II-III-2, II-III-3) described in the Japanese seismic design code, respectively. These seismic waves, used in the design of road bridges in Japan, are typical seismic waves that were actually observed, with some modifications depending on the ground type of the bridge erection point. Table 5 lists the base data of the analytical model. The gap between the girders was 80 mm. Pounding between girders or between a girder and an abutment was considered, as shown in Figure 6 (compression side). The gap of the bridge restrainer at work was set as Cf × Se (where Cf is the design displacement coefficient (standard value = 0.75) and Se represents the seating length, as defined in Equation (4)), in accordance with Japanese specifications. Note, however, that the actual working gap ranged from 0.18 × Se to 0.39 × Se (central value: 0.33 × Se), according to the investigations conducted by the present authors on real bridges, as presented in Table 6. Then, the cases of the 0.3 × Se working gap were added to the analysis cases. Furthermore, as an unexpected situation, it was assumed that the base of the pier behaved as a pin, as shown in Figure 9, because of significant damage to the pier base following the previous research report [4]. According to that, the cause of bridge collapse in 86% of the cases was the collapse of the substructure:
S e = 0.7 + 0.005 × L
where Se is minimum bridge girder seating length and L is support length (unit: m).

2.2. Results and Discussion

Table 7 lists the analysis results, and Figure 10 shows the monitoring position of relative displacement, corresponding to the data in Table 7. This table summarizes the results by roughly classifying them into five cases, according to the presence or absence of consideration of fracture and the value of the working gap in the analysis. Furthermore, in each case, there are six cases depending on where the bridge restrainer was installed and the type of input wave. Here, wave 1, 2 and 3 in the table correspond to Figure 8a–c, respectively.
As a result, when relative displacement exceeding the girder seating length occurred, it was judged as a collapsed bridge and the cell was filled with yellow. When it exceeded the working gap of the bridge restrainer, the cell was filled with blue to mean that the bridge restrainer has been activated. Breaking of both the pier base and the fixed support were not considered in Case 1. Therefore, unsurprisingly, the bridge restrainers did not work. The bridge restrainers did not work in Case 2 either, wherein all the fixed supports behaved as movable supports and were destroyed. The maximum relative displacement between the superstructure and substructure was 0.280 m (0.32 × Se). In this case, although all the girders moved in one direction, the maximum gap on the opposite side was 80 mm × 4 = 320 mm (0.37 × Se). Then, it was argued that there was no chance that a bridge restrainer would work unless the relative displacement became very large, because of the large displacement of the top of the pier. In Case 3, considering an unexpected situation, the maximum relative displacement that approached the working displacement of the bridge restrainer was observed when the bridge restrainer was placed between the girder and the pier. Thereafter, a large relative displacement, indicating the collapse of a bridge, was confirmed when the bridge restrainer was placed between the girders. That is, the results indicate that there is a risk of bridge collapse when the bridge restrainer is placed between the girders under assumption. The results of Case 4, wherein the working gap was set to 0.3 × Se based on the actual bridge value, indicate that the bridge restrainer worked when it was placed between the girder and the pier, even if the pier base was not assumed to break. Additionally, assuming a breaking of the pier base in Case 5, the number of the working bridge restrainer increased, and it can be confirmed that the actual load in the cable is beyond the design load.
For all these results, the existing design load is only defined by the dead load. However, it is clear that the loads in the bridge restrainers were completely different, depending on each installation position in a structure, when considering the dynamic earthquake effect. It is also clear that some loads exceeded the design load, depending on unexpected assumptions. In other words, there is a need for a dynamic design for bridge restrainers.

3. Suggestion on New Design Concept for Bridge Restrainers

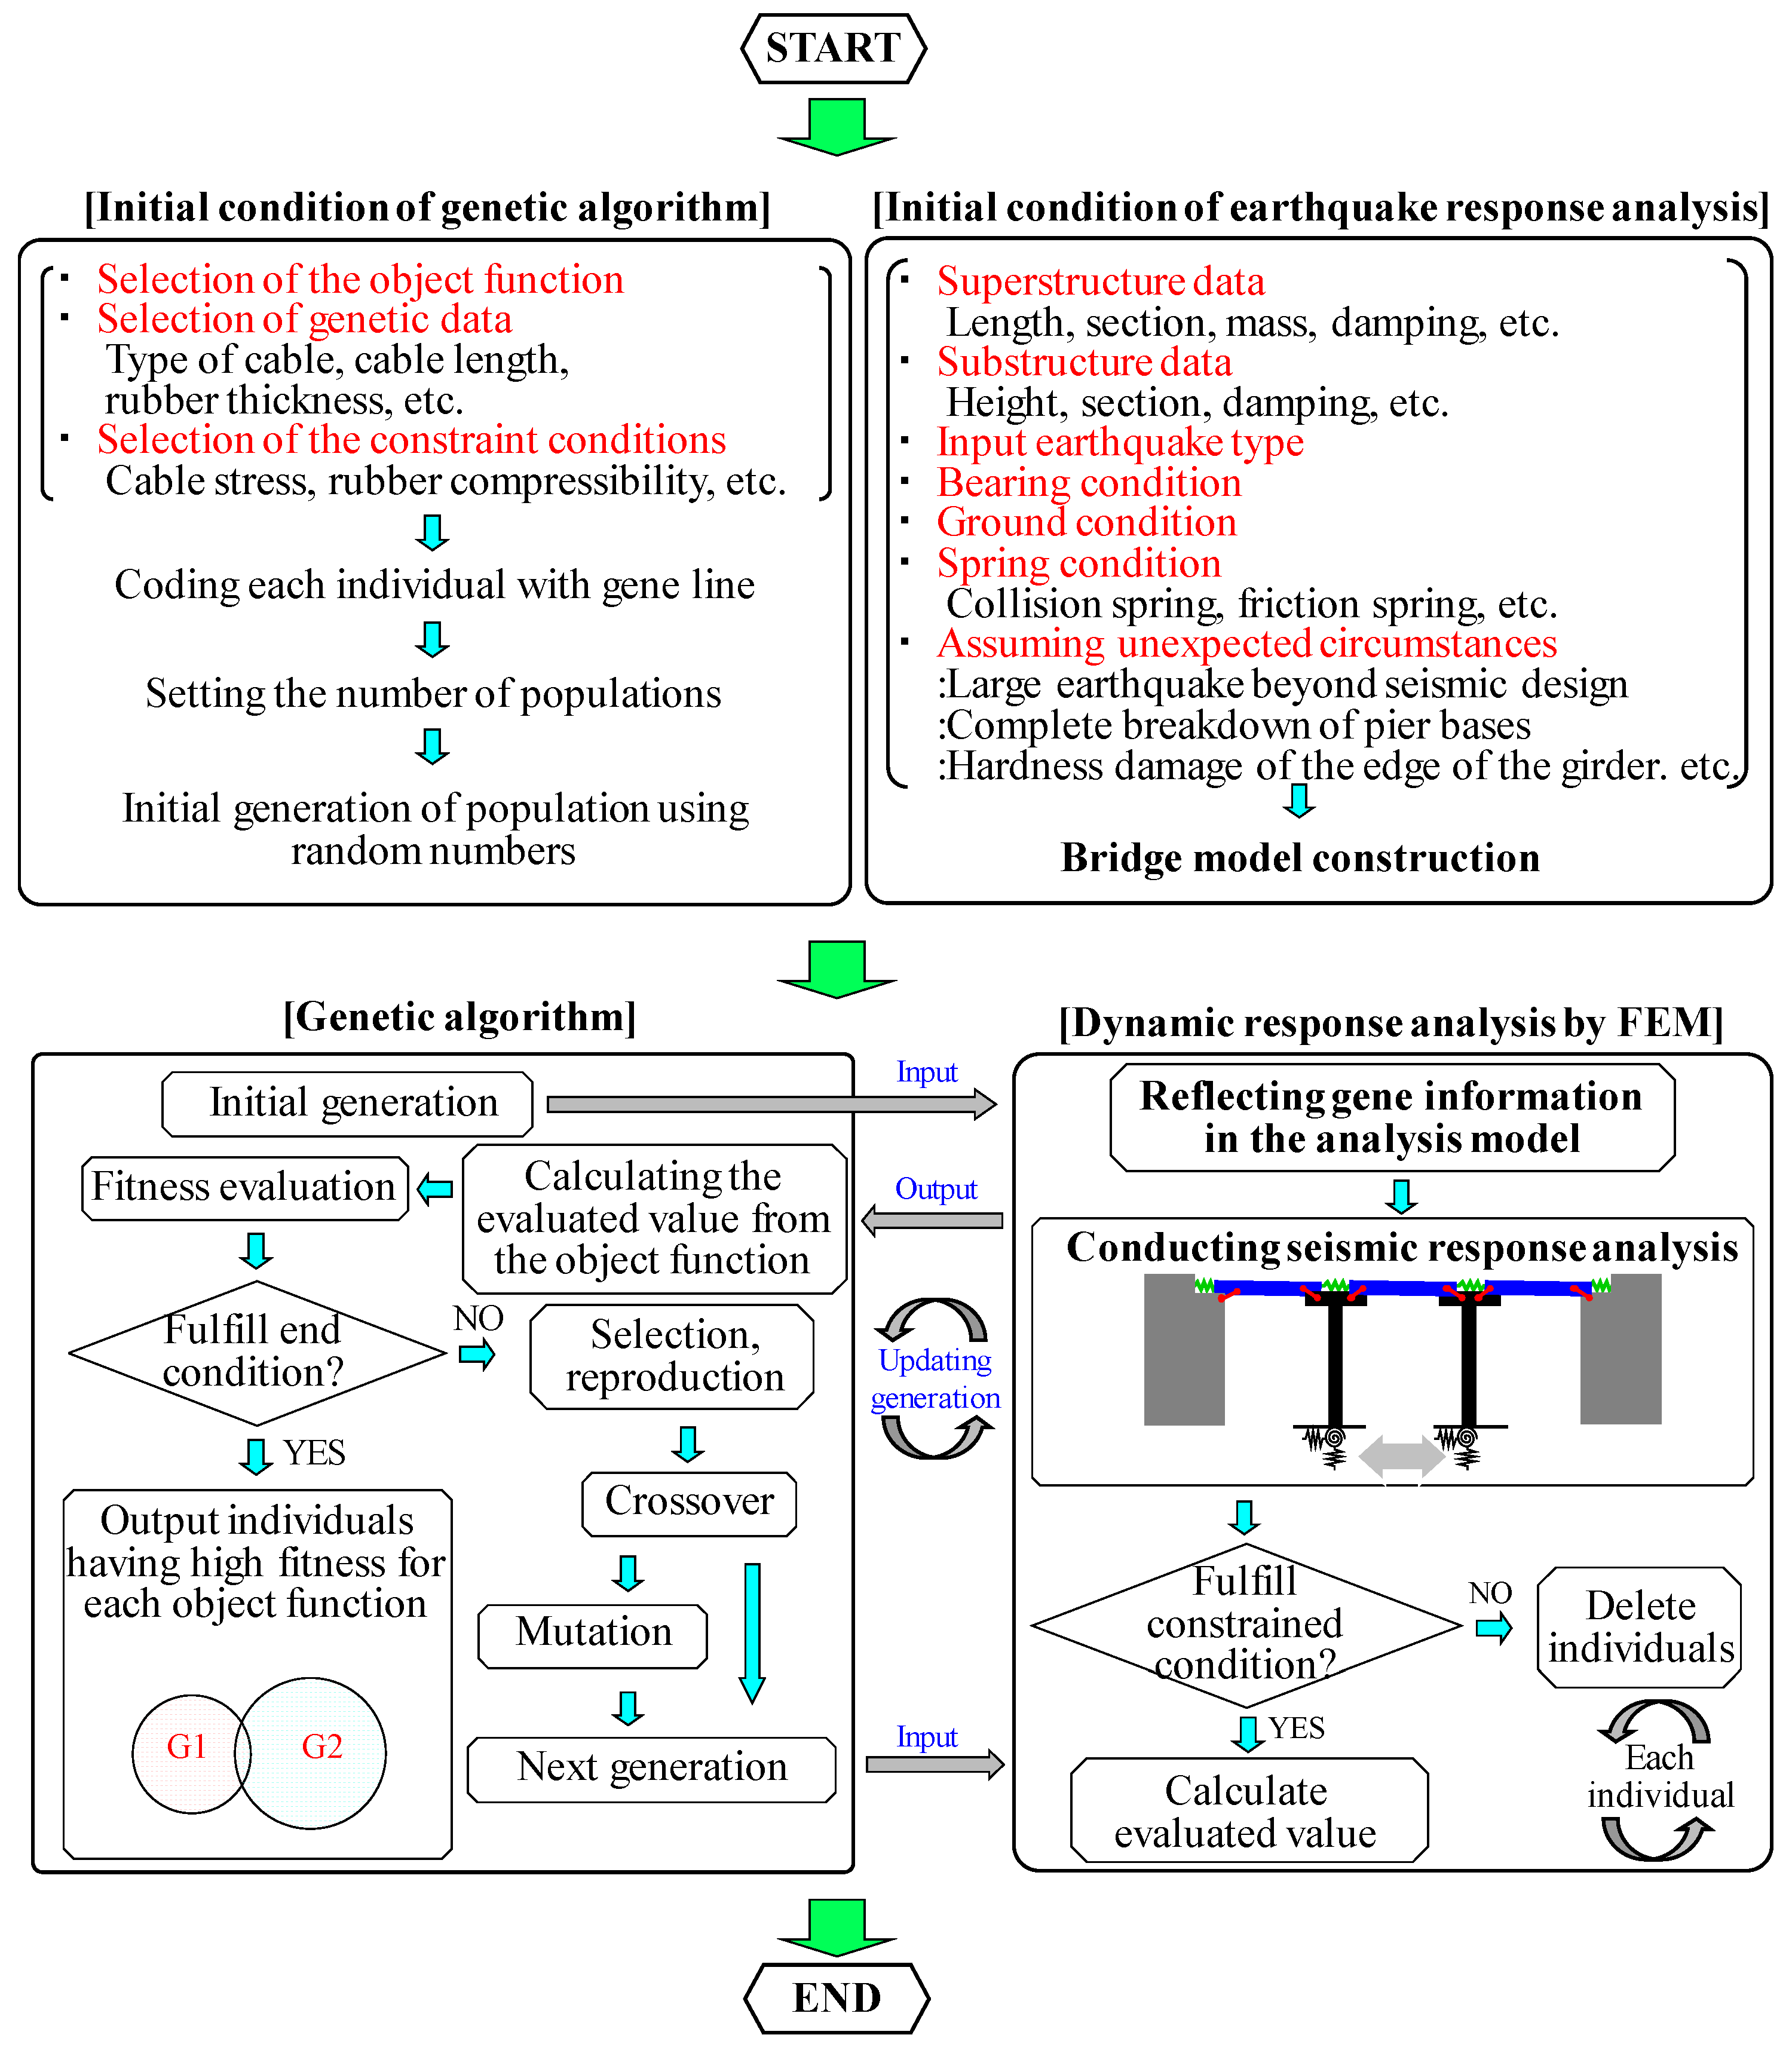
The loads acting on the bridge restrainers differ with the installation position, mass of the superstructure, acting speed and specifications of the cable and rubber cushion. Further, they also differ depending on the structural characteristics of the bridge, including those of the substructure. The design load should be defined dynamically for the entire bridge structure. Therefore, a design concept, as shown in Figure 11, coupled with dynamic analysis and the SGA was proposed, and the coupled analysis program was developed. The SGA finds the optimum combination of bridge restrainer members with reasonable accuracy and speed by using a total bridge model. The outline of the design is described Section 3.2.

3.1. Basics of SGA

A genetic algorithm (GA) is a searching technique used in computer science to find approximate solutions to optimization and searching problems. This algorithm is described briefly as follows: the biological evolutionary processes, namely reproduction, selection, crossover and mutation, are simulated in order to acquire the best-suited solution (individual) in a combination issue, considering the remaining adaptable individuals under a given condition. GAs are used in practice for different purposes, such as solving issues with timetabling, scheduling, engineering design and other optimization problems. Various algorithms have been proposed for GAs, but the one that simplifies the process is the SGA.

3.2. Outline of New Design Concept by Using Coupled Analysis

First, the objective function is defined for optimization, the gene data are selected and the constrained condition is defined. Two object functions are selected. Object function G1 (Equation (5)) minimizes the inclination of the pier, decreasing the risk of and intended to prevent pier collapse, which is considered a significant factor leading to bridge collapse. Object function G2 (Equation (6)) minimizes the cable tension load of a bridge restrainer, considering construction possibility and economic cost. In other words, the compact structure facilitates not only the production cost, but also the handling (weight and peripheral components) during construction, which leads to a reduction in construction cost.
G 1 = max { φ max ( 1 ) ,   φ max ( 2 ) ,   φ max ( 3 ) ,   ,   φ max ( n ) }   min
G 2 = max { T max ( 1 ) ,   T max ( 2 ) ,   T max ( 3 ) ,   ,   T max ( n ) }   min
where φmax(i) is the maximum inclination of the ith pier and Tmax(i) is the maximum axial tension load of the ith cable. Further, the values calculated using these object functions for every bridge combination (in SGA terms, individual) are defined as evaluation values here. Usually, when there are two or more objective functions, the most advanced solution is to use the multi-objective optimization method. However, in this study, we wanted to grasp the effect of each objective function on the results independently. Evaluation was performed individually using the SGA. The individual consists of gene data coded in binary digits, and the gene data represents the cable strength loads and specifications of the rubber cushion, as presented in Table 8. Table 9 shows the coding from the gene data to individuals for the specification of a single bridge restrainer. Here, if a code without a value corresponding to the gene code is selected (for example, hardness 11), it is invalidated, and generation using random numbers is executed again. Thus, if there are n bridge restrainers to be designed, the total number of combinations can reach the number of 1920 n (16 types of cables × 10 cable types of rubber cross-section sizes × 3 types of rubber hardness × 4 types of rubber thickness). Then, the constraint conditions selected are cable stress, compression rate of the rubber cushion and the seating length of bridge girders, as shown in Equations (7)–(9).
σ / σ y 1  
C / C a 1
S S E
where σ is the axial stress of the cable, σy is the allowable axial stress of the cable, C is the compression rate of the rubber cushion, Ca is the allowable compression rate of the rubber cushion (≤60%), S is the relative displacement between the superstructure and substructure and SE is the bridge girder seating length.
The allowable compression rate of the rubber cushion was determined by using the result of the reproduction analysis on the weight drop test [14]. Furthermore, it is estimated that object function G1 has a tendency of selecting individuals with a large stiffness cable (implying a broad cross-section) far from the actual working load. In this case, the composition of the member deteriorates in terms of workability and cost economy because of the increasing total structural scale. Therefore, the weight coefficient, corresponding to the rate of cable yield stress for actual stress, was defined and multiplied with the fitness of each individual to prevent the extreme composition of a member for object function G1, as shown in Table 10.
Second, the initial condition of a target model should be determined for the seismic response analysis. That is, parameters such as the specifications of the superstructure, substructure and ground; support condition; type of input earthquake waves; pounding condition for the girders; and specifications of the spring elements, corresponding to the friction condition between the superstructure and substructure, should be defined. Here, some unexpected situations were considered, such as the collapse of the pier base, following the results discussed in Section 2. Third, the quasi-optimal solution for the combination of the members of the bridge restrainer was obtained by using the SGA in the proposed design method. A seismic analysis was conducted based on certain decisions for the constraint conditions and the evaluation value calculated for an object function. Fitness evaluation was also conducted after an initial random generation of a group of individuals in a population. Individuals that did not satisfy the constraint condition were forcibly considered to have a fitness value of zero. Thereafter, the fitness value was obtained as the square of the point corresponding to the order of each individual for the evaluation value, which was obtained using an objective function [23]. Next, if the end judgment was not satisfied, the next generation was arranged after the operation, which included selection and reproduction with an elite strategy, crossover and mutation [24]. Thereafter, seismic response analysis was conducted again. If the end judgment was satisfied, individuals were arranged in descending order by the fitness values for each objective function. Finally, the high-ranking individuals were selected as potential quasi-optimal solutions.

4. Trial Design by Using the Proposed Concept

4.1. Design Condition and Analysis Model

The intended bridge for the trial design was a three-span, steel I-girder bridge, as described in Section 2 (Figure 12). Figure 13 shows the analysis model. The pounding of bridge girders and friction between the girder and the top of the pier were modeled using spring elements. The bridge restrainer cable was represented by a truss element, only standing against the pull direction, and the rubber cushion was represented by using the formulated nonlinear spring element standing against the compression direction, as presented in Table 11 [15]. Bridge restrainers were placed between the abutment and the girder or between the pier and the girder. The working gap of the bridge restrainer was set at 0.3 × Se because this setting suited actual conditions. In general, it is strange to specify the parameters for every single bridge restrainer, which increases the difficulty of the design and construction processes. For the bridge with a structural symmetry point considered in this study, it is natural to determine the same design parameters for bridge restrainers with symmetric installation positions. Therefore, the bridge restrainers arranged between the abutment and the girder were considered as the X group, and those arranged between girders were considered as the Y group. Furthermore, Java code was used for this analysis, the Newmark-beta method was used for obtaining the time integral directly and the time step was 0.001 s. In the SGA, the population size was 40 individuals, and the number of generations was at least 40 generations. The type of crossover was uniform crossover, the crossover rate was 40% and the mutation operation was such that each gene sequence of each of the 40 individuals was inverted with a 0.5% probability.

4.2. Analysis Cases

Table 12 lists the analysis cases. Here, wave1 was used as the input earthquake wave. All fixed supports were considered to be broken already. Furthermore, it was assumed that the base of the pier broke in Case 1, and the pounding of the bridge girders was ignored in Case 2 to assume an unexpected situation. Object functions G1 (Equation (5)) and G2 (Equation (6)) were used in Case 1, whereas only object function G2 (Equation (6)) was used in Case 2.

4.3. Results and Discussion

Before getting into the main subject, it should be noted that in the conventional design, the 1000 kN-type cabe bridge restrainer shown in Table 4 was installed at all locations. Based on this, let us look at the trial calculation results using the proposed method. Table 13 and Table 14 lists the results of Case 1, wherein the pier base was assumed to be broken. Only the Y group, wherein bridge restrainers were installed between the pier and the girder, worked when both object functions G1 and G2 were adopted. According to Table 13, the order of the maximum inclination of the pier is not much different from the order of the table because the weight coefficient, which was determined by the ratio of the actual force on the cable to the yield force, influenced the evaluation value obtained using object function G1. This result indicates that the 1900 kN-type cable and the rubber cushion with a hardness of 55°, a thickness of 50 mm and a cross-sectional area of 300 mm2 can be selected when the values of both the pier inclination and the actual cable force are minimal. For the X group, however, it was judged that the bridge restrainer was not needed; there exists the possibility of judging that a bridge restrainer is required according to the assumed situation. Next, Table 15 presents the results of Case 2, wherein no pounding of the bridge girders was assumed. In this case, the bridge restrainers of the X and Y groups worked. This result indicates that the 1900 kN-type cable and the rubber cushion with a hardness of 65°, a thickness of 50 mm and a cross-sectional area of 300 × 300 mm2 for the X group, and a 2700 kN-type cable and a rubber cushion with a hardness of 65°, a thickness of 50 mm and a cross-sectional area of 300 × 300 mm2 for the Y group can be selected when the value of the actual cable force is minimal. The necessity of the bridge restrainers in the X group was divided, depending on the difference between Case 1 and Case 2. In other words, in a situation where a collision between girders cannot be expected, the necessity of fall prevention becomes more important.

4.4. Verification of the Optimized Solution

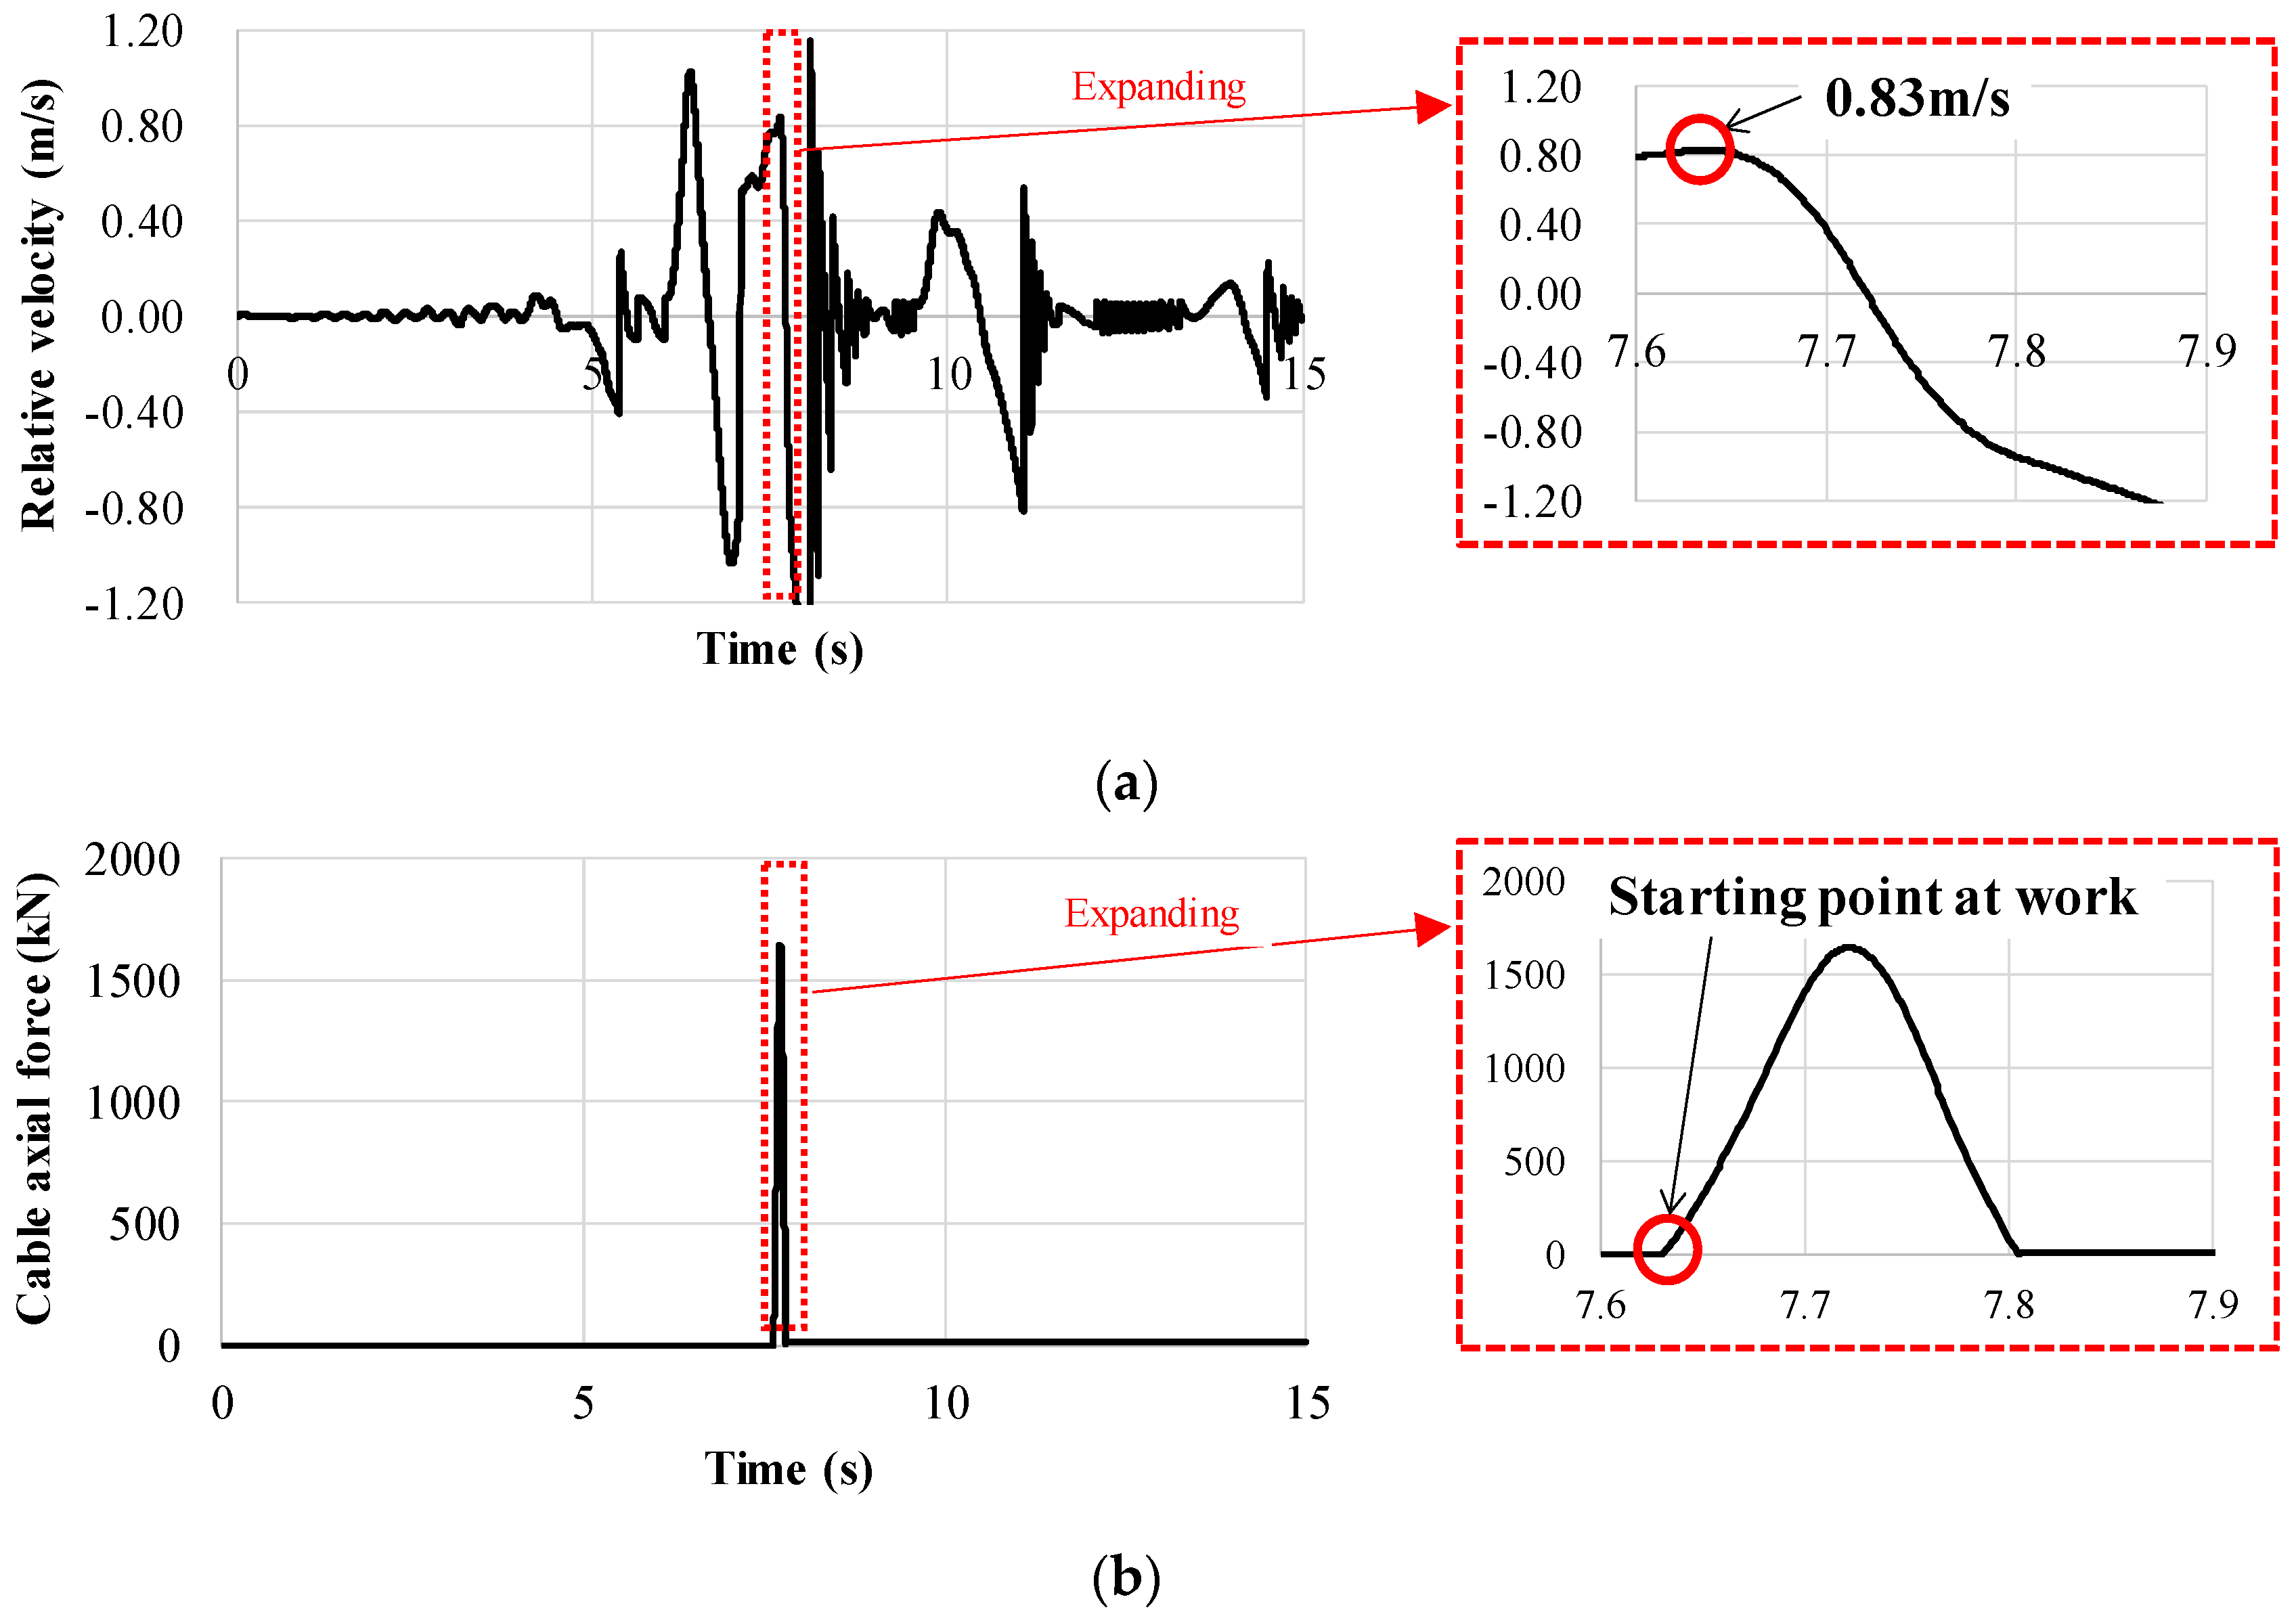
The adequacy of the quasi-optimal solution selected by the proposed design method was verified based on the results of Case 2 (Table 15). Figure 14 shows the time-history response for the X group. The maximum relative velocity between the abutment and the girder when the maximum cable axial force occurred was 0.83 m/s, and the 1900 kN-type cable was selected as the quasi-optimal solution. Further, a single mass-spring model was assumed. In this model, the girder was considered as a mass, and the cable and rubber cushion were considered as spring elements, as shown in Figure 15. After initial velocities of 0.8 m/s and 0.85 m/s were imparted to the single mass-spring model as the initial condition, round-robin calculation was performed to obtain the optimal combination of the cable and rubber cushion to minimize the cable’s axial force. The optimal solution was an 1800 kN-type cable for 0.8 m/s and a 1900 kN-type cable for 0.85 m/s, as presented in Table 16. Therefore, it is considered that the quasi-optimal solution obtained by the proposed design method is the same as the optimal solution obtained by round-robin calculation.

5. Conclusions

The results of the seismic response analysis, which was conducted to confirm the working condition of the bridge restrainer, show that the bridge restrainer did not work when assuming the breaking of all fixed supports. Further, the cases wherein the bridge restrainer worked were identified by considering breaking of the pier base as an unexpected situation in bridge design, which was reported to be a largely influential factor. Furthermore, there is a risk of bridge collapse when the bridge restrainer is installed between girders, even though the relative displacement between the superstructure and substructure does not reach the working gap of the bridge restrainer. However, the bridge restrainer could prevent bridge collapse when it is installed between the pier and the girder, although the working load exceeded the allowable design load. Some findings obtained from this study are as follows:
  • In the existing Japanese design of bridge restrainers, the design load is determined only by using the uniform dead reaction load of the bridge, regardless of the setting location. However, in view of the dynamic influence of a massive earthquake, there is the potential for a large cable reaction force that exceeds the design load, and the actual load changes significantly in each setting position. Therefore, it is believed that the design of the bridge restrainer plays a central role in the fail-safe system.
  • This paper proposes a reasonable design method for bridge restrainers that employ seismic response analysis to determine the design load and the SGA for obtaining the optimal construction member. The results of a trial design using the proposed method indicate that the combination of members selected as the quasi-optimal solution differed according to the assumed unexpected situation and the applicable object function. Therefore, the designer should thoroughly examine the assumed condition of the target bridge.
  • The validity of the quasi-optimal solution obtained from the results of the trial design was proven because the obtained quasi-optimal solution agreed with the optimal solution obtained by a round-robin simulation employing the single-mass model.
This paper deals only with the basic specifications of steel girders. Therefore, reliability improvement is necessary, and the applicability of the proposed method should be verified by conducting more trial designs for various types of bridges. By doing so, it is thought that the merits of this method, using GA, will become more apparent.

Author Contributions

Conceptualization, H.T. and Y.Y.; methodology, Y.Y.; software, C.L.; validation, H.T., Y.Y. and C.L.; formal analysis, Y.Y.; investigation, Y.Y.; writing—original draft preparation, Y.Y.; writing—review and editing, H.T.; visualization, Y.Y.; supervision, H.T.; project administration, H.T. All authors have read and agreed to the published version of the manuscript.

Funding

This research received no external funding.

Conflicts of Interest

The authors declare no conflict of interest.

References

  1. Japan Road Association. Specifications for Highway Bridges, 1996; Volume V.
  2. Japan Road Association. Specifications for Highway Bridges, 2012; Volume V.
  3. Wright, T.; DesRoches, R.; Padgett, J.E. Bridge seismic retrofitting practices in the central and southeastern United States. J. Bridge Eng. 2011, 16, 82–92. [Google Scholar] [CrossRef] [Green Version]
  4. Sakai, J.; Unjoh, S.; Hoshikuma, J.I. Analytical Investigation on ME Chanism of Deck Unseating under Extreme Earthquake and Effects of Unseating Prevention Devices on Seis MIC Behavior of Bridges. JSCSE 2011, 67, 55–71. [Google Scholar] [CrossRef]
  5. Moriyama, T.; Yoda, T. Experimental study on the effect of pounding between the adjacent girders on the falling girders. Doboku Gakkai Ronbunshu 2000, 2000, 223–232. [Google Scholar] [CrossRef] [Green Version]
  6. Nakao, H.; Izuno, K. Design and installation method of unseating prevention cable with shock absorber. J. JSCE 2015, 28, 64. [Google Scholar]
  7. Padgett, J.E.; DesRoches, R. Three-dimensional nonlinear seismic performance evaluation of retrofit measures for typical steel girder bridges. Eng. Struct. 2008, 30, 1869–1878. [Google Scholar] [CrossRef]
  8. Julian, F.D.R.; Hayashikawa, T.; Obata, T. Seismic performance of isolated curved steel viaducts equipped with deck unseating prevention cable restrainers. J. Constr. Steel Res. 2007, 63, 237–253. [Google Scholar] [CrossRef]
  9. Won, J.H.; Mha, H.S.; Cho, K.I.; Kim, S.H. Effects of the restrainer upon bridge motions under seismic excitations. Eng. Struct. 2008, 30, 3532–3544. [Google Scholar] [CrossRef]
  10. DesRoches, R.; Fenves, G.L. Design of seismic cable hinge restrainers for bridges. J. Struct. Eng. 2000, 126, 500–509. [Google Scholar] [CrossRef]
  11. Yuki, Y.; Tamai, H.; Wada, N.; Sonoda, Y.; Kasugai, T. Fundamental Study on the Shock Cushioning Characteristics of a Novel pin-Fixed Aseismatic Connector for Bridges. In Applied Mechanics and Materials; Trans Tech Publications Ltd.: Freienbach, Switzerland, 2014; pp. 637–642. [Google Scholar]
  12. Tamai, H.; Uno, M.; Yuki, Y.; Sonoda, Y.; Kasugai, T. A Study on the Effectiveness of Energy Absorbing Rubber in Pin-Fixed Cable Restrainer of a Bridge. Int. J. Prot. Struct. 2014, 5, 219–238. [Google Scholar] [CrossRef]
  13. Yuki, Y.; Tamai, H.; Wada, N.; Sonoda, Y.; Kasugai, T. Fundamental experiment of shape and confining effect on rubber pieces’ cushioning characteristics. Struct. Eng. 2015, 61A, 313–321. [Google Scholar]
  14. Yuki, Y.; Tamai, H.; Wada, N.; Sonoda, Y.; Kasugai, T. Analytical Study for Evaluation of Dynamic Response of Rubber Cushion in Bridge Restrainers. Struct. Eng. 2016, 62A, 341–350. [Google Scholar]
  15. Yuki, Y.; Tamai, H. Estimation of maximum load on bridge restrainers by weight-drop tests with large size weight. Steel Constr. Eng. 2016, 23, 105–115. [Google Scholar]
  16. Whitley, D.A. Genetic Algorithm Tutorial. Stat. Comput. 1994, 4, 65–85. [Google Scholar] [CrossRef]
  17. Arimura, M.; Tamura, T. Genetic algorithms in the infrastructure planning: Optimization and adaptive learning. Proc. JSCE D 2015, 62, 505–518. [Google Scholar] [CrossRef] [Green Version]
  18. Katsuki, S.; Nagaya, H.; Satoh, H.; Suwa, M. An Application of Genetic Algorithm Using Sub-Objective Optimal Elite Operation for Interactive Structural Optimal Design. Doboku Gakkai Ronbunshu 2001, 2001, 143–161. [Google Scholar] [CrossRef] [Green Version]
  19. Katsuki, S.; Fukawa, G.; Nagadori, N. An application of genetic algorithm for interactive optimal design method of truss structure. Struct. Saf. Reliab. Icossar’01 2001, 154. [Google Scholar]
  20. Tei, K.; Nakamura, H.; Miyamoto, A.; Fujiwara, M. Application Of Genetic Algorithm-Based Relay Search Method For Structure Design-Strengthening Problem. Doboku Gakkai Ronbunshu 1999, 1999, 149–164. [Google Scholar] [CrossRef] [Green Version]
  21. Emoto, H.; Nakamura, H.; Miyamoto, A. Development of impact resistance design support system for RC slabs by genetic algorithms. J. Struct. Eng. A 1999, 45, 453–464. [Google Scholar]
  22. ARK Information Systems Inc. TDAP III (Time Domain 3-Dimensional Dynamic Analysis Program), Version 3.01 Theoretical Manual; ARK Information Systems Inc.: Tokyo, Japan, 2008. [Google Scholar]
  23. Sadjadi, F. Comparison of fitness scaling functions in genetic algorithms with applications to optical processing. In Optical Information Systems II; International Society for Optics and Photonics: Bellingham, WA, USA, 2004; pp. 356–364. [Google Scholar]
  24. Lin, W.Y.; Lee, W.Y.; Hong, T.P. Adapting crossover and mutation rates in genetic algorithms. J. Inf. Sci. Eng. 2003, 19, 889–903. [Google Scholar]
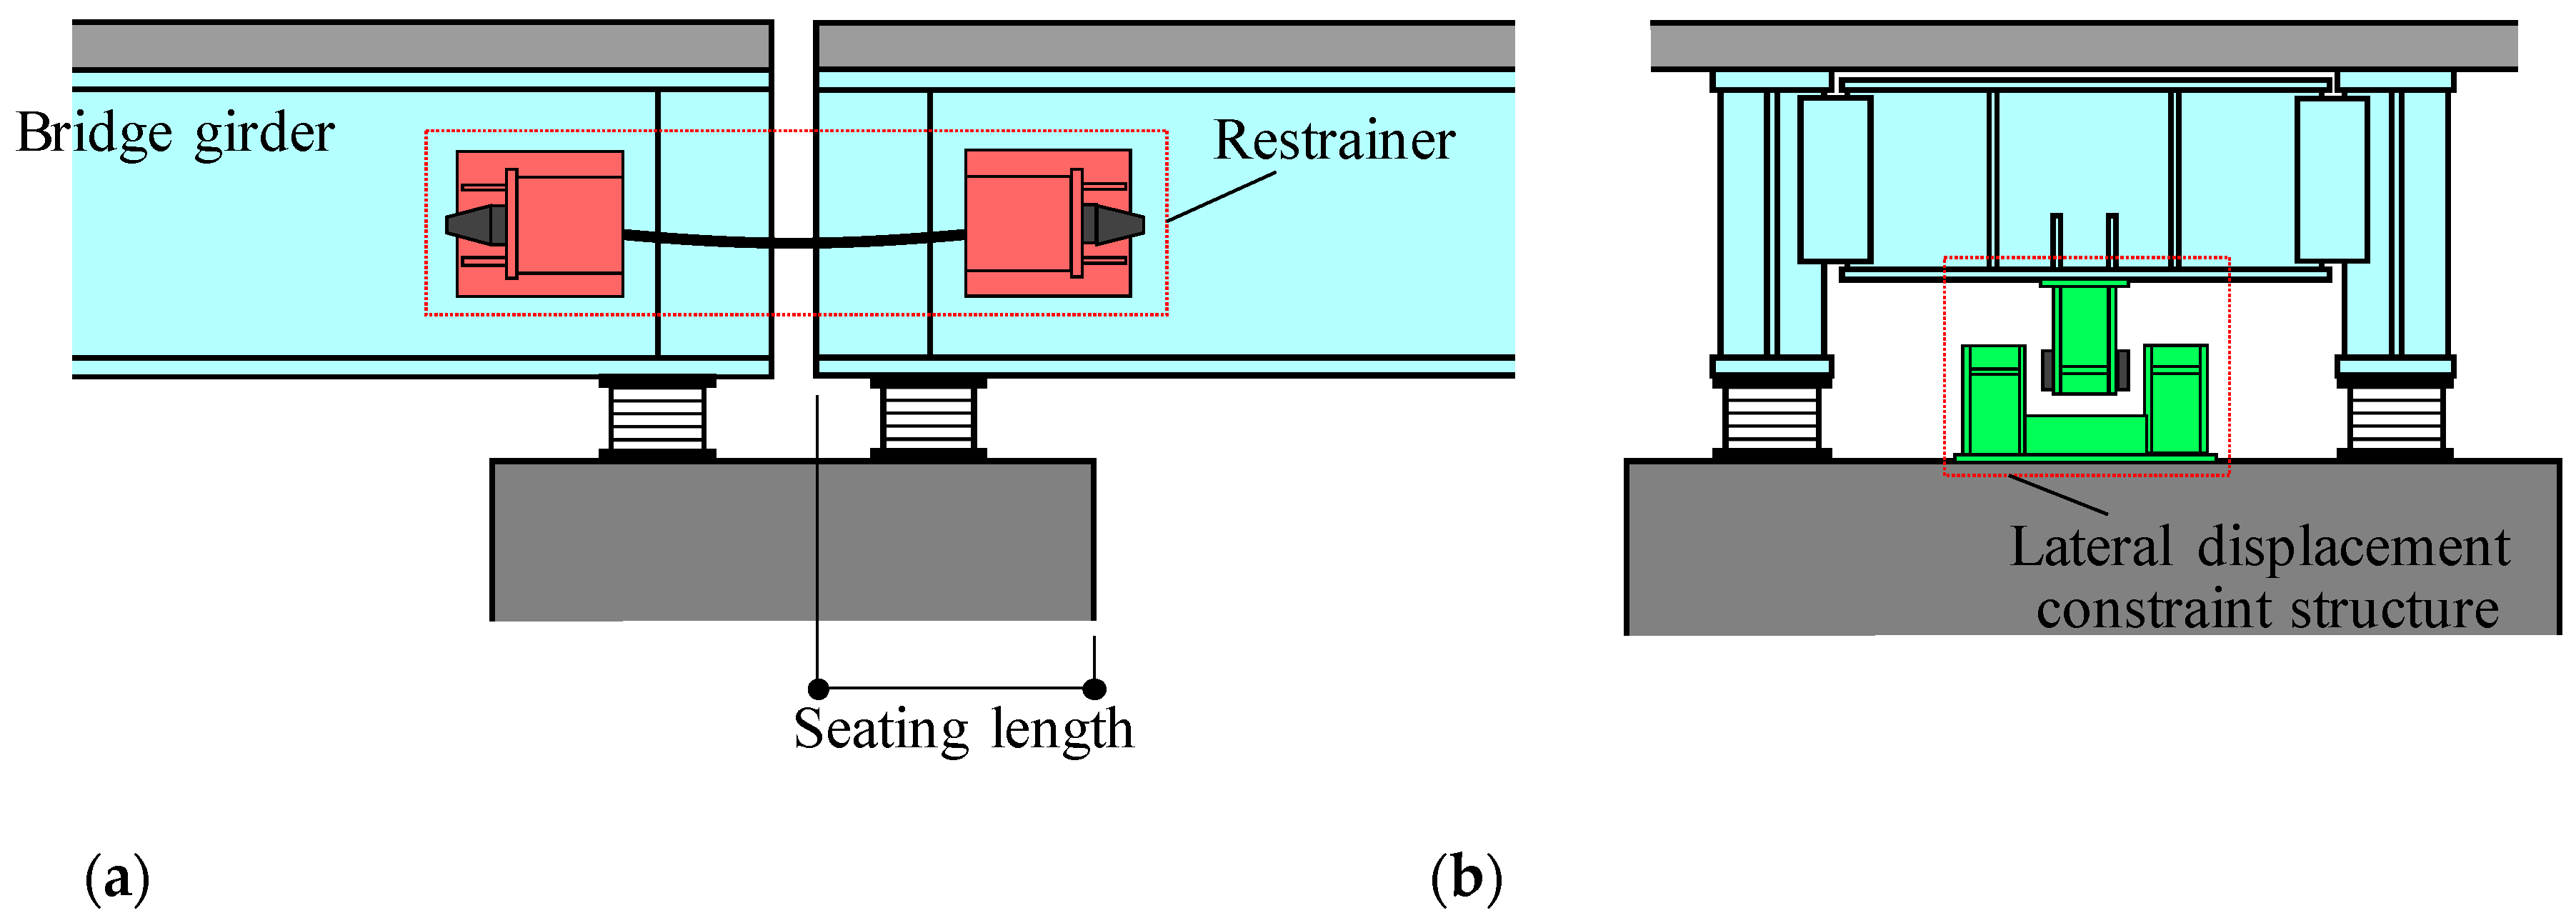
Figure 1. Bridge unseating prevention device (a) for the bridge’s axis direction and (b) for the bridge’s lateral axis direction.
Applsci 10 06847 g001
Figure 2. Installation status of cable-type bridge restrainers (a) for connecting the girder and abutment and (b) for connecting the girders to each other.
Applsci 10 06847 g002
Figure 3. General drawing of a target bridge. (a) Side view; (b) cross-section view; and (c) pier view.
Applsci 10 06847 g003
Figure 4. Analysis model. (a) Overall model diagram and (b) detail of each part.
Applsci 10 06847 g004
Figure 5. M-φ model adopted for the beam model of a pier.
Applsci 10 06847 g005
Figure 6. Collision spring model and cable spring model.
Applsci 10 06847 g006
Figure 7. Friction spring model between superstructure and substructure.
Applsci 10 06847 g007
Figure 8. Input earthquake motion. (a) Wave 1; (b) wave 2; and (c) wave 3.
Applsci 10 06847 g008
Figure 9. Unexpected situation adopted for analysis cases.
Applsci 10 06847 g009
Figure 10. Focusing position of relative displacement.
Applsci 10 06847 g010
Figure 11. Proposed design flow diagram of a bridge restrainer.
Applsci 10 06847 g011
Figure 12. Target bridge for trial design.
Applsci 10 06847 g012
Figure 13. Analysis model for trial design.
Applsci 10 06847 g013
Figure 14. Time history response in the X group. (a) The relative velocity between the abutment and the girder and (b) the cable’s axial force.
Applsci 10 06847 g014
Figure 15. Single mass-spring model.
Applsci 10 06847 g015
Table 1. Specifications of beam elements.
PartCross-Section
A (m2)
Sectional Secondary Moment
Iy (m4)
Weight
(kN)
Elastic Coefficient
(N/mm2)
Elastic Shear Modulus
(N/mm2)
Girder0.600.1214600200,00077,000
PierUpper8.552.005200026,50011,500
Middle8.552.420
Low8.552.977
Rigid Member10001000---
Table 2. Specifications of spring elements.
GroundGirder-Collision
Spring Constant
(kN/m)
Friction Force
Pf (kN)
Horizontal-Direction
Spring Constant
(kN/m)
Rotation-Direction
Spring Constant
(kN·m/rad)
3,300,00075,000,00013,714,286115
Table 3. Structural damping.
SuperstructureSubstructureGround
Steel Girder (Linear)Pier (Linear)Pier (Non-linear)
0.020.050.020.02
Table 4. Specifications of the bridge restrainer cable.
Cable TypeYield Load (kN)Length (m)Spring Constant (kN/m)
1000-kN-type8882277,400
Table 5. Base data of the analysis model.
Girder Gap
(mm)
Working Gap of the Bridge Restrainer (m)Friction Coefficient between the Superstructure and SubstructurePounding of Bridge Girders and Abutment
800.75 × Se (=0.654)0.05Existence
Table 6. Survey results on the actual working gap of the bridge restrainer.
No.Bridge TypeBridge Length
(m)
Span Length
L (m)
Minimum Seat Length
Se = 0.7 + 0.005L
(mm)
Actual Working Gap
(mm)
Actual Design Displacement Coefficient
Cf
1Single-Span Non-compositional Box Girder68.56910433500.34
2Single-Span Box Girder with a Steel Plate Deck67.06710353000.29
32-Span Continuous Rationalized Plate Girder78.5479343000.32
78.5539663000.31
42-Span Continuous Box Girder71.0419053000.33
71.0308503000.35
56-Span Continuous Rationalized Plate Girder222.0368813010.34
63-Span Continuous Narrow Box Girder185.7579852500.25
73-Span Continuous Rationalized Plate Girder128.2328612000.23
88-Span Continuous Non-compositional Narrow Box Girder392.6348693000.35
392.6439143000.33
93-Span Continuous Non-compositional Plate Girder94.9258253200.39
94.9358753200.37
102-Span Continuous Plate Girder with Steel Plate Deck48.1248201500.18
1112-Span Continuous Rationalized Plate Girder534.5439163000.33
534.5469313000.32
122-Span Continuous Rationalized Plate Girder62.0318553000.35
13Through-Type Trussed Langer Girder116.411612823000.23
142-Span Continuous Non-compositional Box Girder64.4419063000.33
64.4238163000.37
153-Span Continuous Plate Girder154.0549701900.20
Table 7. Anaysis results of the verification.
Case
No.
Location of Bridge Restrainer
Setting
Wave TypeAssuming the Breaking of the Pier Base?Working
Gap
Assuming the Breaking of the Fixed Support?Upper Line: Maximum Load/Yield Load
Lower Line: Maximum Displacement in Working Direction (m)
1A2G3G4A1P2P3P4P
1Girder
To
Girder
1No0.75
×
Se
No-
0.032
-
0.101
-
0.046
-
0.087
-
0.046
-
0
-
0.114
-
0
2-
0.037
-
0.092
-
0.057
-
0.096
-
0.054
-
0
-
0.124
-
0
3-
0.044
-
0.060
-
0.015
-
0.105
-
0.056
-
0
-
0.084
-
0
Girder
to
Pier
1-
0.032
--
0.087
-
0.046
-
0
-
0.114
-
0
2-
0.037
-
0.096
-
0.054
-
0
-
0.124
-
0
3-
0.044
-
0.105
-
0.056
-
0
-
0.084
-
0
2Girder
to
Girder
1No0.75
×
Se
Yes-
0.260
-
0.068
-
0.068
-
0.252
-
0.086
-
0.174
-
0.165
-
0.087
2-
0.262
-
0.067
-
0.009
-
0.259
-
0.089
-
0.182
-
0.174
-
0.091
3-
0.255
-
0.072
-
0.002
-
0.280
-
0.093
-
0.169
-
0.186
-
0.087
Girder
to
Pier
1-
0.260
--
0.252
-
0.086
-
0.174
-
0.165
-
0.087
2-
0.262
-
0.259
-
0.089
-
0.182
-
0.174
-
0.091
3-
0.255
-
0.280
-
0.093
-
0.169
-
0.186
-
0.087
3Girder
to
Girder
1Yes0.75
×
Se
Yes-
0.263
-
0.112
-
0.074
-
0.250
-
0.620
-
0.381
-
0.886
-
0.337
2-
0.255
-
0.063
-
0.007
-
0.269
-
0.646
-
0.201
-
0.727
-
0.193
3-
0.276
-
0.038
-
0.156
-
0.244
-
0.200
-
0.760
-
0.199
-
0.598
Girder
to
Pier
1-
0.263
--
0.250
-
0.294
-
0.381
-
0.375
-
0.337
2-
0.255
-
0.269
-
0.236
-
0.201
-
0.255
-
0.193
3-
0.262
-
0.244
0.420.690-
0.619
0.140.667-
0.587
4Girder
to
Girder
1No0.3
×
Se
Yes-
0.256
-
0.076
-
0.066
-
0.253
-
0.088
-
0.174
-
0.165
-
0.088
20.25
0.266
-
0.065
-
0.092
-
0.255
-
0.089
-
0.183
-
0.171
-
0.093
3-
0.255
-
0.072
-
0.022
0.24
0.266
-
0.090
-
0.171
-
0.179
-
0.086
Girder
to
Pier
1-
0.256
--
0.253
-
0.088
-
0.174
-
0.165
-
0.088
20.25
0.266
-
0.255
-
0.089
-
0.183
-
0.171
-
0.093
3-
0.255
0.24
0.266
-
0.090
-
0.171
-
0.179
-
0.086
5Girder
to
Girder
1Yes0.3
×
Se
Yes0.06
0.263
-
0.034
-
0.055
-
0.254
-
0.670
-
0.338
-
0.642
-
0.304
2-
0.261
-
0.060
-
0.035
0.42
0.269
-
0.638
-
0.225
-
0.764
-
0.163
30.10
0.264
-
0.041
-
0.083
-
0.248
-
0.138
-
0.815
-
0.210
-
0.691
Girder
to
Pier
10.68
0.273
--
0.255
1.5
0.286
0.50
0.270
1.27
0.282
0.36
0.268
2-
0.261
-
0.252
1.08
0.279
1.13
0.280
1.38
0.284
0.87
0.276
30.31
0.267
-
0.251
0.86
0.276
1.08
0.279
1.06
0.279
1.33
0.283
Yellow cells indicate the collapse of a bridge.
Blue cells show working bridge restrainers.
N.Red values indicate a load that exceeds the design load.
Table 8. Genetic element data.
CableStrength TypeCodeRubber
Cushion
Cross-Section Area (mm × mm)Code
180 kN0000100 × 1000000
260 kN0001150 × 1500001
390 kN0010200 × 2000010
570 kN0011250 × 2500011
730 kN0100300 × 3000100
1000 kN0101350 × 3500101
1300 kN0110400 × 4000110
1500 kN0111450 × 4500111
1800 kN1000500 × 5001000
1900 kN1001550 × 5501001
2300 kN1010Thickness (mm)Code
2700 kN10112000
3200 kN11003001
3400 kN11014010
4000 kN11105011
4600 kN1111Hardness (°)Code
4500
5501
6510
Table 9. Structure of the genetic cord.
CableRubber Cushion
Type
(Including Yield Strength and Cross-Sectional Area)
ThicknessCross-Sectional AreaHardness
0 0 0 00 00 0 0 00 0
Table 10. Weight coefficient.
Stress RangeWeight Coefficient, ω
0.0 ≦ σ/σy < 0.10.1
0.1 ≦ σ/σy < 0.30.3
0.3 ≦ σ/σy < 0.50.5
0.5 ≦ σ/σy < 0.70.7
0.7 ≦ σ/σy < 0.90.9
0.9 ≤ σ/σy < 1.01.0
Table 11. Formulated non-linear spring elements for the rubber cushion.
Characteristics of Spring Element P ( d ) = c h × c A × f t ( d )
Basic Characteristics of Spring Element in Each Thickness t (Load-Displacement Relationship) f t ( d ) f 20 m m ( d ) = 5.22 × 10 2 d 4 3.86 × 10 1 d 3 + 2.55 d 2 + 5.01 d
f 30 m m ( d ) = 8.60 × 10 3 d 4 1.14 × 10 1 d 3 + 7.88 × 10 1 d 2 + 2.13 d
f 40 m m ( d ) = 1.50 × 10 3 d 4 2.58 × 10 2 d 3 + 2.36 × 10 1 d 2 + 1.50 d
f 50 m m ( d ) = 5.60 × 10 4 d 4 1.50 × 10 2 d 3 + 1.80 × 10 1 d 2 + 8.45 × 10 1 d
Coefficient about Hardeness c h Hardness 45 (degree)Hardness 55 (degree)Hardness 65 (degree)
0.5021.0001.410
Coefficient about Cross-Section Area c A c A = 2.60 × 10 9 A 2 + 7.43 × 10 5 A
Table 12. Analysis cases.
CaseInput Earthquake WaveAssumued SituationObject Function
Fixed-Support ConditionPier Base ConditionPounding of Bridge Girders
Case 1wave1BreakingBreakingExistsG1, G2
Case 2GoodIgnoreG2
Table 13. Result of suboptimal solution by proposed design method (Case 1, Object function G1).
RankCableX-GroupCableY-GroupEvaluated Value by G1
Cushioning RubberCushioning Rubber
Typeσ/σyHardness
(º)
Thickness
(mm)
Cross-Sectional Area
(mm × mm)
Typeσ/σyHardness
(º)
Thickness
(mm)
Cross-Sectional Area
(mm × mm)
1-----1800 kN0.924550400 × 4000.033
2-----1800 kN0.995550400 × 4000.033
3-----2700 kN0.865550500 × 5000.030
4-----1900 kN0.865550300 × 3000.032
5-----2700 kN0.935540500 × 5000.037
6-----2300 kN0.915550450 × 4500.037
7-----2300 kN0.995550500 × 5000.038
8-----2700 kN0.926550500 × 5000.038
9-----1800 kN0.964550450 × 4500.038
10-----1900 kN0.955550400 × 4000.038
Table 14. Result of suboptimal solution by proposed design method (Case 1, Object function G2).
RankCableX-GroupCableY-GroupEvaluated Value by G2
Cushioning RubberCushioning Rubber
Typeσ/σyHardness
(º)
Thickness
(mm)
Cross-Sectional Area
(mm × mm)
Typeσ/σyHardness
(º)
Thickness
(mm)
Cross-Sectional Area
(mm × mm)
1-----1800 kN0.854550300 × 3001316
2-----1800 kN0.905550300 × 3001389
3-----1800 kN0.926550300 × 3001419
4-----1900 kN0.865550300 × 3001425
5-----1800 kN0.935550350 × 3501444
6-----1900 kN0.895550350 × 3501474
7-----2300 kN0.765550300 × 3001474
8-----2700 kN0.665550300 × 3001356
9-----1800 kN0.995550400 × 4001359
10-----3200 kN0.576550250 × 2501544
Table 15. Result of suboptimal solution by proposed design method (Case 2).
RankCableX-GroupCableY-GroupEvaluated Value by G2
Cushioning RubberCushioning Rubber
Typeσ/σyHardness
(º)
Thickness
(mm)
Cross-Sectional Area
(mm × mm)
Typeσ/σyHardness
(º)
Thickness
(mm)
Cross-Sectional Area
(mm × mm)
11900 kN0.726550300 × 3002700 kN0.716550300 × 3001662
22300 kN0.736550300 × 3002700 kN0.666550300 × 3001766
33200 kN0.686550300 × 3002700 kN0.706550300 × 3001903
42300 kN0.746550300 × 3004600 kN0.586550300 × 3001913
52700 kN0.686550300 × 3002300 kN0.666550350 × 3501955
63400 kN0.756550300 × 3002700 kN0.666550350 × 3501959
72700 kN0.606550300 × 3002700 kN0.666550300 × 3001988
84000 kN0.776550300 × 3002700 kN0.716550300 × 3002034
92700 kN0.786550300 × 3002700 kN0.715550400 × 4002055
104000 kN0.786550300 × 3001900 kN0.656550250 × 2502123
Table 16. Results of optimal solution by the single mass-spring model.
Initial Velocity
(m/s)
Cable TypeRubber Cushion
Hardness
(°)
Thickness
(mm)
Cross-Sectional Area
(mm × mm)
0.801800 kN-type5550250 × 250
0.851900 kN-type5550250 × 250